Article

Synthesis and Properties of a Red Na5Zn2Gd1−x(MoO4)6: xEu3+ Phosphor

1
School of Mining and Chemistry & Chemical Engineering, Hulunbuir University, Hulunbuir 021008, China
2
School of Chemistry and Environmental Engineering, Changchun University of Science and Technology, Changchun 130022, China
3
College of Chemistry and Environmental Science, Inner Mongolia Normal University, Hohhot 010022, China
*
Author to whom correspondence should be addressed.
Crystals 2024, 14(11), 933; https://doi.org/10.3390/cryst14110933
Submission received: 9 October 2024 / Revised: 21 October 2024 / Accepted: 26 October 2024 / Published: 29 October 2024
(This article belongs to the Special Issue Optical Properties of Crystalline Semiconductors and Nanomaterials)

Abstract

:
Novel Eu3+-doped Na5Zn2Gd(MoO4)6 triple molybdate phosphors were fabricated by the sol-gel method. The structure, morphology, and luminescent properties have been characterized by X-ray diffraction (XRD), thermogravimetric differential thermal analysis (TG-DTA), scanning electron microscopy (SEM), FTIR spectroscopy, and luminescence spectroscopy. The results indicated that the synthesized Na5Zn2Gd1−x(MoO4)6: xEu3+ phosphor consisted of a pure phase with monoclinic structure. Under excitation at 465 nm, the Na5Zn2Gd1−x(MoO4)6: xEu3+ phosphor exhibits an intensive red emission band around 610 nm corresponding to the transition of 5D07F2 which is much higher than that 5D07F1 at 594 nm, which was appropriate for a blue LED. According to the influence of the synthesis conditions, the phosphors showed the highest emission intensity when the doping concentration of Eu3+ was 25 mol.% and the molar ratio of citric acid to metal ions was 2:1. Na5Zn2Gd0.75(MoO4)6: 0.25 Eu3+ with the color coordinates (x = 0.658, y = 0.341) is a more stable red phosphor for blue-based white LEDs than the commercial Y2O2S: Eu3+ red phosphor (0.48, 0.50) due to its being closer to the NTSC standard values (0.670, 0.330).

1. Introduction

The white light-emitting diode (WLED) has garnered extensive attention due to its merits of high luminous efficiency, long lifetime, and low power consumption and environmental friendliness [1,2]. The red phosphors can be excited by blue and near-ultraviolet in particular. The commercial sulfide phosphors CaS: Eu2+, Y2O2S: Eu3+ show limitations, such as being chemically unstable and having a short lifetime under ultraviolet radiation, thus hindering the development of a highly efficient white LED [3,4,5]. Therefore, more interest is being focused on the search for a stable red phosphor with intense absorption in the near-UV to the blue spectral region [6,7]. With strong physical and chemical stability, molybdates have been investigated as potential red-emitting phosphors. It is widely known that Eu3+, a rare earth ion that generates red light, can be effectively stimulated by blue light and UV light to achieve red emission [8,9,10,11,12]. Molybdates have been widely utilized as host substances for phosphors because of their low phonon energy, remarkable chemical and physical characteristics, excellent thermal stability, and strong charge transfer region in the ultraviolet range [13,14]. Eu3+-doped molybdates are red-emitting phosphors due to the 5D07FJ spin and parity-forbidden transition. Currently, some ternary molybdate compounds have emerged as promising laser materials [15,16,17,18]. Based on relevant studies, the triple molybdates have a layered structure which is tetrahedral, and four O2− ions are positioned in four corners of the tetrahedron [19]. The MoO42− isolated island-like tetrahedron was distributed in the crystal, in which the compounds of divalent ions (such as Zn, Ba, Mg, and Sr) were coordinated by six oxygen atoms, and the O2− ions were from the MoO42− tetrahedral group [20]. The enhanced luminescent properties were achieved in some phosphate-molybdates (such as Na2Gd(PO4)(MoO4)) [21,22]. Therefore, it would be very interesting to investigate the luminescent properties of Eu3+ ion-activated phosphate-molybdates. In this work, a new kind of triple molybdate compound Na5Zn2Gd1−x(MoO4)6: xEu3+ red phosphor with a monoclinic powellite structure was prepared, and its luminescent properties were studied in detail for the first time. We have reported the structure and luminescent properties, including the diffuse reflectance spectra, excitation and emission spectra, life decay curves, and the color purity of Na5Zn2Gd1−x(MoO4)6: xEu3+. The values of the band gap energy of the obtained phosphors (Eg = 2.68–2.70 eV) are smaller compared to the same type of doped phosphors such as CaMoO4: xRE3+ (Eg = 3.84–3.93 eV) [23], with prolonged lifetime and compared with commercial red phosphor Y2O2S: Eu3+ is closer to standard color coordinate values by the color coordinate calculated, indicating that the red phosphor has high color purity.

2. Experimental

2.1. Phosphors Preparation

The red phosphors Na5Zn2Gd1−x(MoO4)6: xEu3+ (x = 0.15, 0.18, 0.20, 0.22, 0.25, 0.28, 0.30, and 0.35) were prepared using citrate method with raw materials of Zn(NO3)2·6H2O (AR), (NH4)6Mo7O24·4H2O (AR), C6H8O7·2H2O (AR), NaOH (AR), Eu2O3 (99.99%), and Gd2O3 (99.99%). The detailed experimental process is similar to that in Refs. [8,9]. Firstly, rare-earth oxides (Eu2O3, Gd2O3) were dissolved in 1:1 HNO3 under vigorous stirring, and the excess HNO3 was removed under heating. Then, a stoichiometric amount of (NH4)6Mo7O24·4H2O, NaOH, and Zn(NO3)2 solution was obtained by dissolving in deionized water. Subsequently, the corresponding amounts of Gd(NO3)3 and Eu(NO3)3 solutions (depending on the ratio x) were added to the Zn(NO3)2 solution and mixed thoroughly. Then, citric acid was dissolved in a round-bottomed flask. In another vessel, NaOH was added to the (NH4)6Mo7O24·4H2O solution, stirred to dissolve it, and then poured into a round-bottom flask and stirred uniformly. After adjusting the pH of the solution to between 7 and 8 (resulting in white precipitate), it was maintained at 60 °C for 4 h. The resulting sample was placed in a drying oven at 120 °C for 10 h. As the water gradually evaporated, a brown powder precursor was obtained. Finally, it was calcined in a furnace at 800 °C for 2 h, and then cooled; white powders of the Na5Zn2Gd(MoO4)6: Eu3+ were synthesized.

2.2. Characterizations

X-ray powder diffraction (XRD) of the samples was implemented by means of a Bruker D8-Advance diffractometer (BrukeR, Hong Kong, China). The crystallization procedures of the complex precursors were explored through thermogravimetric differential thermal analysis (TG-DTA, DTG-6OH, Harriet Island ferry). A heating rate of 10 °C/min was utilized in an air atmosphere. The infrared spectrum was measured on a Nicolet-6700 Fourier transform infrared spectrometer (Thermo Fisher Scientific, Beijing, China)with KBr pellets. The morphology characteristics of the samples were determined by Japan’s Hitachi S-3400N scanning electron microscopy (Hitachi, Tokyo, Japan). The UV–vis diffuse reflectance spectra were recorded by a Shimadzu (UV-2550, Hitachi, Tokyo, Japan) near-infrared UV–visible spectrophotometer. The luminescent properties of the samples were assessed using a Japanese Hitachi F-4500 fluorescence spectrometer (Hitachi, Tokyo, Japan) equipped with a 150 W-Xenon lamp. The working voltage was set at 400 V, and the scan rate was 1200 nm/min. The excitation and emission slits were set at 2.5 nm. The luminescence decay curves were measured by an Edinburgh FLS1000 spectrometer (Edinburgh Instruments Ltd., Livingston, UK) equipped with a pulsed Xenon lamp as the excitation source. All the measurements were conduced at room temperature.

3. Results and Discussion

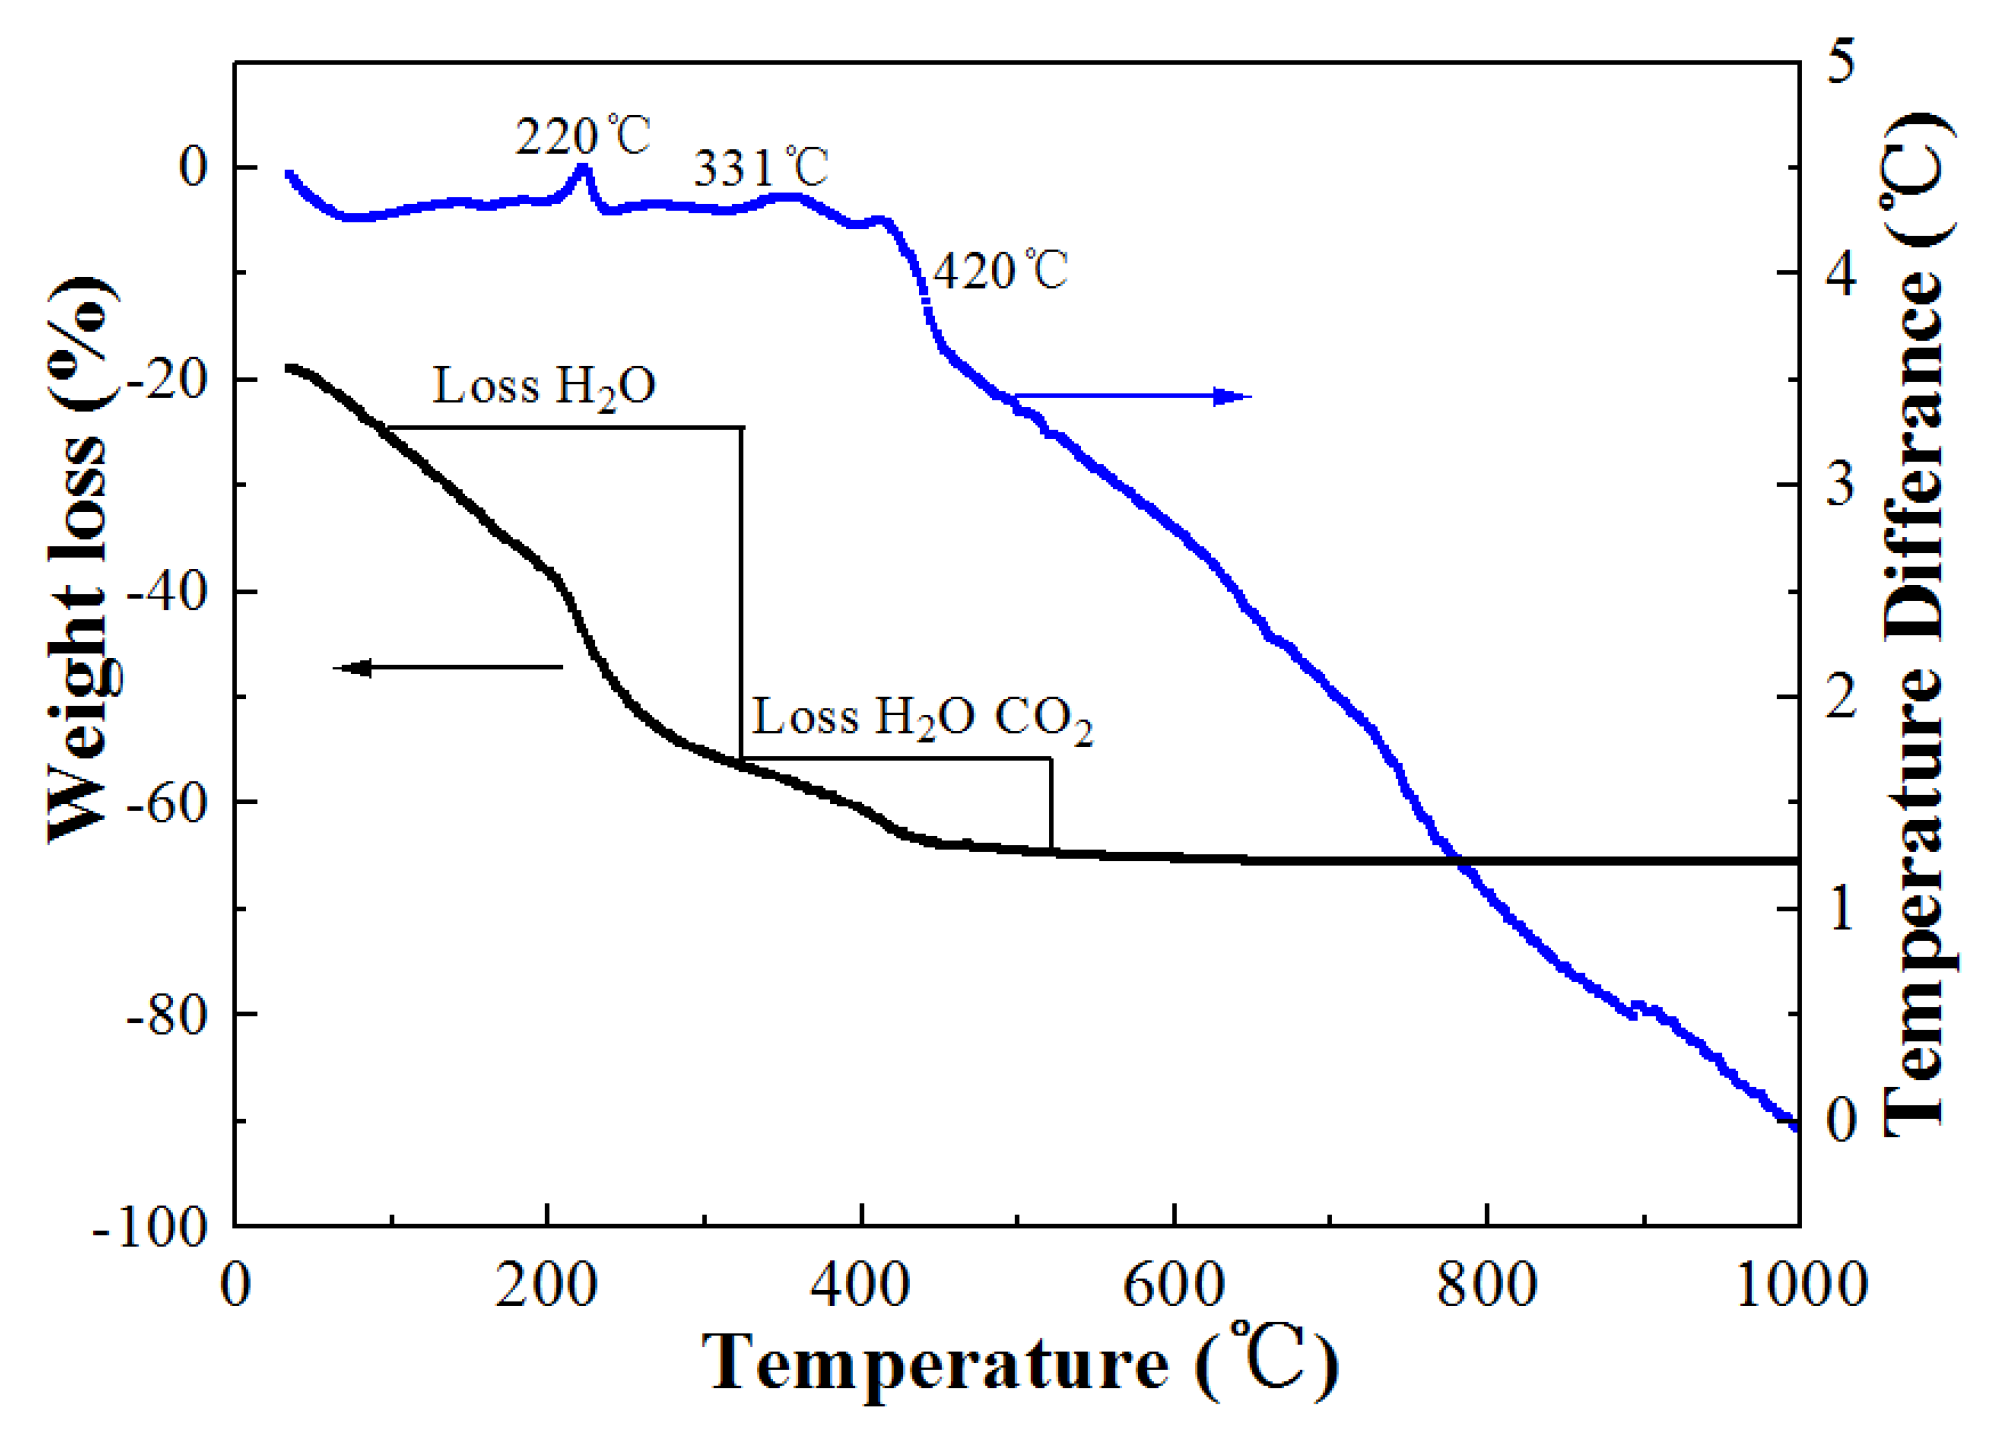
3.1. TG-DTA Analysis of Na5Zn2Gd1−x(MoO4)6: xEu3+

To choose the best thermal decomposition temperature for the samples, the TG-DTA curves of the Na5Zn2Gd(MoO4)6: Eu3+ precursor were studied, as shown in Figure 1. The TG curve shows two distinct weight loss steps up to 500 °C. No further weight loss is observed between 500 and 1000 °C. The weight loss is associated with the decomposition of the organic matrix. The DTA curve consist of three exothermic peaks at 220, 331, 420 °C. The peaks at 220 and 331 °C imply that the thermal occurrences could be related to the depletion of organic species, surface absorbed water, and citric acid. The third exothermic peak at 420 °C is attributed to the crystallization of Na5Zn2Gd (MoO4)6 powder from the amorphous component. However, the particle size distribution of the sample was more uniform at 800 °C than at other thermal decomposition temperatures.

3.2. Structure and Morphology of Na5Zn2Gd1−x(MoO4)6: x Eu3+

Figure 2a shows the XRD patterns of Na5Zn2Gd1−x(MoO4)6: xEu3+ (x = 0.0, 0.25) annealed at 800 °C. All of the diffraction peaks are highly consistent with the standard data of Na2.2Zn0.9(MoO4)2 (JCPDS NO. 49-0898) and no extra peaks originating from any impurities are observed, suggesting that all the phosphors exhibit a monoclinic powellite structure (C2/c) of Na2.2Zn0.9(MoO4)2. The doping of Eu3+ does not have an impact on the crystal structure of the host matrix. Additionally, with the change in the x value the lattice parameters are increased slightly due to the ionic radii of Eu3+ (0.95 Å) being very close to that of Gd3+ (0.94 Å). The diffraction peak at 2θ = 12.94° is almost invisible caused by the preferred orientation of the sample, which has no crystal growth along the (020) plan orientation. The diffraction peak intensity at 30.28 is significantly weaker than that in the standard card, which may be attributed to the relatively low crystallinity of the Na5Zn2Gd1−x(MoO4)6: xEu3+ and the poor orderliness of the crystal.
The morphology of the Na5Zn2Gd0.75(MoO4)6: 0.25Eu3+ samples annealed at 800 °C was determined using SEM analysis. Figure 2b,c shows the different magnification scanning electron images. It can be seen that the Na5Zn2Gd0.75(MoO4)6: 0.25 Eu3+ samples with a layered monoclinic structure are substantially rectangular, the length being from 1 to 4 μm, and the width between 0.5~1 μm for larger individual particles. Furthermore, VESTA software was used to simulate its unit cells, as shown in Figure 2d. The crystal structure contains MoO42− tetrahedra and (Zn, Gd)O6 octahedra, a three-dimensional structure, and Na atoms in a cavity formed in the polyhedron. The tetracoordination of molybdate connects with the sides of the layer by the oxygen vertex, and (Zn, Gd)O6 octahedra are connected between the common edges. Each layer consists of passing corner-connected GdO6 octahedrons and MoO42− tetrahedra. Adjacent layers connected through ZnO6 octahedra form a Na5Zn2Gd(MoO4)6 scheelite layered structure, which is consistent with the information conveyed by XRD.

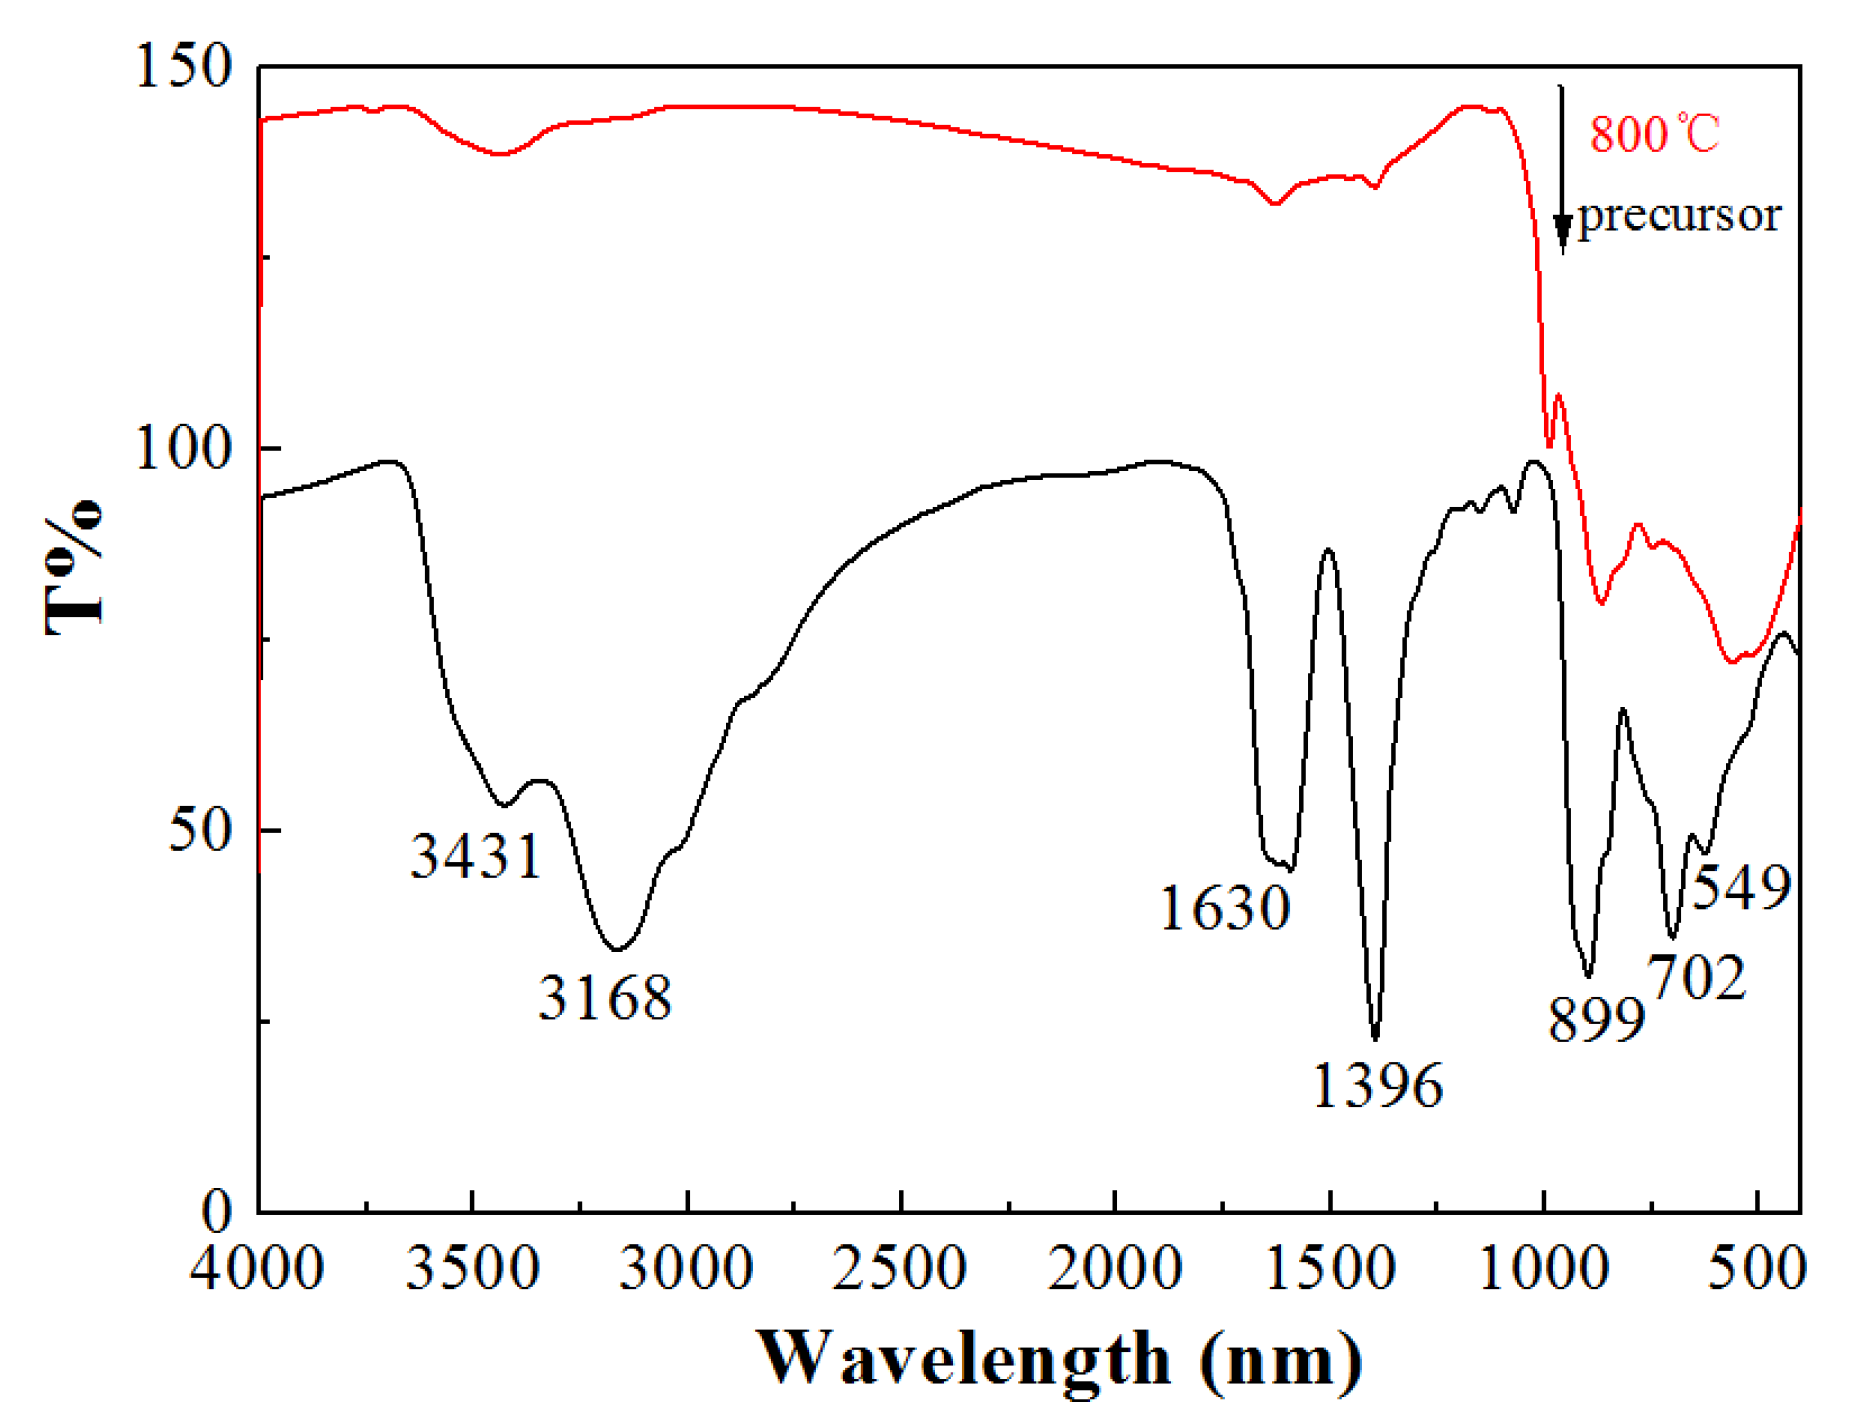
3.3. FTIR Spectra of Na5Zn2Gd0.75(MoO4)6: 0.25 Eu3+

Figure 3 shows the FTIR spectra of Na5Zn2Gd(MoO4)6: Eu3+. For the precursor, the peak at 3431 cm−1 corresponds to the stretching vibration of the -OH group from water and citric acid. The absorption peak at 1396 cm−1 is attributed to the stretching vibration of the C-O bond. The peak at 1630 cm−1 is associated with the -C=O bond. The carbonyl group shows a red shift because of the formation of complex [21]. The absorption peaks of H2O and CO2 decreased significantly after the precursor was sintered at 800 °C for 2 h. The absorption peak of citric acid was almost vanishing. In the case of the calcined samples, a set of strong absorption bands that are in line with the appearance of MoO42− can be detected in the region scanning from 500 to 1000 cm−1. This suggests the formation of Na5Zn2Gd0.75(MoO4)6: 0.25 Eu3+. The absorption peaks at 702, 899, 1000 cm−1 should be ascribed to the bending vibration and asymmetric stretching modes of Mo-O bond asymmetric stretching vibrations of MoO42−, and there is the stretching vibration of the Eu-O bond at 549 cm−1.

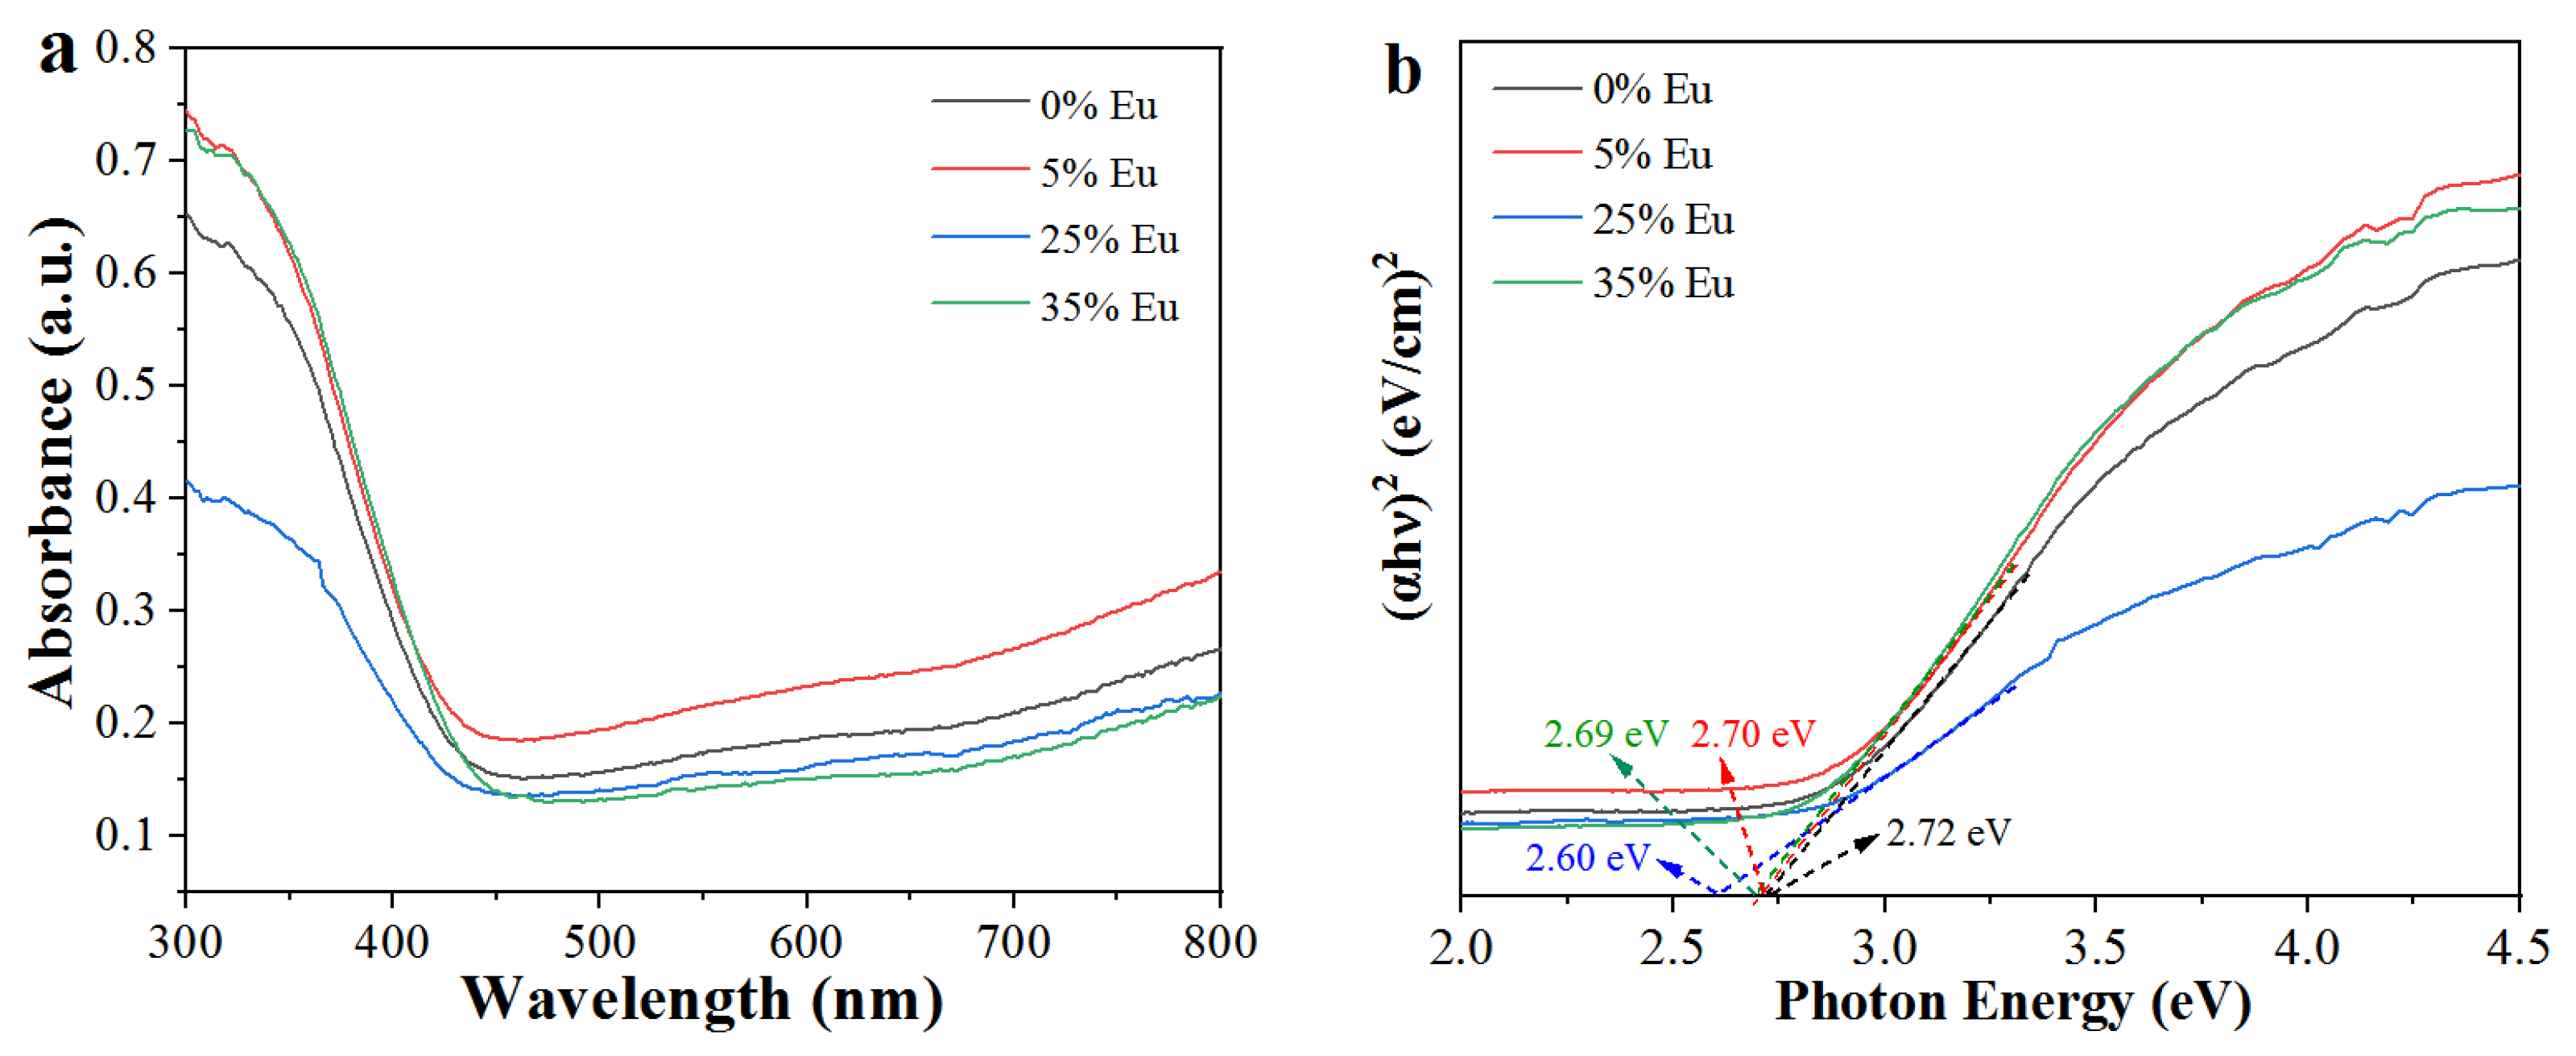
3.4. UV–Vis Diffuse Reflectance Spectra of Na5Zn2Gd1−x(MoO4)6: xEu3+

Figure 4a shows the UV diffuse reflectivity spectra of Na5Zn2Gd1−x(MoO4)6: xEu3+. The absorption edges of Na5Zn2Gd1−x(MoO4)6: xEu3+ (x = 0.00, 0.05, 0.25, 0.35) at different concentrations of Eu3+ are 450, 462, 465, and 465 nm, respectively. With the increasing concentration, a red-shift occurs for the absorption edges, which is attributed to the f-f electronic transitions of Eu3+ ions. Meanwhile, Figure 4b shows the Tauc plots obtained from absorption spectra data, and the band gap value was calculated by the Kubelka–Munk equation [22]. The band gaps of Na5Zn2Gd1−x(MoO4)6: xEu3+ (x=0.00, 0.05, 0.25, 0.35) are 2.72 eV, 2.70, 2.69, and 2.68 eV, respectively. The band gap values are close to the same type of doped phosphors such as BMO: Eu3+-500 (Eg = 2.67 eV) [23]. A smaller band gap value is more conducive to absorbing energy to complete the electronic transition process [24].

3.5. Luminescent Properties of Na5Zn2Gd(MoO4)6: Eu3+

Figure 5 shows the excitation spectrum of the Na5Zn2Gd(MoO4)6: Eu3+ phosphor calcined at 800 °C with the emission wavelength monitored at 614 nm. It is evident that the excitation spectrum comprises a broad band from 250–350 nm, which corresponds to the charge transfer transition from O2− to Eu3+. Additionally, there are narrow excitation peaks from 360 to 500 nm, which are attributed to the intra-configurational f-f transitions of Eu3+ ions [25]. The absorption peaks at 395 nm and 465 nm are attributed to the f-f transitions of Eu3+ ions, corresponding to 7F05L6 and 7F05D2 electronic transitions, respectively. The new triple molybdate Na5Zn2Gd(MoO4)6: Eu3+ can be excited by blue light at 465 nm prepared by the method, indicating that the phosphor matches with the wide output wavelength of the blue LED chip.
The emission spectrum of Na5Zn2Gd(MoO4)6: Eu3+ phosphor is obtained under the excitation wavelength at 465 nm as shown in Figure 6. The emission band is observed at 614 nm, which is the 5D07F2 transition of Eu3+, much higher than at 595 nm (5D07F1); the ratio of intensity I5D0-7F2/I5D0-7F1 is about 10. It indicates that Eu3+ occupies a site or sites without an inversion center, and low symmetry. In addition, another emission peak at 580 nm is attributed to the 5D0-7F0 transition of Eu3+ ions. Therefore, Na5Zn2Gd(MoO4)6: Eu3+ phosphor is a phosphor that is excited by blue light and emits strong red light. The 5D07F1 transition is mainly magnetic allowed (magnetic dipole transition) in the spectra of Eu3+. At the same time, the 5D07F2 is the only center in the absence of inversion symmetry conditions to have low sensitivity to mandatory electric dipole transitions. Thus, Eu3+ was asymmetrically occupied in the Na5Zn2Gd(MoO4)6 lattice sites [26,27,28].

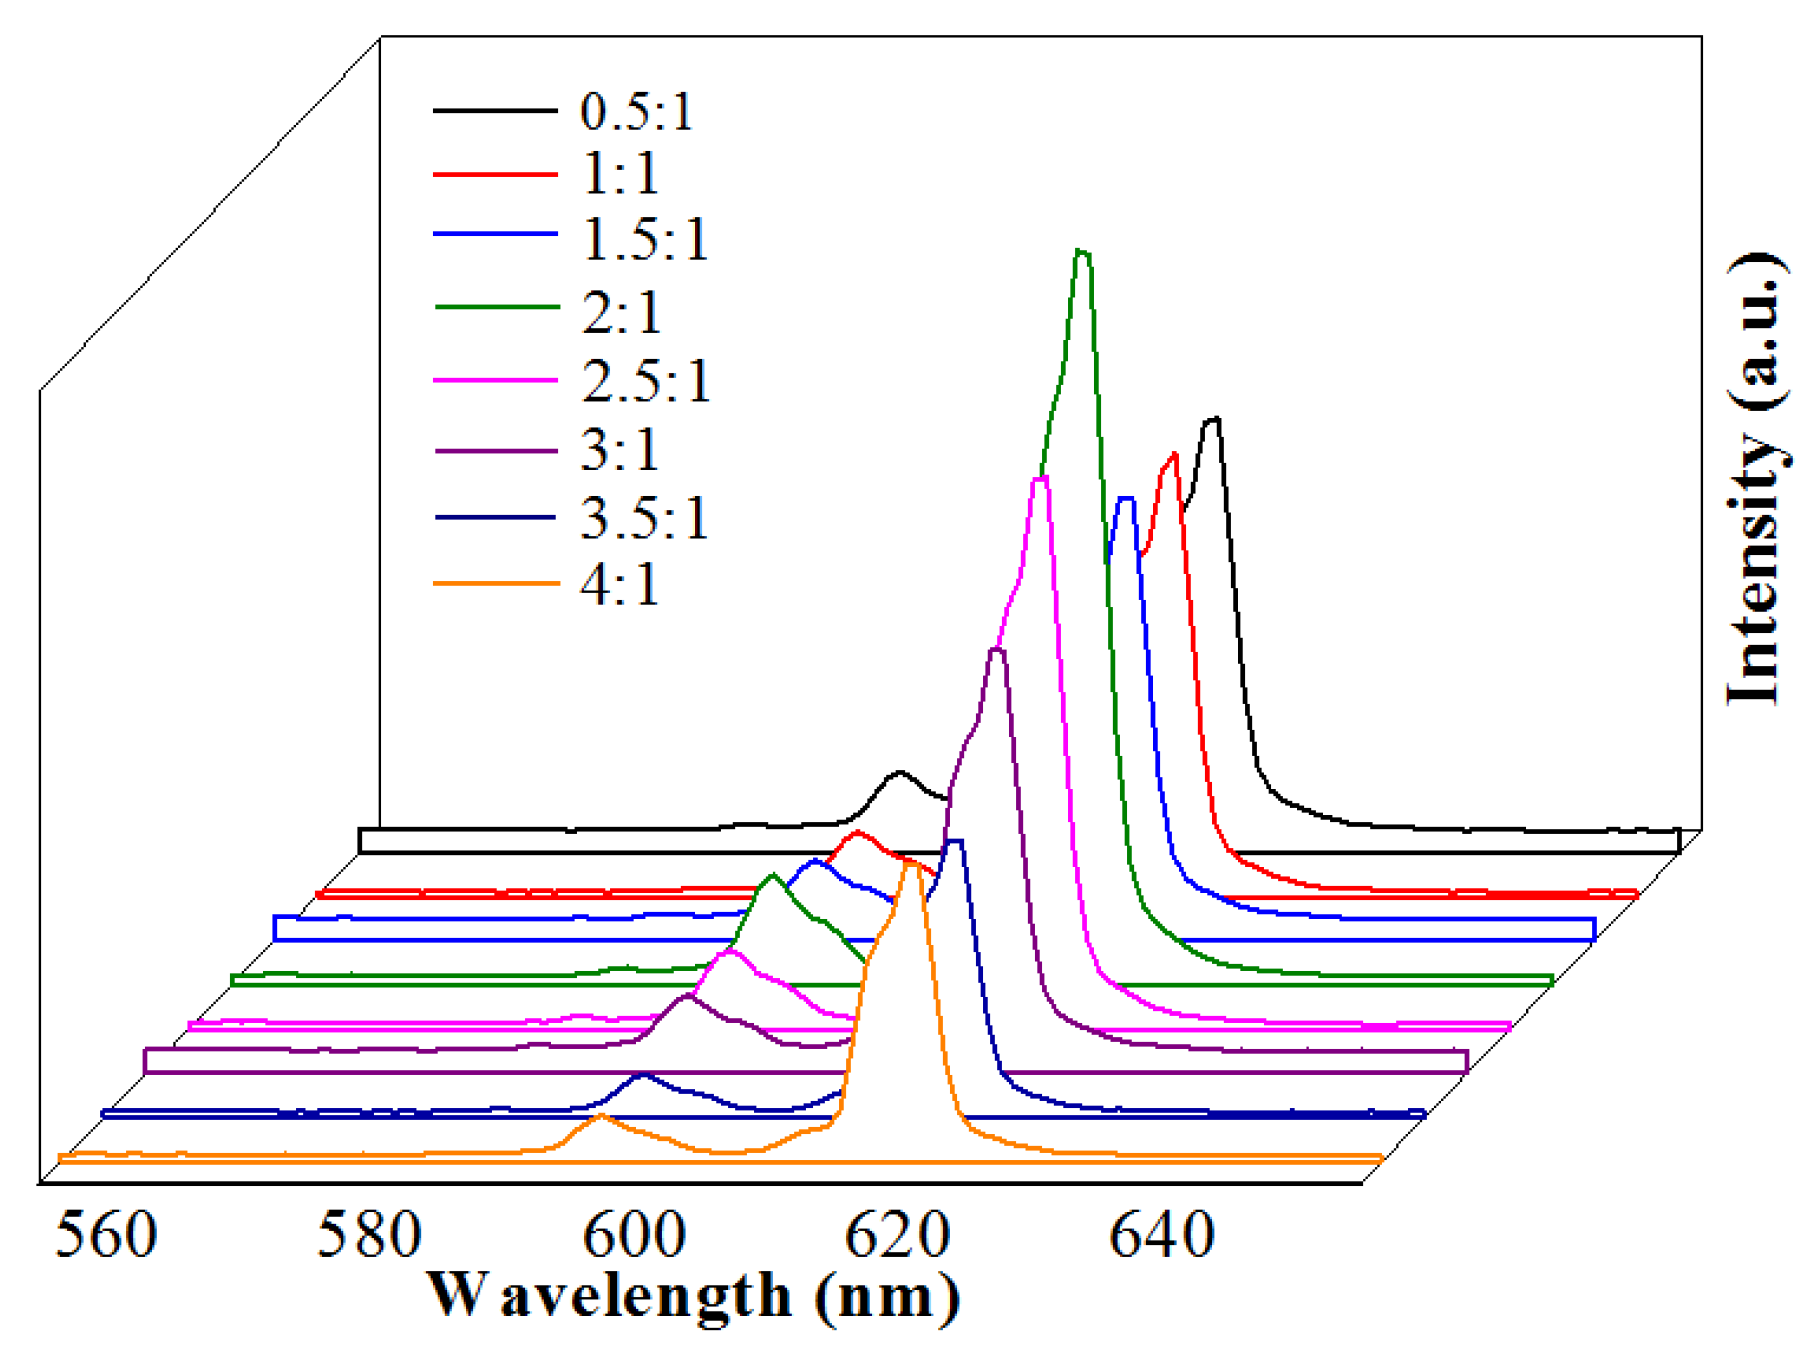
3.6. Effect of Eu3+ Doping Concentration

The different intensity of emission spectra under 465 nm excitation corresponding to 5D07F2 transition of Na5Zn2Gd1−x(MoO4)6: xEu3+ (x = 0.05, 0.10, 0.15, 0.20, 0.25, 0.30, and 0.35) phosphors after annealing at 800 °C for 2 h are shown in Figure 7. It can be seen that the shapes and positions of all the Na5Zn2Gd1−x(MoO4)6: xEu3+ samples are the same in addition to their relative luminescence intensity. Thus, with the increased concentration of Eu3+ in the host, the luminescent intensity has enhanced and reached a maximum at a concentration of x = 0.25. The rare earth ion itself has a lot of energy levels. As the doping of Eu3+ is further increased, the distance between Eu3+ ions shrinks. The phenomenon of concentration quenching occurs during excitation, resulting in a decrease in luminous intensity. The energy loss at the emission level initiated by the cross-relaxation between excited ions may be the main cause of concentration quenching [29]. The fluorescent emission of Eu3+ is mainly due to the transitions from the metastable level 5D0 to the level 7F2. A significant number of excited ions on the 5D0 level are transferred from the 5D0 to the 7F2 level due to the cross-relaxation process. Consequently, several useful excited ions are consumed through radiation and relaxation processes, and the fluorescence emission is thereby reduced, leading to a decrease in luminous intensity. The optimum molar concentration is 25 mol% in Eu3+ ion-doped Na5Zn2Gd1−x(MoO4)6: xEu3+ phosphor.
The emission spectra of the Na5Zn2Gd0.75(MoO4)6: 0.25Eu3+ with different ratios of citric acid with metal ions (C: M = 0.5:1, 1:1, 1.5:1, 2:1, 2.5:1, and 3:1) were measured, as shown in Figure 8. The luminescent intensity of samples increased initially and then decreased as the ratio of citric acid to metal ions increased. Thus, it can be observed that the luminous intensity reaches a maximum when the ratio of citric acid to metal ions is 2:1. The pH values with a constant molar ratio of citric acid to metal ions affect the emission intensities of Na5Zn2Gd1−x(MoO4)6: xEu3+. This is because the luminescent performance at different pH values should be attributed to the different morphologies of the products.

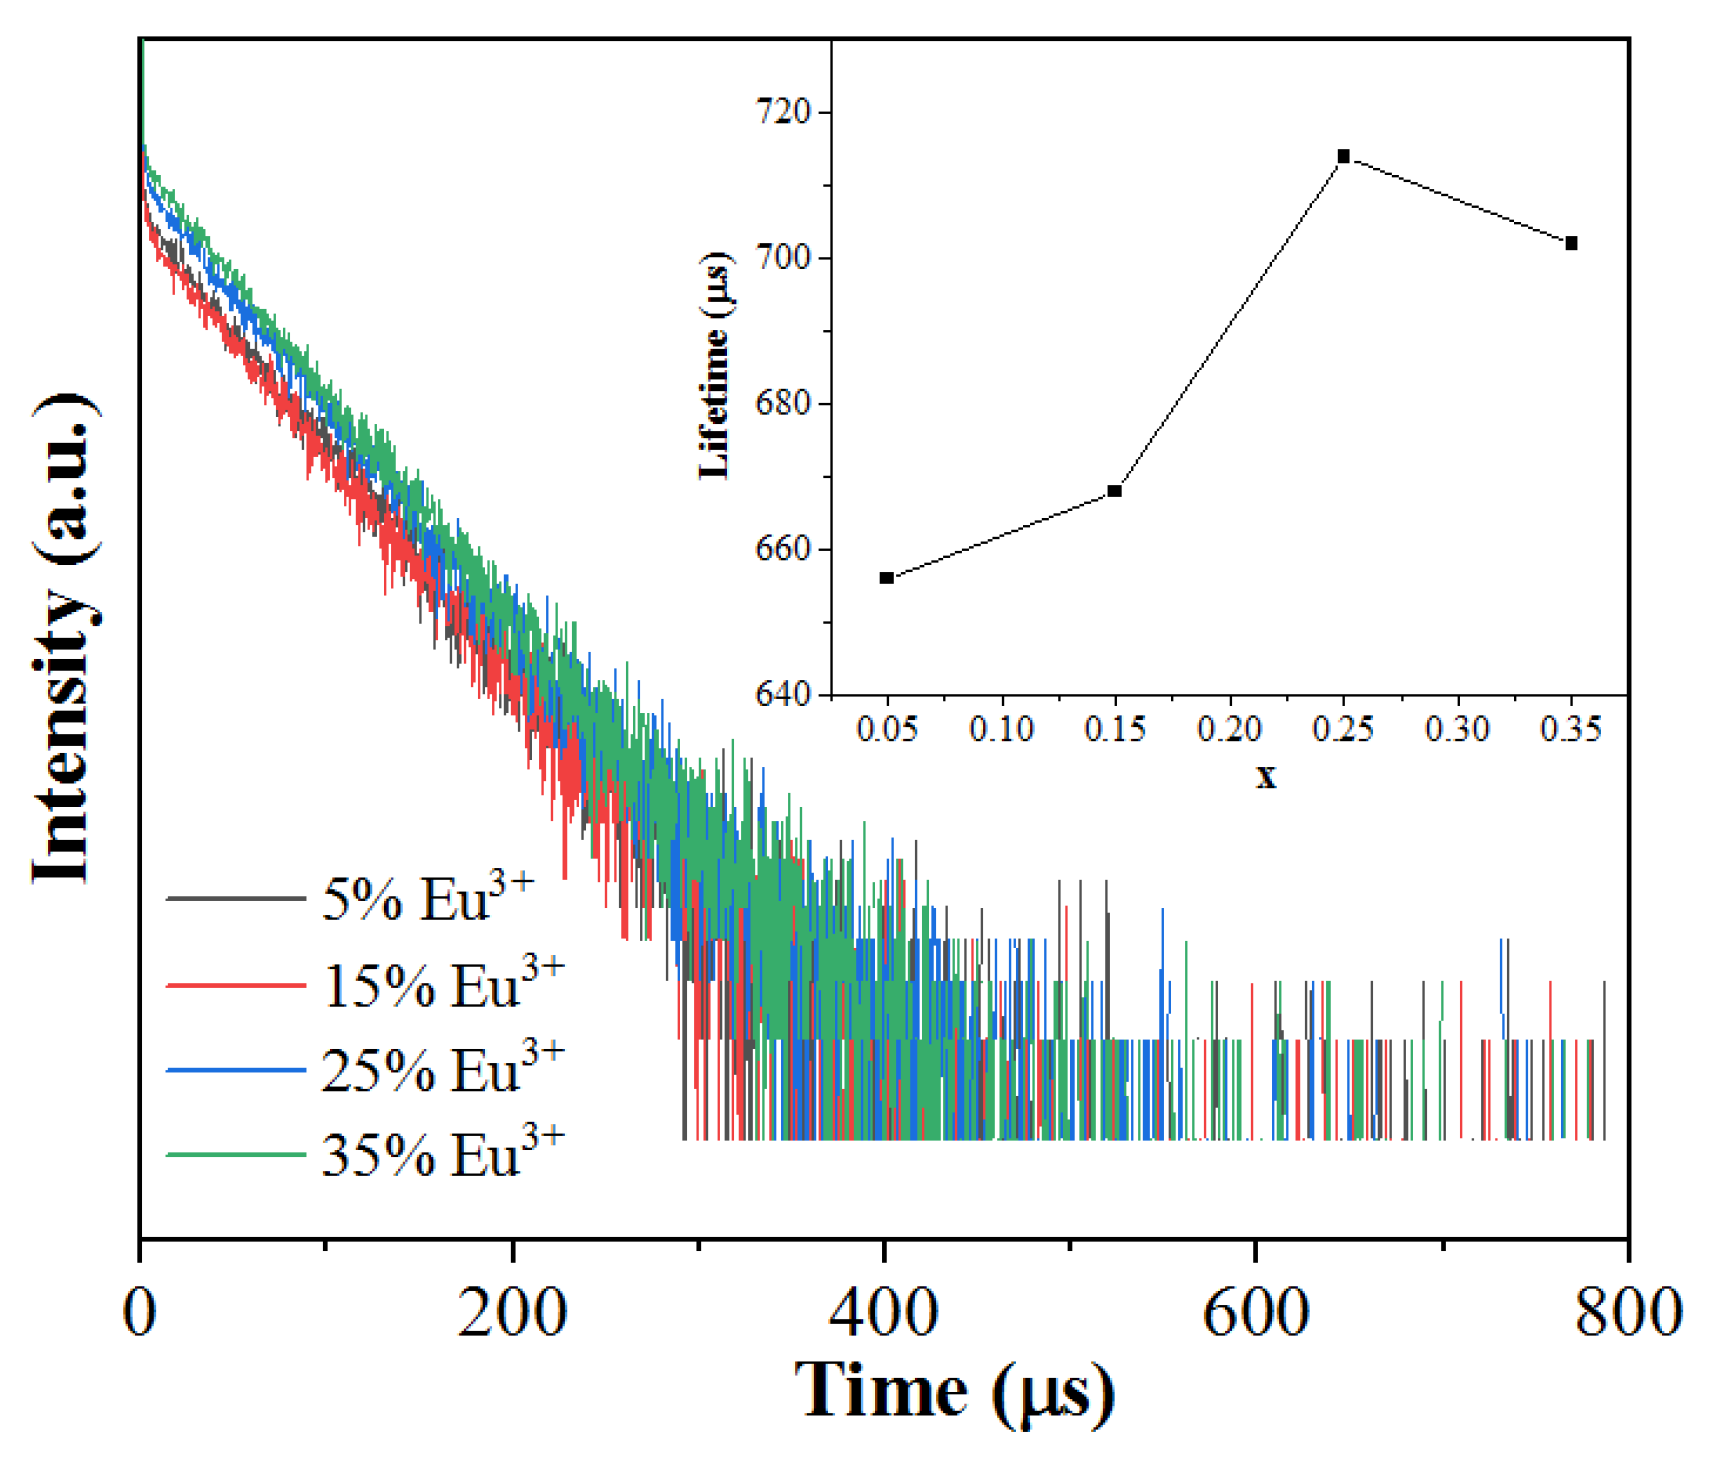
3.7. Luminescence Decay Lifetimes of Na5Zn2Gd1−x(MoO4)6: xEu3+

The luminescence decay curves of Na5Zn2Gd1−x(MoO4)6: xEu3+ were measured by monitoring the 615 nm emission of 5D07F2 under excitation of 465 nm. Figure 9 shows the luminescence decay curves of Eu3+-activated Na5Zn2Gd1−x(MoO4)6 phosphors with various doping concentration. As a result, the decay curves of all measured samples exhibit a single exponential behavior and can be well fitted by the following equation:
I(t) = I0 + Aexp (−t/τ)
where I(t) is the emission intensity at time t, I0 is the initial emission intensity, and τ is the lifetime. A is the coefficient and τ is the lifetime.
By linear fitting, the lifetimes for the Na5Zn2Gd(MoO4)6 phosphors were obtained as 656, 668, 714, and 702 µs when the Eu3+ doping concentration was 0.05, 0.15, 0.25, and 0.35, respectively (see inset of Figure 9). As we can see, there is little difference among the lifetimes of the Na5Zn2Gd1−x(MoO4)6: xEu3+ phosphors with different Eu3+ doping concentrations, indicating a weak concentration quenching behavior of Eu3+ in the present host.

3.8. CIE Color Coordinates of Na5Zn2Gd0.75(MoO4)6: 0.25 Eu3+

According to the emission spectrum data of Na5Zn2Gd0.75(MoO4)6: 0.25 Eu3+ (the ratio of citric acid to the metal cation is 2:1) under 465 nm excitation, the CIE chromaticity diagram is shown in Figure 10. The color coordinates of the emission spectra of the sample (0.658, 0.341) were located in the red region. When compared with the color coordinates of the commercial Y2O2S: Eu3+ (0.48, 0.50) red phosphor, it is closer to the U.S. National Television Standards Committee (NTSC) standard values (0.670, 0.330), which means the Na5Zn2Gd0.75(MoO4) 6: 0.25 Eu3+ is a stable red phosphor for white LEDs.

4. Conclusions

A series of the Na5Zn2Gd1−x(MoO4)6: xEu3+ (x = 0.03, 0.04, 0.05, …, 0.25, …, 0.35) red phosphors was successfully prepared with sol-gel method, and the optimal synthesis condition was investigated based on luminescent relative intensity. The results of XRD and SEM show samples with a monoclinic powellite structure. The value of the band gap energy of Na5Zn2Gd0.75(MoO4)6: 0.25Eu3+ was 2.69 eV, which is more conducive to absorbing energy to complete the electronic transition process. The strongest emission peak was located at 614 nm under the 465 nm excitation, which corresponds to the 5D07F2 transition of Eu3+ indicating that the Na5Zn2Gd(MoO4)6: Eu3+ crystal has a strong and pure red emission. The red phosphor has color coordinate values of (0.658, 0.341), which is close to the NTSC system standard for red chromaticity. Consequently, it is a promising candidate red phosphor for near-UV-based WLEDs.

Author Contributions

Conceptualization, W.G., R.S. and J.A.; methodology, W.G. and R.S.; formal analysis, W.G., R.S. and J.A.; resources, W.G. and R.S.; data curation, W.G.; writing—original draft preparation, W.G.; writing—review and editing, W.G., R.S. and J.A.; visualization, W.G.; supervision, R.S.; project administration, R.S. and J.A.; funding acquisition, J.A. All authors have read and agreed to the published version of the manuscript.

Funding

This research was supported by the National Natural Science Foundation of China (Grant No. 21864020), Collaborative Innovation Center for Water Environmental Security of Inner Mongolia Autonomous Region, China, (Grant no. XTCX003), and Science and technology planning project of Inner Mongolia Autonomous Region (Grant no. 2021GG0367).

Data Availability Statement

The raw data supporting the conclusions of this article will be made available by the authors on request.

Conflicts of Interest

The authors declare no conflicts of interest. The authors declare no competing financial interest.

References

  1. Wang, R.; Xiang, H.; Chen, J.; Li, Y.; Zhou, Y.; Choy, W.C.H.; Fan, Z.; Zeng, H. Energy Regulation in White-Light-Emitting Diodes. ACS Energy Lett. 2022, 7, 2173–2188. [Google Scholar] [CrossRef]
  2. Park, J.Y.; Yang, H.K. Development of red-emitting La2ZnTiO6: Eu3+ phosphors for WLED and visualization of latent fingerprint applications. Mater. Today Commun. 2022, 31, 103391. [Google Scholar] [CrossRef]
  3. Dang, P.; Li, G.; Yun, X.; Zhang, Q.; Liu, D.; Lian, H.; Shang, M.; Lin, J. Thermally stable and highly efficient red-emitting Eu3+-doped Cs3GdGe3O9 phosphors for WLEDs: Non-concentration quenching and negative thermal expansion. Light Sci. Appl. 2021, 10, 29. [Google Scholar] [CrossRef] [PubMed]
  4. Li, J.; Yan, J.; Wen, D.; Khan, W.U.; Shi, J.; Wu, M.; Su, Q.; Tanner, P.A. Advanced red phosphors for white light-emitting diodes. J. Mater. Chem. C 2016, 4, 8611–8623. [Google Scholar] [CrossRef]
  5. Zhao, H.; Zhang, Y.; Yang, S.; Ye, C.; He, C.; Song, Y.; Wang, Y.; Lin, B.; Yu, J. Spectral tunability of K2Lu(WO4)(PO4): Dy3+, Eu3+ phosphors and remote luminescent layers for high-quality white light. Ceram. Int. 2024, 50, 8429–8438. [Google Scholar] [CrossRef]
  6. Li, K.; Van Deun, R. Correction: Mutual energy transfer luminescent properties in novel CsGd(MoO4)2:Yb3+, Er3+/Ho3+ phosphors for solid-state lighting and solar cells. Phys. Chem. Chem. Phys. 2019, 21, 5312. [Google Scholar] [CrossRef]
  7. Qin, L.; Huang, Y.; Tsuboi, T.; Seo, H.J. The red-emitting phosphors of Eu3+-activated MR2(MoO4)4 (M = Ba, Sr, Ca; R = La3+, Gd3+, Y3+) for light emitting diodes. Mater. Res. Bull. 2012, 47, 4498–4502. [Google Scholar] [CrossRef]
  8. Guo, C.F.; Chen, T.; Luan, L.; Zhang, W.; Huang, D. Luminescent properties of R2(MoO4)3:Eu3+ (R = La, Y, Gd) phosphors prepared by sol-gel method. J. Phys. Chem. Solid 2008, 69, 1905–1911. [Google Scholar] [CrossRef]
  9. Du, H.; Luan, F.; Li, D.; Sun, L.; He, W.; Zeng, Q.; Guo, D. Blue light induced red phosphors Sr2CeO4:Eu3+ through co-doping with M2+ (Mg, Ba, Ca) and spectroscopic properties applied in WLEDs. Mater. Sci. Eng. B 2023, 294, 116489. [Google Scholar] [CrossRef]
  10. Du, P.; Yu, J.S. Synthesis and luminescent properties of Eu3+-activated Na0.5Gd0.5MoO4: A strong re-emitting phosphor for LED and FED applications. J. Lumin. 2016, 179, 451–456. [Google Scholar] [CrossRef]
  11. Yang, Y.; Shi, Y.; Duan, J.; Lu, K.; Cheng, G.; Zhao, Y.; Huang, Z.; Li, P.; Wei, N.; Zhu, X.; et al. Photoluminescence enhancement of Gd2Zr2O7: Eu3+ red phosphor sensitized by co-doped Al3+ ions. Ceram. Int. 2021, 47, 13071–13077. [Google Scholar] [CrossRef]
  12. Song, M.; Wang, L.; Feng, Y.; Wang, H.; Wang, X.; Li, D. Preparation of a novel red KBaGd(MoO4)3:Eu3+ phosphor by sol-gel method and its luminescent properties. Opt. Mater. 2018, 84, 284–291. [Google Scholar] [CrossRef]
  13. Wang, Z.L.; Liang, H.B.; Zhou, L.Y.; Wang, J.; Gong, M.; Su, Q. NaEu0.96Sm0.04(MoO4)2 as a promising red-emitting phosphor for LED solid-state lighting prepared by the Pechini process. J. Lumin. 2007, 128, 147–154. [Google Scholar] [CrossRef]
  14. Gao, F.; Liang, L.; Guo, C. Preparation and luminescence of red light-emitting phosphors based on Li3Ba2Ln(3−x)Eux(MoO4)8 by sol-gel method. Chin. J. Lumin. 2009, 30, 610–616. [Google Scholar] [CrossRef]
  15. Chen, F.; Akram, M.N.; Chen, X.Y. Improved photoluminescence performance of Eu3+-doped Y2(MoO4)3 red-emitting phosphor via orderly arrangement of the crystal lattice. Molecules 2023, 28, 1014. [Google Scholar] [CrossRef]
  16. Xie, H.D.; Chen, C.; Li, J.; He, Y.; Wang, N. Sol-gel synthesis and luminescent performance of Eu3+, Lu3+ co-doped Ca0.3Sr0.7Mo1−xWxO4 red-emitting phosphor. Inorg. Nano Met. Chem. 2020, 51, 1297–1305. [Google Scholar] [CrossRef]
  17. Li, Z.; Cheng, J.-L.; Wang, Y.-N.; Wu, K.; Cao, J. Rapid synthesis of BaMoO4:Eu3+ red phosphors using microwave irradiation. Luminescence 2023, 38, 1414–1421. [Google Scholar] [CrossRef]
  18. Kong, L.; Sun, H.; Nie, Y.; Yan, Y.; Wang, R.; Ding, Q.; Zhang, S.; Yu, H.; Luan, G. Luminescent Properties and Charge Compensator Effects of SrMo0.5W0.5O4: Eu3+ for White Light LEDs. Molecules 2023, 28, 2681. [Google Scholar] [CrossRef]
  19. Solodovnikov, S.F.; Khaikina, E.G.; Solodovnikova, Z.A. New families of lithium containing triple molybdates and the stabilizing role of lithium in their structure formation. Dokl. Chem. 2007, 416, 207–212. [Google Scholar] [CrossRef]
  20. Basovich, O.M.; Khaikina, E.G. Formation Laws for Scheelite-like Triple Molybdates LiMLn2(MoO4)4. Russ. J. Inorg. Chem. 2006, 51, 1082–1086. [Google Scholar] [CrossRef]
  21. Ji, T.; Ha, E.; Wu, M.; Hu, X.; Wang, J.; Sun, Y.; Li, S.; Hu, J. Controllable hydrothermal synthesis and photocatalytic performance of Bi2MoO6 nano/microstructures. Catalysts 2020, 10, 1161. [Google Scholar] [CrossRef]
  22. Yang, J.; Liang, Y.; Li, K.; Yang, G.; Zhu, Y.; Liu, S.; Lei, W. New reaction pathway induced by the synergistic effects of Bi plasmon and La3+ doping for efficient visible light photocatalytic reaction on BiOCl. Appl. Surf. Sci. 2018, 458, 769–780. [Google Scholar] [CrossRef]
  23. Li, Y.; Li, H.; Li, Y.; Liu, D.; Xie, J.; Ma, H.; Qu, H.; Xu, J.; Han, Y.; Wang, L. Structure, properties and application of Eu3+ doped bismuth molybdate red-emitting phosphor synthesized by sol-gel method. Opt. Mater. 2023, 144, 114336. [Google Scholar] [CrossRef]
  24. Tranquilin, R.L.; Lovisa, L.X.; Almeida, C.R.R.; Paskocimas, C.A.; Li, M.S.; Oliveira, M.C.; Gracia, L.; Andres, J.; Longo, E.; Motta, F.V.; et al. Understanding the whiteemitting CaMoO4 Co-doped Eu3+, Tb3+, and Tm3+ phosphor through experiment and computation. J. Phys. Chem. C 2019, 123, 18536–18550. [Google Scholar] [CrossRef]
  25. Li, H.; Zhang, S.; Zhou, S.; Cao, X.; Zheng, Y. Crystalline size effect on the energy transfer from Mo-O groups to Eu3+ ions in R2MoO6: Eu (R¼La, Gd, and Y) Crystals. J. Phys. Chem. C 2009, 113, 13115–13120. [Google Scholar] [CrossRef]
  26. Huang, X.; Wang, S.; Li, B.; Sun, Q.; Guo, H. High-brightness and high-color purity red-emitting Ca3Lu(AlO)3(BO3)4: Eu3+ phosphors with internal quantum efficiency close to unity for near-ultraviolet-based white-light-emitting diodes. Opt. Lett. 2018, 43, 1307–1310. [Google Scholar] [CrossRef]
  27. Gupta, I.; Singh, S.; Bhagwan, S.; Singh, D. Rare earth (RE) doped phosphors and their emerging applications: A review. Ceram. Int. 2021, 47, 19282–19303. [Google Scholar] [CrossRef]
  28. Han, B.; Zhang, J.; Li, P.; Li, J.; Bian, Y.; Shi, H. Synthesis and luminescence properties of Eu3+ doped high temperature form of Bi2MoO6. J. Electron. Mater. 2015, 44, 102–103. [Google Scholar] [CrossRef]
  29. Li, Z.; Wang, Y.; Cao, J.; Jiang, Y.; Zhao, X.; Meng, Z. Hydrothermal synthesis and luminescent properties of BaMoO4: Sm3+ red phosphor. J. Rare Earths 2016, 34, 143–146. [Google Scholar] [CrossRef]
Figure 1. TG−DTA curves of the Na5Zn2Gd(MoO4)6: Eu3+.
Crystals 14 00933 g001
Figure 2. Structure and morphology of Na5Zn2Gd1−x(MoO4)6: xEu3+: (a) XRD patterns; (b,c) SEM images of Na5Zn2Gd0.75(MoO4)6: 0.25Eu3+; (d) crystal structure.
Crystals 14 00933 g002
Figure 3. FTIR spectra of the precursor and Na5Zn2Gd0.75(MoO4)6: 0.25Eu3+ phosphor calcined at 800 °C.
Crystals 14 00933 g003
Figure 4. UV–vis diffuse reflectance spectra of Na5Zn2Gd(MoO4)6: xEu3+ (a); Tauc plots (b).
Crystals 14 00933 g004
Figure 5. The excitation spectrum of Na5Zn2Gd(MoO4)6: Eu3+ sample monitored at λem = 614 nm.
Crystals 14 00933 g005
Figure 6. The emission spectra of Na5Zn2Gd1−x(MoO4)6: xEu3+.
Crystals 14 00933 g006
Figure 7. Emission spectra of Na5Zn2Gd1−x(MoO4)6: xEu3+ doped with different Eu3+ concentrations.
Crystals 14 00933 g007
Figure 8. Emission spectra of different citric acid concentrations in Na5Zn2Gd1−x(MoO4)6: xEu3+.
Crystals 14 00933 g008
Figure 9. Luminescent decay curves of Na5Zn2Gd1−x(MoO4)6: xEu3+ monitored at 615 nm and excited with 465 nm.
Crystals 14 00933 g009
Figure 10. CIE chromaticity diagram of the Na5Zn2Gd0.75(MoO4)6: 0.25 Eu3+.
Crystals 14 00933 g010
Disclaimer/Publisher’s Note: The statements, opinions and data contained in all publications are solely those of the individual author(s) and contributor(s) and not of MDPI and/or the editor(s). MDPI and/or the editor(s) disclaim responsibility for any injury to people or property resulting from any ideas, methods, instructions or products referred to in the content.

