Abstract
In recent years, unidimensional photonic crystal-based biosensors have attracted significant attention due to their potential for label-free bio-detection of cells, proteins, and other organic molecules. These biosensors are based on alternating materials with different refractive indices and a cavity region in which biomolecules can be injected. In this study, we investigated numerically the optical properties of unidimensional photonic crystals based on [LiTaO3/MgF2], [LiTaO3/SiO2], [PbTiO3/MgF2], and [PbTiO3/SiO2] heterostructures, and focused our discussion on the detection of four kinds of extracellular vesicles. Our results demonstrated that the [PbTiO3/MgF2] photonic crystal biosensor exhibited the best biosensing performance, with a maximum value of the sensitivity of 511.3 nm/RIU. This study provides valuable insights into the use of perovskites materials, in particular, LiTaO3 and PbTiO3 for photonic crystal-based biosensors for various applications, including disease diagnosis and monitoring therapy responses.
1. Introduction
Photonic crystals (PCs) are structures composed of alternating materials with different refractive indices leading to the manipulation of electromagnetic waves. These structures have unique properties, such as high reflectivity and wavelength selectivity in unidimensional photonic crystals (1D PCs) [1,2], directional emission, anisotropic behavior and guide modes of light in bidimensional photonic crystals (2D PCs) [3,4], and complete photonic bandgap formation, photonic quasicrystal and tunability in three-dimensional photonic crystals (3D PCs) [5,6,7]. In addition to these properties, PCs can slow light propagation [8] and enhanced light–matter interactions [9,10]. Alternating layers of materials with different refractive indices and thicknesses create unidimensional photonic crystals with a photonic bandgap (PBG) which transmits certain light wavelengths and reflects others [11]. Due to their simplicity and ease of fabrication, 1D PCs are the most widely studied among the various types of PCs. Inserting defect layer with different refractive indices or intentionally breaking the periodicity of the 1D PC creates localized states within the PBG. The resonance mode created by the defect layer or cavity region can make the 1D PC suitable for many applications, including optical filters for communication spectroscopy and imaging [12], high-refractive mirrors [13], anti-reflective coatings for solar cells and camera lenses [14,15], and photonic fibers for telecommunications and sensing applications [16,17,18].
One potential application of 1D PCs is biosensing, particularly for the detection of proteins [19,20], urine [21], biomarkers [22], and cancer cells [23]. The limitation of the 1D PC’s biosensor cavity region size was often disregarded in most reports discussing the detection of cancer cells [23,24,25,26]. Additionally, the technical limitations associated with using these biosensors in the infrared region, such as the requirement for very specific infrared light detectors, were not taken into account. The current study addresses the accurate design and numerical performance analysis of 1D PCs for the detection of extracellular vesicles (EVs) in the visible light range, with the aim of providing theoretical solutions to overcome the above-mentioned constraints. Detecting and analyzing EVs is of great interest in biomedical research and clinical diagnostics. EVs are tiny membrane-bound structures that are naturally released by all cells in biofluids, such as blood and urine [27], and play an important role as promising liquid biomarkers for human diseases [28]. The size of EVs can range from 30 nm to 5 μm [28] and they can be separated according to their size by density gradient centrifugation. Detection of EVs released from tumor cells plays an important role for the early detection of cancer as well as monitoring the response to cancer therapy. EVs are generally studied by flow cytometry (FC) and recently Rond et al. [29] demonstrated the possibility of using their refractive index to evaluate staining specificity of EVs by FC.
Material selection in the 1D PCs is critical for determining the sensitivity, selectivity, and overall performance of the PC-based biosensors. The choice of materials affects the optical properties, including the refractive index, absorption, transmission, and scattering of light. Moreover, the design parameters, such as the thickness and refractive indices of the layers, can be tailored to achieve maximum sensitivity and selectivity for a particular application. Titanium dioxide (TiO2) is the most studied material for PCs due to its high refractive index [30]. In this research, we will numerically investigate the use of two high-refractive index perovskite materials, lithium tantalate (LiTaO3) and lead titanate (PbTiO3) along with two lower-refractive index materials, magnesium fluoride (MgF2) and silicon dioxide (SiO2) to form the 1D PC structures. The LiTaO3 and PbTiO3 have excellent physical and optical properties, including high refractive indices, large electro-optic coefficients, and excellent piezoelectric properties [31,32]. On the other hand, MgF2 and SiO2 also possess unique physical and optical properties that make them ideal candidates for the 1D PC. In fact, the MgF2 has a high transmittance in the UV and visible regions [33]. Moreover, SiO2, in turn, has a low refractive index, compared with LiTaO3 and PbTiO3, and an excellent transparency in the visible region. The performance of LiTaO3/MgF2, LiTaO3/SiO2, PbTiO3/MgF2, and PbTiO3/ SiO2 configurations will be studied in detail to determine their suitability for the 1D PC. Moreover, by utilizing these materials in the 1D PC biosensor design, we aim to provide novel biosensor designs that can achieve high sensitivity, selectivity, and stability for the detection of EVs in biofluids.
In this paper, we conducted numerical simulations to study the optical properties of 1D PCs based on LiTaO3/MgF2, LiTaO3/SiO2, PbTiO3/MgF2, and PbTiO3/SiO2 heterostructures using the transfer matrix method (TMM). By controlling the thickness, periodicity, and the number of layers we designed 1D PCs with specific photonic bandgaps. We also investigated the optical properties of our PCs after including cavity regions of different thicknesses as a defect layer. We discussed the potential use of our 1D PCs for detecting different types of EVs, including fresh urinary EVs, activated platelets EVs, neuroblastoma EVs, and blood EVs, in the visible wavelength range. The sensitivity of the biosensors investigated here ranges from 168.5 nm/RIU, as a threshold value, to 511 nm/RIU, depending on the parameters and the nature of the target sample.
2. Theoretical Formulation and Proposed Design of the Biosensors
Figure 1 shows the 1D PC-based biosensor (1D PC-BIO) proposed in our study. The proposed structure consists of alternating layers of materials A and B with refractive indices nA and nB, respectively, where A represents the perovskite materials (LiTaO3 and PbTiO3) and B represents the materials with low refractive indices (i.e., SiO2 and MgF2). The refractive indices of LiTaO3, PbTiO3, SiO2 and MgF2 are 2.18 [34], 2.735 [35], 1.46 [36] and 1.378 [37], respectively.
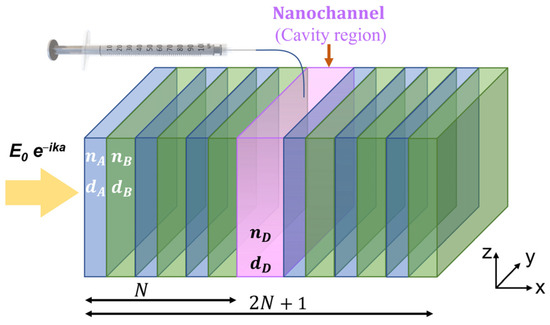
Figure 1.
Schematic of the proposed 1D photonic crystal-based biosensor (1D PC-BIO).
The thicknesses of LiTaO3, PbTiO3, SiO2 and MgF2 were then calculated according to the equation , as 61.9, 49.4, 92.5 and 97.9 nm, respectively. The defect layer (or cavity region), created in the middle of the periodic structure, is the nanochannel (the pink-colored layer in Figure 1) in which EVs can be injected for the detection process. The nanochannel can be filled with distilled water (DW) as a reference (nD = 1.333), and with the following EVs: Fresh urinary EVs (nD = 1.374, size less than 250 nm [38]), activated platelets EVs (nD = 1.39, size range 50–150 nm [39]), neuroblastoma EVs (nD = 1.393, size ranges from 50 to 150 nm for exosomes, and from 100 to 1000 nm for micro-vesicles [40]), and blood EVs (nD = 1.398). The refractive index of each EV can be found in [41].
The total number of layers is 2N in the case of the 1D PC (Figure S1) and 2N + 1 in the case of the 1D PC-BIO (Figure 1). The interaction of the incident light with the 1D PC-BIO structure is given by the transfer matrix method (TMM):
where , , and are the elements of the total transfer matrix, and is the characteristic matrix of the layer, given by:
where , and are the refractive index and thickness of the jth layer, respectively, is the incidence angle at the jth layer, is the angular velocity, is the speed of light, and is given by:
The TM refers to the transverse magnetic mode and the TE to the transverse electric mode.
In the case of the 1D PC-BIO, where a defect layer is present in the middle of the structure, the transfer matrix can be written as:
where is the characteristic matrix of the defect layer (the nanochannel in our case). Finally, we define the reflection and transmittance coefficients as:
where and correspond to at the first (j = 1) and last layer (j = 2N + 1), respectively.
3. Numerical Results and Discussion
3.1. Optical Characteristics of the 1D PC-Based Biosensor
The numerical calculation of the reflection as well as the transmittance as a function of the wavelength and the number of periods in the structures [LiTaO3/SiO2]N, [LiTaO3/ MgF2]N, [PbTiO3/ SiO2]N and [PbTiO3/ MgF2]N and in the absence of the defect layer are shown in Figures S2 and S3. Thereafter, we fixed the periodic number to 10 and we calculated the transmittance as a function of the wavelength and the incidence angle of light in the case of the TE and TM polarization modes (Figures S4 and S5). The photonic bandgap was wider in the [PbTiO3/MgF2]10 compared with the other structures because the difference in the refractive index () was bigger compared with , and .
For the simulation, we selected thickness values at which the wavelengths of the resonant modes would be in the middle of the photonic bandgaps (i.e., d = 40, 200, 400, and 600 nm). We focused our study on investigating the properties of the TE polarization mode exclusively. Figure 2 shows the effect of defect thicknesses on the light transmittance through the structures [TiLaO3/SiO2]5D[TiLaO3/SiO2]5 (Figure 2a), [TiLaO3/MgF2]5D[TiLaO3/MgF2]5 (Figure 2b), [PbTiO3/SiO2]5D[PbTiO3/SiO2]5 (Figure 2c) and [PbTiO3/MgF2]5D[PbTiO3/MgF2]5 (Figure 2d), where D corresponds to the distiller water layer (as the defect layer). As expected, the wavelengths of the resonant modes narrowed in all structures as the thicknesses of the defect layer increased. When the defect thickness was high (d = 600 nm), double and triple resonant modes were observed in TiLaO3- and PbTiO3-based 1D PC-BIO, respectively. We refer to [TiLaO3/SiO2]5D[TiLaO3/SiO2]5, [TiLaO3/MgF2]5D[TiLaO3/MgF2]5, [PbTiO3/SiO2]5D[PbTiO3/SiO2]5 and [PbTiO3/MgF2]5D[PbTiO3/MgF2]5 as structure 1, structure 2, structure 3 and structure 4, respectively.
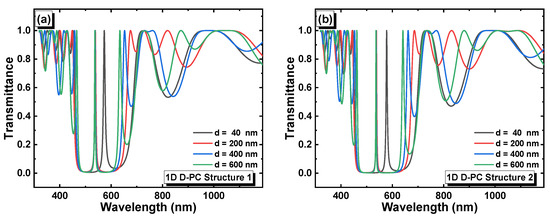
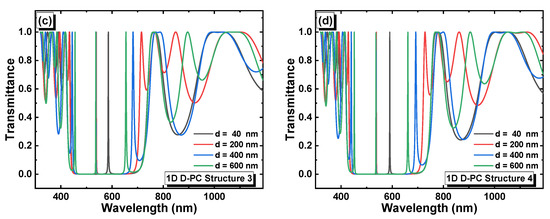
Figure 2.
Variation of the transmittance as a function of the wavelength and defect layer thicknesses in (a) [TiLaO3/SiO2]5D[TiLaO3/SiO2]5, (b) [TiLaO3/MgF2]5D[TiLaO3/MgF2]5, (c) [PbTiO3/SiO2]5D[PbTiO3/SiO2]5 and (d) [PbTiO3/MgF2]5D[PbTiO3/MgF2]5.
In order to compare the optical properties and performance of all 1D PC-BIO structures, we used the calculation parameters for which we obtained well-defined bandgaps, i.e., n = 10 as shown in Figure S3, and a nanochannel thickness that is wide enough to contain the EV samples, i.e., d = 420 nm (details concerning the sizes of the EVs and their corresponding refractive indices can be found in [29]). Figure 3 shows the transmittance maps as a function of the wavelength and incidence angle of light in all structures, where a nanochannel with a thickness of 420 nm is assumed to be filled with distilled water. Structures 3 and 4 exhibited double resonant peaks at normal incidence angle of light, as seen in the same figure, and as the incidence angle increased to 89 degrees, all structures clearly displayed double resonant peaks. In addition, the resonant peaks shifted towards lower wavelength values and became narrower as the incidence angle increased. This behavior has the potential to enhance the performance of the 1D PC-BIO, as we will discuss in Section 3.2. Next, we will consider the study of the shift in the resonant peaks observed at 547.7, 548.2, 549.3 and 549.7 nm in structure 1, structure 2, structure 3 and structure 4, respectively.
Figure 3.
Variation in the transmittance as a function of the wavelength and incidence angle of light in (a) structure 1, (b) structure 2, (c) structure 3 and (d) structure 4 (defect layer: d = 420 nm, and nwater = 1.333).
3.2. Performance of the 1D PC-Based Biosensors
We studied the shift in the resonant peaks with respect to urinary EVs (U-EV), activated platelet EVs (AP-EV), neuroblastoma EVs (N-EV), and blood EVs (B-EV) using the 1D PC-BIOs with structure 1 to 4, as shown in Figure 4a to d. The shift in the wavelength of the defect mode is due to the change in the refractive index of the defect layer, this variation can be expressed by the standing wave condition , where is the optical path difference, is an integer, is the effective refractive index and represents the geometrical path difference [23]. As shown in Figure 4, the blood EV sample exhibited the highest resonance peak shift, which can be attributed to its higher refractive index compared to the other EVs.
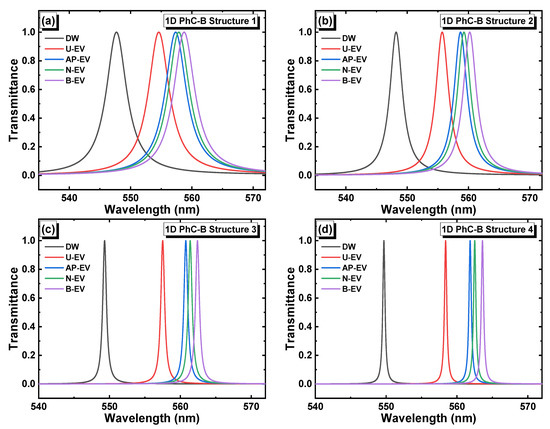
Figure 4.
Shift in the defect mode position with respect to various EV samples in (a) structure 1, (b) structure 2, (c) structure 3 and (d) structure 4.
The performance of the biosensors can be evaluated based on their sensitivity (), figure of merit (), and quality factor (), given by:
where refers to the wavelength of the defect mode in the case of the EV target, refers to the wavelength of the defect mode in the case of distilled water, and and are the refractive indices of the EV target and distilled water, respectively. is the full width half maximum (FWHM) of the defect mode. A high value of the sensitivity and a narrow bandwidth lead to high values of the FOM and factor, thus, a better biosensing performance.
Figure 5 represents the biosensing performance of our 1D PC-BIOs at a normal incidence angle of light. As seen, the 1D PC-BIO structure 1 (i.e., [TiLaO3/SiO2]5D[TiLaO3/SiO2]5) showed the lowest performance; conversely, the 1D PC-BIO structure 4 (i.e., [PbTiO3/MgF2]5D[PbTiO3/MgF2]5) had the best performance in terms of , , and (, and , in the case of the fresh urinary EV (U-EV) detection, normal incidence angle and a nanochannel thickness of 420 nm). The shift in the defect mode was calculated at a different value of the incidence angle of light (i.e., at 60 degrees), as shown in Figure S7, and the corresponding biosensing performances were evaluated and are represented in Figure S8, where structure 4 showed the best properties (, and in the blood EVs (B-EV), incidence angle of 60°, and a nanochannel thickness of 420 nm), please refer to Table S1 for more details. The sensitivity of the 1D PC-BIO structure 1 was determined to be 168.5 nm/RIU, the lowest recorded value in the current study. Surprisingly, this sensitivity is even higher than the previously reported sensitivity of the EV sensor-based 1D defective PC, as reported by Devi et al. [41].

Figure 5.
The biosensing performance of the 1PC-BIOs at a normal incidence angle of light (d = 420 nm).
Finally, we discuss the possibility of further improving the performance of the [PbTiO3/MgF2]5D[PbTiO3/MgF2]5-based biosensor under different conditions while ensuring that its working wavelength remains within the visible range. We considered a wavelength of 800 nm, and deduced the refractive indices of PbTiO3 and MgF2 as 2.6116 and 1.3751, respectively, using the dispersion formula [35] and Sellmeier equation [42] given by:
The corresponding thicknesses of PbTiO3 and MgF2 were calculated as 76.6 and 145.4 nm, respectively. We kept the nanochannel thickness as 420 nm and deduced the transmittance maps in [PbTiO3/MgF2]10 and [PbTiO3/MgF2]5D[PbTiO3/MgF2]5 as a function of the wavelength and incidence angle of light (as shown in Figure 6a,b). To use the PC in the visible range, higher incidence angles are required where the photonic bandgap shifts towards shorter wavelengths. By adding a defect layer, distilled water in this case, resonant modes appear in the transmittance map as seen in Figure 6b. For our calculation, we are interested in the second peak, indicated by the blue arrow in the same figure. Figure 6c represents the shift in the defect mode position with respect to U-EV, AP-EV, N-EV, and B-EV at an incidence angle of 80 degrees.
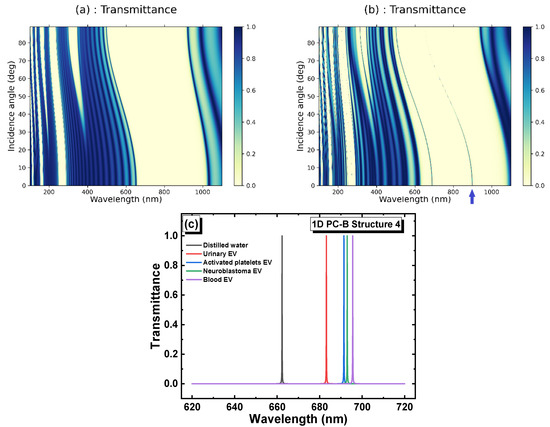
Figure 6.
Transmittance maps in (a) [PbTiO3/MgF2]10 and (b) [PbTiO3/MgF2]5D[PbTiO3/MgF2]5, and (c) the shift in the defect mode position with respect to various EV samples at an incidence angle of light of 80 degrees.
The corresponding sensitivity, FOM and Q factor of [PbTiO3/MgF2]5D[PbTiO3/MgF2]5 at 80 degrees, are listed in Table 1. As expected, we succeeded in improving the sensitivity from a value of 286.4 nm/RIU (Table S1) to 511.3 nm/RIU. Moreover, at an incidence angle of 80 degrees, the structure exhibited a high Q factor value of 6663. Although this value is relatively high compared to some previously reported values [11,19,21,41], it is still significantly smaller than the values reported in high-Q systems, such as whispering gallery microlasers, which typically reach the order of 6 × 10⁶ [43].

Table 1.
The biosensing performance of the PbTiO3-based 1D PC-BIO.
4. Conclusions
In conclusion, the unique properties of LiTaO3 and PbTiO3 make them suitable materials for photonic crystal-based biosensors. In addition, the proposed biosensors are relatively simple to fabricate with a low period number of 8 to 10. They also have a visible light working range, which can result in cost-effective, versatile, and high-performance biosensors. All proposed structures in this study showed good biosensing performance; however, [PbTiO3/MgF2] showed the best performance. The results of this study may contribute to the development of high-performance biosensors for various applications, including disease diagnosis and monitoring the response to therapy. Studying the staining specificity of antibodies to cancerous cell EVs are its effect on the refractive index was not reported before. Further research in this area is crucial to advance the application of biosensors in cancer detection and enhance their effectiveness.
Supplementary Materials
The following supporting information can be downloaded at: https://www.mdpi.com/article/10.3390/cryst13060945/s1, Figure S1: Schematic of the proposed 1D PC; Figure S2: Wavelength and period number dependence of the reflection in different structures; Figure S3: Wavelength and period number dependence of the transmittance in different structures; Figure S4: Transmittance map in (a) [LiTaO3/SiO2]10, (b) [LiTaO3/ MgF2]10, (c) [PbTiO3/ SiO2]10 and (d) [PbTiO3/ MgF2]10, in the case of the TE polarization mode; Figure S5: Transmittance map in (a) [LiTaO3/SiO2]10, (b) [LiTaO3/ MgF2]10, (c) [PbTiO3/ SiO2]10 and (d) [PbTiO3/ MgF2]10, in the case of the TM polarization mode; Figure S6: Variation in the transmittance as a function of the wavelength and incidence angle of light in (a) structure 1, (b) structure 2 (c) structure 3 and structure 4 (defect layer d = 600 nm, and nwater = 1.333); Figure S7: Shift in the defect mode position with respect to various EV samples at an incidence angle of light of 60 degrees in (a) structure 1, (b) structure 2, (c) structure 3 and (d) structure 4; Figure S8: The performance of the 1PC-BIOs at an incidence angle of light of 60 degrees; Table S1: The biosensing performance of 1D PC-BIOs at d = 420 nm and an incidence angle of 60°.
Author Contributions
Conceptualization, A.A.; methodology, A.A. and B.H; software, A.A. and B.H.; validation, P.J.K. and K.S. writing—original draft preparation, A.A.; writing—review and editing, P.J.K. and K.S.; Supervision, P.J.K. and K.S. All authors have read and agreed to the published version of the manuscript.
Funding
This work was supported by Brain Pool Program through the National Research Foundation of Korea (NRF) funded by the Ministry of Science and ICT (NRF-2019H1D3A1A01102658). This study was supported by research fund from Chosun University, 2023.
Data Availability Statement
Data are available from the corresponding author upon the request.
Conflicts of Interest
The authors declare no conflict of interest.
References
- Doghmosh, N.; Taya, S.A.; Upadhyay, A.; Olaimat, M.M.; Colak, I. Enhancement of optical visible wavelength region selective reflector for photovoltaic cell applications using a ternary photonic crystal. Optik 2021, 243, 167491. [Google Scholar] [CrossRef]
- Saleki, Z. Nonlinear control of switchable wavelength-selective absorption in a one-dimensional photonic crystal including ultrathin phase transition material-vanadium dioxide. Sci. Rep. 2022, 12, 10715. [Google Scholar] [CrossRef]
- Hajivandi, J.; Holcomb, M.; Kurt, H. Directional emission of the edge states from the photonic topological structure composed of two-dimensional honeycomb photonic crystals. J. Opt. 2021, 50, 371–380. [Google Scholar] [CrossRef]
- Li, M.; Liang, H.; Luo, R.; He, Y.; Lin, Q. High-Q 2D lithium niobate photonic crystal slab nanoresonators. Laser Photonics Rev. 2019, 13, 1800228. [Google Scholar] [CrossRef]
- Chang, B.; Zhou, C.; Tarekegne, A.T.; Yang, Y.; Zhao, D.; Jensen, F.; Hübner, J.; Jansen, H. Large area three-dimensional photonic crystal membranes: Single-run fabrication and applications with embedded planar defects. Adv. Opt. Mater. 2019, 7, 1801176. [Google Scholar] [CrossRef]
- Jiang, C.; Xue, Y.L.; Wang, R.; Kong, R. Area scalable and period manipulable three-dimensional optically induced photorefractive photonic periodic crystal or aperiodic quasicrystal. Superlattices Microstruct. 2020, 140, 106446. [Google Scholar] [CrossRef]
- Hu, X.; Zhang, Q.; Liu, Y.; Cheng, B.; Cheng, B.; Zhang, D. Ultrafast three-dimensional tunable photonic crystal. Appl. Phys. Lett. 2003, 83, 2518–2520. [Google Scholar] [CrossRef]
- Farzin, B.Z.; Ardebili, S.B.S.; Kim, J.S.; Kang, T.I. Investigating the slow light in a 2D heterostructure photonic crystal composed of circular rods and holes in the square lattices. Phys. Scr. 2022, 98, 015510. [Google Scholar] [CrossRef]
- Aravindakshan, N.; Eftekhari, E.; Tan, S.H.; Li, X.; St John, J.; Nguyen, N.T.; Zhao, H.; Zhao, D.; Li, Q. Ensembles of photonic beads: Optical properties and enhanced light—Matter interactions. Adv. Opt. Mater. 2020, 8, 1901537. [Google Scholar] [CrossRef]
- Elshahat, S.; Abood, I.; Esmail, M.S.M.; Ouyang, Z.; Lu, C. One-dimensional topological photonic crystal mirror heterostructure for sensing. Nanomaterials 2021, 11, 1940. [Google Scholar] [CrossRef]
- Trabelsi, Y.; Belhadj, W.; Ben Ali, N.; Aly, A.H. Theoretical study of tunable optical resonators in periodic and quasiperiodic one-dimensional photonic structures incorporating a nematic liquid crystal. Photonics 2021, 8, 150. [Google Scholar] [CrossRef]
- Gadhwal, R.; Kaushik, P.; Devi, A. A review on 1D photonic crystal based reflective optical limiters. Crit. Rev. Solid State Mater. Sci. 2023, 48, 93–111. [Google Scholar] [CrossRef]
- Habli, O.; Bouazzi, Y.; Kanzari, M. Gas sensing using one-dimensional photonic crystal nanoresonators. Prog. Electromagn. Res. C 2019, 92, 251–263. [Google Scholar] [CrossRef]
- Sayed, H.; Al-Dossari, M.; Ismail, M.A.; Abd El-Gawaad, N.S.; Aly, A.H. Theoretical Analysis of Optical Properties for Amorphous Silicon Solar Cells with Adding Anti-Reflective Coating Photonic Crystals. Photonics 2022, 9, 813. [Google Scholar] [CrossRef]
- Anttu, N.; Mäntynen, H.; Sorokina, A.; Turunen, J.; Sadi, T.; Lipsanen, H. Applied electromagnetic optics simulations for nanophotonics. J. Appl. Phys. 2021, 129, 131102. [Google Scholar] [CrossRef]
- Palo, E.; Daskalakis, K.S. Prospects in Broadening the Application of Planar Solution-Based Distributed Bragg Reflectors. Adv. Mater. Interfaces 2023, 2202206. [Google Scholar] [CrossRef]
- Bertucci, S.; Megahd, H.; Dodero, A.; Fiorito, S.; Di Stasio, F.; Patrini, M.; Comoretto, D.; Lova, P. Mild Sol–Gel Conditions and High Dielectric Contrast: A Facile Processing toward Large-Scale Hybrid Photonic Crystals for Sensing and Photocatalysis. ACS Appl. Mater. Interfaces 2022, 14, 19806–19817. [Google Scholar] [CrossRef]
- Malekovic, M.; Urann, M.; Steiner, U.; Wilts, B.D.; Kolle, M. Soft photonic fibers for colorimetric solvent vapor sensing. Adv. Opt. Mater. 2020, 8, 2000165. [Google Scholar] [CrossRef]
- Segovia-Chaves, F. Transmittance spectrum of a defective one-dimensional photonic crystal with a protein solution. Optik 2021, 231, 166408. [Google Scholar] [CrossRef]
- Aly, A.H.; Mohamed, D.; Mohaseb, M.A.; Abd El-Gawaad, N.S.; Trabelsi, Y. Biophotonic sensor for the detection of creatinine concentration in blood serum based on 1D photonic crystal. RSC Adv. 2020, 10, 31765–31772. [Google Scholar] [CrossRef] [PubMed]
- El Mouncharih, A.; Takassa, R.; Farkad, O.; Tchenka, A.; Elfatouaki, F.; Ibnouelghazi, E.A.; Abouelaoualim, D. One-dimensional photonic crystal-based biosensor for the detection of glucose concentration in human urine. J. Nanophotonics. 2023, 17, 026007. [Google Scholar]
- Inan, H.; Poyraz, M.; Inci, F.; Lifson, M.A.; Baday, M.; Cunningham, B.T.; Demirci, U. Photonic crystals: Emerging biosensors and their promise for point-of-care applications. Chem. Soc. Rev. 2017, 46, 366–388. [Google Scholar] [CrossRef]
- Panda, A.; Pukhrambam, P.D.; Wu, F.; Belhadj, W. Graphene-based 1D defective photonic crystal biosensor for real-time detection of cancer cells. Eur. Phys. J. Plus 2021, 136, 809. [Google Scholar] [CrossRef]
- Aly, A.H.; Zaky, Z.A. Ultra-sensitive photonic crystal cancer cells sensor with a high-quality factor. Cryogenics 2019, 104, 102991. [Google Scholar] [CrossRef]
- Bijalwan, A.; Singh, B.K.; Rastogi, V. Analysis of one-dimensional photonic crystal-based sensor for detection of blood plasma and cancer cells. Optik 2021, 226, 165994. [Google Scholar] [CrossRef]
- Abohassan, K.M.; Ashour, H.S.; Abadla, M.M. A 1D photonic crystal-based sensor for detection of cancerous blood cells. Opt. Quantum Electron. 2021, 53, 1–14. [Google Scholar] [CrossRef]
- Maas, S.L.; Breakefield, X.O.; Weaver, A.M. Extracellular vesicles: Unique intercellular delivery vehicles. Trends Cell Biol. 2017, 27, 172–188. [Google Scholar] [CrossRef] [PubMed]
- Kim, Y.; Van Der Pol, E.; Arafa, A.; Thapa, I.; Britton, C.J.; Kosti, J.; Song, S.; Joshi, V.B.; Erickson, R.M.; Ali, H.; et al. Calibration and standardization of extracellular vesicle measurements by flow cytometry for translational prostate cancer research. Nanoscale 2022, 14, 9781–9795. [Google Scholar] [CrossRef] [PubMed]
- De Rond, L.; Libregts, S.F.W.M.; Rikkert, L.G.; Hau, C.M.; Van Der Pol, E.; Nieuwland, R.; Van Leeuwen, T.G.; Coumans, F.A.W. Refractive index to evaluate staining specificity of extracellular vesicles by flow cytometry. J. Extracell. Vesicles 2019, 8, 1643671. [Google Scholar] [CrossRef]
- Yu, J.; Lei, J.; Wang, L.; Zhang, J.; Liu, Y. TiO2 inverse opal photonic crystals: Synthesis, modification, and applications-A review. Alloys Compd. 2018, 769, 740–757. [Google Scholar] [CrossRef]
- Liu, Y.; Ren, G.; Cao, T.; Mishra, R.; Ravichandran, J. Modeling temperature, frequency, and strain effects on the linear electro-optic coefficients of ferroelectric oxides. J. Appl. Phys. 2022, 131, 163101. [Google Scholar] [CrossRef]
- Zhang, J.; Xu, B.; Wang, Y.S.; Qin, Z.; Ke, S.H. First-principles investigation of the ferroelectric, piezoelectric and nonlinear optical properties of LiNbO3-type ZnTiO3. Sci. Rep. 2019, 9, 1–14. [Google Scholar] [CrossRef] [PubMed]
- Zarei Moghadam, R.; Omrany, A.H.; Taherkhani, M.; Shokrian, F. Fabrication of multi-layer antireflection coating consisting of ZnS and MgF2. Prog. Physi. Appl. Mater. 2021, 1, 7–13. [Google Scholar]
- Senouci, K.; Mansour, D.; Abderrahmane, A. Electro-optic properties of one-dimensional (1D) nonlinear perfect photonic crystals based on Lithium tantalate layer. Optik 2022, 265, 169537. [Google Scholar] [CrossRef]
- Singh, S.; Remeika, J.P.; Potopowicz, J.R. Nonlinear optical properties of ferroelectric lead titanate. Appl. Phys. Lett. 1972, 20, 135–137. [Google Scholar] [CrossRef]
- Cho, H.; Lee, D.; Hong, S.; Kim, H.; Jo, K.; Kim, C.; Yoon, I. Surface Modification of ZrO2 Nanoparticles with TEOS to Prepare Transparent ZrO2@SiO2-PDMS Nanocomposite Films with Adjustable Refractive Indices. Nanomaterials 2022, 12, 2328. [Google Scholar] [CrossRef]
- Shakoury, R.; Khanlary, M.R.; Sadeghi, M.; Kamali, S.H. Ion beam assisted electron gun deposition of MgF2 thin films: Effects of Argon ion bombardment on the optical and morphological properties. Vakuum Forschung und Praxis 2022, 34, 36–40. [Google Scholar] [CrossRef]
- Erdbrügger, U.; Blijdorp, C.J.; Bijnsdorp, I.V.; Borràs, F.E.; Burger, D.; Bussolati, B.; Byrd, J.B.; Clayton, A.; Dear, J.W.; Falcón-Pérez, J.M.; et al. Urinary extracellular vesicles: A position paper by the Urine Task Force of the International Society for Extracellular Vesicles. J. Extracell. Vesicles 2021, 10, e12093. [Google Scholar] [CrossRef]
- Sung, P.S.; Huang, T.F.; Hsieh, S.L. Extracellular vesicles from CLEC2-activated platelets enhance dengue virus-induced lethality via CLEC5A/TLR2. Nat. Commun. 2019, 10, 2402. [Google Scholar] [CrossRef]
- Marimpietri, D.; Airoldi, I.; Faini, A.C.; Malavasi, F.; Morandi, F. The role of extracellular vesicles in the progression of human neuroblastoma. Int. J. Mol. Sci. 2021, 22, 3964. [Google Scholar] [CrossRef]
- Parimala Devi, M.; Awasthi, S.K.; Alipour-Banaei, H.; Nambi, R. Refractive index EV sensor based on conventional and mirror image 1D defective photonic crystal designs: Theoretical study. J. Comput. Electron. 2022, 21, 1404–1415. [Google Scholar] [CrossRef]
- Matar, Z.S.; Al-Dossari, M.; Awasthi, S.K.; Abd El-Gawaad, N.S.; Hanafy, H.; Amin, R.M.; Fathy, M.I.; Aly, A.H. Theoretical Study on Polycarbonate-Based One-Dimensional Ternary Photonic Structures from Far-Ultraviolet to Near-Infrared Regions of Electromagnetic Spectrum. Crystals 2022, 12, 642. [Google Scholar] [CrossRef]
- He, L.; Özdemir, Ş.K.; Zhu, J.; Kim, W.; Yang, L. Detecting single viruses and nanoparticles using whispering gallery microlasers. Nat. Nanotechnol. 2011, 6, 428–432. [Google Scholar] [CrossRef]
Disclaimer/Publisher’s Note: The statements, opinions and data contained in all publications are solely those of the individual author(s) and contributor(s) and not of MDPI and/or the editor(s). MDPI and/or the editor(s) disclaim responsibility for any injury to people or property resulting from any ideas, methods, instructions or products referred to in the content. |
© 2023 by the authors. Licensee MDPI, Basel, Switzerland. This article is an open access article distributed under the terms and conditions of the Creative Commons Attribution (CC BY) license (https://creativecommons.org/licenses/by/4.0/).