Abstract
The photocatalytic proprieties of TiO2/FeO3 and TiO2/WO3 nanocomposites have been investigated using methylene blue as a pollutant. We propose a non-conventional approach for material preparation, i.e., the Doctor Blade technique, which is an easy and inexpensive method for coating materials. Several drawbacks related to the use of powders can be alleviated by using solid substrates, and this deposition method allows us to take advantage of the high surface area of nanoparticles, avoiding dispersion in the solution. The possibility of coating a material with a photoactive molecule with an easy and inexpensive method leads to the use of photocatalysis in the real world. The structural, optical, and textural characterizations of these materials were carried out using UV-vis. Diffuse Reflectance Spectroscopy (DRS) was used to calculate the energy band gap with the Kubelka-Munk method, and N2 absorption-desorption measurements were used to study the exposed surface area (SBET). The photocatalytic activity was evaluated in nanocomposites containing 0.1/0.2/0.3/0.5 wt.% of Fe2O3 or WO3 or both Fe2O3 and WO3. An enhancement of about 60% was achieved by adding 0.2% wt. of WO3 after 2 h of exposure to UV light. The TiO2@Fe2O3 and TiO2@WO3/Fe2O3 mixtures showed the same behavior as the TiO2@WO3 mixture. Therefore, the photoactivity of these photocatalysts is not related to the oxide itself. These solid results are due to the energy band structure of the materials. In fact, there is an important band matching among TiO2, WO3, and Fe2O3, which gives these nanocomposites a substantial improvement in photodegradation. The pH evaluated was neutral pH both at the beginning and at the end of the experiment, which is consistent with the well-known photodegradation pathway of methylene blue.
1. Introduction
In two decades, heterogeneous photocatalysis using a semiconductor material has been an increasingly interesting field due to the potential use of solar radiation as a driving force for photochemical conversion [1]. The range of applications covers everything from the environment, such as treating air and water, to energy with solar cells, and even to health through antibacterial therapies. Today, there is growing pollution, contamination of soil, and climate change is becoming more important than ever. Therefore, to solve these problems, photocatalysis is one of the greenest and most promising approaches for both water splitting and wastewater remediation [2,3,4].
Cleaning and sanitizing water is one of the most important issues we face. It is considered the sixth of the seventeenth goal to be achieved in the Sustainable Development Agenda of the UN (United Nations). The development of new materials for environmental remediation and water purification has become important due to the emergence of new pollutants such as antibiotics, drugs, and microplastics. These pollutants are closely linked to wastewater, and it is widely known that they are becoming a hazard due to their persistence in the environment. Photocatalytic degradation of organic pollutants based on semiconductors is an interesting technology to be explored. Among all the materials examined, titanium dioxide (TiO2) stands out as one of the best for its excellent photocatalytic properties, long-term chemical stability, high corrosion resistance, and easy preparation [5]. Nevertheless, new materials with excellent photocatalytic properties have been studied over the past few years. Furthermore, 2D materials such as graphene oxide, MoS2, and especially g-C3N4 can be employed as photocatalysts [6]. Recent studies have shown that doped lanthanide can also be used as a photocatalyst [7], but such materials are expensive and are found in very low concentrations in the environment. Therefore, TiO2 still remains one of the best photocatalysts when it comes to earth abundance, stability, and raw photocatalytic performance. The principal parameter to consider is the redox potential of both the valence and conduction bands. Indeed, after the absorption of light, electrons become excited to the conduction band, creating an electron-hole pair. These charges “induce” redox reactions, generating reactive radicals that drive photodegradation.
Unfortunately, two important drawbacks limit the use of titanium dioxide: Firstly, its fast charge recombination, which significantly decreases its photocatalytic activity [2,3], and secondly, its light absorption is confined only to the UV region [2,3], which does not allow it to absorb most of the solar spectrum, which is essential for sustainable application. However, although reducing the band gap will cause the system to absorb more under sunlight, the redox potentials also change, shrinking the oxidation power (or the reducing power) of the material. There are two main strategies to overcome the limitations of titanium dioxide and to improve the efficiency of TiO2-based materials as photocatalysts:
- Doping with transition metals or non-metals [8,9,10,11,12,13,14,15].
- Fabricating nanocomposites with other semiconductors, noble metals, and/or co-catalysts [6,7,8,9,10,11,12,13].
There are many ways to synthesize or prepare a TiO2-based nanocomposite. There can be both chemical and physical synthetic pathways. Sol-gel synthesis or electrodeposition are chemical (or electrochemical) pathways [16,17]. Thermal annealing from precursors is a physical pathway. Furthermore, nanocomposites can be prepared without synthesizing each component, but just by mixing the oxides using commercial powders and then annealing them at a high temperature.
In this work, we prepared TiO2 nanocomposites by adding Fe2O3 and WO3 to TiO2 and sintering them through a long annealing process. These materials were characterized in terms of their exposed surface area, pore size, and band gap energies. Surface area and pore size characterization were performed on powders. Instead, band gap energies characterization was carried out on thin films after the deposition on a glass substrate using the Doctor Blade technique. The photocatalytic tests were evaluated using methylene blue as a pollutant dye. The nanocomposites had photocatalytic efficiency under UV irradiation compared to the bare nanostructured TiO2. The easy preparation, combined with their versatility, can be a great way to follow up on attempts to improve wastewater treatment.
2. Materials and Methods
The samples were prepared starting from commercial TiO2 powder (100% in anatase phase), WO3 powders, and Fe2O3 NPs powders (Merck company). The following set of samples were prepared:
- TiO2 + 0.1/0.2/0.3/0.5 wt.% WO3.
- TiO2 + 0.1/0.2/0.3/0.5 wt.% Fe2O3.
- TiO2 + 0.1% wt.% WO3 + 0.1/0.2/0.3/0.5 wt.% Fe2O3
- TiO2 + 0.2% wt.% WO3 + 0.1/0.2/0.3/0.5 wt.% Fe2O3
- TiO2 + 0.3% wt.% WO3 + 0.1/0.2/0.3/0.5 wt.% Fe2O3
- TiO2 + 0.5% wt.% WO3 + 0.1/0.2/0.3/0.5 wt.% Fe2O3
The nanocomposites were prepared through the procedure schematically described in Figure 1. The mixture—0.5 g of TiO2 and the 0.1/0.2/0.3/0.5 wt.% WO3 or Fe2O3, or both—was placed in a mortar and the powders were pestled to mix them well. Then, the mixture of powders was placed in a covered quartz holder and then annealed in a muffle furnace at 700 °C, for 12 h. After this first annealing, we produced the TiO2-based paste and deposited it using the Doctor Blade procedure. Briefly, we added to the mixed powders 0.1 mL of acetylacetone in 1 mL of water and 1 drop of Triton X-100. Then, this mixture was pestled to homogenize all the components; meanwhile, a 1.7 mL of water dropwise was added. This suspension was then deposited by rolling the paste on a corning glass substrate (almost 1 × 1 cm2), previously taped with a layer on both sides, following step by step the Doctor Blade technique. Then, it was placed in a covered quartz holder and annealed in a muffle furnace at 400 °C, for 2 h.
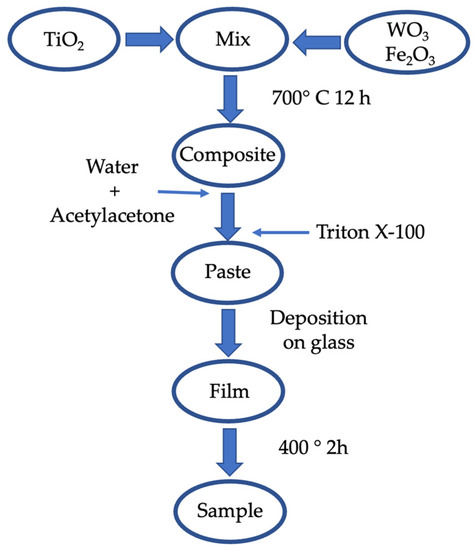
Figure 1.
Preparation procedure scheme of TiO2-based materials.
In a preliminary experiment, we tested the effect of thermal annealing on the as-received TiO2. Then, titanium dioxide (0.5 g) was placed in a covered quartz holder and annealed in a muffle furnace. The annealing was carried out in a temperature range of 700–900 °C, for 12 h.
The textural properties of the specimens were analyzed by nitrogen adsorption-desorption analysis with a Tristar II (Micrometrics). To determine the exposed surface area and the pore size distribution, we used the Braunauer-Emmet-Teller (BET) and the Barret Joyner and Halenda (BJH) methodologies, respectively. Surface (SBET), Dp (Pore diameter), and Vp (Pore volume) were measured.
The optical properties were performed on the thin film coated on a glass surface through UV-vis DRS (Diffuse Reflectance Spectroscopy) using a Lambda 40 Perking-Elmer spectrophotometer equipped with an integration sphere in the wavelength range 350–550 nm. The energy band gaps were estimated according to the Kubelka-Munk theory and Tauc plot analysis.
The structural properties were performed on the powders using the Raman technique, using an HR800 integrated system Horiba Jobin Yvon.
To estimate the photocatalytic activity of the powders, 5 mg of the photocatalyst was suspended in 15 mL of methylene blue solution (1.8 × 10⁻⁵ M). The suspension was placed in the dark for 90 min in order to establish the adsorption-desorption equilibrium with the photocatalyst surface. In our tests, the operative temperature was 25 °C, whereas the pH solution was about 7. In dark conditions, every specimen reached the adsorption-desorption equilibrium after 90 min, having less than 5% adsorption of the pollutant. The photocatalytic properties were studied using a UWAVE LED UV lamp system, with an emission centered at 365 nm and an irradiance of 10 mW/cm2. The irradiated solution was measured at regular time intervals, with a UV-Vis spectrophotometer (Lambda 45, Perkin—Elmer). The degradation of the MB was evaluated by the absorbance peak at 664 nm in the Lambert-Beer regime and by reporting C/C0 value as function of time. C is the concentration at time t, C0 is the concentration at t0, the starting value. The lamp was turned on, and an aliquot of the suspension was withdrawn every 30 min. The kinetic constant was calculated, in accordance with the literature, following a first order reaction (Equation (1)):
where “C” is the concentration of the pollutant at a certain time during the experiment. “C0” is the concentration of the pollutant at t = 0. While “t” is the time.
k = −ln(C/C0) × t−1
To avoid scattering phenomena, every aliquot was centrifugated for 3 min at 32,000 rpm.
3. Results and Discussion
3.1. TiO2-Based Materials Characterization
To begin with, the behavior of TiO2 powder was studied after thermal treatment at different temperatures. As previously reported, to optimize the properties of the materials, TiO2 powder was annealed at 700 °C, 800 °C, and 900 °C. Surface properties and photocatalytic characterizations were carried out. Table 1 summarizes the properties of the specimens determined by the nitrogen absorption-desorption measurements. SBET shows a significant decrease by increasing the annealing temperature. Pristine TiO2 shows 57.0 m2g−1, whereas samples annealed at 900 °C have a value of 0.7 m2g−1. The decrease in the surface area by increasing the temperature is due to the sintering of TiO2 NPs triggered by the thermal treatments. Samples annealed at 700 °C showed a surface area of 15 m2g−1.

Table 1.
Textural properties of exanimated samples.
In addition, structural characterizations were carried out. Figure 2 shows the Raman spectra of the TiO2 annealed at different temperatures to investigate whether the thermal process led to a phase change. All of the examined samples were in the anatase phase; the annealing did not lead to a phase change. This phenomenon could be due to the stability of the commercial powders already in the anatase phase.
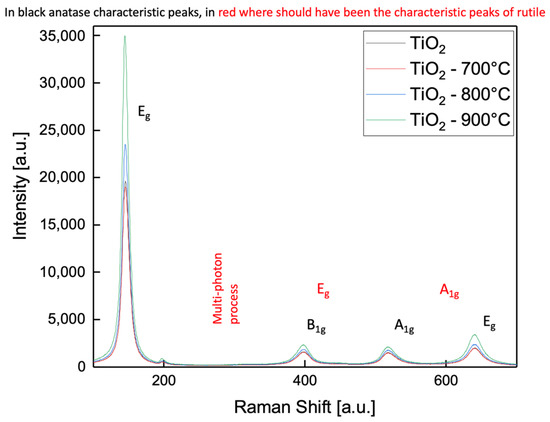
Figure 2.
Raman spectra of commercial TiO2 annealed at different temperatures.
Furthermore, a photocatalysis study of TiO2 powders annealed at several temperatures was conducted to understand the effect of the surface area on the activity of these powders. The concentration of the dye as a function of time is reported in Figure 3. Negative times (greyish region) indicate the period with the light switched off. In dark conditions, every specimen reaches the adsorption-desorption equilibrium after 90 min, having less than 5% adsorption of the pollutants. The best degradation rate was obtained with the powder annealed at 700 °C.
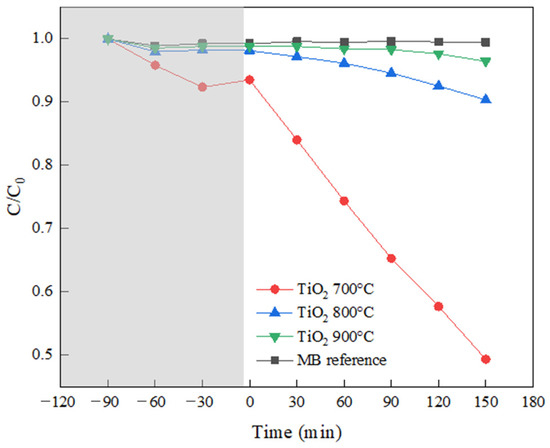
Figure 3.
Methylene Blue photo-degradation on TiO2 powders annealed at several temperatures. The experiments were conducted three times with an error below 1%.
The previous result agrees with the surface BET analysis; in fact, the sample annealed at 700 °C shows a higher surface area (15 m2g−1) than the samples annealed at 800 °C and 900 °C (2.6 and 0.7 m2g−1, respectively). The higher the exposed surface, the higher the degradation rate.
The thermal treatment was accomplished at 700 °C for the preparation of nanocomposites as well. Then, the samples were characterized using the BET technique. Table 1 reports the surface area SBET of the annealed samples determined by nitrogen absorption-desorption measurements. We reported, for comparison purposes, the surface area of pristine Fe2O3 and pristine WO3 samples. The surface area of Fe2O3 and WO3 was 32.4 m2g−1 and 2.3 m2g−1 for pristine, respectively. These measurements were compared with pristine TiO2 (57 m2g−1). Surprisingly, although these oxides had a lower BET surface area than the pristine titanium dioxide before annealing, when they were mixed with TiO2 and annealed at 700 °C, a higher BET surface area was obtained compared to the annealed at 700 °C TiO2. Indeed, the TiO2 annealed at 700 °C had a BET surface area of 15 m2g−1, while the TiO2 + Fe2O3 (0.3%) showed an area of 17.5 m2g−1 and TiO2 + WO3 (0.3%) showed a BET area of 20.1 m2g−1. The mean pore diameter and pore volume showed the same behavior. This result can be attributed to different sintering processes during the thermal treatment at 700 °C. Indeed, grains of different materials (TiO2, WO3, and Fe2O3) have different structures, and these structures influence the efficiency of the sintering (merging) process between different nanoparticles during annealing. The less efficient sintering—which was achieved with the nanocomposites—leads to a higher surface area, and thus to a smaller particle with the advantage of the photocatalysis process.
All the samples prepared by the Doctor Blade method were characterized by the UV-vis DRS technique. The spectra of bare TiO2 and nanocomposites containing 0.3% of WO3, Fe2O3, and both (WO3 and Fe2O3) are shown in Figure 4. In the low wavelength range (<420 nm), the energy band gap (Eg) was evaluated by Kubelka-Munk function and Tauc plot [18]. The fits are shown in the inset.
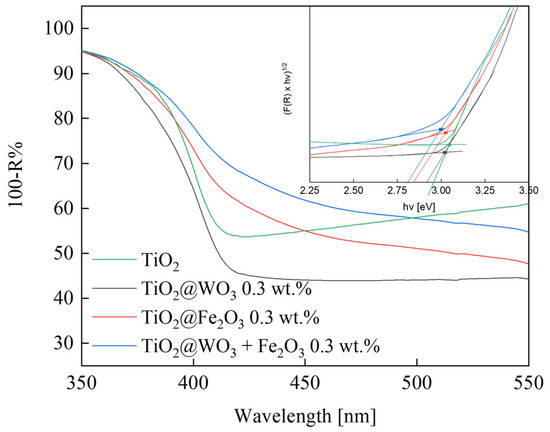
Figure 4.
UV-vis spectrum of TiO2 and nanocomposites based on TiO2. Tauc plot of analyzed samples in the inset.
Table 2 reports the estimated Eg values of all the samples. The energy band gap estimated for these samples shows small variations. An accurate analysis of the spectra reveals that some samples (containing Fe2O3 at 0.2% and 0.3%) present a small feature related to a sub-bandgap absorption edge in the visible range. The value of this adsorption edge is reported in brackets (2.71 and 2.66) in the same Table 2. This absorption is related to the presence of Fe2O3, and it could be due to an intrinsic absorption of the Fe2O3, to a charge transfer between TiO2 and Fe2O3 [19], or to the intra-bandgap states due to the doping with Fe.
Table 2.
Estimated energy band gap (Eg).
3.2. Photodegradation Results
Photodegradation measurements for the methylene blue removal were carried out for all the deposited samples. The MB concentration ratio as a function of time is reported in Figure 5a for some samples, while the degradation rates Γ (min−1) of all the nanocomposites are reported in Figure 5b as a function of WO3 or Fe2O3 (or both). These results are peculiar, increasing the quantity of both WO3 and Fe2O3 up to 0.2 wt.%, the degradation rate increases, whereas at higher concentrations, the degradation rate decreases. The highest photodegradation rate was obtained in TiO2/WO3 samples, where an increase of about 60% was measured. The mix of WO3 or Fe2O3 surprisingly showed the same behavior.
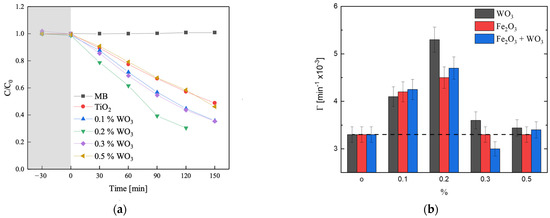
Figure 5.
(a) Methylene blue photodegradation; (b) Histogram of photodegradation rate of nanocomposites as a function of concentration.
A study on the reproducibility of the deposited specimens was conducted to understand if depositing via Doctor Blade was a viable method. The photodegradation rate of all the deposited samples was the same, within the experimental error.
The increase in photocatalytic activity of TiO2 due to the fabrication of nanocomposites is peculiar. To begin with, we noticed that photoactivity was not influenced by the type of oxide we used. Indeed, the same results with Fe and W oxides were obtained. In TiO2, W (W6+) is considered a donor dopant [20], while Fe (Fe3+) is considered an acceptor [21]; the behavior found in the nanocomposites was similar. Therefore, we can state that doping does not influence the photocatalysis of the nanocomposites. In our system, we sintered nanoparticles by heating treatment, realizing a sintered nanocomposite. The nanocomposites, with the same concentration of W and Fe oxide, showed the same behavior in the photodegradation of MB. To explain this behavior, we considered the schematic band structure reported in Figure 6.
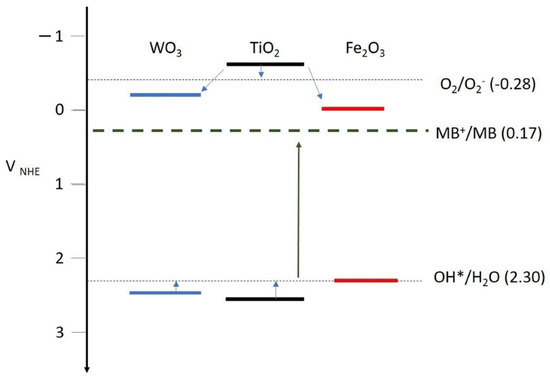
Figure 6.
TiO2, Fe2O3, and WO3 band energy schemes.
In Figure 6, the conduction band (CB) and the valence band (VB) edges of TiO2, Fe2O3, and WO3 are reported. Anatase TiO2 has a CB and VB at −0.6 and 2.6 VNHE, Fe2O3 at −0.01, and 2.3 VNHE and WO3 at −0.2 and 2.6 VNHE [22,23]. Note that the CB and VB of Fe2O3 and WO3 are both “inside” the TiO2 energy gap, so we can speculate that the behavior could be similar. The band alinement suggests that electrons can be transferred to O2, and also to Fe2O3 and WO3. The additional transfer to Fe2O3 and WO3 introduces a new scavenging channel for electrons, allowing TiO2 to transfer more holes to molecular species in the solution in order to achieve electro-neutrality. On the other hand, the photoinduced holes in the nanocomposites can be trapped by the hydroxyl groups, resulting in OH radicals. Indeed, the VBs of TiO2, Fe2O3, and WO3 are at higher (or equal) potential values than the OH*/H2O redox potential (2.3 VNHE) [3], so they are able to induce the transfer of the holes to the hydroxyl ion in solution. The oxidation of methylene blue subsequently occurs because the R-(CH3)2+ groups of MB are combined with the hydroxyl groups. After all, the MB+/MB redox potential (0.17 VNHE) is smaller than the OH*/H2O redox potential [24]. This leads to the degradation of methylene blue [25]. However, when the amount of Fe2O3 and WO3 increases in TiO2 beyond 0.2%, Fe2O3 and WO3 act as a recombination pathway spoiling the beneficial effect of the electron scavenging.
4. Conclusions
Titanium dioxide nanocomposites with Fe2O3 and WO3 were fabricated by mixing powders and allowing sintering for 12 h at 700 °C. Nanocomposites with different wt.% of Fe2O3 and WO3 were prepared. We produced the nanocomposite film via the Doctor Blade method to take advantage of the high exposed surface area of the nanoparticles, avoiding dispersion in the solution. The energy band gap determined by UV-vis DRS spectra was slightly changed by changing the nanocomposite composition. The structural, optical, and textural characterizations of the materials were carried out by UV-vis Diffuse Reflectance Spectroscopy (DRS) and N2 absorption-desorption measurements. The results showed that the fabrication method led to a higher exposed surface area of the annealed nanocomposite compared to the annealed TiO2.
Furthermore, the photodegradation of methylene blue—under UV irradiation—was accomplished to investigate the photocatalytic behavior of titanium dioxide-based materials. An improvement in efficiency of about 60% was estimated by adding a concentration of FeO3 or WO3 as low as 0.2%, while at a high value, the degradation was the same as that of bare TiO2 film. Therefore, the photoactivity of these photocatalysts is not related to the oxide itself. These solid results are due to the energy band structure of the materials. In fact, there is an important band matching among TiO2, WO3, and Fe2O3, which gives these nanocomposites a substantial improvement in photodegradation. The pH evaluated at the beginning of the experiment and at the end was close to neutral pH for both, this result is consistent with the well-known photodegradation pathway of methylene blue.
Author Contributions
Conceptualization, F.G. and L.C.; methodology, F.G. and M.Z.; validation, L.C.; formal analysis, F.G.; data curation, F.G. and M.Z.; writing-original draft preparation, F.G. and L.C.; writing-review and editing, F.G., M.Z. and G.P.E.; visualization, L.C.; supervision, L.C. All authors have read and agreed to the published version of the manuscript.
Funding
This research received no external funding.
Data Availability Statement
The data present in this study are available on request from corresponding author.
Conflicts of Interest
The authors declare no conflict of interest.
References
- Fox, M.A.; Dulay, M.T. Heterogeneous Photocatalysis. Chem. Rev. 1993, 93, 341–357. [Google Scholar] [CrossRef]
- Hashimoto, H.; Irie, H.; Fujishima, A. Photocatalysis: A Historical Overview and Future Prospects. Jpn. J. Appl. Phys. 2005, 44, 8269–8285. [Google Scholar] [CrossRef]
- Fujishima, A.; Zhang, X.; Tryk, A. TiO2 photocatalysis and related surface phenomena. Surf. Sci. Rep. 2008, 63, 515–582. [Google Scholar] [CrossRef]
- Miyauchi, M.; Irie, H.; Liu, M.; Qiu, X.; Yu, H.; Sunada, K.; Hashimoto, K. Visible-Light-Sensitive Photocatalyst: Nanocluster-Grafted Titanium Dioxide for Indoor Environmental Remediation. J. Phys. Chem. Lett. 2016, 7, 75–84. [Google Scholar] [CrossRef] [PubMed]
- Cacciato, G.; Zimbone, M.; Ruffino, F.; Grimaldi, M.G. TiO2 nanostructures and nanocomposites for sustainable photocatalytic water purification. In Green Nanotechnology—Overview and Further Prospects; Larramendy, M., Soloneski, S., Eds.; InTechOpen: London, UK, 2016; pp. 87–116. [Google Scholar]
- Kumar, O.P.; Shahzad, K.; Altaf Nazir, M.; Farooq, N.; Malik, M.; Ahmad Shah, S.S.; Ur Rehman, A. Photo-Fenton activated C3N4x/AgOy@Co1-xBi0•1-yO7 dual s-scheme heterojunction towards degradation of organic pollutants. Opt. Mater. 2022, 126, 112199. [Google Scholar] [CrossRef]
- Jamshaid, M.; Altaf Nazir, M.; Najam, T.; Ahmad Shah, S.S.; Khan, H.M.; Ur Rehman, A. Facile synthesis of Yb3+-Zn2+ substituted M type hexaferrites: Structural, electric and photocatalytic properties under visible light for methylene blue removal. Chem. Phys. Lett. 2022, 805, 139939. [Google Scholar] [CrossRef]
- Sanz, R.; Buccheri, A.M.; Zimbone, M.; Scuderi, V.; Amiard, G.; Impellizzeri, G.; Romano, L.; Privitera, V. Photoactive layered nanocomposites obtained by direct transferring of anodic TiO2 nanotubes to commodity thermoplastics. Appl. Sur. Sci. 2017, 399, 451–462. [Google Scholar] [CrossRef]
- Hardscale, F.D. Raman Spectroscopy of Titania (TiO2) Nanotubular Water-Splitting Catalysts. J. Ark. Acad. Sci. 2011, 65, 43–48. [Google Scholar]
- Li, Y.; Xiang, Y.; Peng, S.; Wang, X.; Zhou, L. Modification of Zr-doped titania nanotube arrays by urea pyrolysis for enhanced visible-light photoelectrochemical H2 generation. Electrochim. Acta 2013, 87, 794–800. [Google Scholar] [CrossRef]
- Huang, Y.; Zhu, G.; Zou, K.; Tian, F.; Yadav, T.P.; Xu, H.; Yang, G.; Li, H.; Qu, L. Highly efficient removal of organic pollutants from wastewater using a recyclable graphene oxide membrane intercalated with g-C3N4@TiO2-nanowires. J. Mol. Liq. 2021, 337, 116461. [Google Scholar] [CrossRef]
- Smith, A.T.; LaChance, A.M.; Zeng, S.; Liu, B.; Sun, L. Synthesis, properties, and applications of graphene oxide/reduced graphene oxide and their nanocomposites. Nano Mater. Sci. 2019, 1, 31–47. [Google Scholar] [CrossRef]
- Diao, Y.; Yan, N.; Li, X.; Zhou, C.; Peng, B.; Chen, H.; Zhang, H. In-situ grown of g-C3N4/Ti3C2/TiO2 nanotube arrays on Ti meshes for efficient degradation of organic pollutants under visible light irradiation. Colloids Surf. A Physicochem. Eng. Asp. 2020, 594, 124511. [Google Scholar] [CrossRef]
- Sanzone, G.; Zimbone, M.; Cacciato, G.; Ruffino, F.; Carles, R.; Privitera, V.; Grimaldi, M.G. Ag/TiO2 nanocomposite for visible light-driven photocatalysis. Superlattices Microstruct. 2018, 123, 394–402. [Google Scholar] [CrossRef]
- Vu, T.P.T.; Tran, D.T.; Dang, V.C. Novel N,C,S-TiO2/WO3/rGO Z-scheme heterojunction with enhanced visible-light driven photocatalytic performance. J. Colloid Interface Sci. 2022, 610, 49–60. [Google Scholar] [CrossRef]
- Mei, Q.; Zhang, F.; Wang, N.; Yang, Y.; We, R.; Wang, W. TiO2/Fe2O3 heterostructures with enhanced photocatalytic reduction of Cr(VI) under visible light irradiation. RCS Adv. 2019, 9, 22764. [Google Scholar] [CrossRef] [PubMed]
- Reyes-Gil, K.R.; Stephens, Z.D.; Stavila, V.; Robinson, D.B. Composite WO3/TiO2 Nanostructures for High Electrochromic Activity. ACS Appl. Mater. Interfaces 2015, 7, 2202–2213. [Google Scholar] [CrossRef] [PubMed]
- Makula, P.; Pacia, M.; Macyk, W. How to Correctly Determine the Band Gap Energy of Modified Semiconductor Photocatalysts Based on UV−Vis Spectra. J. Phys. Chem. Lett. 2018, 9, 6814–6817. [Google Scholar] [CrossRef]
- Liu, M.; Qiu, X.; Miyauchi, M.; Hashimoto, K. Energy level matching of Fe(III) ions grafted at surface and doped in bulk for efficient. J. Am. Chem. Soc. 2013, 135, 10064–10072. [Google Scholar] [CrossRef]
- Yu, H.; Irie, H.; Hashimoto, K. Conduction Band Energy Level Control of Titanium Dioxide: Toward an Efficient Visible-Light-Sensitive Photocatalyst. J. Am. Chem. Soc. 2010, 132, 6898–6899. [Google Scholar] [CrossRef]
- Nowotny, M.K.; Sheppard, L.R.; Bak, T.; Nowotny, J. Defect Chemistry of Titanium Dioxide. Application of Defect Engineering in Processing of TiO2-Based Photocatalysts. J. Phys. Chem. C 2008, 112, 5275–5300. [Google Scholar] [CrossRef]
- Tamirat, A.G.; Rick, J.; Dubale, A.A.; Su, W.N.; Hwang, B.J. Using hematite for photoelectrochemical water splitting: A review of current progress and challenges. Nanoscale Horiz. 2016, 1, 243–267. [Google Scholar] [CrossRef]
- Lee, S.F.; Jimenez-Relinque, E.; Martinez, I.; Castellote, M. Photoelectrochemical global approach to the behavior of nanostructured anatase under different irradiation conditions. Catal. Today 2022, 397–399, 286–295. [Google Scholar] [CrossRef]
- Ju, H.; Zhou, J.; Cai, C.; Chen, H. The Electrochemical Behavior of Methylene Blue at a Microcylinder Carbon Fiber Electrode. Electroanalysis 1995, 7, 1165–1170. [Google Scholar] [CrossRef]
- Liu, B.; Wen, L.; Nakata, K.; Zhao, X.; Liu, S.; Ochiai, T.; Murakami, T.; Fujishima, A. Polymeric Adsorption of Methylene Blue in TiO2 Colloids—Highly Sensitive Thermochromism and Selective Photocatalysis. Chem. Eur. J. 2012, 18, 12705–12711. [Google Scholar] [CrossRef]
Disclaimer/Publisher’s Note: The statements, opinions and data contained in all publications are solely those of the individual author(s) and contributor(s) and not of MDPI and/or the editor(s). MDPI and/or the editor(s) disclaim responsibility for any injury to people or property resulting from any ideas, methods, instructions or products referred to in the content. |
© 2023 by the authors. Licensee MDPI, Basel, Switzerland. This article is an open access article distributed under the terms and conditions of the Creative Commons Attribution (CC BY) license (https://creativecommons.org/licenses/by/4.0/).