Article

Thermoluminescent and Dosimetric Properties of Zirconium Dioxide Ceramics Irradiated with High Doses of Pulsed Electron Beam

1
Department of Physics and Technology, Ural Federal University, 19 Mira Str., Yekaterinburg 620002, Russian Federation
2
Department of Technical Physics, L.N. Gumilyov Eurasian National University, 2 Satbaev Str., Astana 010008, Kazakhstan
3
Department of Materials Science, Engineering School, Tomsk Polytechnic University, 30 Lenin Ave., Tomsk 634050, Russian Federation
4
Budker Institute of Nuclear Physics, Siberian Branch Russian Academy of Sciences, 11 Acad. Lavrentiev Ave., Novosibirsk 630090, Russian Federation
5
Institute of Solid State Physics, University of Latvia, 8 Kengaraga Str., LV-1063 Riga, Latvia
*
Author to whom correspondence should be addressed.
Crystals 2023, 13(11), 1585; https://doi.org/10.3390/cryst13111585
Submission received: 5 October 2023 / Revised: 27 October 2023 / Accepted: 10 November 2023 / Published: 14 November 2023

Abstract

:
Thermoluminescent (TL) properties of monoclinic zirconium dioxide ceramics were studied in order to assess the possibility of their use for measuring high doses (on the order of kGy) of pulsed electron beams (130 keV). Two types of samples were used: those synthesized by sintering in an electric furnace at T = 700–1700 °C and those synthesized in a flow of high-energy electrons (1.4 MeV) with a high power density. Analysis of the X-ray diffraction patterns using the Scherrer method revealed that annealing of ceramics of the first type at T > 1000 °C leads to a significant increase in the size of crystallites, which correlates with a significant increase in the intensity of the TL peak at 390 K. Type 2 ceramics synthesized by the electron beam method have the maximum TL response. Using the peak shape analysis method, the kinetic parameters of TL (activation energy, frequency factor, and kinetic order) were calculated. This study marks the first instance of establishing the patterns of influence of synthesis conditions and crystallite size on their values. The presence of an intense isolated TL peak, the sublinear nature of most dose dependencies, and negligible fading indicate the promise of the ceramics synthesized in this work for measuring high doses (several to tens of kGy).

1. Introduction

Ceramics based on zirconium dioxide (ZrO2) of different phase compositions are promising materials for use in various photonics, optoelectronics, and nanoelectronics devices [1]. They are characterized by several properties valuable for use in these areas: high chemical and photochemical stability, mechanical and thermal stability, and a high refractive index. In this regard, opportunities arise for their application as light-sensitive sensors, scintillators, and thermoluminescent (TL) detectors for ionizing radiation [2,3]. Moreover, for the detection of high doses of radiation (more than 100 Gy), ultrafine ceramics with crystal sizes ranging from tens to hundreds of nanometers are the most promising due to their enhanced radiation resistance [4,5].
To obtain ultrafine ceramics from nanopowders, various methods of high-temperature sintering are used, which are classified depending on the applied pressure, synthesis atmosphere, etc. With increasing annealing temperatures, the diffusion mobility of ceramic material components increases, leading to an accelerated recrystallization process of nanoparticles [6]. It is known that the luminescent properties of ceramic materials based on zirconium dioxide significantly depend on the synthesis method and the morphological state of the samples [7,8,9,10,11,12]. The patterns of changes in the luminescent properties of ZrO2 ceramics depending on the annealing temperature and crystallite size have been studied by other authors [13,14,15,16]. It should be noted that a targeted study of the effect of crystallite size in ceramics of nominally pure monoclinic zirconium dioxide on the entire complex of their TL properties has not been conducted. At the same time, there is practically no data in the literature on the effect of annealing temperature and nanoparticle size on the most important dosimetric characteristics (TL dose dependence and fading). In practical terms, such information would be useful for choosing optimal conditions for the synthesis of ceramics in order to obtain samples with the best dosimetric characteristics (maximum sensitivity to the test dose of ionizing radiation, linear dose dependence of TL, minimal fading).
Along with traditional methods of sintering ceramics by heating in furnaces, radiation-based synthesis methods show great promise [17,18,19]. The authors of [20] developed a method for producing ceramics based on refractory materials by sintering powders in the field of a powerful flow of high-energy electrons. The electron beam synthesis method was successfully implemented to obtain ceramics based on MgF2: W, YAG: Ce, MgO [20]. Ceramics were synthesized by direct exposure of the fast electron flux to powders of fluorides and metal oxides in less than 1 s. A special feature of this method is that, in addition to thermal processes, ionization processes play a major role in the synthesis of ceramics, causing the decay of electronic excitations into primary radiolysis products and the occurrence of reactions between them. The advantages of the method include high productivity (about 2 g/s in laboratory conditions), as well as the absence of the need to add any substances and additional technological operations, which are typically used in the traditional synthesis method to facilitate the formation of a new phase. In this regard, an important task is to determine the possibility of synthesizing ZrO2 ceramics by the electron beam method and to compare their TL and dosimetric properties with ceramics obtained by the traditional method of sintering in an electric furnace.
The investigation of the thermoluminescent properties of zirconium dioxide ceramics irradiated with high doses (approximately 1–10 kGy) of low-energy pulsed electron beams (100–300 keV) is of particular interest. These beams are used in radiation technologies, particularly for surface sterilization of food products and medical instruments, as well as in scientific research [21]. It should be noted that the problem of developing commercial TL detectors for these radiations has not yet been solved and is an urgent scientific problem.
Thus, the objective of this study is to explore the TL and dosimetric properties of ZrO2 ceramics synthesized by various methods and irradiated with high doses of a pulsed electron beam.

2. Materials and Methods

The objects of this study were ceramics of zirconium dioxide, manufactured from nanopowder with particle sizes ranging from 80 to 140 nm. The powder was provided by ORMET company (Yekaterinburg, Russian Federation). According to the manufacturer’s data, the mass fraction of impurities in the powder did not exceed 1%. The ceramic samples were synthesized using two different methods.
Type 1 ceramics were produced by thermal sintering of pellets with a diameter of 5 mm and a thickness of 1 mm, obtained from nanopowder by uniaxial cold pressing at a specific pressure of 120 MPa on a manual hydraulic press PRG-1. For the preparation of one pellet, 65 g of powder were taken. Weighing was carried out on AND HR-100A electronic laboratory scales (AND Company Limited Higashi-Ikebukuro, Toshima-ku, Tokyo, Japan). The obtained pellets were heated in air for 1 h at temperatures ranging from 700 to 900 °C in a SNOL muffle furnace, and at T = 1000–1700 °C in a Generaltherm LHT 04.1800 chamber furnace.
Type 2 ceramics were obtained by the electron-beam synthesis method using the ELV-6 electron accelerator (BINP SB RAS, Novosibirsk, Russian Federation). The initial nanopowders were placed in a copper crucible, which was exposed to an electron beam with an energy of 1.4 MeV and a power density of 23 kW/cm2. The beam scanned the crucible with powder at a speed of 1 cm/s. The cross-sectional area of the beam on the crucible surface was approximately 1 cm2. The ceramics synthesized by this method looked like opaque plates. To carry out TL measurements, the plates were cut into irregularly shaped pieces weighing 0.03 g.
X-ray phase analysis of the samples was performed using the XRD-7000 X-ray diffractometer (Shimadzu Corporation, Kyoto, Japan), equipped with an X-ray tube with a copper anode. Quantitative phase analysis was carried out using the full-profile Rietveld method with the X’Pert HighScore Plus software, version 2.2c, PANalytical, The Netherlands). No special sample preparation was conducted for XRD analysis. Samples in the form of tablets were used, as in other experiments.
To excite the TL, an electron beam from the RADAN-EXPERT accelerator was used (pulse duration 2 ns, average electron energy (130 ± 1) keV, current density 60 A/cm2). In this case, the absorbed dose from one accelerator pulse was 1.5 kGy. The reproducibility of the irradiation dose of the samples was ensured by maintaining a constant distance from the electron gun of the RADAN-EXPERT accelerator to the location of the sample. The sample on the stage was always located in the same place. The random error of the radiation dose did not exceed 10%. TL was recorded using a FEU-130 with a spectral sensitivity range of 200 to 600 nm. Heating was carried out from 325 to 525 K at a constant rate of 2 K/s. A comparative analysis of TL intensities for different ceramic samples was performed, considering the correction for their mass value.

3. Results and Discussion

The determination of the phase composition of ZrO2 ceramics synthesized under various conditions was carried out by X-ray diffraction analysis. Figure 1 shows X-ray diffraction patterns of samples of type 1, annealed at different temperatures, and ceramics of type 2. Analysis of the obtained data revealed that all examined samples consist 100% of the monoclinic ZrO2 phase. This phase is specifically characterized by three most intense reflections corresponding to the crystallographic planes (−1 1 1), (1 1 1), and (0 0 2) (JCPDS 13-0307).
From Figure 1, it is evident that with the increase in sintering temperature in type 1 ceramics, there is an increase in the intensity of diffraction reflections, which is associated with an increase in the degree of crystallinity of the samples. Type 2 ceramics are characterized by significantly smaller diffraction peak values, indicating substantial disordering of the crystal structure in samples subjected to high-energy radiation exposure.
Based on the results of X-ray diffraction measurements, the size of crystallites in the synthesized ceramics was assessed. Their sizes were calculated from the broadening of the peaks in the diffraction patterns using the Scherrer formula [22] under the assumption of spherically symmetric particles. The calculations were based on the full width at half-maximum of the most intense reflection at 28.28°, corresponding to Miller indices (−1 1 1). Figure 2 shows the dependence of the half-width of this reflection on the heating temperature. The results of calculating the crystallite size are presented in Figure 3. At T = 700–1000 °C, there were no significant changes in the half-width of the diffraction peak and the size of the crystallites. Further increases in synthesis temperature led to an enlargement of grain size to approximately 500 nm. The most intensive growth was observed at T = 1000–1300 °C.
The Scherrer method was also used to determine the crystallite size in type 2 ceramics synthesized by the electron beam method. The obtained value (approximately 100 nm), considering the measurement error, is practically indistinguishable from the crystallite size in the initial nanopowder. It is known that when implementing the method of electron beam synthesis of ceramics, the temperature of the sample can reach values of 1500 °C [20]. At this temperature, a significant increase in the crystallite size is observed in type 1 ceramics (Figure 3). This result indicates that in samples synthesized in the fast electron beam, despite the presence of high temperatures, the efficiency of recrystallization processes is significantly reduced compared to that of traditional sintering in a furnace, which preserves the original crystallite size. This fact can be explained by the significantly shorter duration of the nanopowder sintering process in the fast electron beam, which is generally characteristic of other radiation methods for ceramic synthesis [17].
Figure 4 presents the TL curves of the examined ceramics irradiated with a test dose of a pulsed electron beam (15 kGy). To eliminate the influence of TL from shallow traps, the samples after irradiation were kept for 30 s at T = 323 K. It can be seen from Figure 4 that all samples exhibit a TL peak at 390 K. In type 2 ceramics, a less intense peak at 480 K is also observed. TL maxima close in temperatures at 110 and 205 °C (383 and 478 K) were recorded in [23,24]. There is literature data on the connection between the nature of traps that cause the TL peak at 480 K and oxygen vacancies [23,24].
Figure 5 shows the dependence of the intensity of the TL maximum in the peak at 390 K on the synthesis temperature of type 1 ceramics. It can be observed that a sharp increase in intensity begins at T > 1000 °C, which correlates with the dynamics of crystallite size growth (Figure 3).
It is also evident from Figure 4 that the maximum TL intensity in the peak at 390 K is characteristic of samples of type 2 ceramics synthesized by the electron beam method. In these ceramics, its value is three times higher compared to the TL intensity in type 1 ceramics (1700 °C), which have significantly larger nanoparticle sizes (around 500 nm compared to 100 nm for type 2 ceramics). This result indicates that in type 2 ceramics, the determining role in the formation of the TL response is played not by the crystallite size but by the synthesis conditions. It is known that when oxide dielectrics are irradiated with high-energy electrons with a high power density, radiation-induced defects are formed in them [25,26]. It can be assumed that this effect also occurred in our ZrO2 samples. Such radiation defects can be oxygen vacancies and vacancy-impurity complexes, which form capture and luminescence centers responsible for the formation of the TL peak at 390 K. We believe that these defects already exist in small concentrations in the initial nanopowders that have not been subjected to high-temperature annealing. They could be formed during their synthesis. This is confirmed by the presence in the PL and TL spectra of a peak at 390 K of nanopowders with a luminescence band at 480 nm, associated with complex vacancy-impurity centers [24,27]. When irradiated with fast electrons at a high power density, the concentration of vacancy-impurity complex defects responsible for the formation of this band increased, which led to a significant increase in the TL peak at 390 K in type 2 samples. Indirect confirmation of the possibility of the formation of oxygen vacancies in samples synthesized by the electron beam method was the appearance of a new peak at 480 K, the connection of which, with vacancy-type defects, was discussed by several authors [23,24].
In type 1 samples annealed at high temperatures (1500–1700 °C), due to oxygen diffusion, a slight decrease in the concentration of vacancy-impurity defects may be observed. This effect requires a separate study using optical and EPR spectroscopy methods, which is beyond the scope of this work. However, it can already be argued that the leading role in the effect of increasing the TL intensity of type 1 samples during annealing is played by recrystallization processes, which cause an increase in the size of crystallites, and not by oxygen diffusion processes, which lead to the “healing” of oxygen vacancies.
We calculated the kinetic parameters of the TL peak at 390 K (activation energy E, frequency factor S, and kinetic order b) in samples synthesized under various conditions. The calculation was carried out by the TL peak shape method [28]. The calculation method was completely similar to that used in [29]. Three points of the TL curve were used: maximum at Tm, low- and high-temperature half-heights at T1 and T2. A half-width of the peak ω = T2 − T1, low-temperature half-width (τ = Tm − T1), and high-temperature half-width (δ = T2 − Tm) were taken into account in the calculations.
The calculation results are shown in Table 1 and in Figure 6, Figure 7 and Figure 8. It was observed that at T = 700–1000 °C, changes in the activation energy and frequency factor were within the experimental error (about 10%).
In this case, TL is described by first-order kinetics, which indicates the insignificant role of recapture of charge carriers in traps when the TL peak is illuminated at 390 K in ceramics synthesized at T < 1000 °C. At T = 1000–1200 °C, a significant increase in the values of E and S was observed (by 0.3 eV and four orders of magnitude, respectively). Concurrently, the order of kinetics increased to 1.6. It should be noted that at T > 1000 °C, a sharp increase in the size of crystallites in the studied samples began (Figure 3).
At T > 1200 °C, the activation energy and frequency factor changed insignificantly. A decrease in the order of kinetics to values of 1.1–1.3 was also observed. The values of the energy depth of traps responsible for the formation of the TL peak at 390 K and the frequency factor in ceramics of type 2 (1.12 eV and 4.6 × 10¹³ s−1) were close to the values of these parameters in ceramics of type 1, sintered at 1200 °C. In this case, the TL of type 2 ceramics was characterized by a kinetic order of 1.4. It should be noted that variations in the values of the TL kinetic parameters may be the cause of changes in the temperature position of the peak at 390 K, as shown in Figure 4.
The kinetic parameters of the TL peak at 390 K in samples of monoclinic zirconium dioxide were also determined by other authors. The activation energies we obtained are quite close to the values (0.96–0.97 eV), which were measured by Tm − Tstop and initial rise methods in nanostructured ZrO2 synthesized by sol-gel technique [23]. In [27], kinetic parameters were calculated by analyzing the peak shape, variations in heating rates, and isothermal decay of TL. It has been established that the TL peak at 125 °C (398 K) was due to the depletion of a monoenergetic trap with parameters E = 0.90 eV, S = 4 × 10¹⁰ s−1. In this case, the order of kinetics was 1.0. These values are close to those obtained in this work for ceramic samples of type 1, annealed at low temperatures (up to 1000 °C). In [30], for ZrO2: Er samples, kinetic analysis of the peak at 112 °C, close in temperature position to the peak at 390 K in our samples, was conducted using the initial rise, whole glow, peak, and curve fitting methods. The order of kinetics was determined to be first-order. The activation energy was found to be 0.71 eV, which is slightly less than the energy depth of traps in type 1 samples, sintered at T < 1000 °C (0.75–0.86 eV).
The effect of a decrease in TL response with a decrease in the crystallite size was observed previously in many materials that are promising for use in TL dosimetry (Al2O3, CaSO4: Eu, NaLi2PO4: Eu, BeO etc.) [29,31,32,33]. In [34], based on a generalization of the results of other authors, it is shown that this effect is a general pattern for many TL materials. An analysis of literature data carried out by the authors of [34] showed the absence of noticeable changes in the kinetic parameters of TL with variations in the crystallite size. In contrast to the results of [34], we recorded changes in the activation energy, frequency factor, and order of TL kinetics at 390 K with increasing sintered temperature, although they are less significant compared to changes in TL intensity. These variations in kinetic parameters may be attributed to the fact that the change in crystallite size affects the energy structure of traps [35].
The physical nature of the effect of a decrease in TL yield with a decrease in crystallite size has not yet been reliably established and requires additional research. In [29], during the study of ceramics based on aluminum oxide, it was suggested that one of the reasons for its manifestation may be an increase in the probability of nonradiative transitions with decreasing nanoparticle size, particularly due to localized transitions of electrons and holes between capture and luminescence centers. Other possible reasons for the decrease in TL intensity include a decrease in the concentration of traps [34], as well as an increase in the surface-to-volume ratio [36] with decreasing crystallite size.
Figure 9 shows the dose dependencies of the TL peak intensity at 390 K for the ceramics under study. The obtained dependencies were approximated by linear functions in different dose ranges. In this case, the slope angles of the obtained dependences were the values of the nonlinearity coefficients k [28]. The approximation results are given in Table 2. It can be seen that the majority of dose dependencies had a sublinear character (k < 1), with the exception of type 1 ceramics synthesized at 1100 °C. In these ceramics, in the range of 1.5–7.5 kGy, the dependence of TL on dose was superlinear (k = 1.2, k > 1). The super- and sublinear nature of the dose dependences may be associated with processes of competition in the capture of charge carriers between defects of various types [37]. It is known that the probability of such competing processes increases in nanostructured materials compared to bulk analogues [38]
The dose dependency closest to linear (k = 1) was exhibited by type 1 ceramics synthesized at 1400 °C. For them, k = 0.89 in the range of 1.5–7.5 kGy. The samples of type 1 synthesized at 1300 °C exhibited the widest range of registered doses, in which k = const, characterized by k = 0.46 when changing the dose by more than an order of magnitude (from 1.5 to 30 kGy). It should be noted that according to the data in Table 2, there was no noticeable correlation between nonlinearity coefficients and crystallite size in the investigated ceramics.
An important characteristic of the TL material when used in practical dosimetry is fading, which determines the decrease in the TL response during detector storage. The results of studying the fading of the TL peak at 390 K in ceramics of various types are shown in Figure 10. To obtain these results, samples were exposed to a test dose of an electron beam (15 kGy), and then kept in the dark at room temperature for various durations. Subsequently, TL was measured at a heating rate of 2 K/s. Figure 10 shows that for samples of types 1 and 2, no significant reduction in TL intensity in the peak at 390 K was observed within 1 h of storage. Moreover, its value varied randomly within 10–15%, which is comparable to the radiation dose error. Small variations in the intensity of the TL peak at 390 K may also be due to the influence of TL from small traps that are empty at 325–350 K (inset in Figure 10). It should be noted that, in contrast to the aluminum oxide ceramics described in the work of [29] and synthesized using a methodology similar to type 1 ZrO2 ceramics, our samples did not exhibit anomalous fading, and their dependence on crystallite size was absent. This fact may indicate the insignificant role of quantum mechanical tunneling and localized transitions of charge carriers in the formation of TL at 390 K in the ZrO2 ceramics we studied.

4. Conclusions

(1)
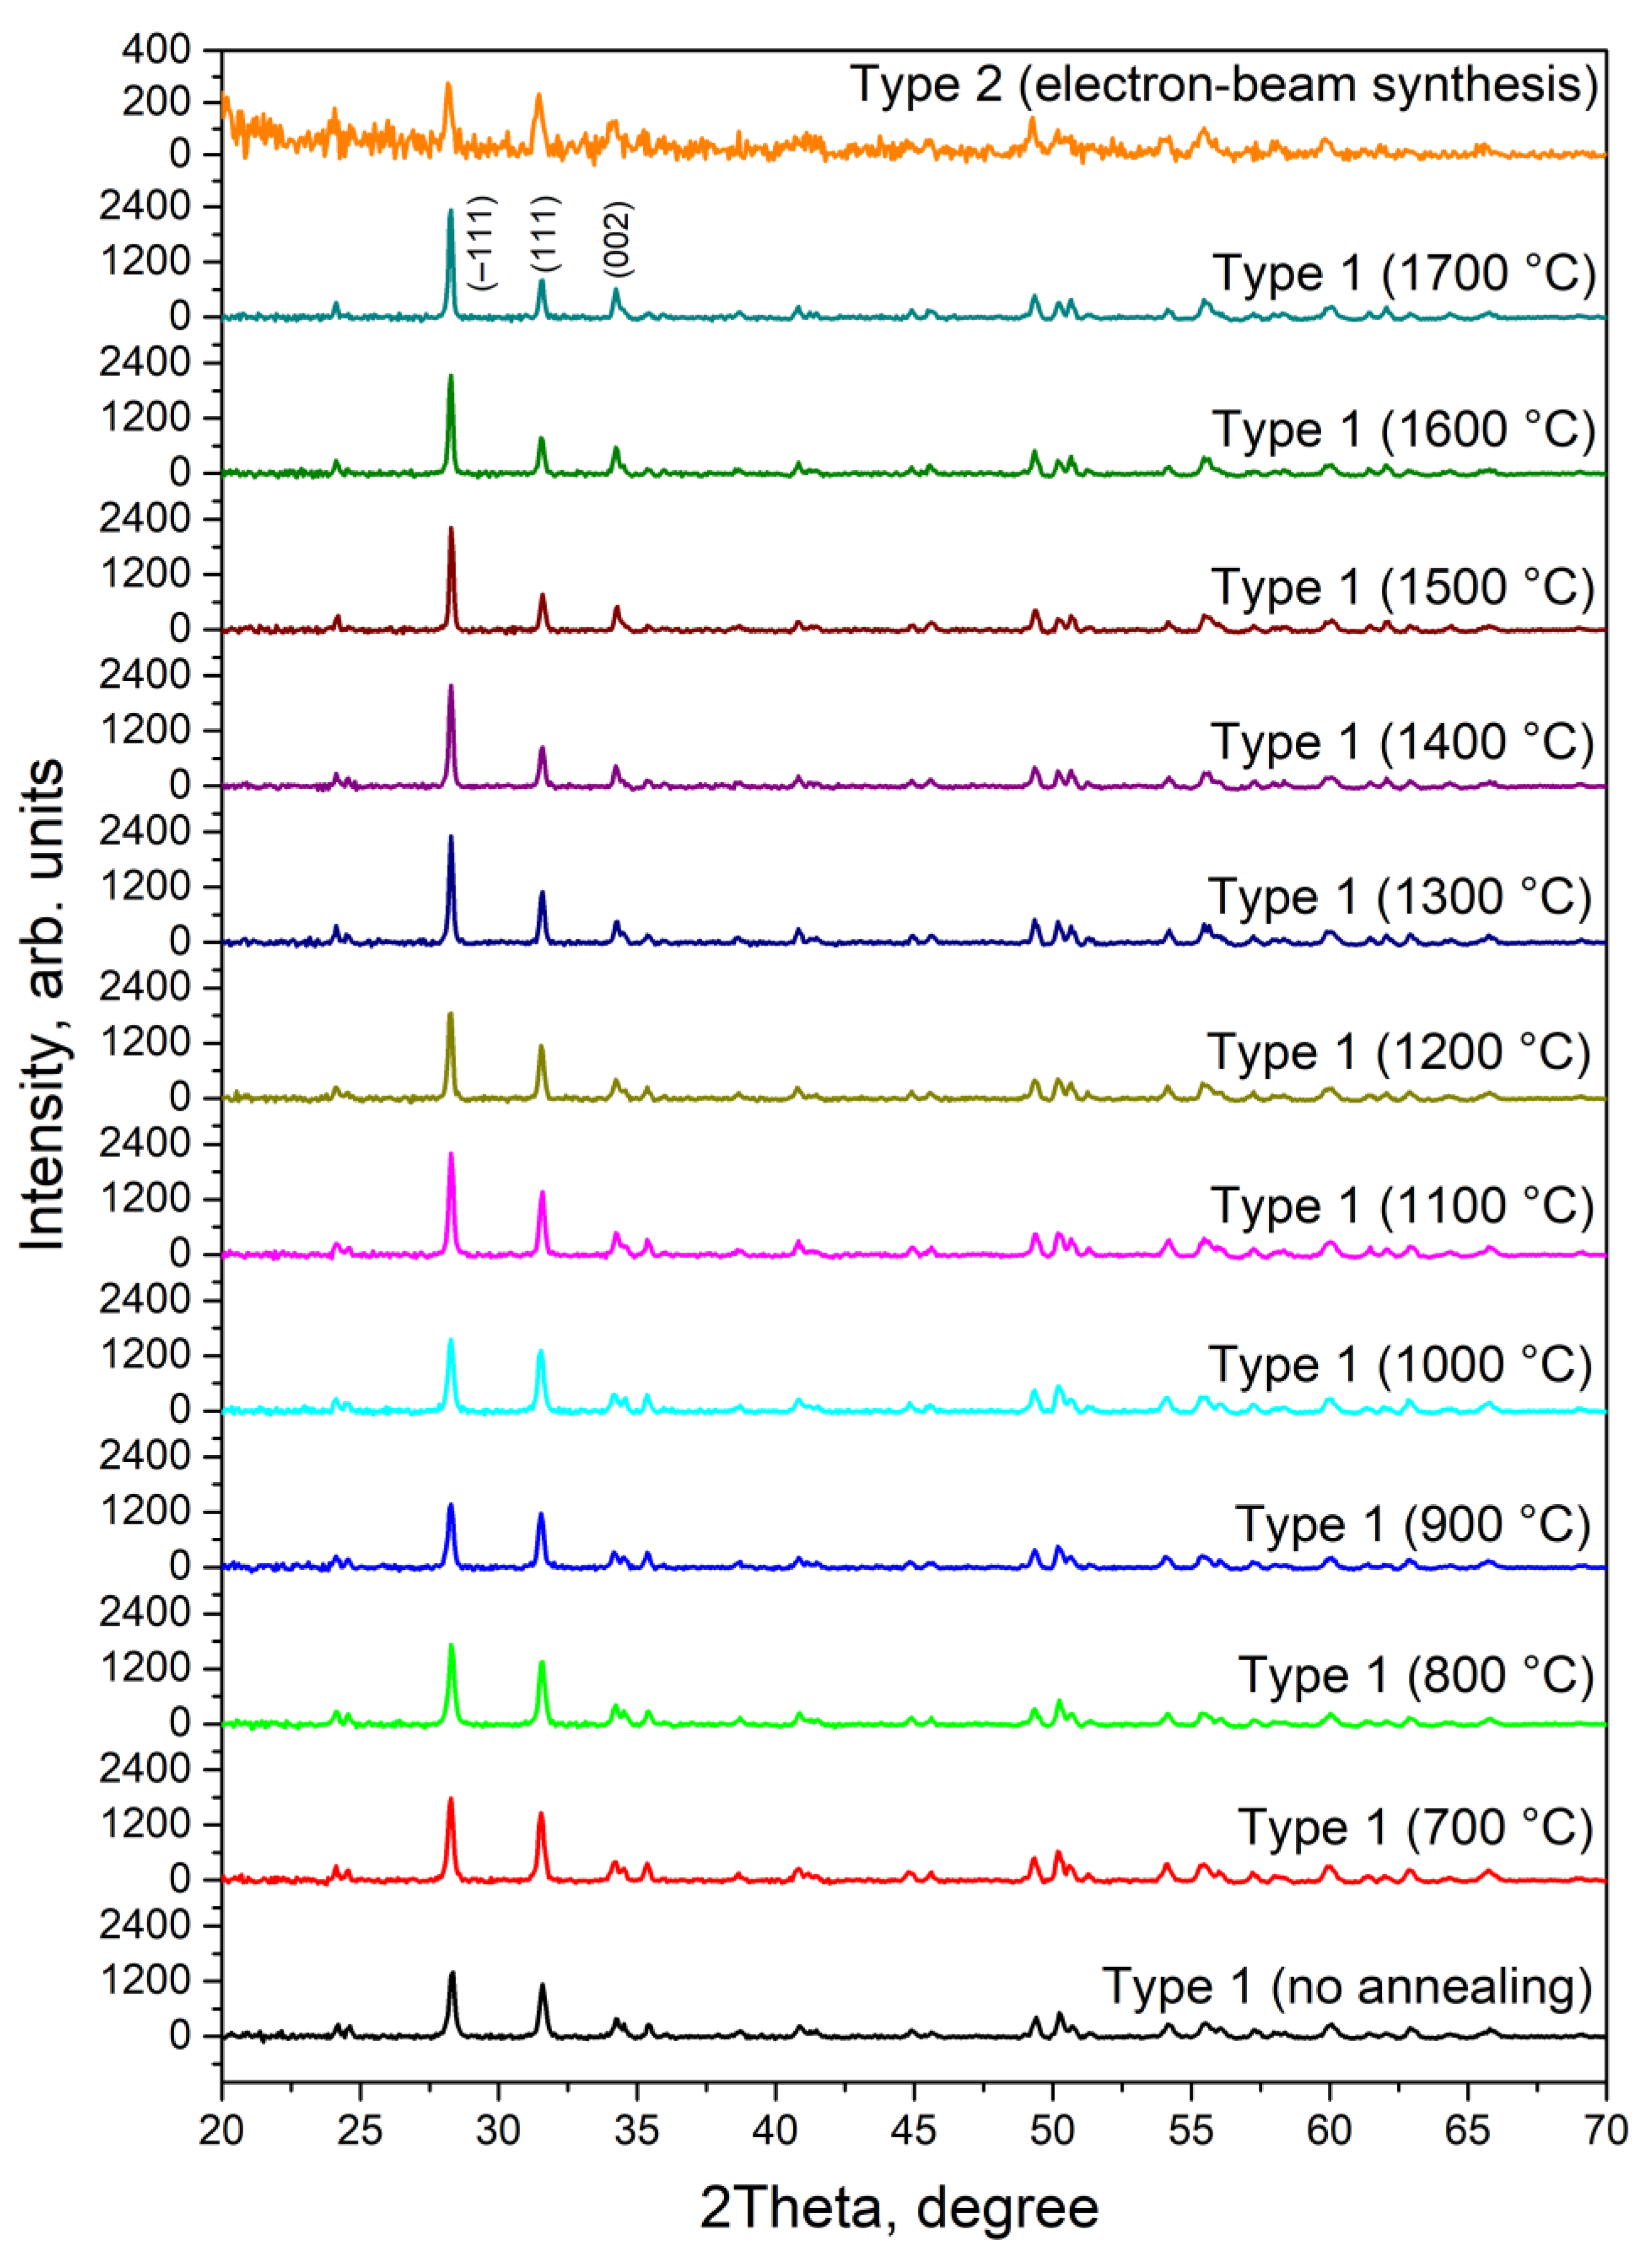
Ultrafine ceramics of monoclinic zirconium dioxide were synthesized by two methods. Along with the traditional method of annealing nanostructured compacts in an electric furnace, a new method was used, which consists of sintering nanopowders in the field of a powerful flow of high-energy electrons (1.4 MeV).
(2)
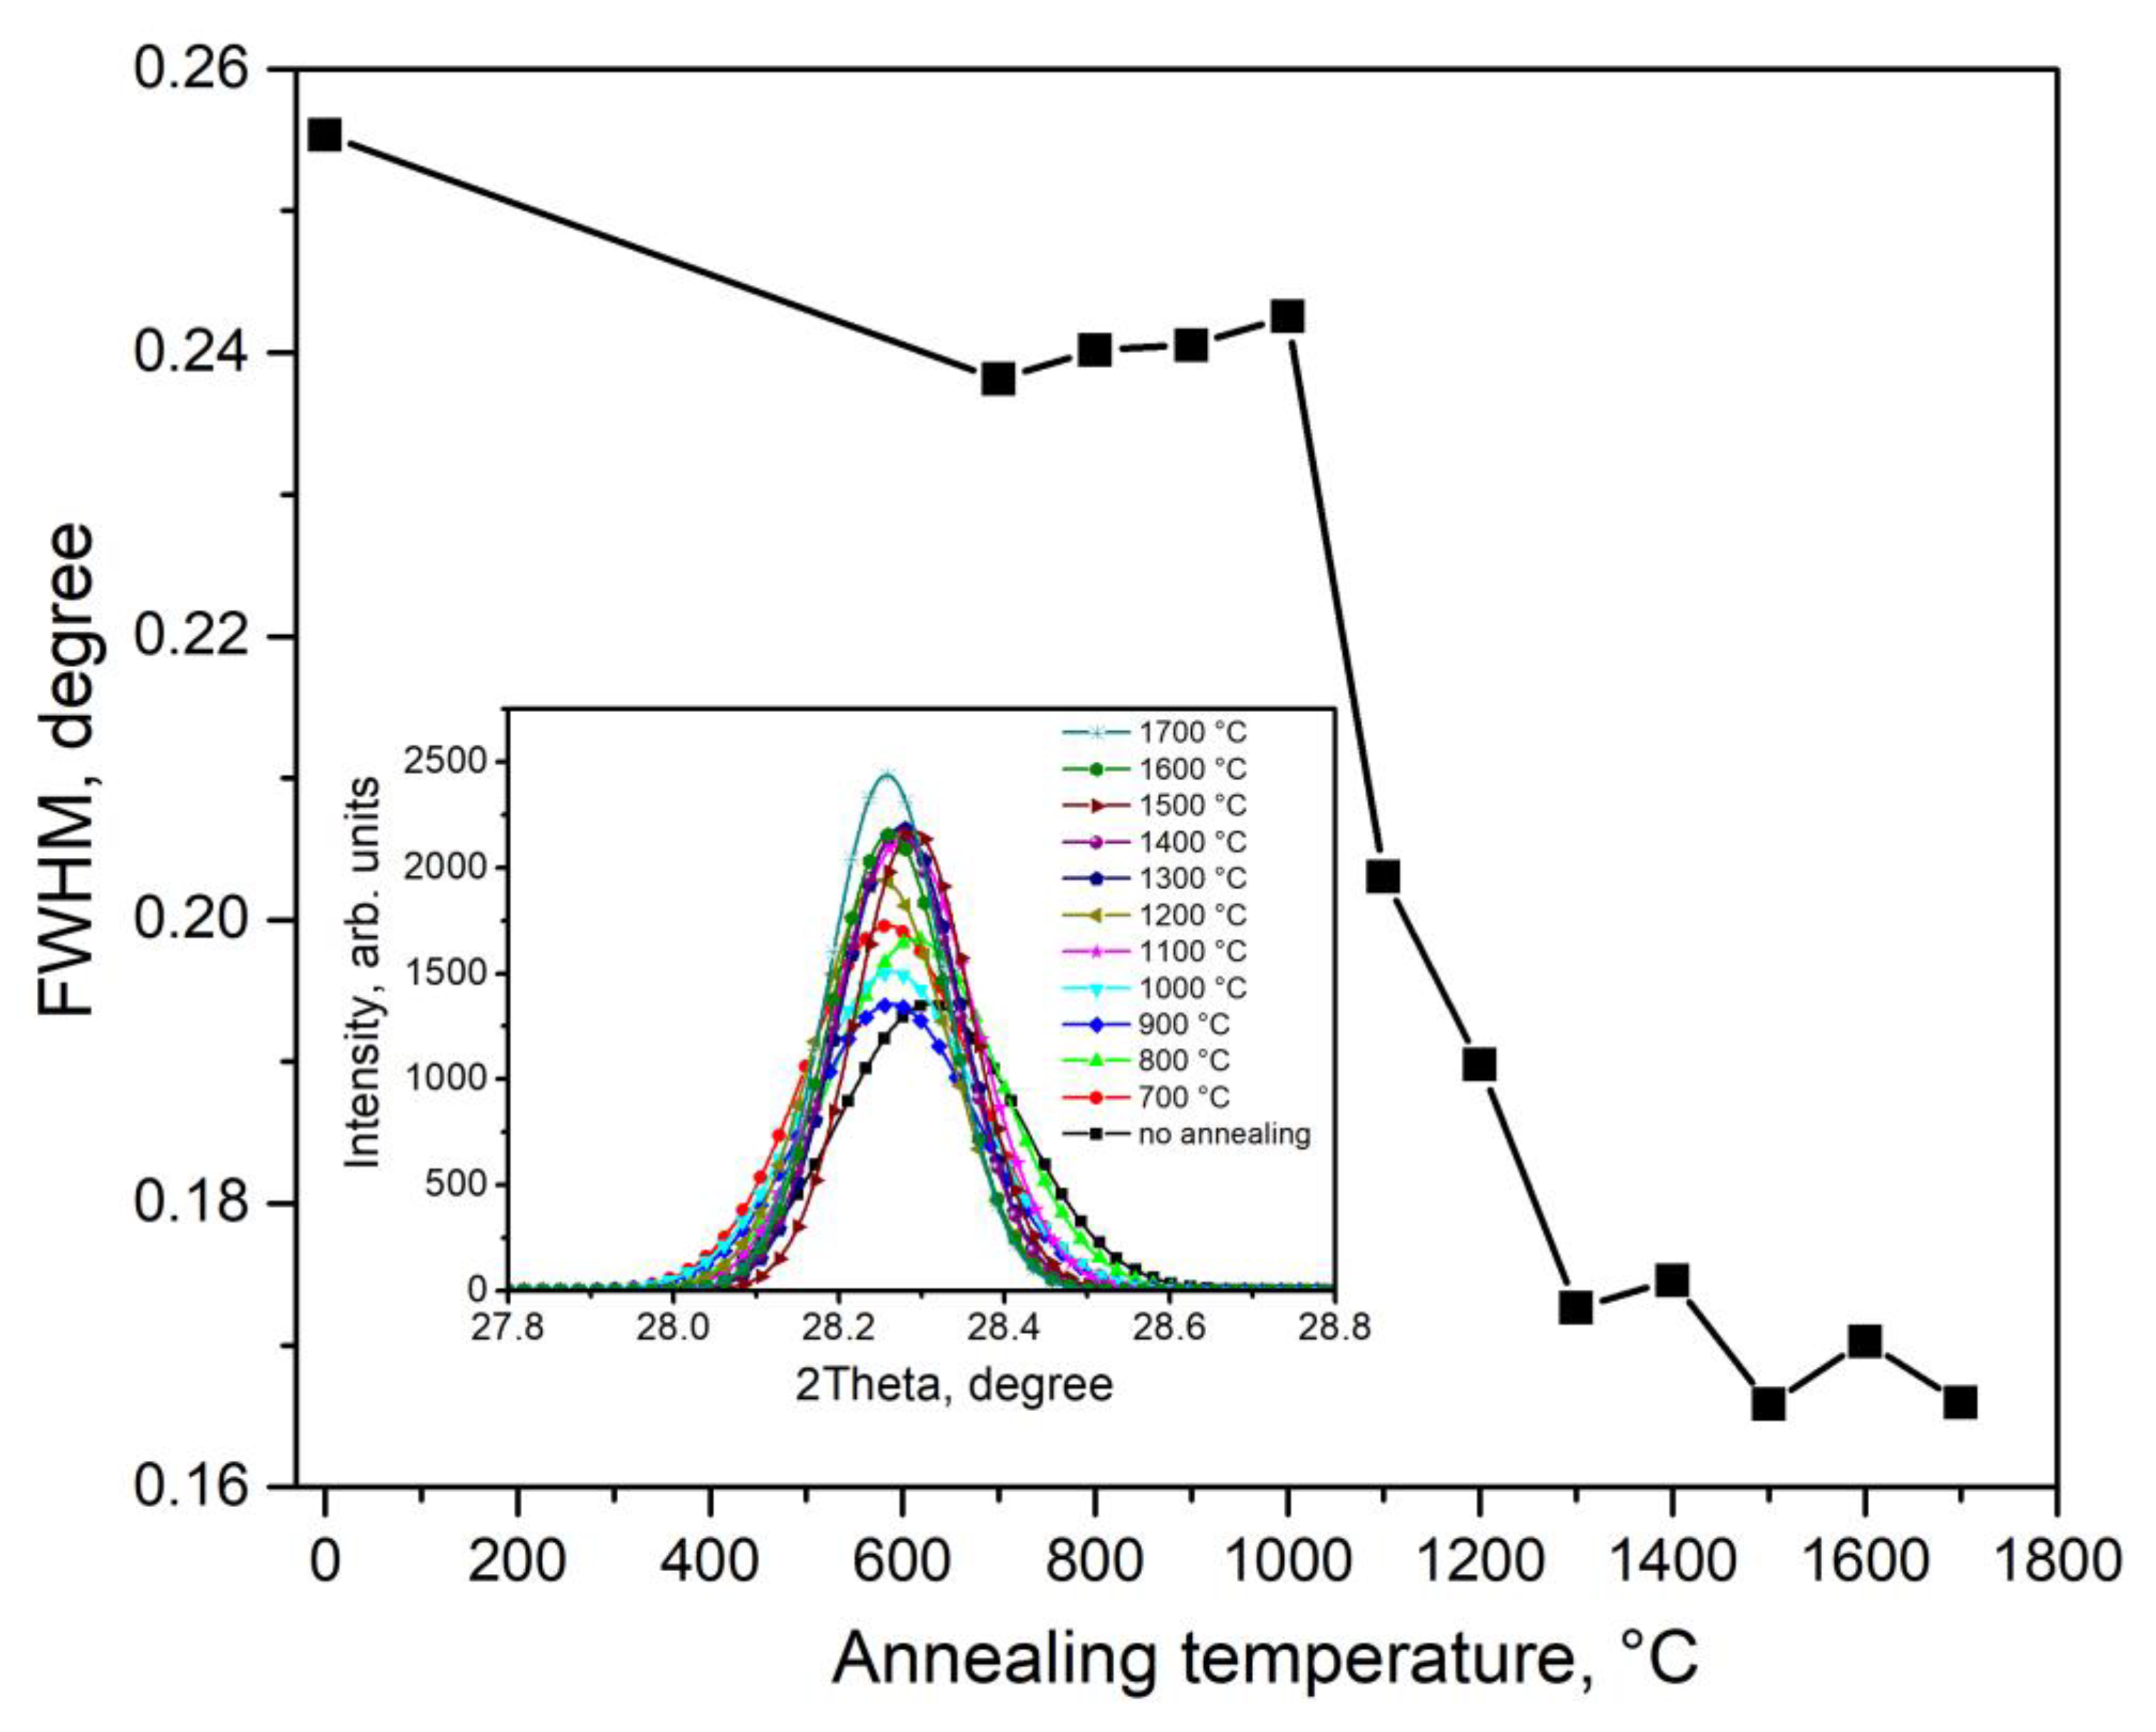
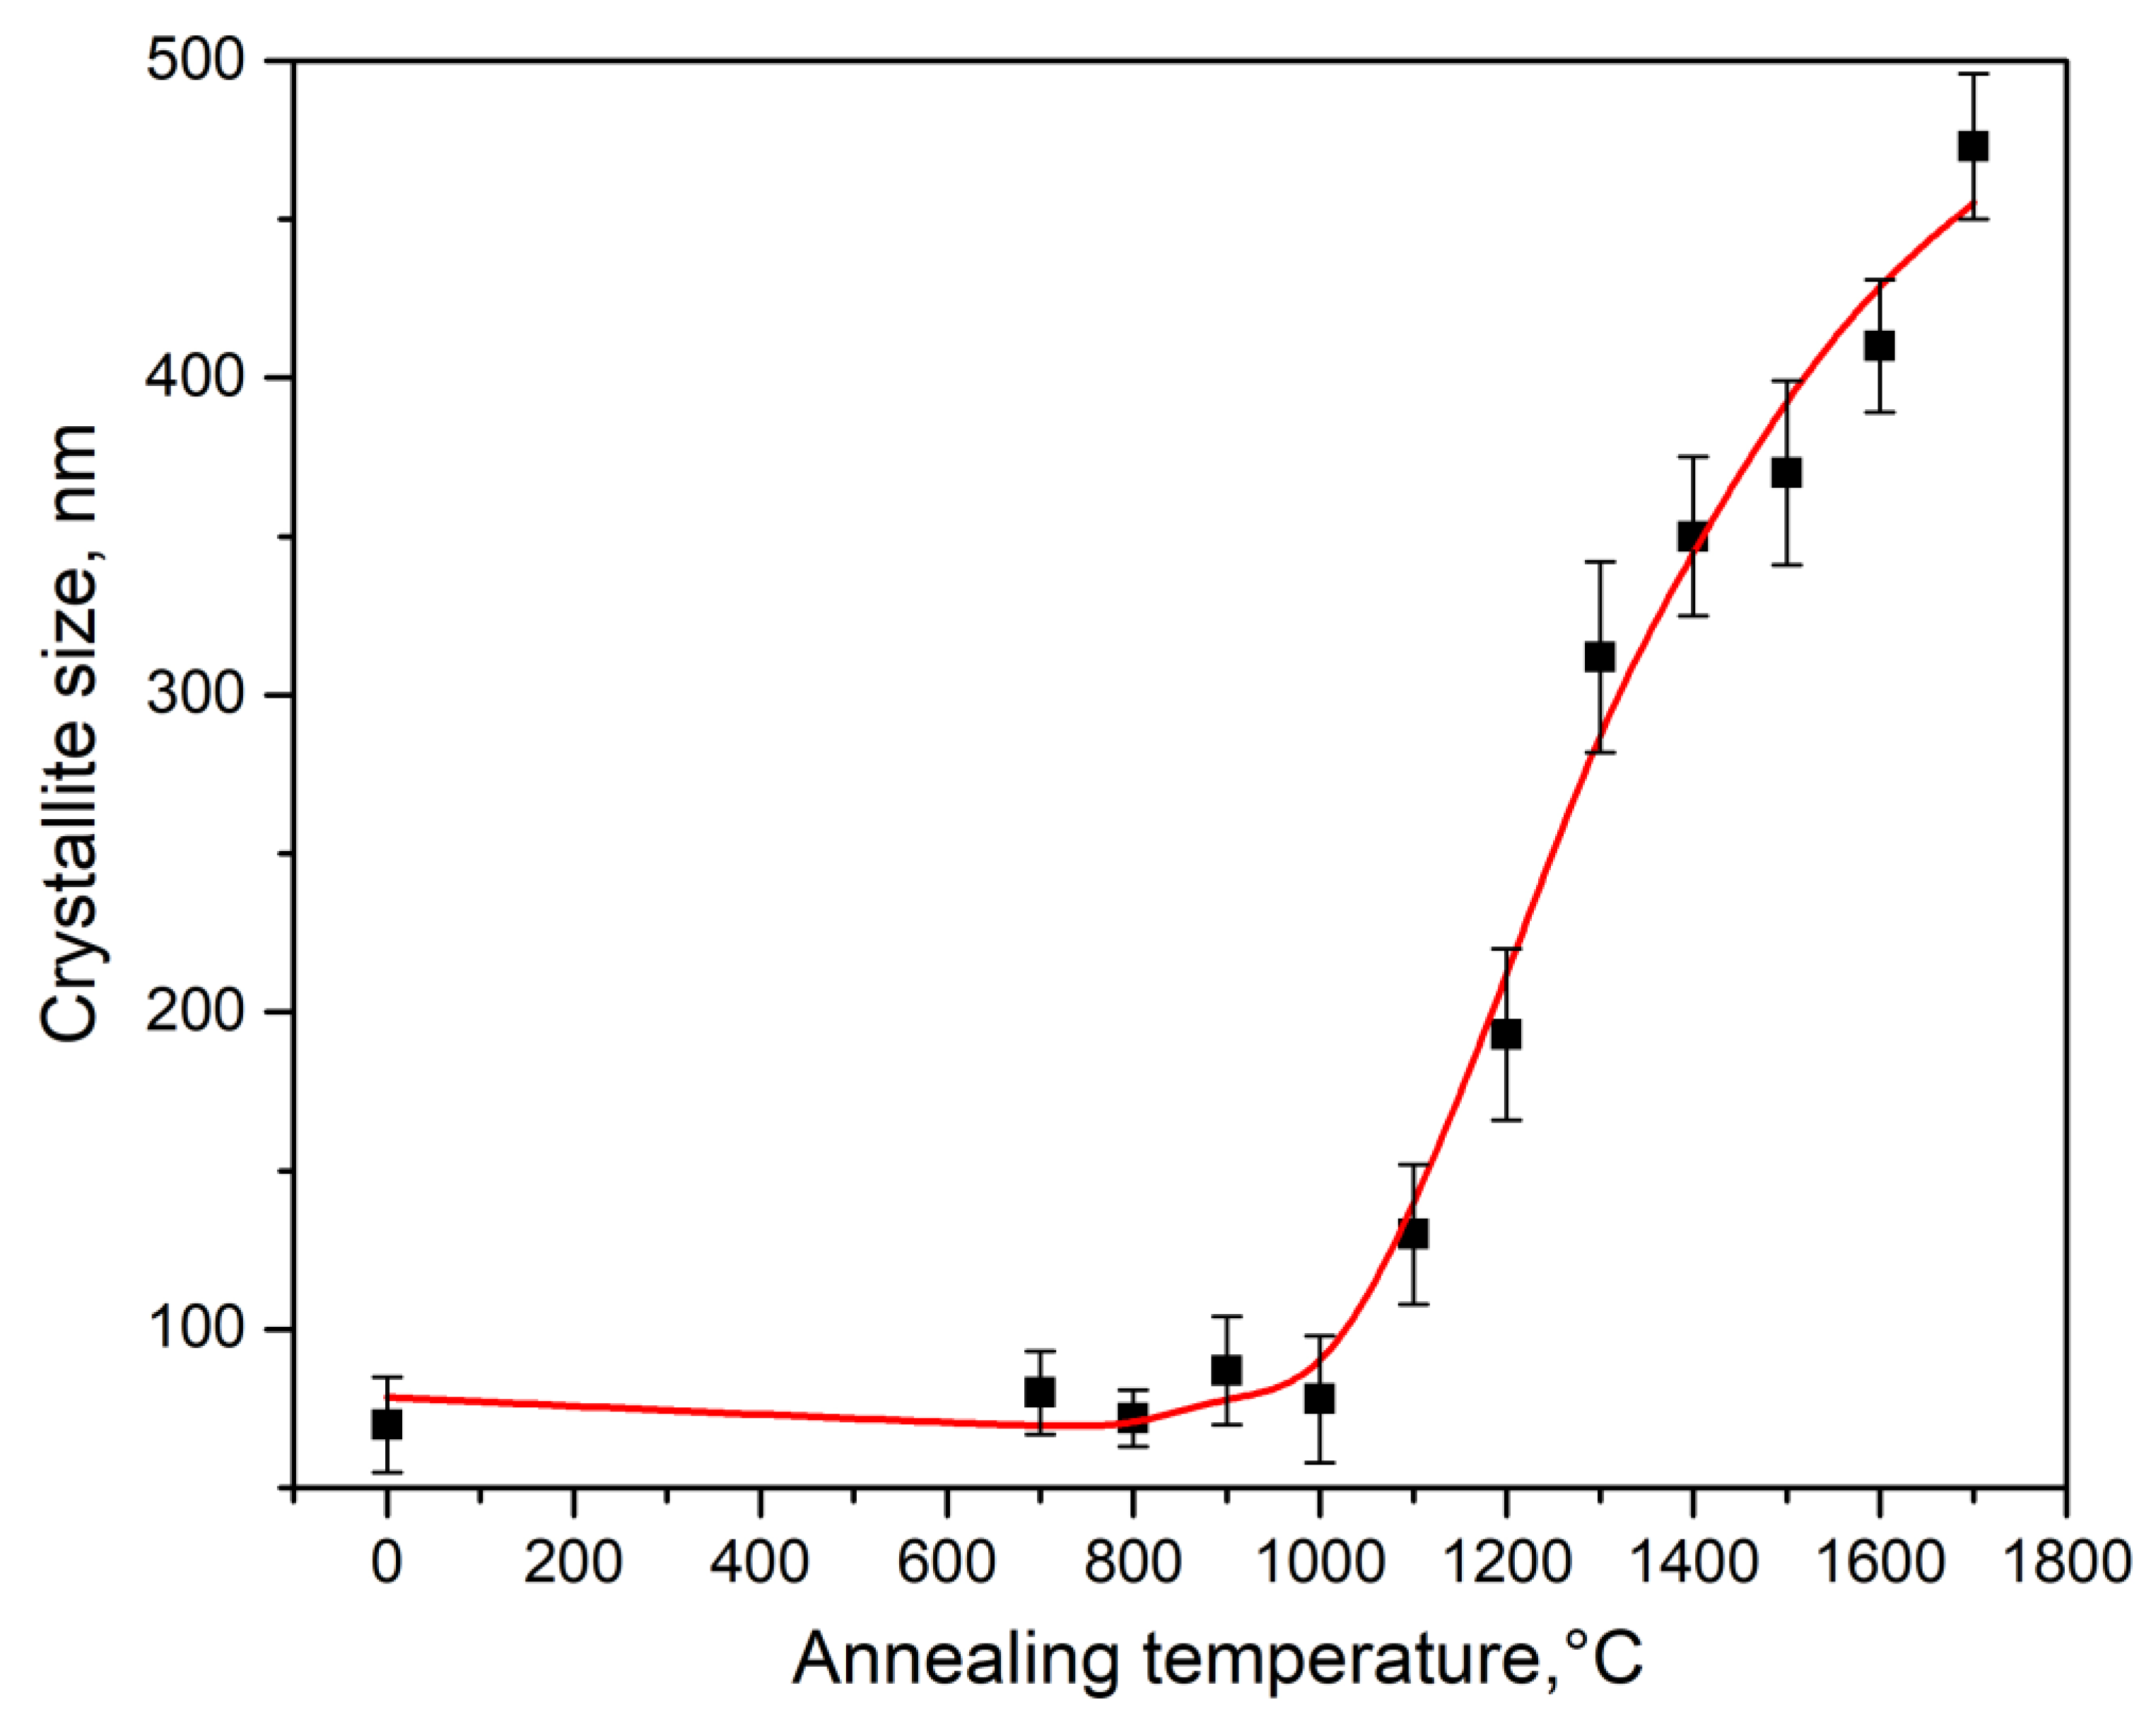
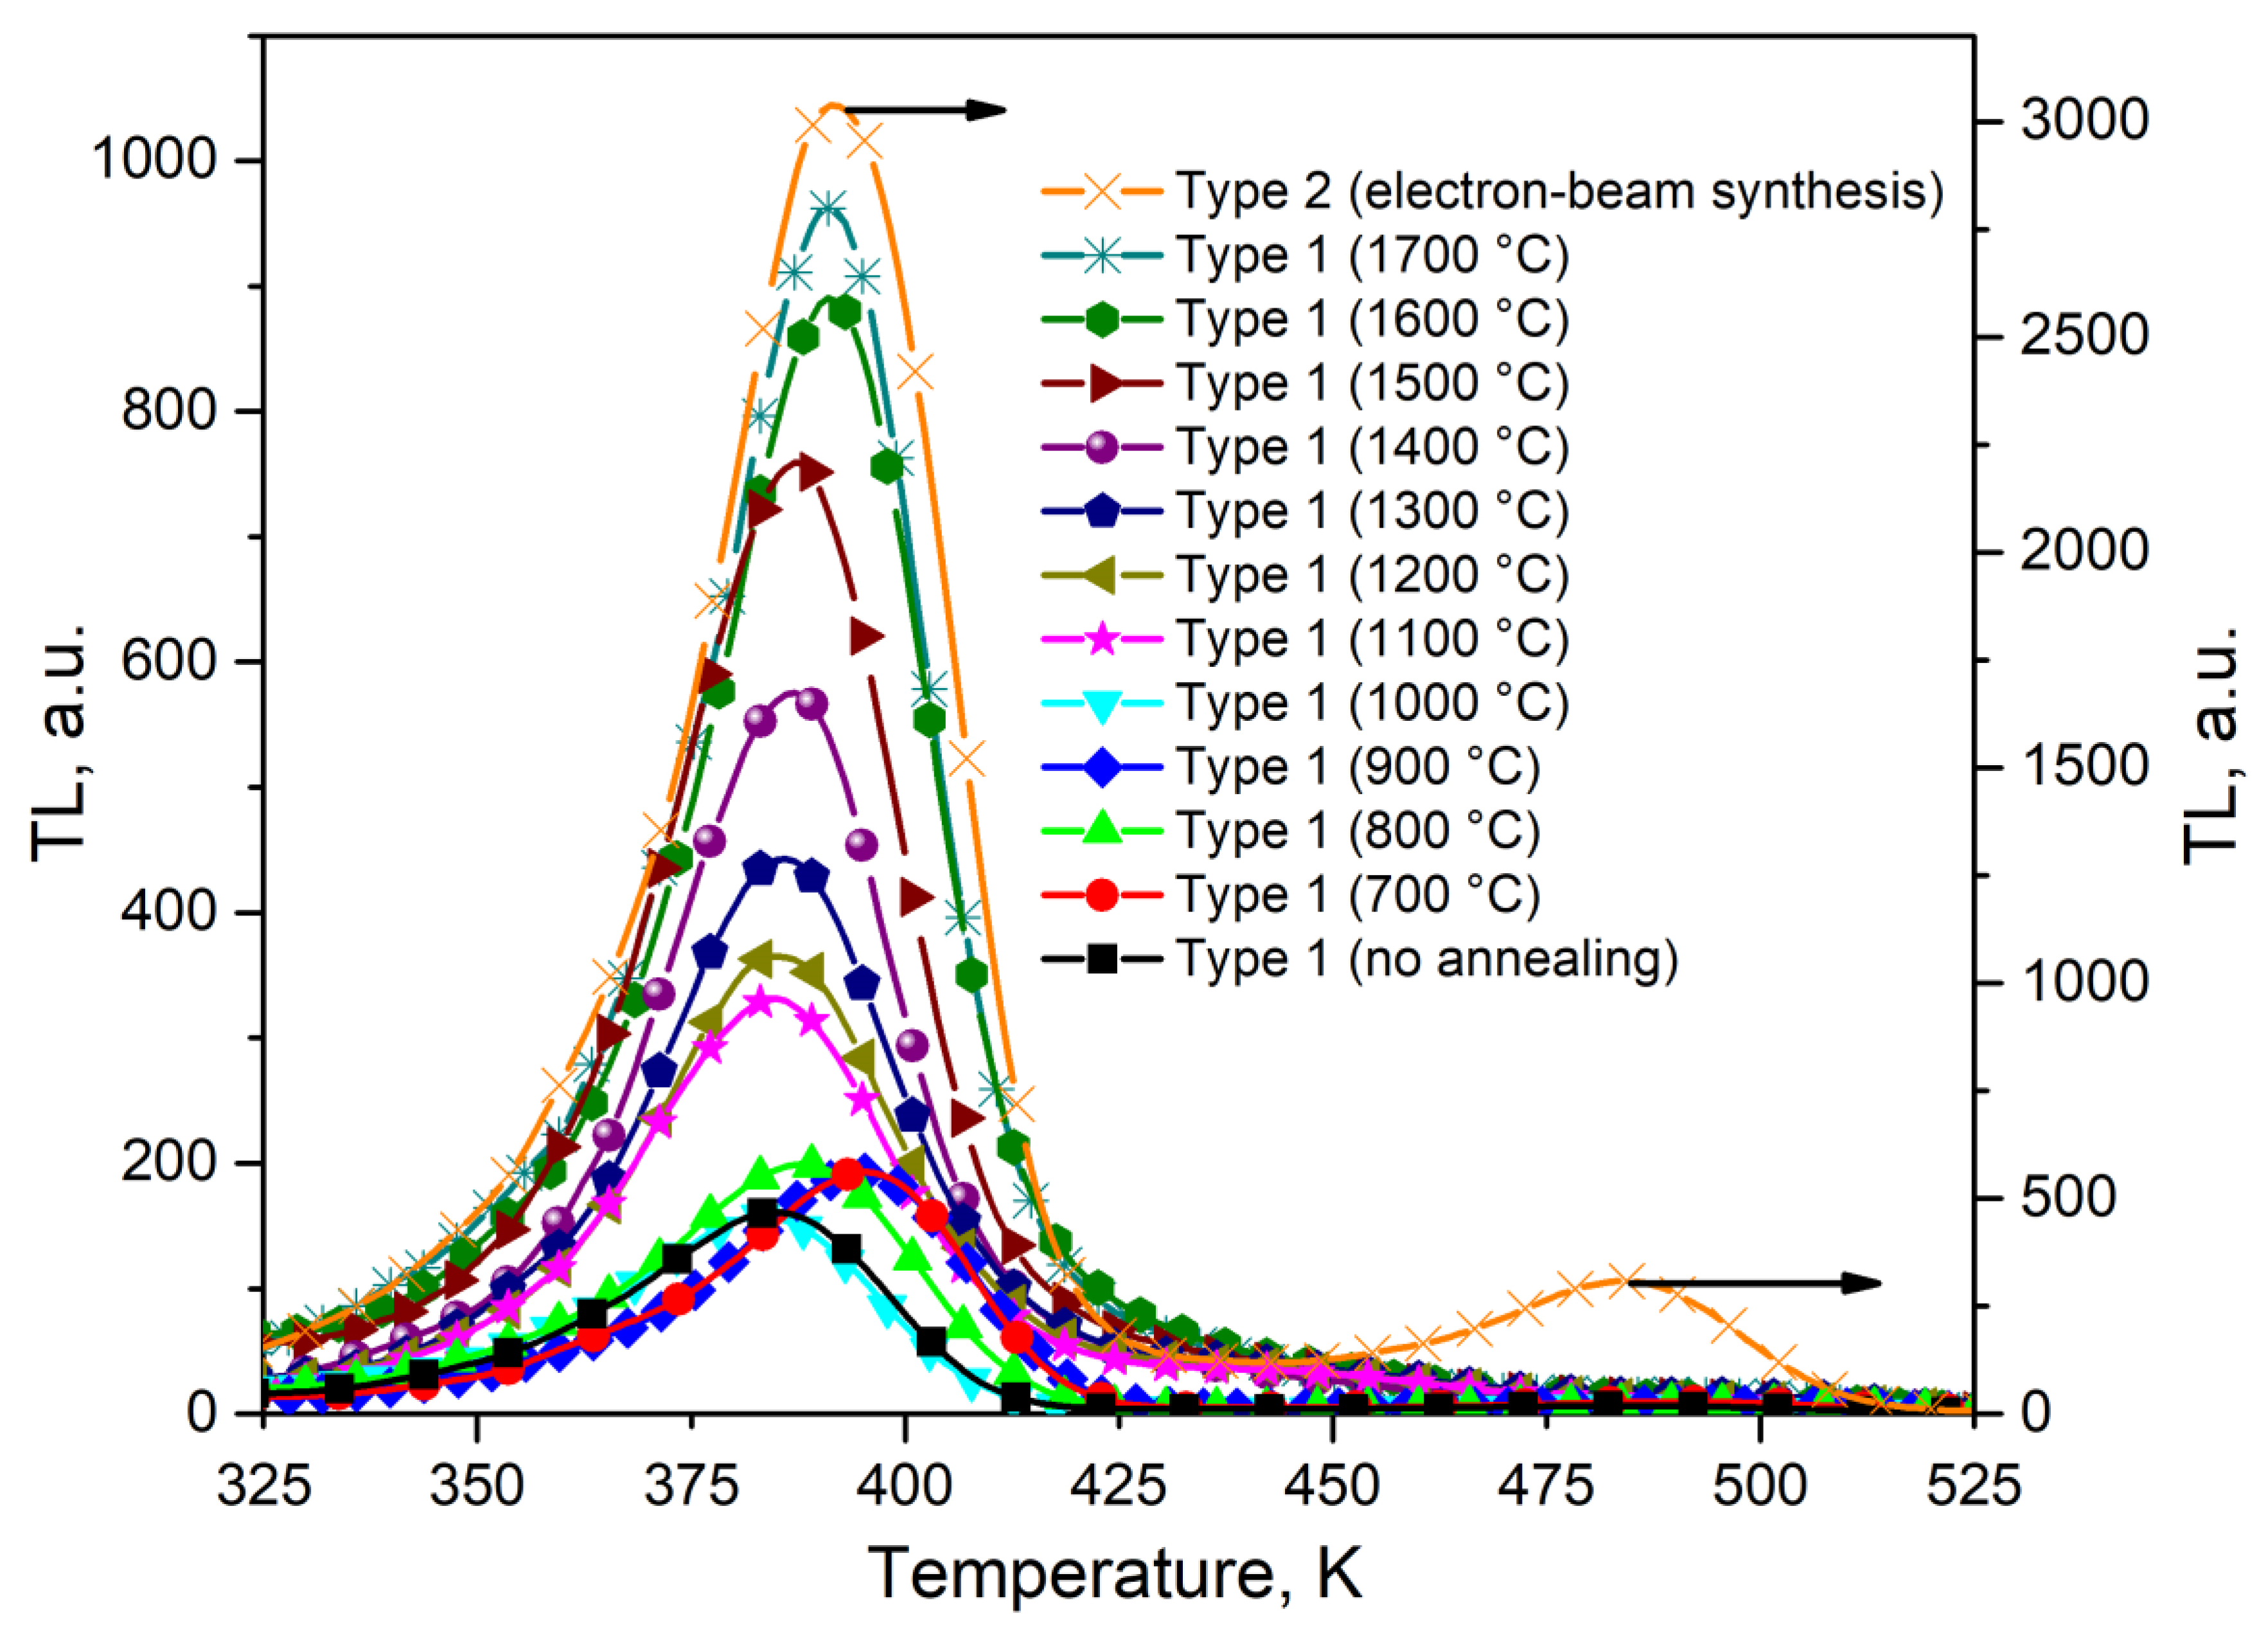
It has been established that at annealing temperatures of type 1 ceramics above 1000 °C, there is a significant increase in the crystallite size (from 100 to 500 nm) and the intensity of the TL peak at 390 K (almost 5 times). Type 2 ceramics synthesized by the electron beam method have the maximum TL response, which may be due to the formation of new radiation defects in them during the synthesis process.
(3)
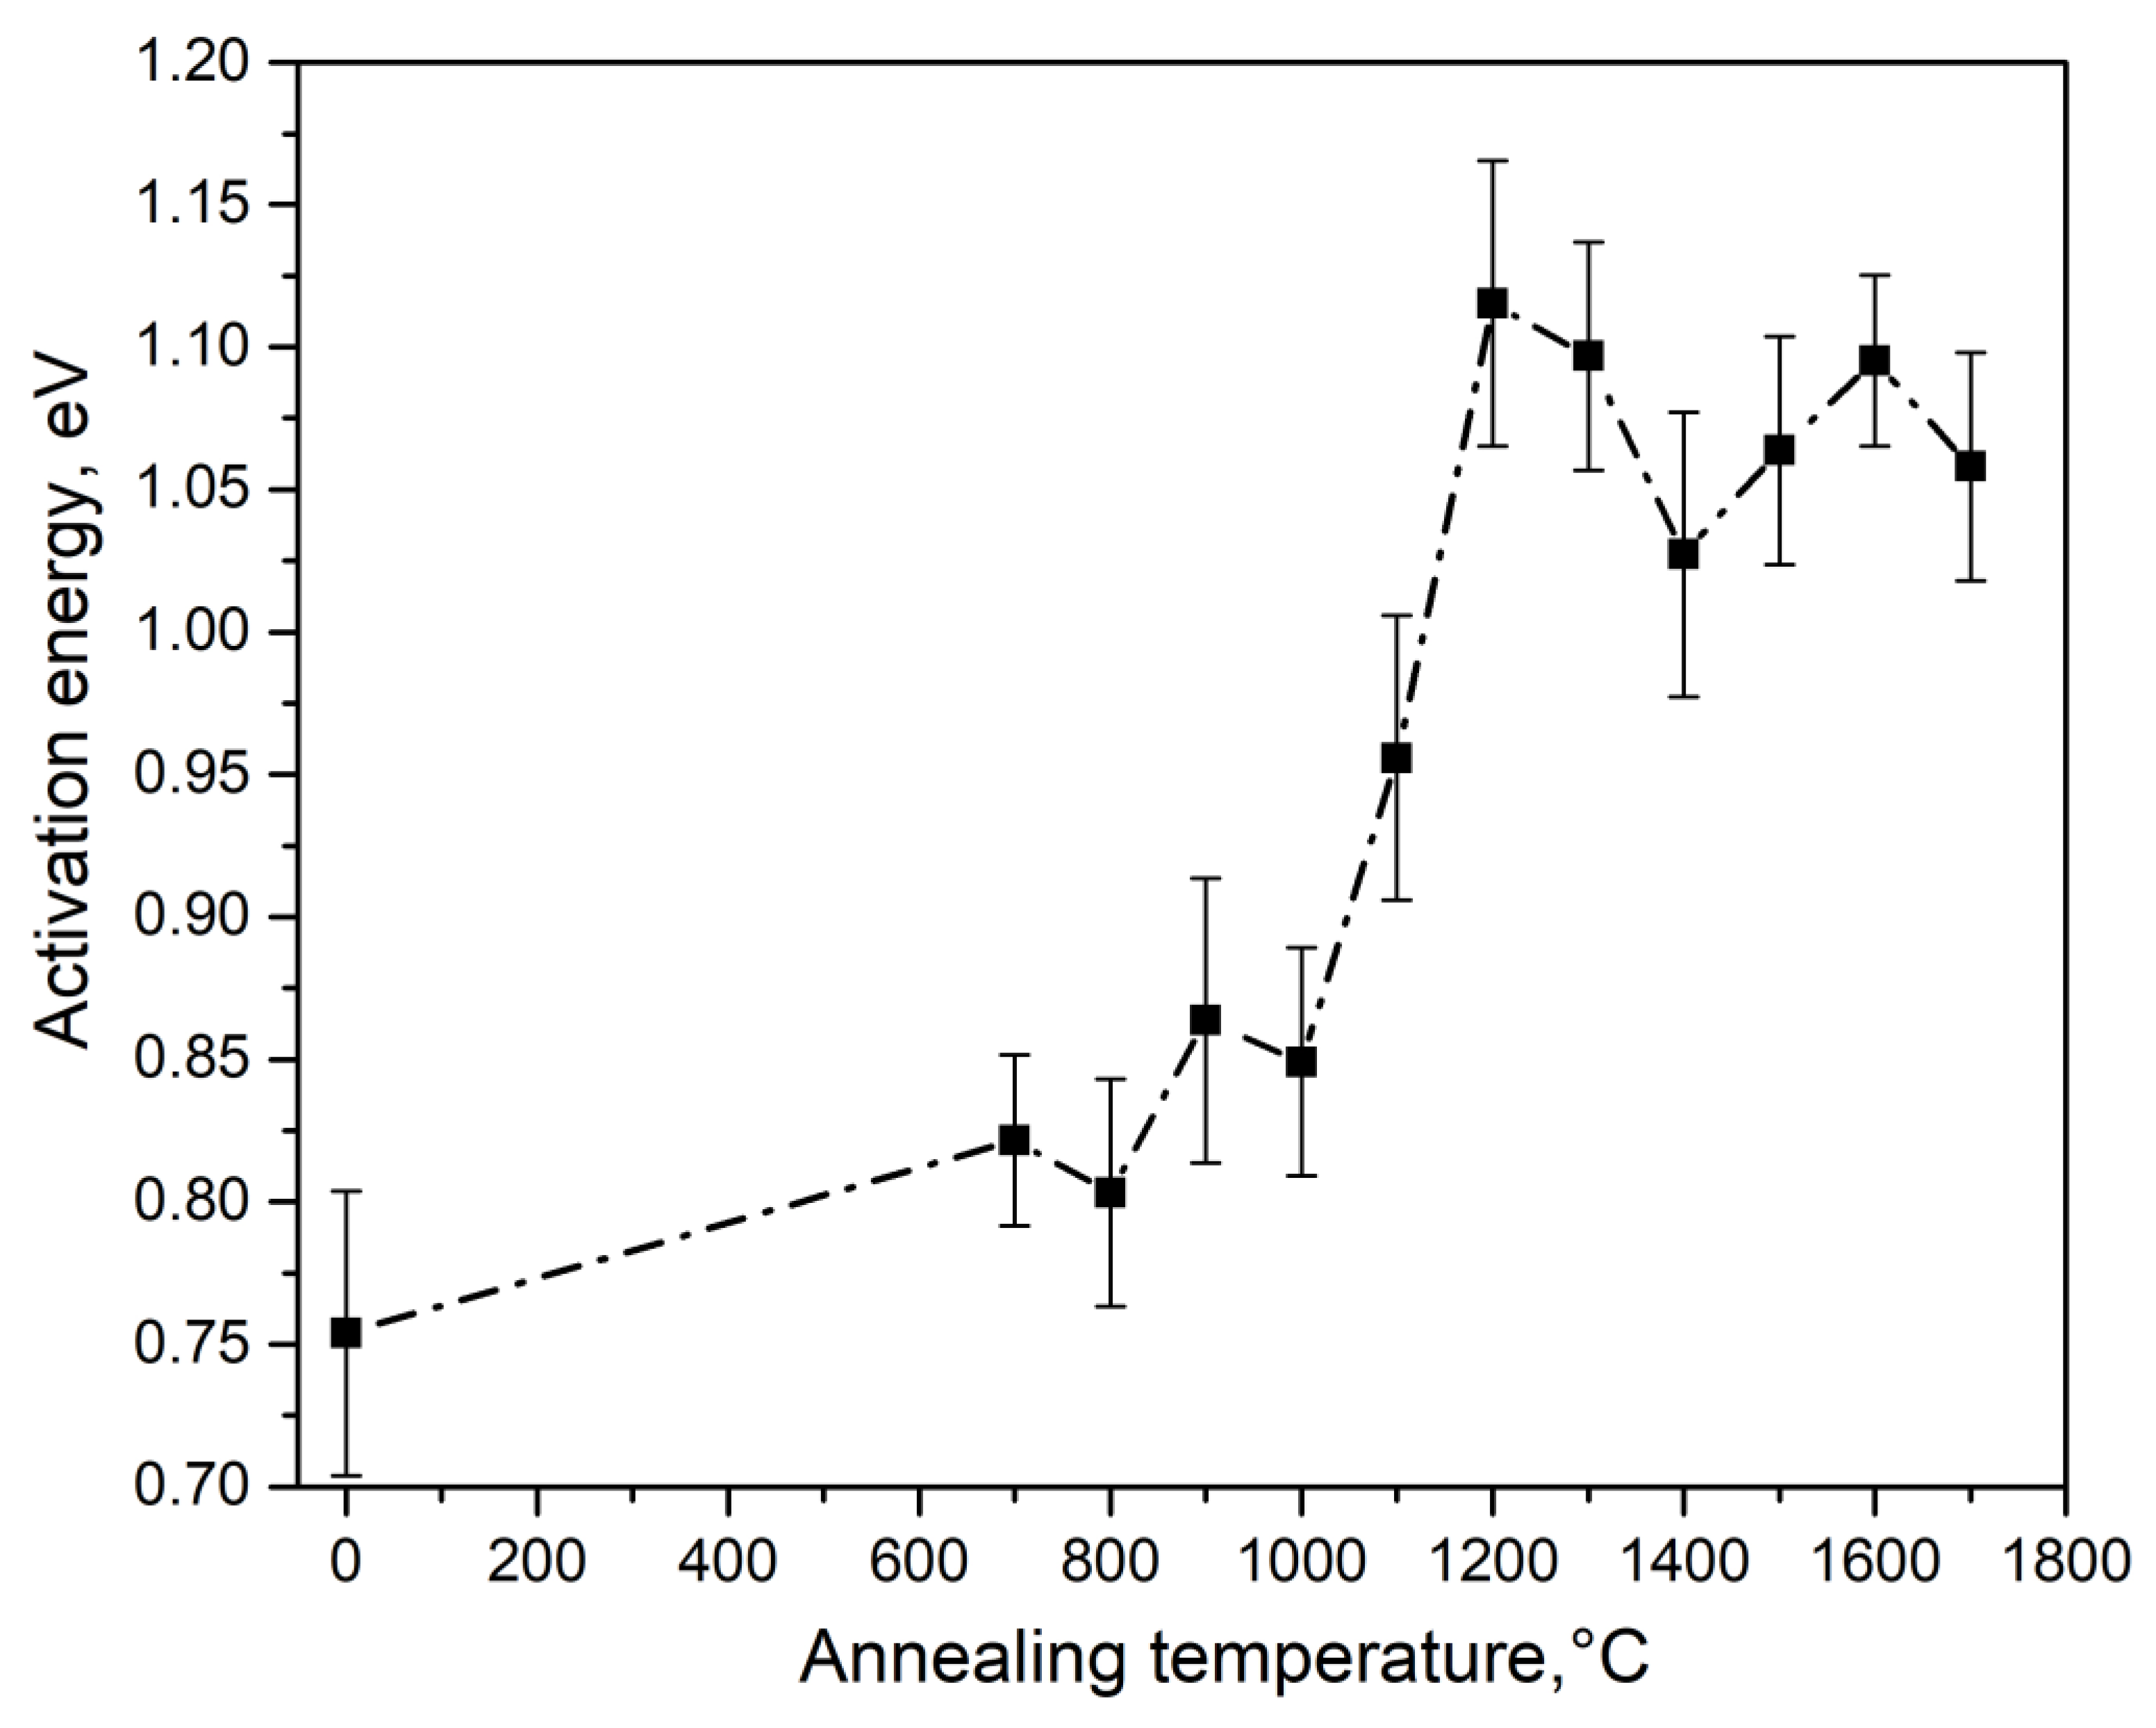
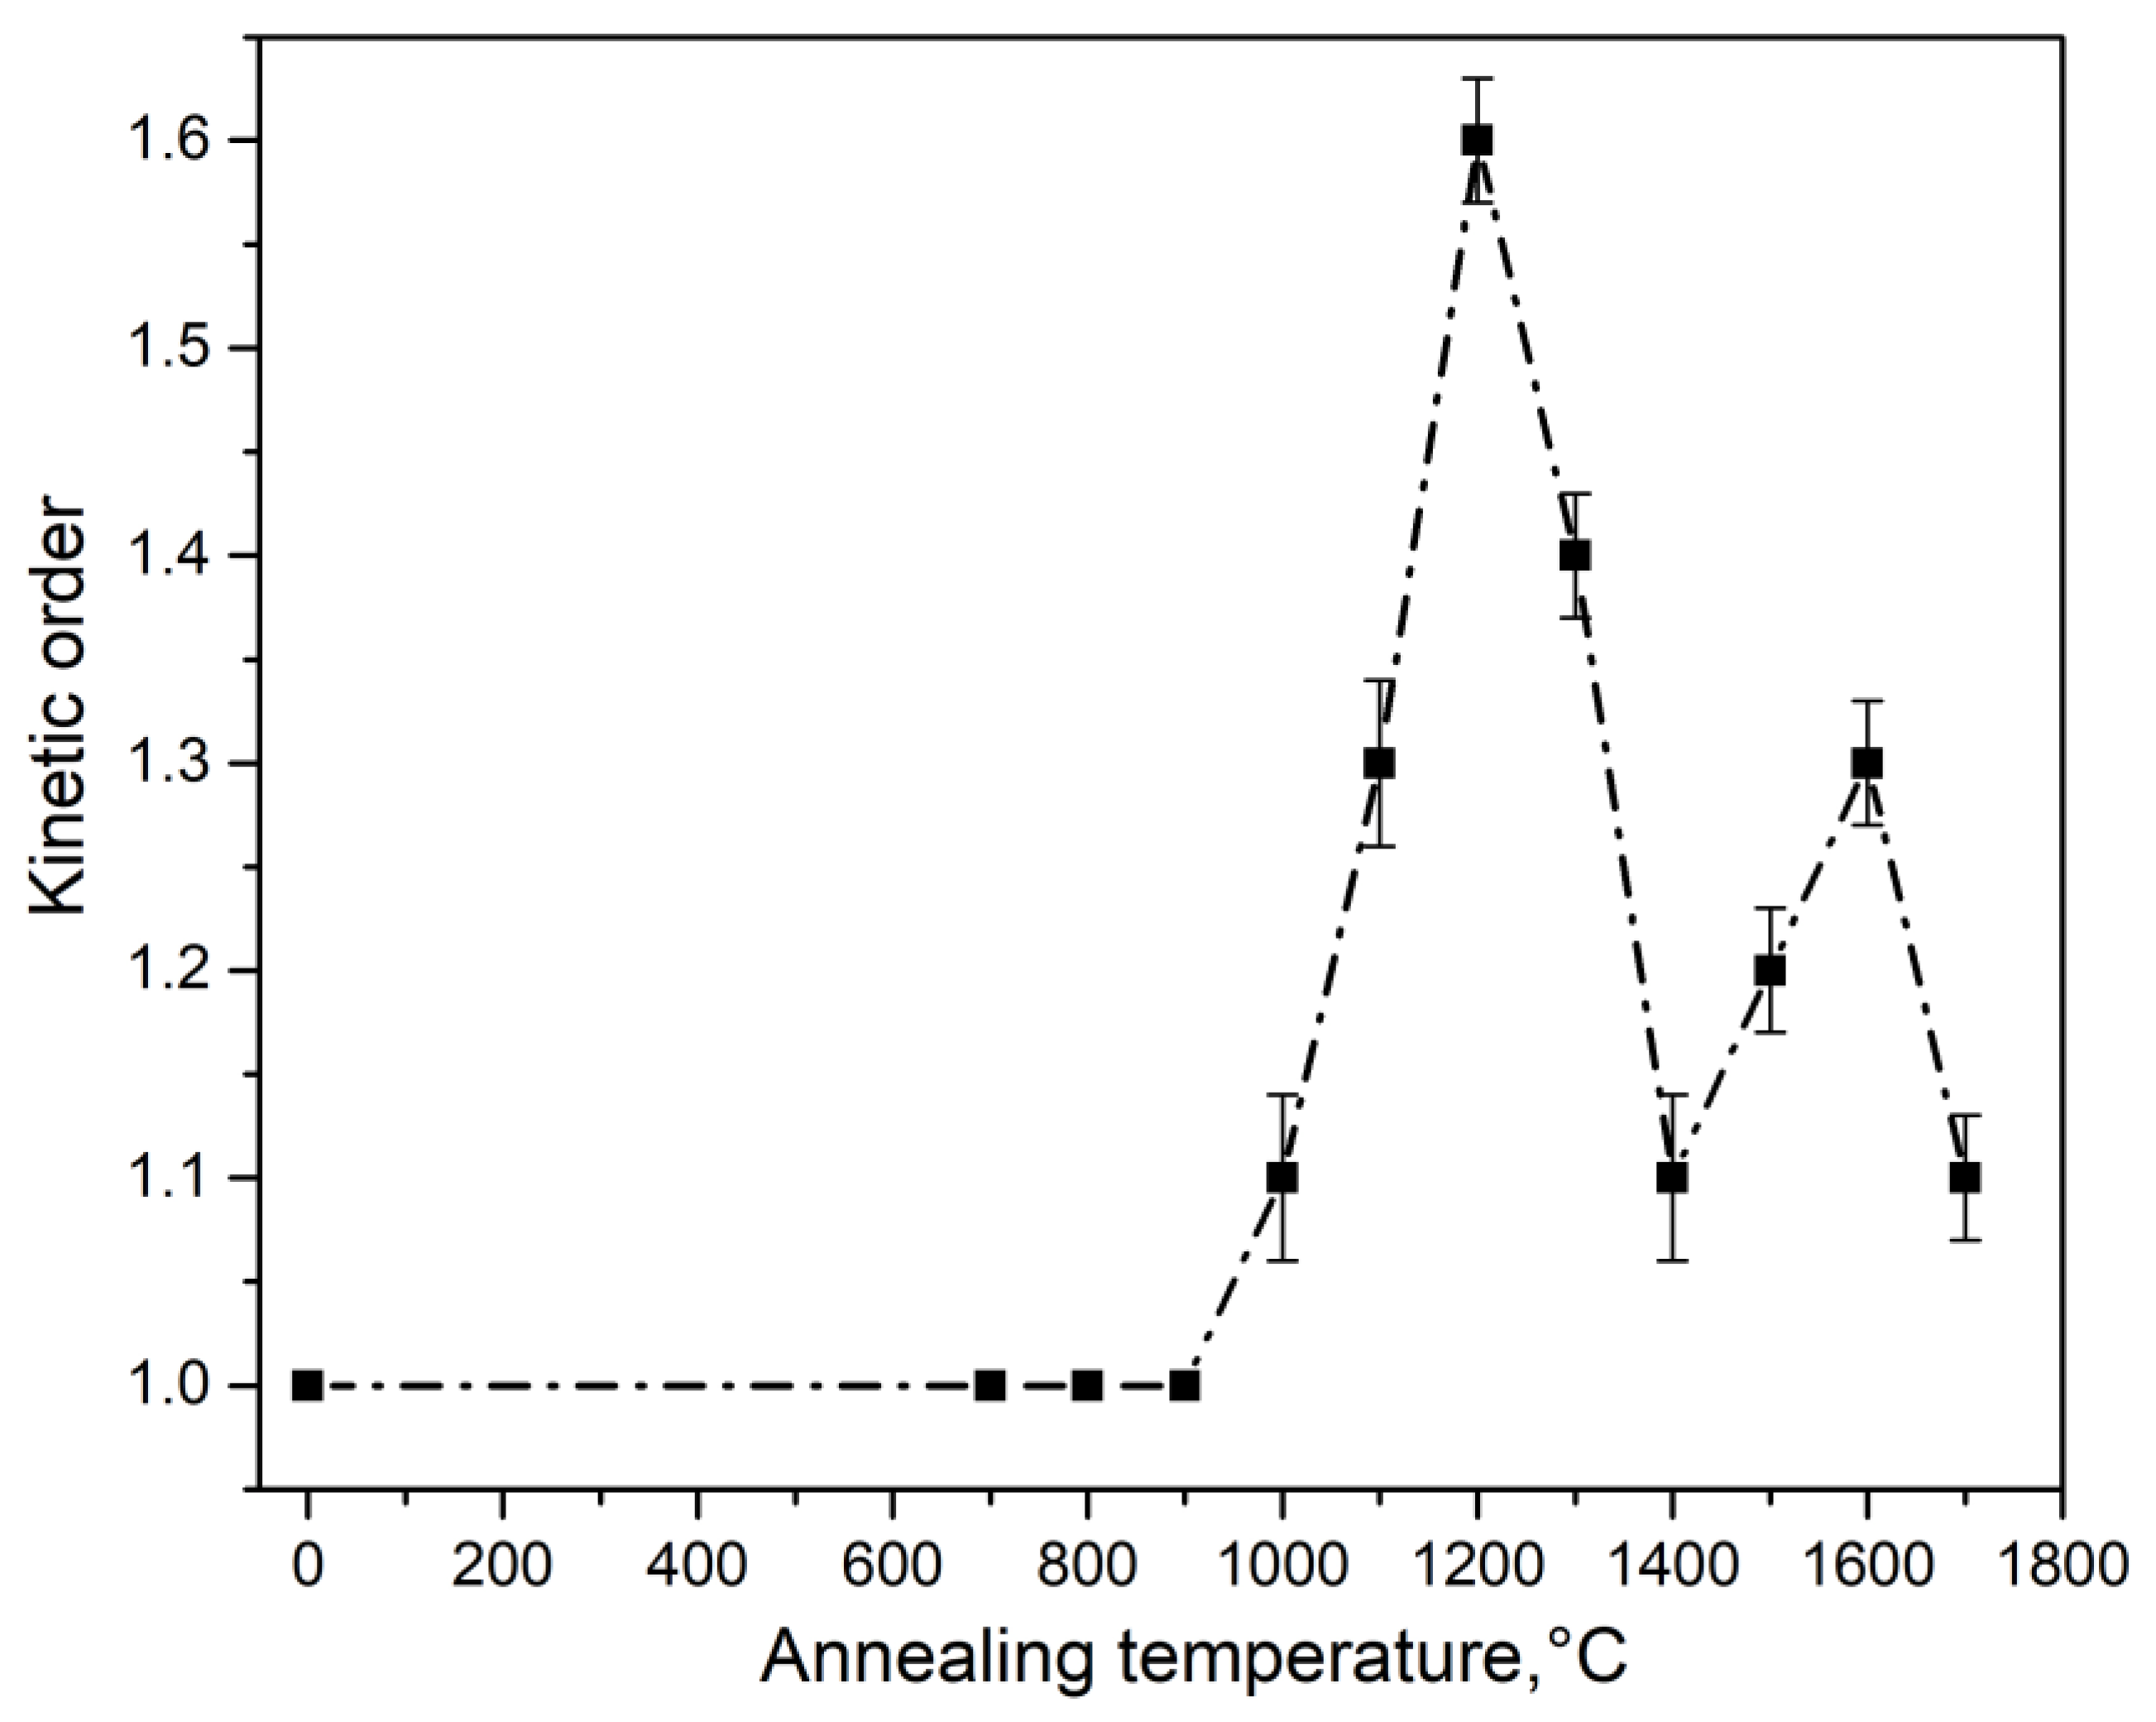
It was discovered for the first time that an increase in the size of crystallites causes an increase in the activation energy, frequency factor, and order of TL kinetics.
(4)
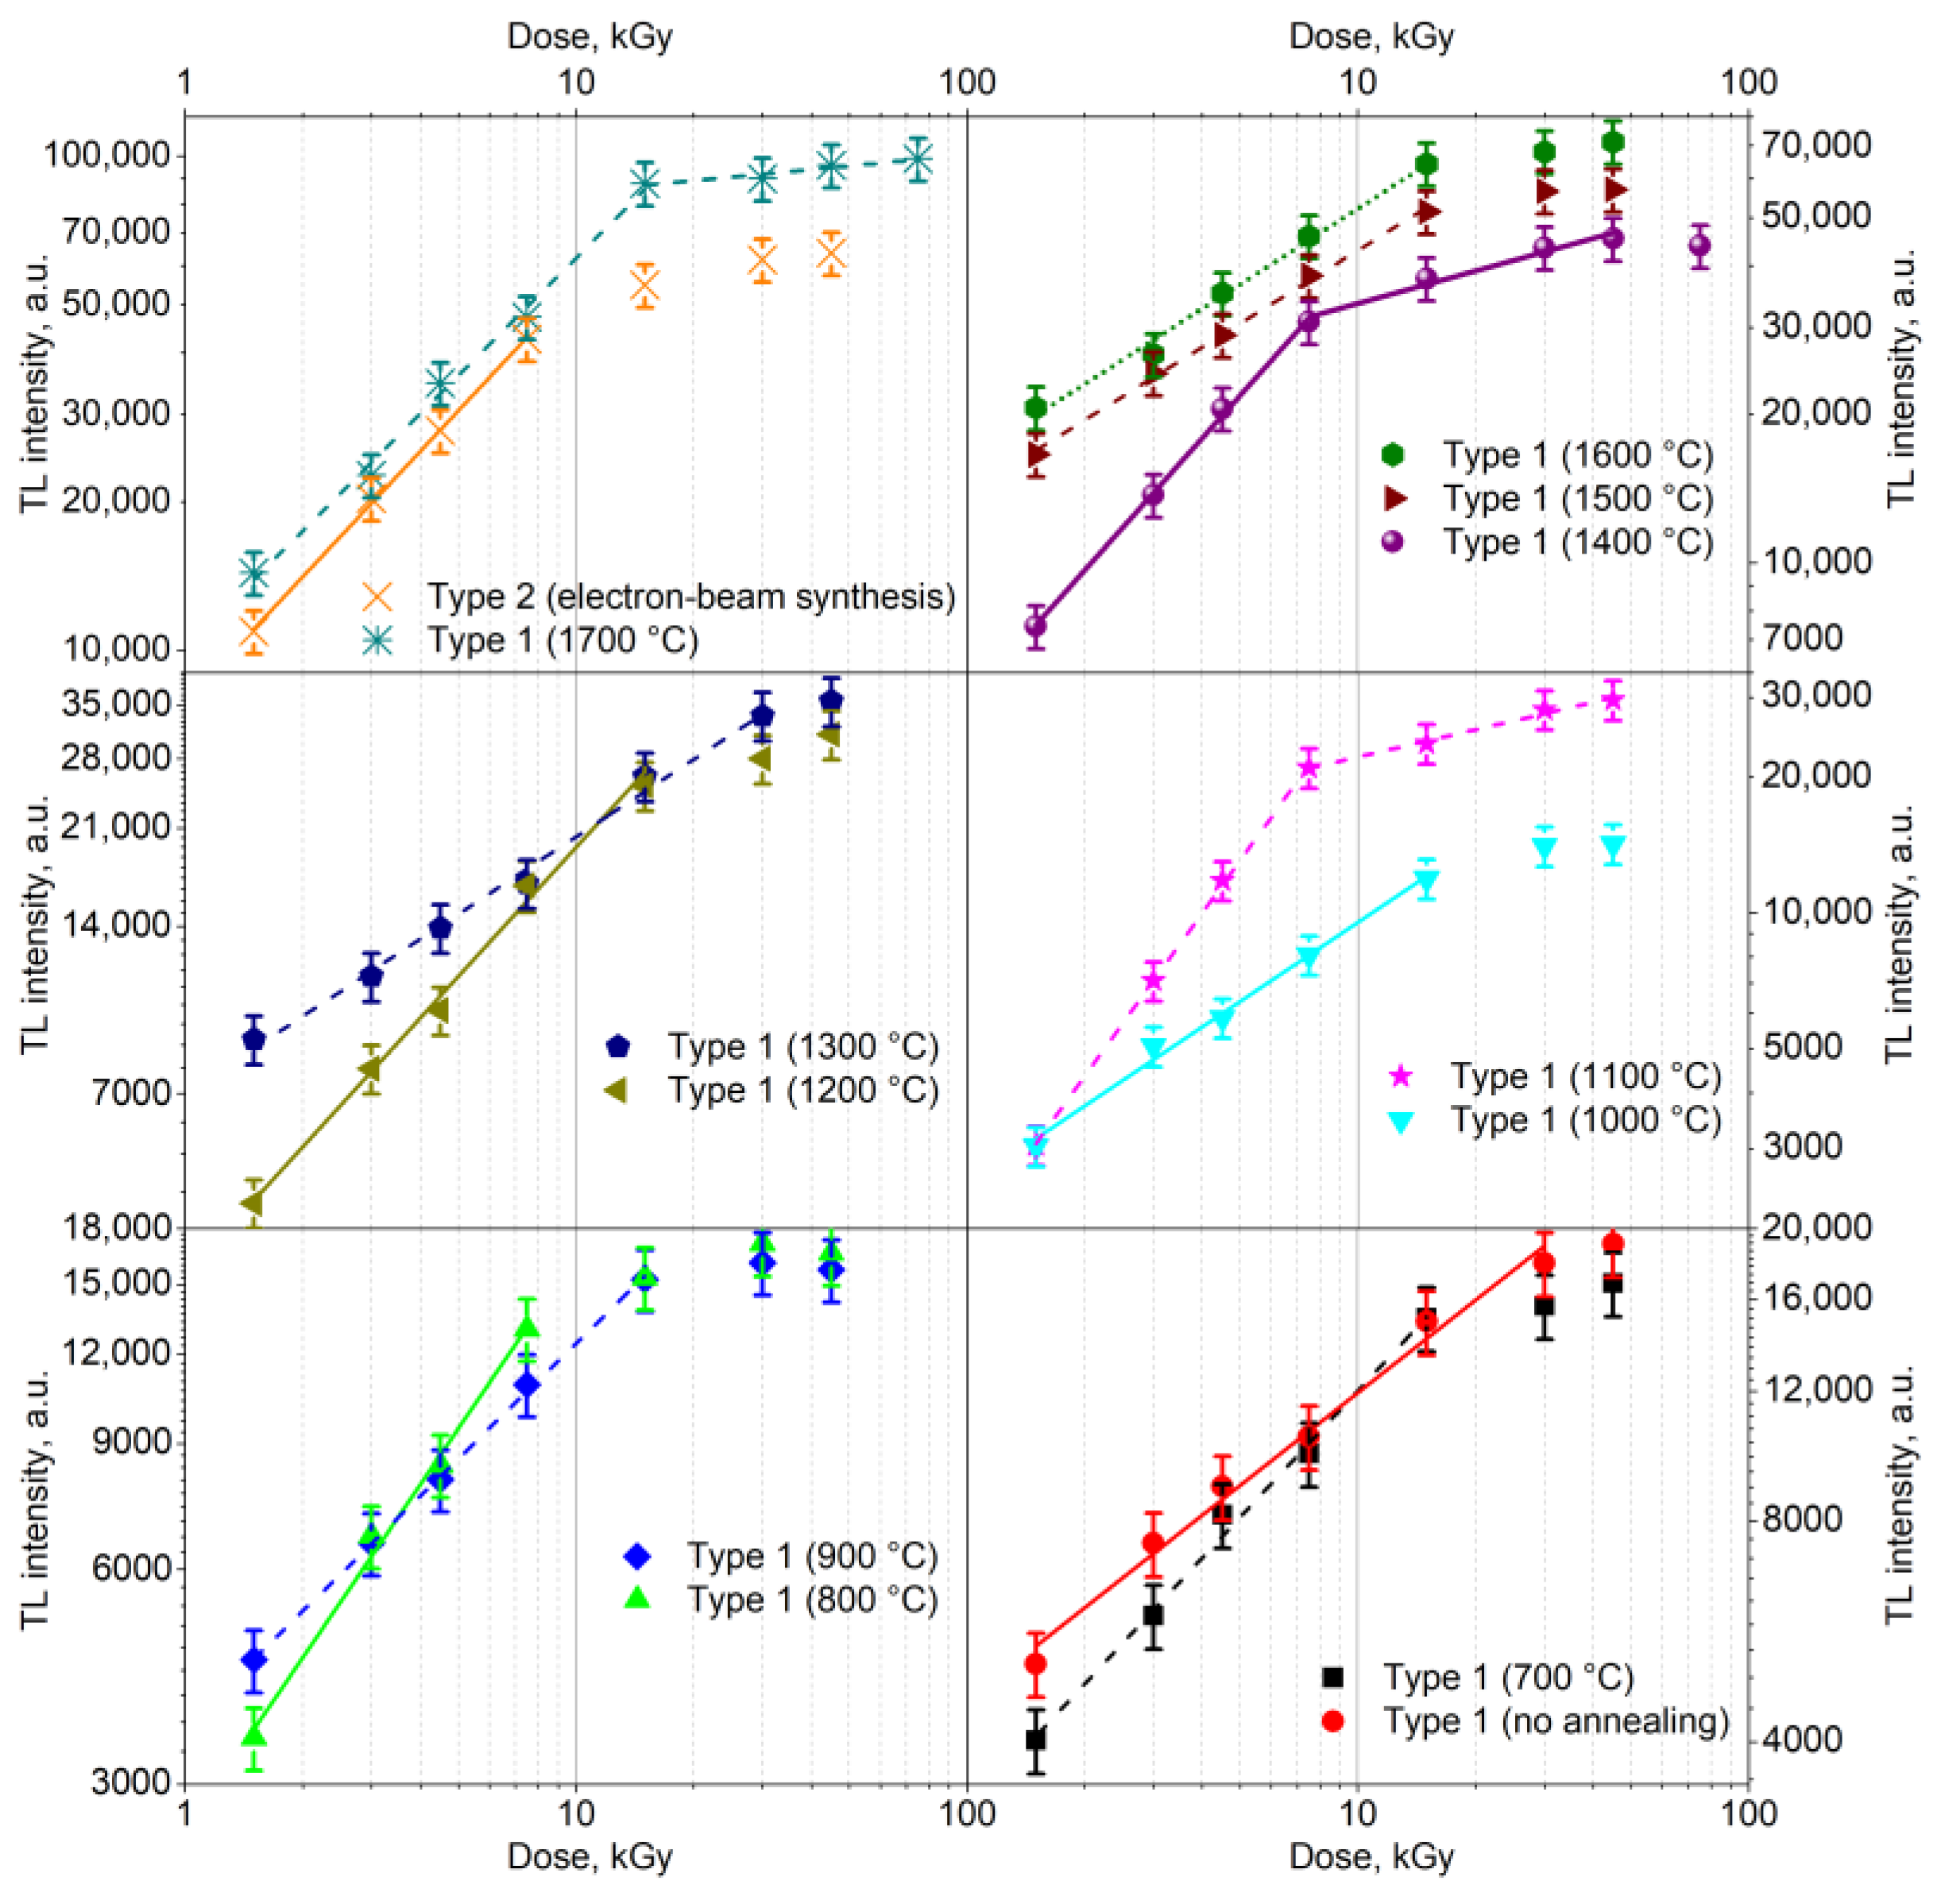
For the first time, the influence of crystallite size on the nonlinearity coefficient of dose dependences of the TL peak at 390 K and the magnitude of fading were established.
Thus, the presence of an intense isolated TL peak, the sublinear nature of most dose dependencies, and negligible fading make the ceramics synthesized in this work promising for measuring high doses (on the order of kGy) of pulsed electron beams. It should be noted that the conclusions drawn in the work are based on experiments conducted in laboratory conditions. To develop commercial TL detectors based on the material under study, it is necessary to test them under the conditions of real radiation technologies.

Author Contributions

Writing—original draft, S.N. Writing—review & editing, A.D., Investigation, M.G. (Maksim Gerasimov), Y.K., V.L., M.G. (Mikhail Golkovski), Methodology, O.D., V.L. and M.G. (Mikhail Golkovski), Formal analysis, O.D. and A.I.P., Software, A.A. (Aiman Akylbekova), Data curation, A.-D.B., Project administration. Conceptualization, A.A. (Abdirash Akilbekov), Validation, A.I.P. All authors have read and agreed to the published version of the manuscript.

Funding

This research has been funded by the Science Committee of the Ministry of Science and Higher Education of the Republic of Kazakhstan (Grant No. AP09260057).

Data Availability Statement

The data sets are available from the corresponding author upon reasonable request.

Acknowledgments

The work was carried out under the grant of the Ministry of Science and Higher Education of the Republic of Kazakhstan AP09260057 «Luminescence and radiation resistance of synthesized under different conditions micro- and nanostructured compacts and ceramics based on ZrO2».

Conflicts of Interest

The authors declare no conflict of interest.

References

  1. Barry Carter, C.; Grant Norton, M. Ceramic Materials: Science and Engineering; Springer: New York, NY, USA, 2007; p. 716. [Google Scholar] [CrossRef]
  2. Salas-Juárez, C.J.; Cruz-Vázquez, C.; Avilés-Monreal, R.; Bernal, R. Afterglow based detection and dosimetry of beta particle irradiated ZrO2. Appl. Radiat. Isot. 2018, 138, 6–9. [Google Scholar] [CrossRef] [PubMed]
  3. Lokesha, H.S.; Chithambo, M.L.; Chikwembani, S. Thermoluminescence of monoclinic ZrO2: Kinetic analysis and dosimetric features. J. Lumin. 2020, 218, 116864. [Google Scholar] [CrossRef]
  4. Kortov, V.S. Nanophosphors and outlooks for their use in ionizing radiation detection. Radiat. Meas. 2010, 45, 512–515. [Google Scholar] [CrossRef]
  5. Salah, N. Nanocrystalline materials for the dosimetry of heavy charged particles: A review. Radiat. Phys. Chem. 2011, 80, 1–10. [Google Scholar] [CrossRef]
  6. Seid, E.T.; Dejene, F.B. Post-heat treatment effect on the properties of indium doped zinc oxide nanocrystals produced by the sol-gel method. Opt. Mater. Express 2020, 10, 2849–2865. [Google Scholar] [CrossRef]
  7. Wang, Z.; Zhang, J.; Zheng, G.; Liu, Y.; Zhao, Y. The unusual variations of photoluminescence and afterglow properties in monoclinic ZrO2 by annealing. J. Lumin. 2012, 132, 2817–2821. [Google Scholar] [CrossRef]
  8. Aleksanyan, E.; Kirm, M.; Feldbach, E.; Harutyunyan, V. Identification of F+ centers in hafnia and zirconia nanopowders. Radiat. Meas. 2016, 90, 84–89. [Google Scholar] [CrossRef]
  9. Paje, S.E.; Llopis, J. Photoluminescence decay and time-resolved spectroscopy of cubic yttria-stabilized zirconia. Appl. Phys. A 1994, 59, 569–574. [Google Scholar] [CrossRef]
  10. Phatak, G.M.; Gangadharan, K.; Pal, H.; Mittal, J.P. Luminescence properties of Ti-doped gem-grade zirconia powders. Bull. Mater. Sci. 1994, 17, 163–169. [Google Scholar] [CrossRef]
  11. Ito, T.; Maeda, M.; Nakamura, K. Similarities in photoluminescence in hafnia and zirconia induced by ultraviolet photons. J. Appl. Phys. 2005, 97, 054104. [Google Scholar] [CrossRef]
  12. Cong, Y.; Li, B.; Yue, S.; Fan, D.; Wang, X. Effect of oxygen vacancy on phase transition and photoluminescence properties of nanocrystalline zirconia synthesized by the one-pot reaction. J. Phys. Chem. C 2009, 113, 13974–13978. [Google Scholar] [CrossRef]
  13. Lokesha, H.S.; Nagabhushana, K.R.; Singh, F. Effect of annealing on luminescence of ZrO2 irradiated with 100 MeV Si7+ ions. Opt. Mater. 2020, 107, 109984. [Google Scholar] [CrossRef]
  14. Joy, K.; Berlin, I.J.; Nair, P.B.; Lakshmi, J.S.; Daniel, G.P.; Thomas, P.V. Effects of annealing temperature on the structural and photoluminescence properties of nanocrystalline ZrO2 thin films prepared by sol-gel route. J. Phys. Chem. Solids 2011, 72, 673–677. [Google Scholar] [CrossRef]
  15. Ashraf, S.; Irfan, M.; Kim, D.; Jang, J.-H.; Han, W.-T.; Jho, Y.-D. Optical influence of annealing in nano- and submicron-scale ZrO2 powders. Ceram. Int. 2014, 40, 8513–8518. [Google Scholar] [CrossRef]
  16. Tamrakar, R.K.; Tiwari, N.; Kuraria, R.K.; Bisen, D.P.; Dubey, V.; Upadhyay, K. Effect of annealing temperature on thermoluminescence glow curve for UV and gamma ray induced ZrO2: Ti phosphor. J. Radiat. Res. Appl. Sci. 2015, 8, 1–10. [Google Scholar] [CrossRef]
  17. Ghyngazov, S.A.; Frangulyan, T.S.; Chernyavskii, A.V.; Gorier, A.K.; Naiden, E.P. Radiation-Thermal Sintering of Zirconia Powder Compacts Under Conditions of Bilateral Heating Using Beams of Low-Energy Electrons. Russ. Phys. J. 2015, 58, 188–191. [Google Scholar] [CrossRef]
  18. Suvorov, S.A.; Turkin, I.A.; Dedovets, M.A. Microwave Synthesis of Corundum-Zirconia Materials. Refract. Ind. Ceram. 2002, 43, 283–288. [Google Scholar] [CrossRef]
  19. Trindade, N.M.; Silva, E.P.; Nunes, M.C.S.; Munoz, J.M.; Santos, J.C.A.; Yoshimura, E.M.; Silva, R.S. Synthesis and thermoluminescence properties of MgAl2O4: Ca laser-sintered ceramics. Opt. Mater. 2020, 108, 110181. [Google Scholar] [CrossRef]
  20. Lisitsyn, V.; Mussakhanov, D.; Tulegenova, A.; Kaneva, E.; Lisitsyna, L.; Golkovski, M.; Zhunusbekov, A. The Optimization of Radiation Synthesis Modes for YAG: Ce Ceramics. Materials 2023, 16, 3158. [Google Scholar] [CrossRef]
  21. Mehnert, R. Electron beams in research and technology. Nucl. Instrum. Methods Phys. Res. Sect. B Beam Interact. Mater. At. 1995, 105, 348–358. [Google Scholar] [CrossRef]
  22. Nasiri, S.; Rabiei, M.; Palevicius, A.; Janusas, G.; Vilkauskas, A.; Nutalapati, V.; Monshi, A. Modified Scherrer equation to calculate crystal size by XRD with high accuracy, examples Fe2O3, TiO2 and V2O5. Nano Trends 2023, 3, 100015. [Google Scholar] [CrossRef]
  23. Kiisk, V.; Puust, L.; Utt, K.; Maaroos, A.; Mändar, H. Photo-, thermo- and optically stimulated luminescence of monoclinic zirconia. J. Lumin. 2016, 174, 49–55. [Google Scholar] [CrossRef]
  24. Nikiforov, S.V.; Menshenina, A.A.; Konev, S.F. The influence of intrinsic and impurity defects on the luminescent properties of zirconia. J. Lumin. 2019, 212, 219–226. [Google Scholar] [CrossRef]
  25. Lushchik, A.; Karner, T.; Lushchik, C.; Schwartz, K.; Savikhin, F.; Shablonin, E.; Shugai, A.; Vasil’chenko, E. Electronic excitations and defect creation in wide-gap MgO and Lu3Al5O12 crystals irradiated with swift heavy ions. Nucl. Instuments Methods Phys. Res. B 2012, 286, 200–208. [Google Scholar] [CrossRef]
  26. Costantini, J.; Beuneu, F.; Gourier, D.; Trautmann, C.; Calas, G.; Toulemonde, M. Colour centre production in yttria-stabilized zirconia by swift charged particle irradiations. J. Phys. Condens. Matter 2004, 16, 3957–3971. [Google Scholar] [CrossRef]
  27. Nikiforov, S.V.; Kortov, V.S.; Kazantseva, M.G.; Petrovykh, K.A. Luminescent properties of monoclinic zirconium oxide. J. Lumin. 2015, 166, 111–116. [Google Scholar] [CrossRef]
  28. Chen, R.; McKeever, S.W.S. Theory of Thermoluminescence and Related Phenomena; World Scientific: Singapore, 1997; p. 559. [Google Scholar] [CrossRef]
  29. Nikiforov, S.V.; Ananchenko, D.V.; Ramazanova, G.R.; Shtang, T.V.; Ishchenko, A.V.; Yakovlev, G.A. The effect of annealing temperature on the change in the structure, luminescent and dosimetric properties of ultrafine α-Al2O3 ceramics. Radiat. Meas. 2023, 166, 106981. [Google Scholar] [CrossRef]
  30. Lokesha, H.S.; Chithambo, M.L. A combined study of the thermoluminescence and electron paramagnetic resonance of point defects in ZrO2:Er3+. Radiat. Phys. Chem. 2020, 172, 108767. [Google Scholar] [CrossRef]
  31. Mandlik, N.T.; Sahare, P.D.; Dhole, S.D. Effect of size variation and gamma irradiation on thermoluminescence and photoluminescence characteristics of CaSO4: Eu micro- and nanophosphors. Appl. Radiat. Isot. 2020, 159, 109080. [Google Scholar] [CrossRef] [PubMed]
  32. Saran, M.; Sahare, P.D.; Chauhan, V.; Kumar, R.; Mandlik, N.T. Thermoluminescence in Eu doped NaLi2PO4TLD nanophosphor: Effect of particle size on TL characteristics. J. Lumin. 2021, 238, 118207. [Google Scholar] [CrossRef]
  33. Altunal, V.; Guckan, V.; Ozdemir, A.; Yegingil, Z. A calcination study on BeO ceramics for radiation dosimetry. Mater. Res. Bull. 2020, 130, 110921. [Google Scholar] [CrossRef]
  34. Tsoutsoumanos, E.; Saleh, M.; Konstantinidis, P.G.; Altunal, V.; Sahare, P.D.; Yengigil, Z.; Karakasidis, T.; Kitis, G.; Polymeris, G.S. Nanostructured TLDs: Studying the impact of crystalline size on the Thermoluminescence glow-curve shape and electron trapping parameters. Radiat. Phys. Chem. 2023, 212, 111067. [Google Scholar] [CrossRef]
  35. Zhang, J.Z. Optical Properties and Spectroscopy of Nanomaterials; World Scientific Publishing Co., Pte. Ltd.: Singapore, 2009; p. 400. [Google Scholar] [CrossRef]
  36. Salah, N.; Sahare, P.D.; Lochab, S.P.; Kumar, P. TL and PL studies on CaSO4: Dy nanoparticles. Radiat. Meas. 2006, 41, 40–47. [Google Scholar] [CrossRef]
  37. Lawless, J.L.; Chen, R.; Pagonis, V. Sublinear dose dependence of thermoluminescence and optically stimulated luminescence prior to the approach to saturation level. Radiat. Meas. 2009, 44, 606–610. [Google Scholar] [CrossRef]
  38. Blair, M.W.; Jacobsohn, L.G.; Tornga, S.C.; Ugurlu, O.; Bennett, B.L.; Yukihara, E.G.; Muenchausen, R.E. Nanophosphor aluminum oxide: Luminescence response of a potential dosimetric material. J. Lumin. 2010, 130, 825–831. [Google Scholar] [CrossRef]
Figure 1. X-ray diffraction patterns of samples of zirconium dioxide ceramics synthesized under various conditions.
Crystals 13 01585 g001
Figure 2. Dependence of the half width of the diffraction peak at 28.28° on the synthesis temperature of type 1 ceramics.
Crystals 13 01585 g002
Figure 3. Dependence of crystallite size in type 1 ceramics on sintering temperature.
Crystals 13 01585 g003
Figure 4. TL curves of ceramics synthesized by various methods after irradiation with a test dose of a pulsed electron beam (15 kGy).
Crystals 13 01585 g004
Figure 5. Dependence of the intensity of the maximum TL peak at 390 K on the sintering temperature of type 1 ceramics.
Crystals 13 01585 g005
Figure 6. Dependence of TL activation energy at 390 K on the synthesis temperature of type 1 ceramics.
Crystals 13 01585 g006
Figure 7. Dependence of the frequency factor on the synthesis temperature of type 1 ceramics.
Crystals 13 01585 g007
Figure 8. Dependence of the order of TL kinetics on the synthesis temperature of type 1 ceramics.
Crystals 13 01585 g008
Figure 9. Dose dependences of the TL peak intensity at 390 K for samples synthesized under different conditions.
Crystals 13 01585 g009
Figure 10. Fading of TL peak at 390 K of ceramics synthesized under different conditions.
Crystals 13 01585 g010
Table 1. The results of kinetic parameter calculation for TL peak at 390 K.
Type of SampleTm, KT1, KT2, Kw, Kt, Kd, KShape Factor (mg)Kinetic
Order (b)
Ew, eVEt, eVEd, eVE, eVS, s−1
Type 2 (electron-beam synthesis)3913744073317160.481.51.201.201.191.20 4.9 × 10 14
Type 1 (1700 °C)3913734053218140.441.11.041.031.041.04 3.8 × 10 12
Type 1 (1600 °C)3913734053218140.441.11.041.031.041.04 3.8 × 10 12
Type 1 (1500 °C)3873694023318150.451.21.061.041.061.05 8.0 × 10 12
Type 1 (1400 °C)3873694013218140.441.11.021.011.021.02 2.7 × 10 12
Type 1 (1300 °C)3863684023418160.471.41.081.071.081.08 1.8 × 10 13
Type 1 (1200 °C)3853674023518170.491.61.101.091.091.09 3.4 × 10 13
Type 1 (1100 °C)3853654023720170.461.30.940.920.950.94 2.8 × 10 11
Type 1 (1000 °C)3833623993721160.431.10.840.820.840.83 1.3 × 10 10
Type 1 (900 °C)3953754093420140.411.00.900.890.880.89 2.9 × 10 10
Type 1 (800 °C)3883664033722150.411.00.760.760.750.76 8.7 × 10 8
Type 1 (700 °C)3953754093420140.411.00.900.890.880.89 2.9 × 10 10
Type 1 (no annealing)3853644003621150.421.00.820.810.810.81 5.3 × 10 9
Table 2. Results of approximation of the dose dependence of the TL peak at 390 K of ceramics synthesized under different conditions.
Type of SamplesDose Range, kGyNon-Linearity
Coefficient
Coefficient
of Determination, %
Type 2 (electron-beam synthesis)1.5–7.50.8499.9
Type 1 (1700 °C)1.5–150.7999.5
Type 1 (1600 °C)1.5–150.5199.2
Type 1 (1500 °C)1.5–150.4999.8
Type 1 (1400 °C)1.5–7.50.8999.9
Type 1 (1400 °C)7.5–450.2297.4
Type 1 (1300 °C)1.5–300.4699.2
Type 1 (1200 °C)1.5–150.7798.9
Type 1 (1100 °C)1.5–7.51.2099.9
Type 1 (1100 °C)7.5–450.2099.0
Type 1 (1000 °C)1.5–150.5899.4
Type 1 (900 °C)1.5–150.5499.9
Type 1 (800 °C)1.5–7.50.8199.3
Type 1 (700 °C)1.5–150.5799.4
Type 1 (no annealing)1.5–300.4298.9
Disclaimer/Publisher’s Note: The statements, opinions and data contained in all publications are solely those of the individual author(s) and contributor(s) and not of MDPI and/or the editor(s). MDPI and/or the editor(s) disclaim responsibility for any injury to people or property resulting from any ideas, methods, instructions or products referred to in the content.

