Abstract
The hydrogen-disordered structure of ice III makes it difficult to analyze its vibrational spectrum theoretically. To clarify the contribution of hydrogen bonds (HBs), we constructed a 24-molecule supercell to mimic the real structure and performed first-principles density functional theory calculations. The calculated curve of phonon density of states showed good correspondence with the experimental data. Based on the theory of two kinds of HB vibrational modes, we analyzed the distributions of two-bond modes and four-bond modes. The energy splitting of these modes results in a flat vibrational band, which is a common phenomenon in high-pressure ice phases. These findings verified the general rule that there are two types of HB vibrations in ice, thereby furthering our understanding of HB interactions in water ice and their broad role in nature.
1. Introduction
As a condensed state of water, ice is the most prevalent molecular crystal on Earth. By 2020, the year in which Jiang et al. [1] experimentally confirmed the existence of two-dimensional ice, over 20 amorphous and crystal ices had been revealed [2] in various environments. Most of these crystal phases can be classified into two categories according to whether their hydrogen atoms are long-range disordered or ordered in their lattices. There are six established pairs of disorder–order mated isomers: Ih/XI, III/IX, V/XIII, VI/XV, VII/VIII, and XII/XIV [3]. Each of these counterparts has identical oxygen sublattices but different hydrogen arrangements [4].
Ice III, one of the hydrogen-disordered (H-disordered) phases of ice, exists at 240–260 K and 0.2–0.35 GPa [5,6]. Because the oxygen locations are analogous to those of the silicon atoms in the SiO2 phase keatite, ice III is also called keatite ice [7]. The stable region of ice III covers a relatively small range of the phase diagram [5]. Commonly, metastable ice III is prepared in an ice II phase environment by raising the compression rate in the density-driven phase transition from hexagonal ice at 170 K [8]. Tammann was the first to identify the existence of ice III in 1900, with his work later confirmed by Bridgman [9,10]. In 1968, Whalley et al. found a gradual disorder–order transition from ice III to an antiferroelectric phase, denoted as ice IX [11]. In 1973, based on measurements of the heat and entropy of the ice III–IX transformation, Whalley and Nishibata [12] inferred that ice III transforms into partially disordered ice IX within a wide range of temperatures. Furthermore, the space group P41212 allows the hydrogen atoms to become partially ordered or disordered in ices III and IX, as proposed by Knight et al. [13]. In 2021, Salzmann reported a directly reversible phase transition between ices III and IX, which can be achieved by using ammonium fluoride as an anti-ice-II agent [14].
Since two distinct peaks in the far-infrared (IR) region of ice were first probed in the 1990s by inelastic neutron scattering (INS) experiments [15,16,17], the origin of these two vibrational peaks has remained a controversial issue [18,19,20]. Using first-principles density functional theory (DFT), we developed an approach to determine the lattice dynamic process of the crystal vibrational spectrum. Two kinds of intrinsic HB vibrational modes, denoted two-bond and four-bond modes, were found for the ideal ice Ic [21]. A series of investigations of the ice phases has revealed that this is a general rule for the ice family and may successfully explain their far-IR band [18,19,20]. In the present study, we theoretically analyzed the vibrational modes in the translation band to identify the characteristic HB vibrations of ice III in comparison with those of the H-ordered ice IX.
2. Computational Method
For the H-disordered ice III, there is no periodically repeating unit. Using the source code GenIce [22], we constructed a 24-molecule supercell of ice III, with hydrogen atoms randomly rearranged on the basis of Bernal–Fowler rules [23], to mimic the periodic primitive cell. From these stochastic results, we selected the cell with the lowest polarizability to use in our ideal model. This approach can improve the calculation efficiency, and it proved effective in our previous study on ice XII [24].
First-principles DFT calculations were conducted with the Cambridge Serial Total Energy Package (CASTEP) [25]. We used the generalized gradient approximation to handle the complicated spatial distribution of electron density. The revised Perdew–Burke–Ernzerhof (RPBE) exchange–correlation functional was selected because it gives rise to the most satisfactory accuracy for the vibrational spectrum calculation of ice [18]. The energy threshold and self-consistent field tolerance were both set at eV/atom for the geometry optimization. Norm-conserving pseudopotentials were introduced to calculate the phonon density of states (PDOS) with the linear response method. The energy cutoff was 830 eV, and the K-point mesh was . The environmental pressure was set at 0.3 GPa to simulate real experimental conditions.
3. Results and Discussion
In general, thermal neutrons exchange energy with phonons throughout the first Brillouin zone in an INS experiment, and the calculated PDOS curve reflects the entire PDOS. Thus, the PDOS curve can be directly verified by the INS spectrum, as shown in Figure 1.
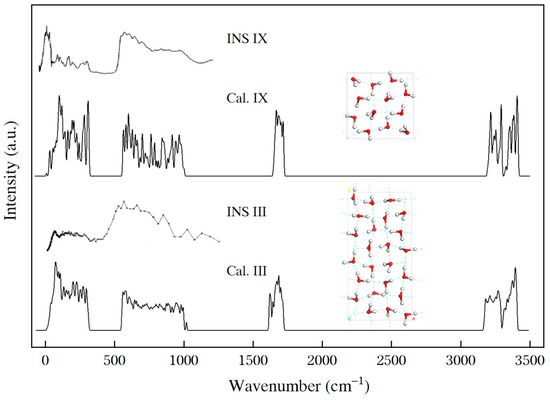
Figure 1.
Comparisons of the experimental INS spectra (“INS”) [16,26] and the calculated PDOS curves (“Cal.”) of ices IX and III. The inserts show the structures of the primitive cells.
In the far-IR region, the INS spectrum of ice III shows an absorption band from 14.2 meV to 40.1 meV (114 cm−1 to 327 cm−1), which matches the band from 118 cm−1 to 317 cm−1 of the PDOS. Compared with the Raman scattering results for ice III [27,28], there is a peak at 188 cm−1, which matches the peak at 198 cm−1 in PDOS.
For a 12-molecule primitive cell of ice IX, there are optical normal modes. By comparison, a 24-molecule supercell of ice III contains optical normal modes. Because ice III is H-disordered, all the modes are nondegenerate, and many close-lying modes merge to produce a smoother curve in the spectrum than that of ice IX. The PDOS of ices III and IX are consistent with their respective INS spectra. In the translation band, it is clear that the two typical HB peaks are at approximately 200 cm−1 and 300 cm−1 for ice IX [20], whereas there is a flat vibrational band for ice III in the same region. To analyze the HBs of ice III, we first introduce the theory of two kinds of intrinsic HB vibrational modes in ice.
Subject to Bernal–Fowler rules, every water molecule in an ice lattice is linked to four water molecules via HBs [23]. The simplest primitive cell is H-ordered ice Ic. Our theoretical analysis of HB vibrational modes previously found that there are only two kinds of normal modes, which are responsible for the two typical peaks in the translational band [21]. For the strong vibrational mode, the molecule vibrates along the H–O–H angle bisectors with four HBs stretching against the four neighbors—this is the four-bond mode. For the weak vibrational mode, the molecules oscillate along two HBs while the other two remain static—this is the two-bond mode. The vibrational frequency of the four-bond mode is higher than that of the two-bond mode.
Hereafter, we give the analytical solution according to the simulated results. Based on an ideal tetrahedral structure of H-ordered ice Ic, the lattice dynamics analysis is conducted as follows. We simplify a water molecule as a point mass with the position of oxygen taken as the mass center. Thus, there are two atoms per primitive cell [21]. Under the harmonic approximation, the vibrational energy is a sum of eight O–O oscillators expressed as
where k is the HB force constant, d0 is the O–O equilibrium distance, i indicates that there are two point masses in the primitive cell, and j indicates that there are four neighbors. The factor 1/4 is introduced to subtract the double-counted potential energy. Next, we replace the displacement term with . There are six degrees of freedom per primitive cell, which are expressed by the generalized coordinate indices α, β = 1, 2,…, 6. Performing a Taylor series expansion on produces
Considering the included angle cosθ between the HB and vibrational orientations, the constant 4/3 is generated from the rotational symmetry:
Without hydrogen atoms, we can obtain three degenerate eigenvalues of frequencies, which represent three optical vibrational modes. The structure of the diamond is suitable for this type of model. However, the DFT calculation only presents two frequencies. This is due to the breaking of the tetrahedral symmetry by hydrogen atoms, which results in two force constants. Ideal ice Ic contains three intermolecular optical vibrational modes—one is strong and the other two are weak and degenerate [21]. Based on the computational results, the two vibrational frequencies are at 320.76 cm−1 and 229.96 cm−1. Consider the relationship between the frequency and force constant,
The ratio between the force constants of the two vibrational modes is, therefore
This result shows that the force constant of the four-bond mode is double that of the two-bond mode, with a vibrational energy ratio of . The two intrinsic HB vibrational modes originate from the local tetrahedral geometry of the ice lattice. This finding has proved to be a general rule for the ice family [18]. For ice phases under atmospheric pressure, such as ices Ih, XI, and Ic, the two characteristic HB peaks can be easily explained by the existence of two kinds of HB vibrational modes. However, for high-pressure ices, the PDOS for their HBs show complicated curves that need to be analyzed individually.
To determine the two kinds of HB vibrational modes in ice III, we employed a self-compiled program to classify the normal modes in the translation band [19]. The criterion for classification is based on the included angle between the vibrational direction and the H–O–H angle bisector. As shown in Figure 2, the HB vibrational modes are categorized into two groups: two-bond modes and four-bond modes. If we sum the two curves, the result largely matches the PDOS. The two curves both show energy splitting at above 200 cm−1. Thus, all the phonons show a superposition band without two characteristic peaks as in ice Ih. Figure 3 presents three example modes, of which the mode at 217 cm−1 is a two-bond vibration, and the other two are four-bond vibrations. To observe the dynamic processes, please see the three animations in the Supplementary Materials.
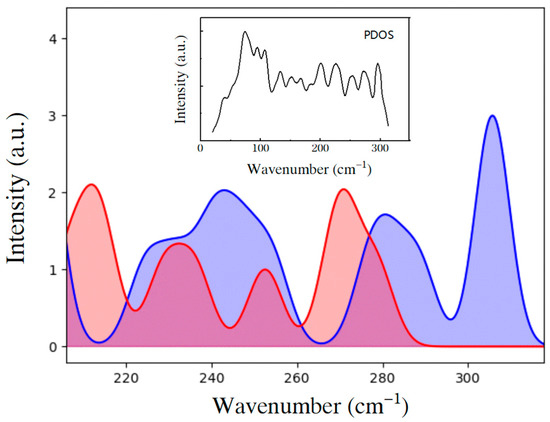
Figure 2.
Fitted distribution curves of the four-bond modes (blue) and two-bond modes (red) of ice III from 200 cm−1 to 320 cm−1. The inset is the overall PDOS curve in the translation band.
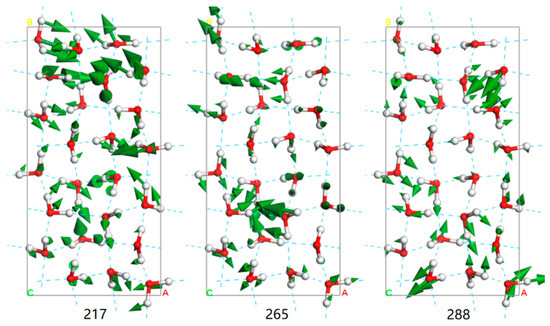
Figure 3.
Three vibrational modes at 217 cm−1, 265 cm−1, and 288 cm−1 of ice III in the translational band. The green arrow indicates the vibrational direction and its size is proportional to the amplitude. The blue dotted lines represent the HBs.
Notably, the mixed HB vibrational modes lead to a broad overlapping zone below 280 cm−1. Because the HB strength is determined by the bond length and included angle [29], we analyze the intramolecular HB bond lengths and the included angles between HBs around one central molecule in the tetrahedron, as presented by the distributions in Figure 4. The included angles are divided into two groups at and 130° (109°28′ in an ideal tetrahedron), and the bond lengths range from 1.82 Å to 1.89 Å (1.79 Å to 1.87 Å in ice Ic [21]). This demonstrates how high pressure deforms the tetrahedral structure of ice III. Similar to our previous discussions on ice V [30], the tetrahedral symmetry in ice III is remarkably distorted by this high pressure. Unlike the six-membered rings that exist under atmospheric pressure, five-, seven-, and eight-membered rings occur in ice III [31]. Moreover, the five-membered rings combine to form bicyclo-heptamers [32]. The broad distributions of bond lengths and deformed angles result in various HB strengths. This is the origin of the energy splitting in both the two-bond and four-bond modes. By comparison, ice IX, the H-ordered counterpart of ice III, has two relatively well-defined HB peaks, as shown in Figure 1. This is because the simple primitive cell of ice IX reduces the phonon complexity, making the spectrum simpler to interpret.
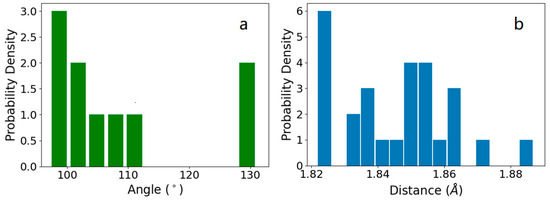
Figure 4.
(a) Distribution of the included angles between HBs in ice III. (b) Distribution of the HB lengths in the ice III supercell.
4. Conclusions
To clarify the vibrational characteristics of H-disordered ice III in the far-IR region, we calculated its normal modes and PDOS curve. The good agreement between the PDOS and INS experimental data enabled us to further investigate the HB normal modes. Although its H-ordered counterpart, ice IX, presents two HB peaks, the experimental and simulated results for ice III presented multiple peaks in the HB region. Based on the theory of two HB vibrational modes, we found that the deformation of local tetrahedra by high pressure may be responsible for the energy splitting for both two-bond and four-bond modes. The overlapping of nondegenerate phonons produced a flat vibrational band.
We first found the two kinds of intrinsic HB vibrational modes in H-ordered ice Ic, which has only two molecules per primitive cell [21]. Then, we confirmed that the two distinct HB peaks in ice Ih originated from these two kinds of HB modes [19]. By now, we have investigated almost all the ice phases, thereby determining that this is a general rule for ice because of its local tetrahedral structure [18]. Based on these new findings, we have obtained a deeper understanding of the HB interactions in water ice and their broad role in nature.
Supplementary Materials
The following supporting information can be downloaded at: https://www.mdpi.com/article/10.3390/cryst12070910/s1, Video S1: Dynamic animation at 217 cm−1; Video S2: Dynamic animation at 265 cm−1; Video S3: Dynamic animation at 288 cm−1.
Author Contributions
Investigation, S.-Y.N., Y.-N.L. and J.-W.C.; simulation, S.-Y.N., Y.J. and X.-Y.L.; formal analysis, H.-J.W., X.-Q.Y. and X.-T.D.; writing—original draft preparation, S.-Y.N.; writing—review and editing, P.Z. All authors have read and agreed to the published version of the manuscript.
Funding
This research received no external funding.
Institutional Review Board Statement
Not applicable.
Informed Consent Statement
Not applicable.
Data Availability Statement
All the data used to support our study is contained within the article.
Acknowledgments
The numerical calculations were performed on the supercomputing system in the Supercomputing Center, Shandong University, Weihai.
Conflicts of Interest
The authors declare no conflict of interest.
References
- Ma, R.; Cao, D.; Zhu, C.; Tian, Y.; Peng, J.; Guo, J.; Chen, J.; Li, X.Z.; Francisco, J.S.; Zeng, X.C.; et al. Atomic imaging of the edge structure and growth of a two-dimensional hexagonal ice. Nature 2020, 577, 60–63. [Google Scholar] [CrossRef] [PubMed]
- Millot, M.; Coppari, F.; Rygg, J.R.; Barrios, A.C.; Hamel, S.; Swift, D.C.; Eggert, J.H. Nanosecond X-ray diffraction of shock-compressed superionic water ice. Nature 2019, 569, 251–255. [Google Scholar] [CrossRef] [PubMed]
- Moberg, D.R.; Sharp, P.J.; Paesani, F. Molecular-level interpretation of vibrational spectra of ordered ice phases. J. Phys. Chem. B 2018, 122, 10572–10581. [Google Scholar] [CrossRef]
- Komatsu, K.; Klotz, S.; Machida, S.; Sano-Furukawa, A.; Hattori, T.; Kagi, H. Anomalous hydrogen dynamics of the ice VII-VIII transition revealed by high-pressure neutron diffraction. Proc. Natl. Acad. Sci. USA 2020, 117, 6356–6361. [Google Scholar] [CrossRef] [PubMed]
- Salzmanna, C.G. Advances in the experimental exploration of water’s phase diagram. J. Chem. Phys. 2019, 150, 060901. [Google Scholar] [CrossRef]
- Bertie, J.E.; Whalley, E.; Calvert, L.D. Transformations of ice II, ice III, and ice V at atmospheric pressure. J. Chem. Phys. 1963, 38, 840–846. [Google Scholar] [CrossRef]
- Svishchev, I.M.; Kusalik, P.G. Quartzlike polymorph of ice. Phys. Rev. B 1996, 53, R8815. [Google Scholar] [CrossRef] [Green Version]
- Bauer, M.; Elsaesser, M.S.; Winkel, K.; Mayer, E.; Loerting, T. Compression-rate dependence of the phase transition from hexagonal ice to ice II and/or ice III. Phys. Rev. B 2008, 77, 220105. [Google Scholar] [CrossRef] [Green Version]
- Bridgman, P.W. Water, in the liquid and five solid forms, under pressure. Proc. Amer. Acad. Arts 1912, 47, 441–558. [Google Scholar] [CrossRef]
- Tammann, G. Ueber die Grenzen des festen Zustandes IV. Ann. Phys.-Berlin 1900, 307, 1–31. [Google Scholar] [CrossRef] [Green Version]
- Whalley, E.; Heath, J.B.R.; Davidson, D.W. Ice IX–an antiferroelectric phase related to ice III. J. Chem. Phys. 1968, 48, 2362–2370. [Google Scholar] [CrossRef]
- Nishibata, K.; Whalley, E. Thermal effects of transformation ice III-IX. J. Chem. Phys. 1974, 60, 3189–3194. [Google Scholar] [CrossRef]
- Knight, C.; Singer, S.J. A reexamination of the ice III/IX hydrogen bond ordering phase transition. J. Chem. Phys. 2006, 125, 064506. [Google Scholar] [CrossRef] [PubMed]
- Sharif, Z.; Shephard, J.J.; Slater, B.; Bull, C.L.; Hart, M.; Salzmann, C.G. Effect of ammonium fluoride doping on the ice III to ice IX phase transition. J. Chem. Phys. 2021, 154, 114502. [Google Scholar] [CrossRef]
- Li, J. Inelastic neutron scattering studies of hydrogen bonding in ices. J. Chem. Phys. 1996, 105, 6733–6755. [Google Scholar] [CrossRef]
- Li, J.C.; Londono, J.D.; Ross, D.K.; Finney, J.L.; Tomkinson, J.; Sherman, W.F. An inelastic incoherent neutron-scattering study of ice II, ice-IX, ice-V, and ice-VI–in the range from 2 to 140 meV. J. Chem. Phys. 1991, 94, 6770–6775. [Google Scholar] [CrossRef]
- Schober, H.; Koza, M.; Tölle, A.; Fujara, F.; Angell, C.; Böhmer, R. Amorphous polymorphis in ice investigated by inelastic neutron scattering. Phys. B 1997, 241, 897–902. [Google Scholar] [CrossRef]
- Qin, X.L.; Zhu, X.L.; Cao, J.W.; Wang, H.C.; Zhang, P. Investigation of hydrogen bond vibrations of ice. Acta Phys. Sin. 2021, 70, 146301. [Google Scholar] [CrossRef]
- Zhu, X.L.; Cao, J.W.; Qin, X.L.; Jiang, L.; Gu, Y.; Wang, H.C.; Liu, Y.; Kolesnikov, A.I.; Zhang, P. Origin of two distinct peaks of ice in the Thz region and its application for natural gas hydrate dissociation. J. Phys. Chem. C 2019, 124, 1165–1170. [Google Scholar] [CrossRef]
- Zhao, Z.J.; Qin, X.L.; Cao, J.W.; Zhu, X.L.; Yang, Y.C.; Wang, H.C.; Zhang, P. Computing investigations of molecular and atomic vibrations of ice IX. ACS Omega 2019, 4, 18936–18941. [Google Scholar] [CrossRef]
- Yuan, Z.Y.; Zhang, P.; Yao, S.k.; Lu, Y.-B.; Yang, H.Z.; Luo, H.W.; Zhao, Z.J. Computational assignments of lattice vibrations of ice Ic. RSC Adv. 2017, 7, 36801–36806. [Google Scholar] [CrossRef] [Green Version]
- Matsumoto, M.; Yagasaki, T.; Tanaka, H. Genice: Hydrogen-disordered ice generator. J. Comput. Chem. 2018, 39, 61–64. [Google Scholar] [CrossRef] [PubMed]
- Bernal, J.D.; Fowler, R.H. A theory of water and ionic solution, with particular reference to hydrogen and hydroxyl ions. J. Chem. Phys. 1933, 1, 515–548. [Google Scholar] [CrossRef]
- Yuan, X.Q.; Yu, X.H.; Zhu, X.L.; Wang, X.C.; Liu, X.Y.; Cao, J.W.; Qin, X.L.; Zhang, P. Comparative analysis of the hydrogen bond vibrations of ice XII. ACS Omega 2022, 7, 2970–2974. [Google Scholar] [CrossRef] [PubMed]
- Clark, S.J.; Segall, M.D.; Pickard, C.J.; Hasnip, P.J.; Probert, M.J.; Refson, K.; Payne, M.C. First principles methods using castep. Z. Kristall. 2005, 220, 567–570. [Google Scholar] [CrossRef] [Green Version]
- Smirnov, L.S.; Ivanov, A.N.; Kolesnikov, A.I.; Natkaniec, I. “In situ” neutron scattering studies of ice under high pressure. High Press. Res. 1999, 16, 187–199. [Google Scholar] [CrossRef]
- Taylor, M.; Whalley, E. Raman spectra of ices Ih, Ic, II, III, and V. J. Chem. Phys. 1964, 40, 1660–1664. [Google Scholar] [CrossRef]
- Kruger, Y.; Mercury, L.; Canizares, A.; Marti, D.; Simon, P. Metastable phase equilibria in the ice II stability field. A Raman study of synthetic high-density water inclusions in quartz. Phys. Chem. Chem. Phys. 2019, 21, 19554–19566. [Google Scholar] [CrossRef] [Green Version]
- Grabowski, S. Intramolecular hydrogen bond energy and its decomposition—O–H∙∙∙O interactions. Crystals 2020, 11, 5. [Google Scholar] [CrossRef]
- Cao, J.W.; Zhu, X.L.; Wang, H.C.; Qin, X.L.; Yuan, X.Q.; Wang, X.C.; Yu, J.L.; Ma, X.T.; Li, M.M.; Zhang, P. A strategy for the analysis of the far-infrared vibrational modes of hydrogen-disordered ice V. J. Phys. Chem. C 2021, 125, 7913–7918. [Google Scholar] [CrossRef]
- Johari, G.P. The dipolar correlation factor and dipole moment of a water molecule in ice III. Philos. Mag. B-Phys. Condens. Matter Stat. Mech. Electron. Opt. Magn. Prop. 2006, 39, 219–228. [Google Scholar] [CrossRef]
- Applegate, L.C.; Forbes, T.Z. Controlling water structure and behavior: Design principles from metal organic nanotubular materials. Crystengcomm 2020, 22, 3406–3418. [Google Scholar] [CrossRef]
Publisher’s Note: MDPI stays neutral with regard to jurisdictional claims in published maps and institutional affiliations. |
© 2022 by the authors. Licensee MDPI, Basel, Switzerland. This article is an open access article distributed under the terms and conditions of the Creative Commons Attribution (CC BY) license (https://creativecommons.org/licenses/by/4.0/).