Abstract
A Cr4+-doped TiTe3O8 crystal with dimensions up to 21 mm × 21 mm × 11 mm was grown successfully by the top-seeded solution growth method. A high-resolution X-ray diffraction experiment showed that the full width at half-maximum of the rocking curve was 41.90″. Energy-dispersive spectrometry (EDS) and X-ray fluorescence spectroscopy (XRF) proved that Cr4+ ions have been doped into the TiTe3O8 crystal with molar percentage of 4.9%. The Cr:TiTe3O8 crystal exhibited an absorption range from 995 to 1565 nm, which is suitable for passive Q switch at 1064 nm. Then, a passive Q-switching solid-state laser operating at 1064 nm was realized using a Cr:TiTe3O8 crystal as the saturable absorber. The maximum laser pulse energy is calculated to be 0.7 μJ, and the maximum peak power reaches 0.7 W.
1. Introduction
Solid-state lasers have been widely used in the scientific research, medical treatment and military fields [1,2,3,4,5]. In order to obtain high energy outputs, the time domain modulation in laser operations is a kind of laser technology with much importance. Different from the acousto-optic and electro-optic Q-switching, passive Q-switching with saturable absorbers is a simple and economical method. Doping transition metal ions such as Cr4+, V3+ or Co2+ into crystals is the common method to obtain saturable absorbers [6,7,8,9]. The saturable absorber properties are mostly determined by doping transitions. Currently, the most widely used saturable absorber is Cr4+:YAG crystal due to the good optical and thermal properties of YAG [10] crystal. It is well-known that there are valence differences between the Cr4+ and Y3+ ions [11]. Therefore, the excellent optical crystals with positive ions exhibiting M4+ could be the ideal host crystals for the saturable absorbers.
TiTe3O8 belongs to the space group of Ia-3 in cubic system with a = 10.9585(5) Å [12,13]. The bulk crystal was firstly grown as a novel acousto-optic crystal in our group. The thermal conductivity coefficient of the TiTe3O8 was determined to be 3.3 Wm−1K−1 at room temperature [12], which indicates the crystal exhibits good thermal property and is suitable for optical applications. We consider the TiTe3O8 crystal as a suitable material for Cr4+ doping due to the valence balance and appropriate ion radii.
In this work, the Cr4+:TiTe3O8 crystal with dimensions up to 21 mm × 21 mm × 11 mm was successfully grown by the top-seeded solution growth method. The molar percentage of Cr4+ in TiTe3O8 crystal was determined to be 4.9%. The Cr:TiTe3O8 crystal exhibits a wide absorption band range from 995 to1565 nm due to the doping of the Cr4+ ions. Additionally, the Cr:TiTe3O8 crystal was successfully used as a saturable absorber in the laser operating at 1064 nm.
2. Materials and Methods
2.1. Synthesis and Growth of Cr:TiTe3O8 Single Crystal
The polycrystalline powders of Cr:TiTe3O8 were prepared using the traditional high-temperature solid-state reaction method. The TiO2 (Alfa Aesar, 99.99%), TeO2(Alfa Aesar, 99.99%) and CrO2 (Aladdin, 99.0%) with mole ratio of 0.95:3:0.05 were thoroughly ground together using an agate pestle and mortar to ensure homogeneity, and they were pressed into a column. Then, the column was heated from room temperature to 700 °C with a rate of 10 °C/min in air. After holding at 700 °C, the column was quenched to room temperature directly. It was ground, pressed and sintered two more times as described above.
The single crystal Cr:TiTe3O8 was grown by the flux method because TiTe3O8 is an incongruently melting compound. The flux consists of TeO2 and Li2CO3 with molar ration of 1:5. Then, a mixture of the Cr:TiTe3O8 polycrystalline powder and flux was placed in a dedicated temperature-controlled furnace. The furnace was heated up to 950 °C slowly and held for 3 days to ensure the mixture melted into a uniform and stable solution. A platinum wire was inserted into the surface of the solution. The temperature was decreased from 950 °C to 750 °C at a rate of 1 °C per hour. The saturation temperature was determined by observing whether the crystal was dissolved or grown in the solution. A crystal seed was cut from the millimeter-sized crystals which were grown by spontaneous crystallization on the platinum wire. Then, the selected crystal seed was tied to a platinum wire and put into the flux at the temperature of 4 °C above saturation point. The solution was cooled to the saturation temperature in two hours and then cooled at a rate of 0.5–0.8 °C per day. A single crystal was obtained after one month. When the growth process was finished, the crystal was pulled out from the solution and cooled to room temperature for three days.
2.2. Powder X-ray Diffraction (PXRD)
A multifunctional X-ray powder diffractometer D8 ADVANCE machine made by Bruker AXS was used in the experiment. The PXRD pattern was taken at room temperature by the Cu-Kα radiation over an angle range (2θ) from 10° to 90° with a scanning step size of 0.02°.
2.3. Laue Back-Reflection Measurement
The orientation and structure of the crystal can be obtained by analyzing the Laue X-ray back-diffraction image. A Laue X-ray backscattering diffractometer developed by Multiwire Laboratories Company was used in the experiment. The test was carried out on a Cr:TiTe3O8 wafer along the (200) plane with a size of 5 mm × 5 mm × 1 mm, which is mechanically polished on both sides.
2.4. High-Resolution X-ray Diffraction
It was carried out on a Bruker-AXS D8 DISCOVER diffractometer equipped by Cu-Kα1 radiation (λ = 1.54056 Å) source. The accelerating voltage and tube current were 60 kV and 80 Ma, respectively. The step size and step time were 0.001° and 0.1 s, respectively.
2.5. Transmission and Absorption Spectroscopy
The optical transmission spectra of Cr:TiTe3O8 single crystal was collected on an Agilent Cary 5000 UV-vis-NIR spectrometer in the 200–2000 nm region. The spectra of the crystal in the 2000–8000 nm region were collected on a Nicolet NEXUS 670 FTIR spectrometer. A crystal wafer in size of 5 mm × 5 mm × 1 mm polished on both sides was used in the test.
2.6. Energy Dispersive Spectrometer (EDS)
According to the characteristics of different X-ray photon characteristic energy of each element, the component analysis was carried out by the energy spectrometer. The experiment was carried out on a 5 mm × 5 mm × 1 mm wafer, polished on both sides, employing a Hitachi S-4800 field emission scanning electron microscope.
2.7. X-ray Fluorescence Spectroscopy (XRF)
The components of Cr:TiTe3O8 crystal was analyzed by a Japanese Science ZSX primus II X-ray fluorescence spectrometer.
3. Results and Discussion
3.1. Characterization of Polycrystalline Cr:TiTe3O8
After rapid cooling, there are dark green polycrystalline precipitates on the seed crystal rod. The polycrystal is ground into powder, and the XRD pattern of the powder is shown in Figure 1. It can be seen that each peak matches the peak at the corresponding position of the standard card (TiTe3O8 PDF 24-1348) [14] and no other impure peaks. XRD pattern indicates that there is no significant structure change in the crystal by Cr doping.
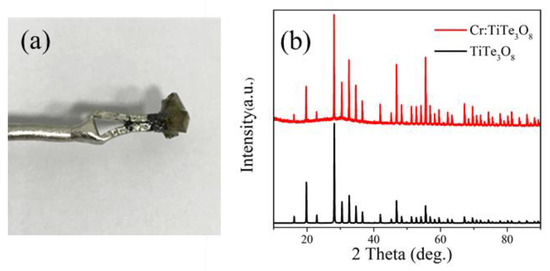
Figure 1.
(a) Polycrystals obtained by spontaneous nucleation; (b) XRD patterns of Cr:TiTe3O8 and the pure TiTe3O8.
3.2. Crystal Growth
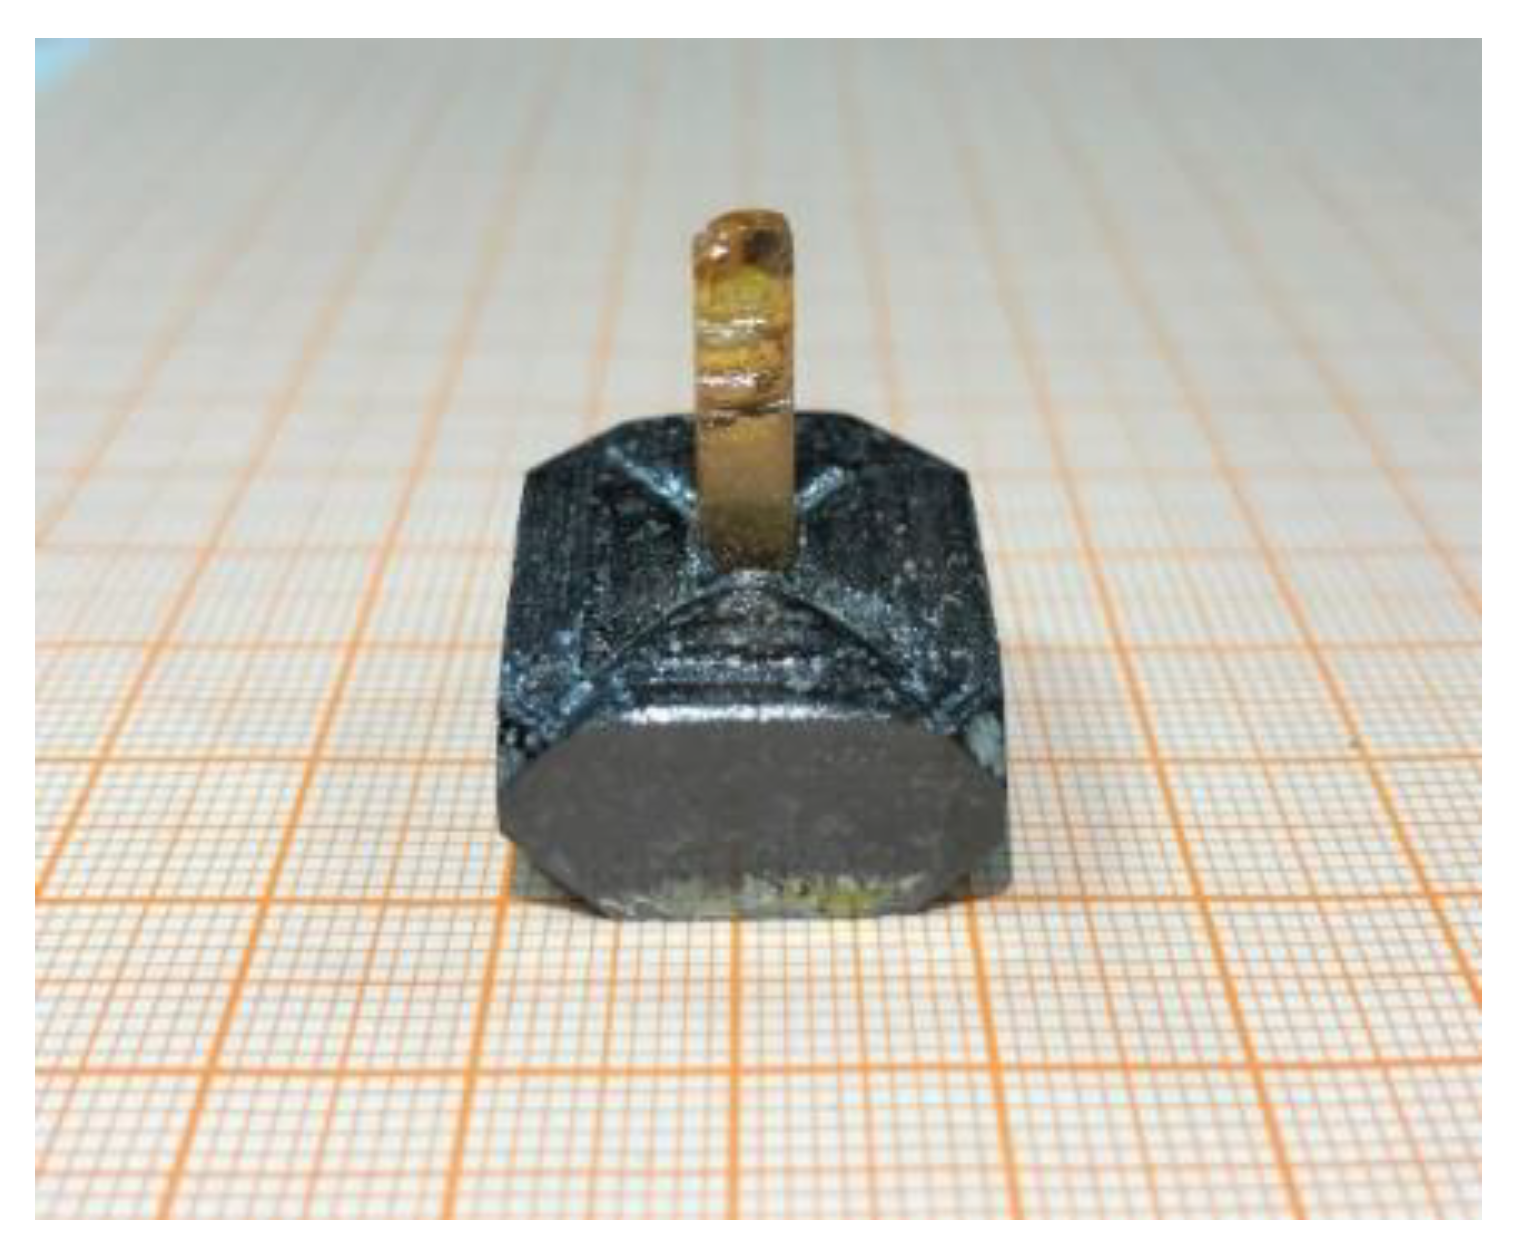
The Cr:TiTe3O8 crystal was grown using flux method by slowly temperature dropping for a month. A piece of directional crystal seed cut along the [100] axis was used. Finally, a single crystal 21 mm × 21 mm × 11 mm in size was obtained, as shown in Figure 2. It has a square shape from top to bottom. The Cr:TiTe3O8 crystal exhibits a dark green color.
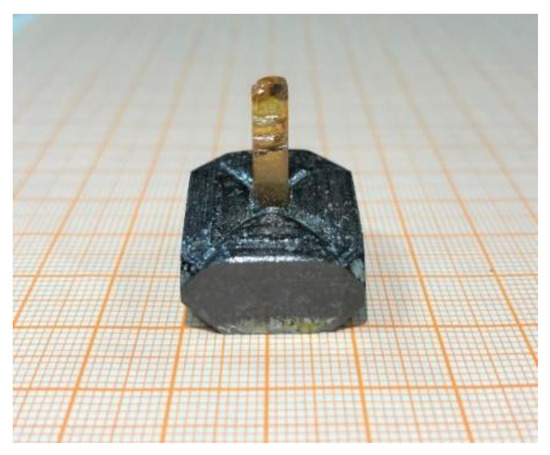
Figure 2.
Cr:TiTe3O8 single crystal grown along [100] crystallographic axis.
3.3. Laue Photograph and HRXRD
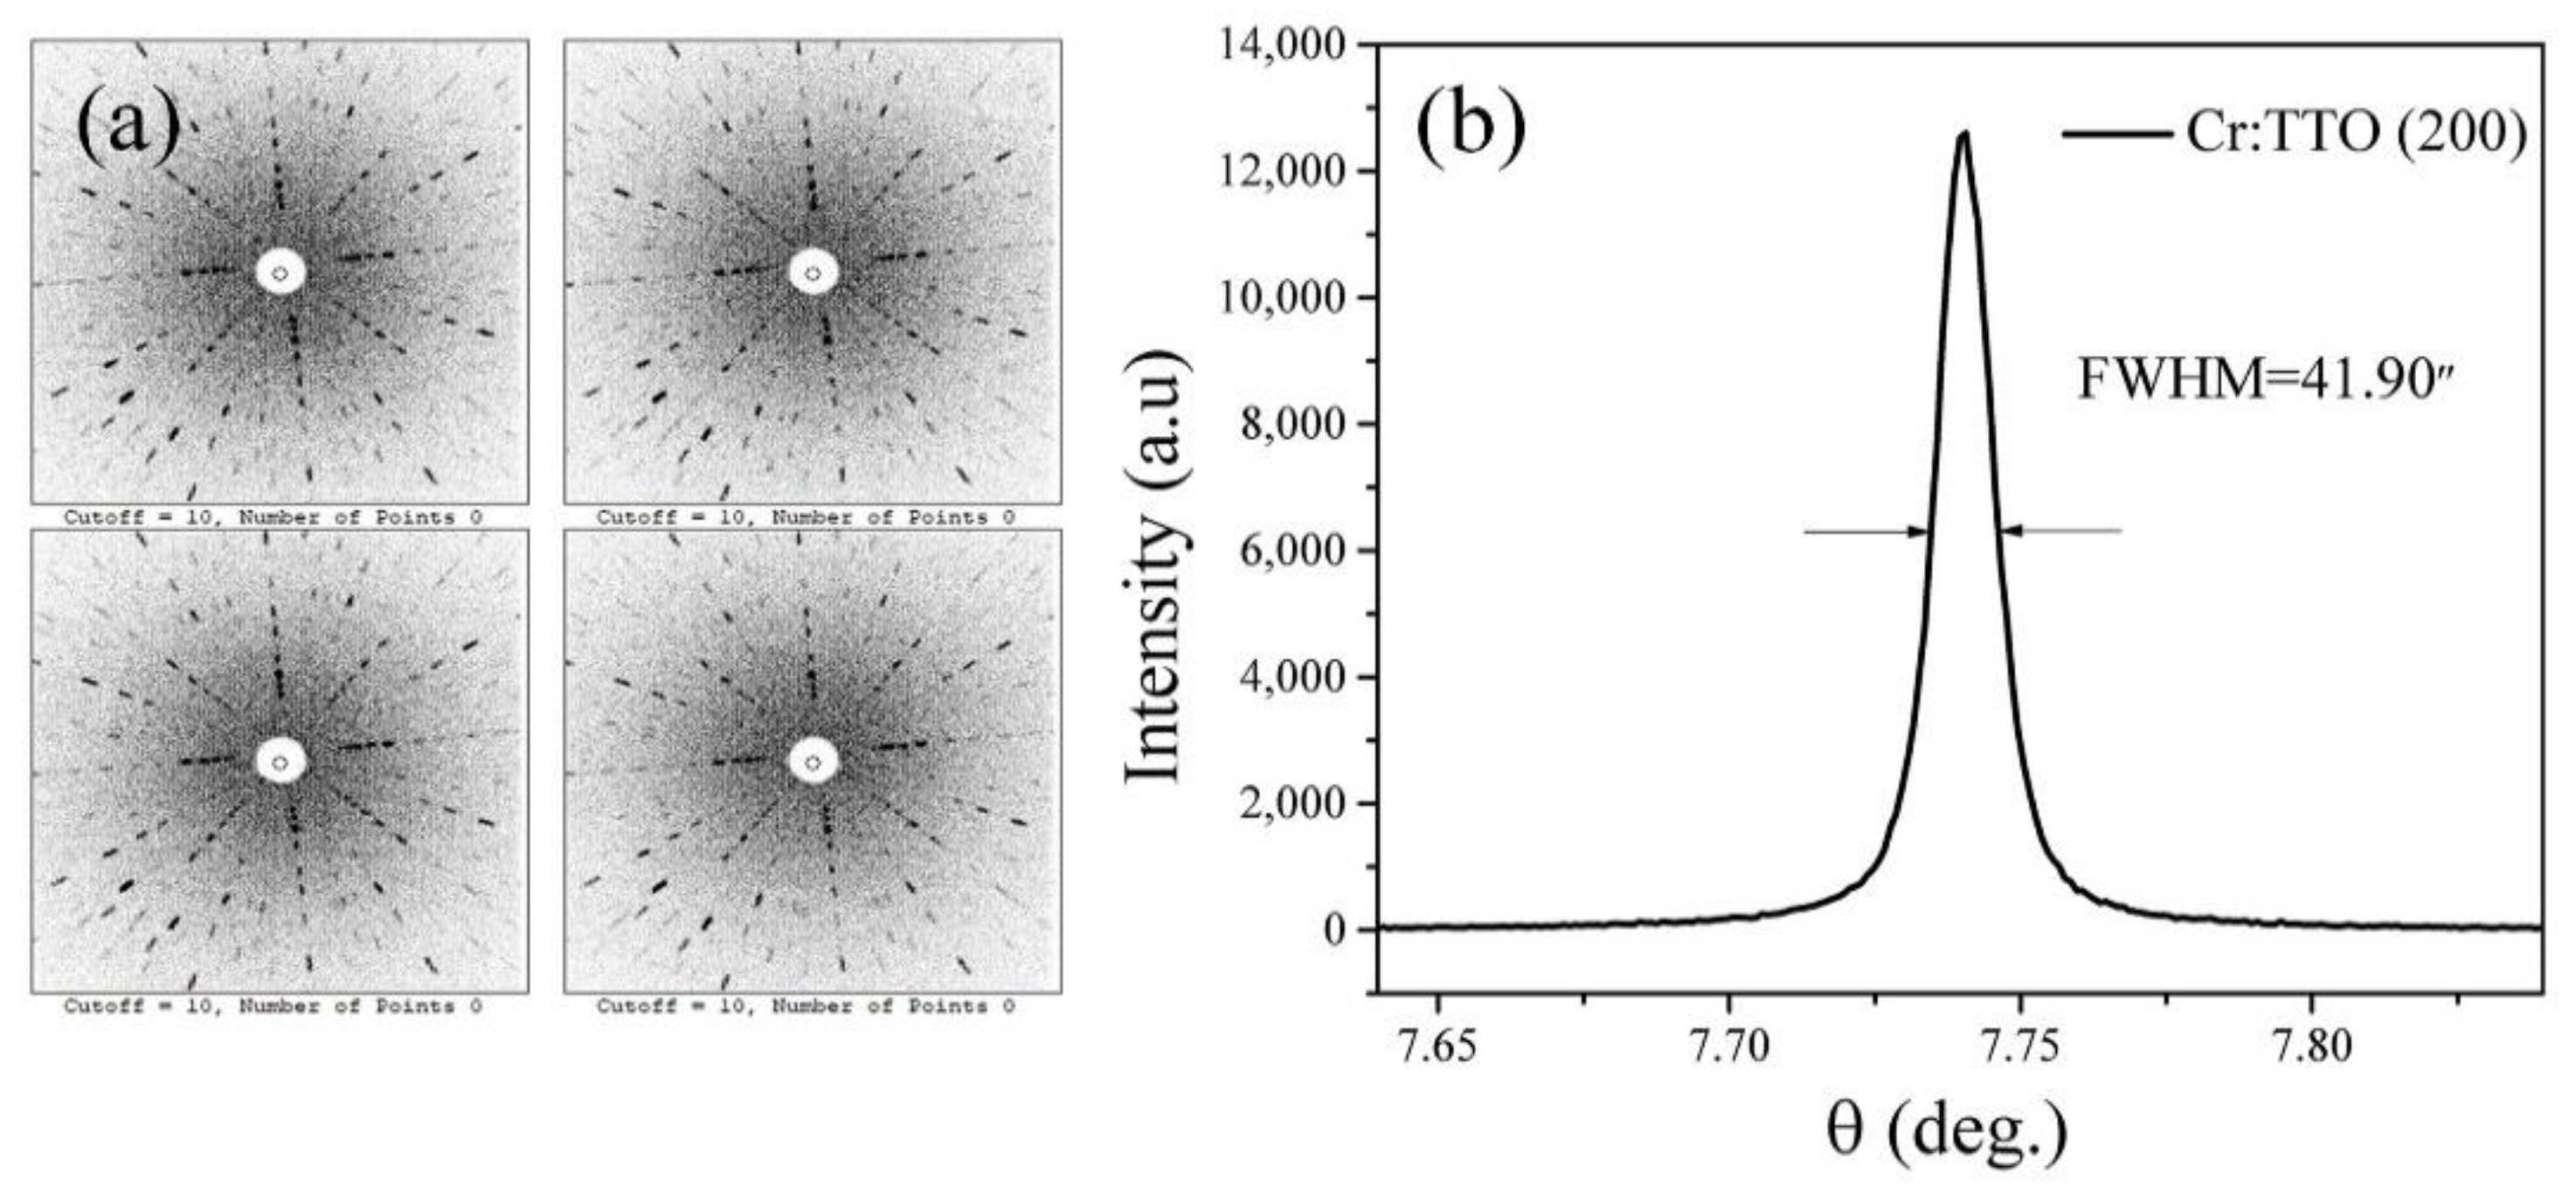
The single crystal orientation was determined by the back-beam Laue method. Four points on a 5 mm × 5 mm × 1 mm wafer were randomly selected, and the related Laue diffraction images are shown in Figure 3a. Each diffraction spot was clear and symmetrical without splitting and had good axial symmetry. The X-ray rocking curve of Cr:TiTe3O8 wafer (200) diffraction plane is shown in Figure 3b. It can be seen that the FWHM (full width at half maximum) is as low as 41.90 arcsec, and the peak is symmetrical and sharp. Both the Laue photograph and X-ray rocking curve measurements indicate that the crystal is of good quality.
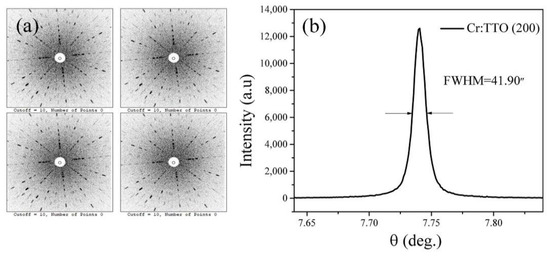
Figure 3.
(a) Laue photographs of Cr:TiTe3O8 single crystal; (b) X-ray rocking curve of the Cr:TiTe3O8 single crystal.
3.4. Optical Properties
The transmittance spectrum of the Cr:TiTe3O8 with a thickness of 1 mm (Figure 4a) at room temperature is shown in Figure 4b. It can be seen that the transmittance is more than 70% in the range from 1 to 5 μm. The UV-Vis spectra are shown in Figure 4c, which exhibit an absorption peak at 687 nm and an absorption region from 995 to 1565 nm. Magnified absorption spectra at about 1μm are shown in Figure 4d. The spectra are in good agreement with the characteristic absorptions of Cr4+ ions [15].
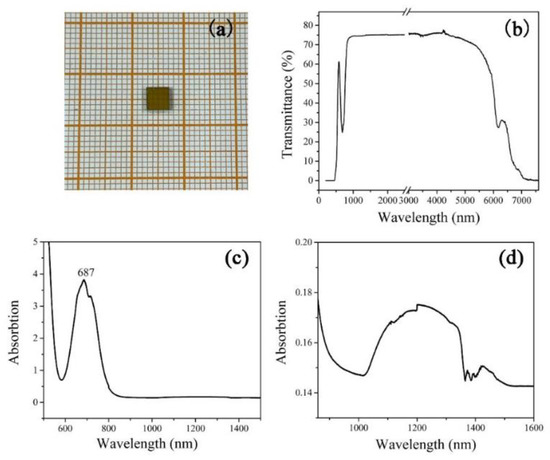
Figure 4.
(a) A Cr:TiTe3O8 crystal wafer with dimensions of 5 mm × 5 mm × 1 mm; (b) transmission spectra of the Cr:TiTe3O8 single crystal perpendicular to the (100) plane; (c) the absorption spectrum of the Cr:TiTe3O8 crystal; (d) the magnified absorption spectrum at 1 μm.
3.5. Eds and XRF
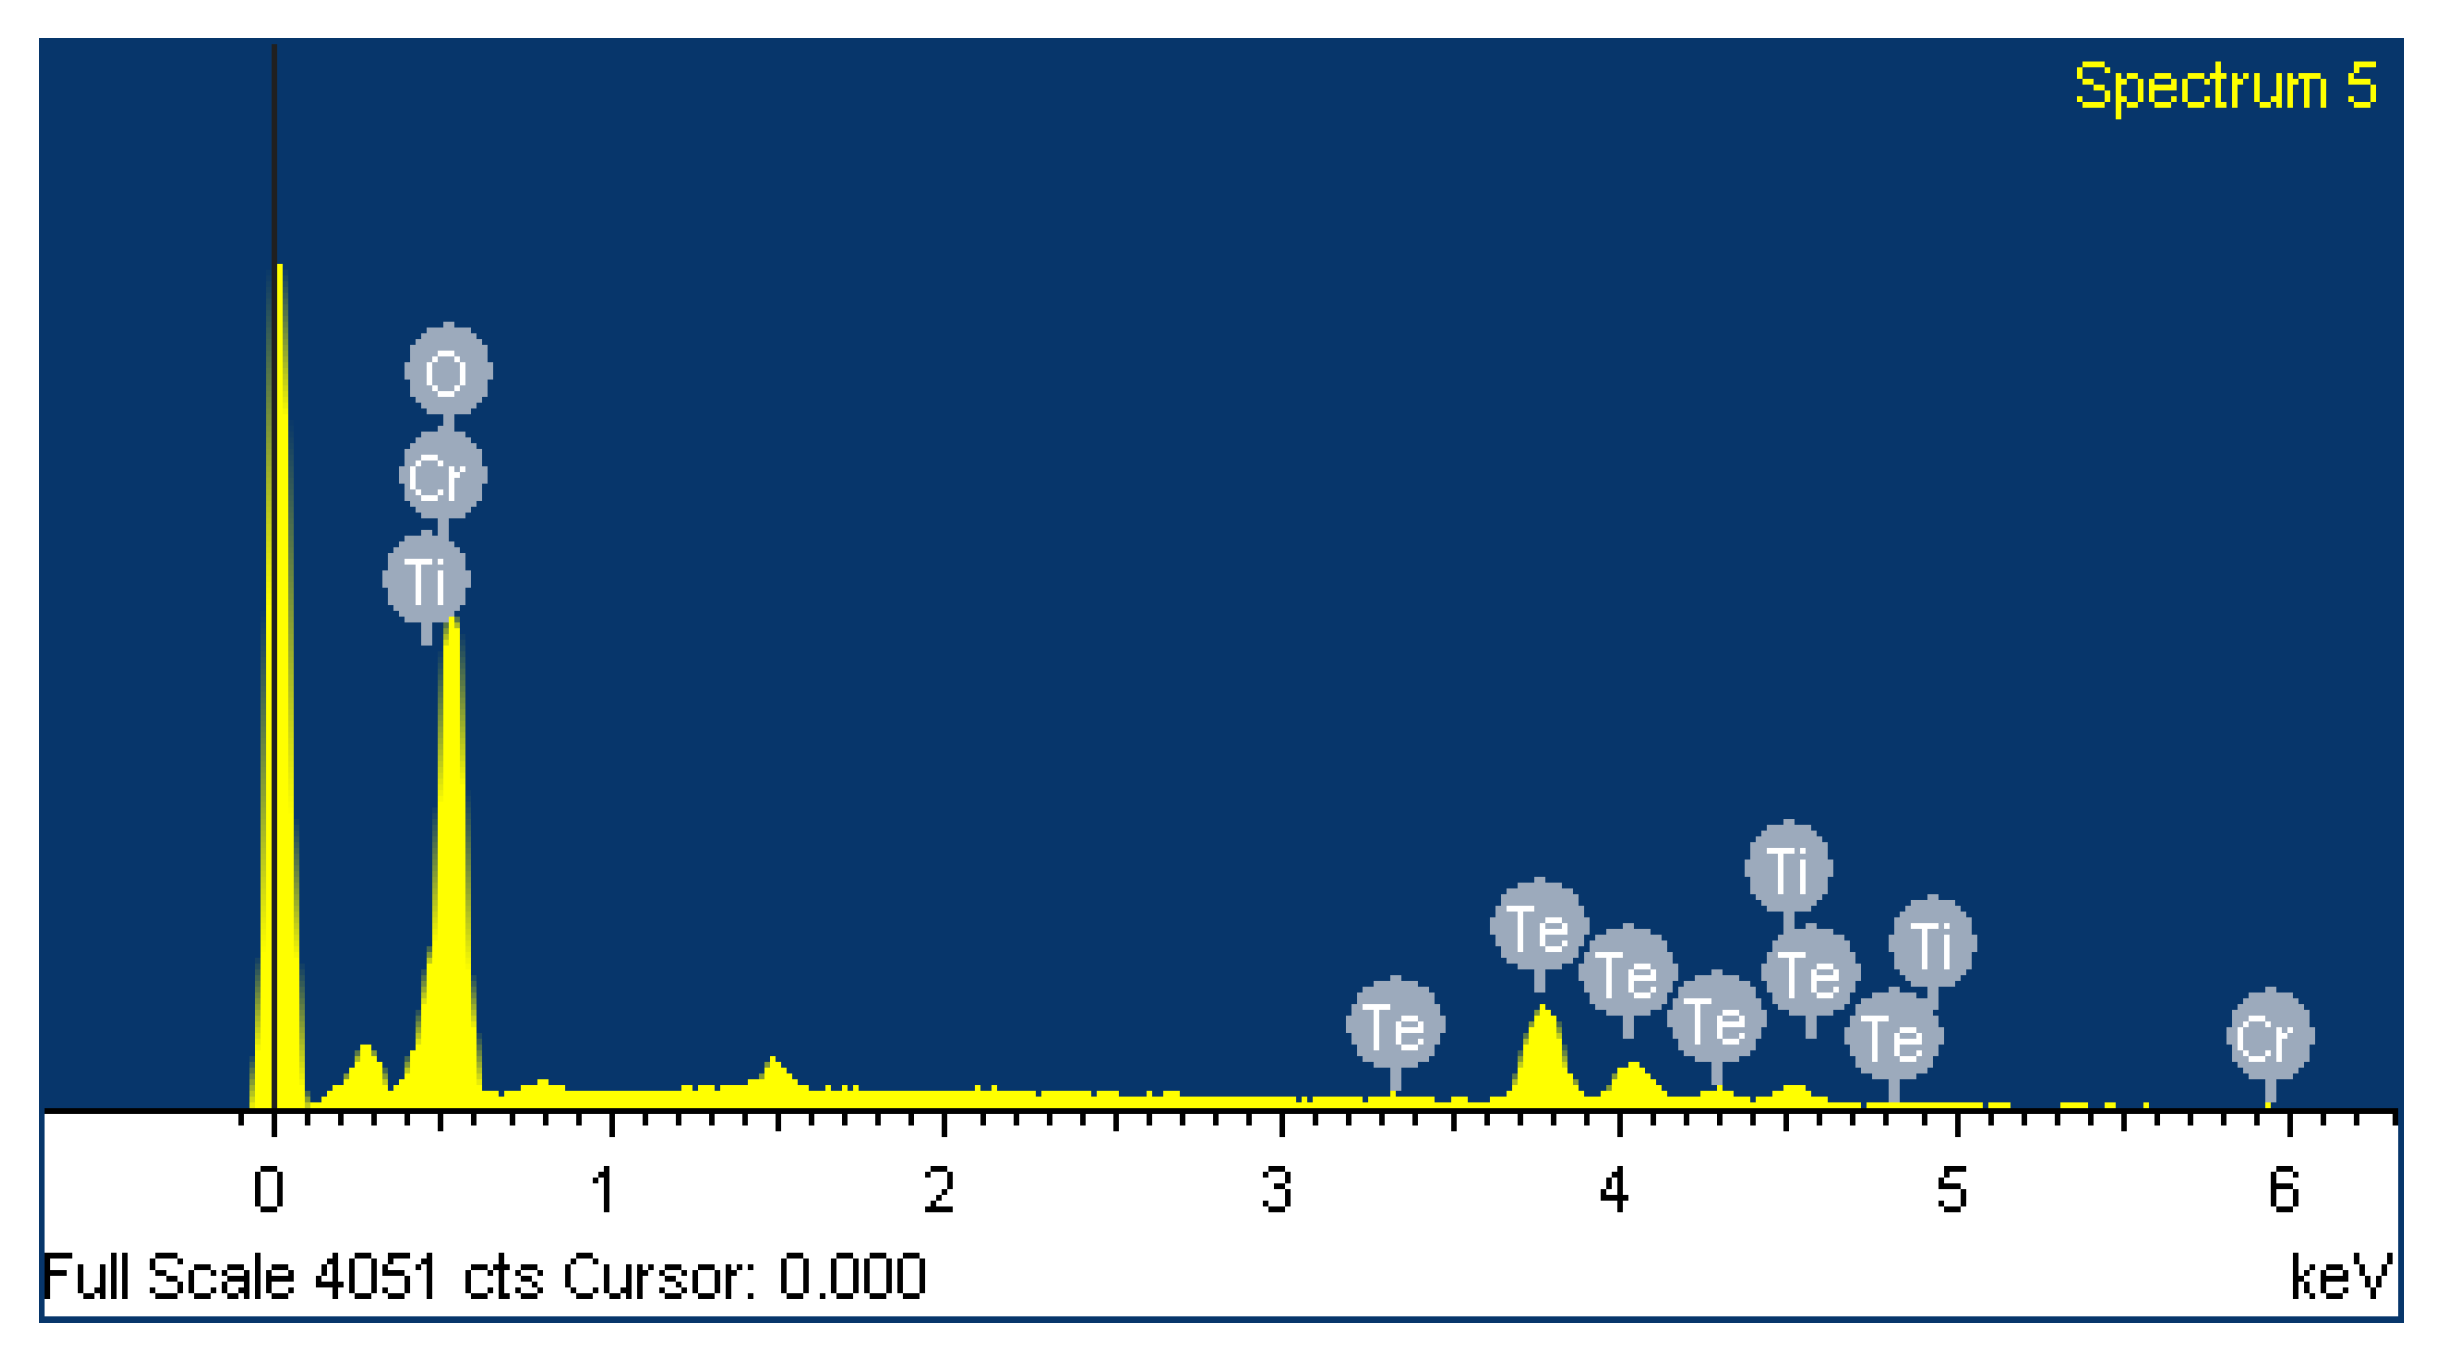
The chemical composition of Cr:TiTe3O8 crystal was determined using EDS technique, and the recorded spectrum is shown in Figure 5. The elemental mapping proves the presence of Te, O, Ti and Cr elements in the crystal. EDS test can only be used for semi-quantitative analysis. In order to quantitatively analyze the concentration of Cr element in the crystal, the XRF test was carried out. The result is shown in Table 1. The molar percentage of Cr element is determined to be 4.9%.

Figure 5.
EDS image of Cr:TiTe3O8 crystal.

Table 1.
The content of each element in the crystal tested by XRF.
3.6. Passive Q Switch Test
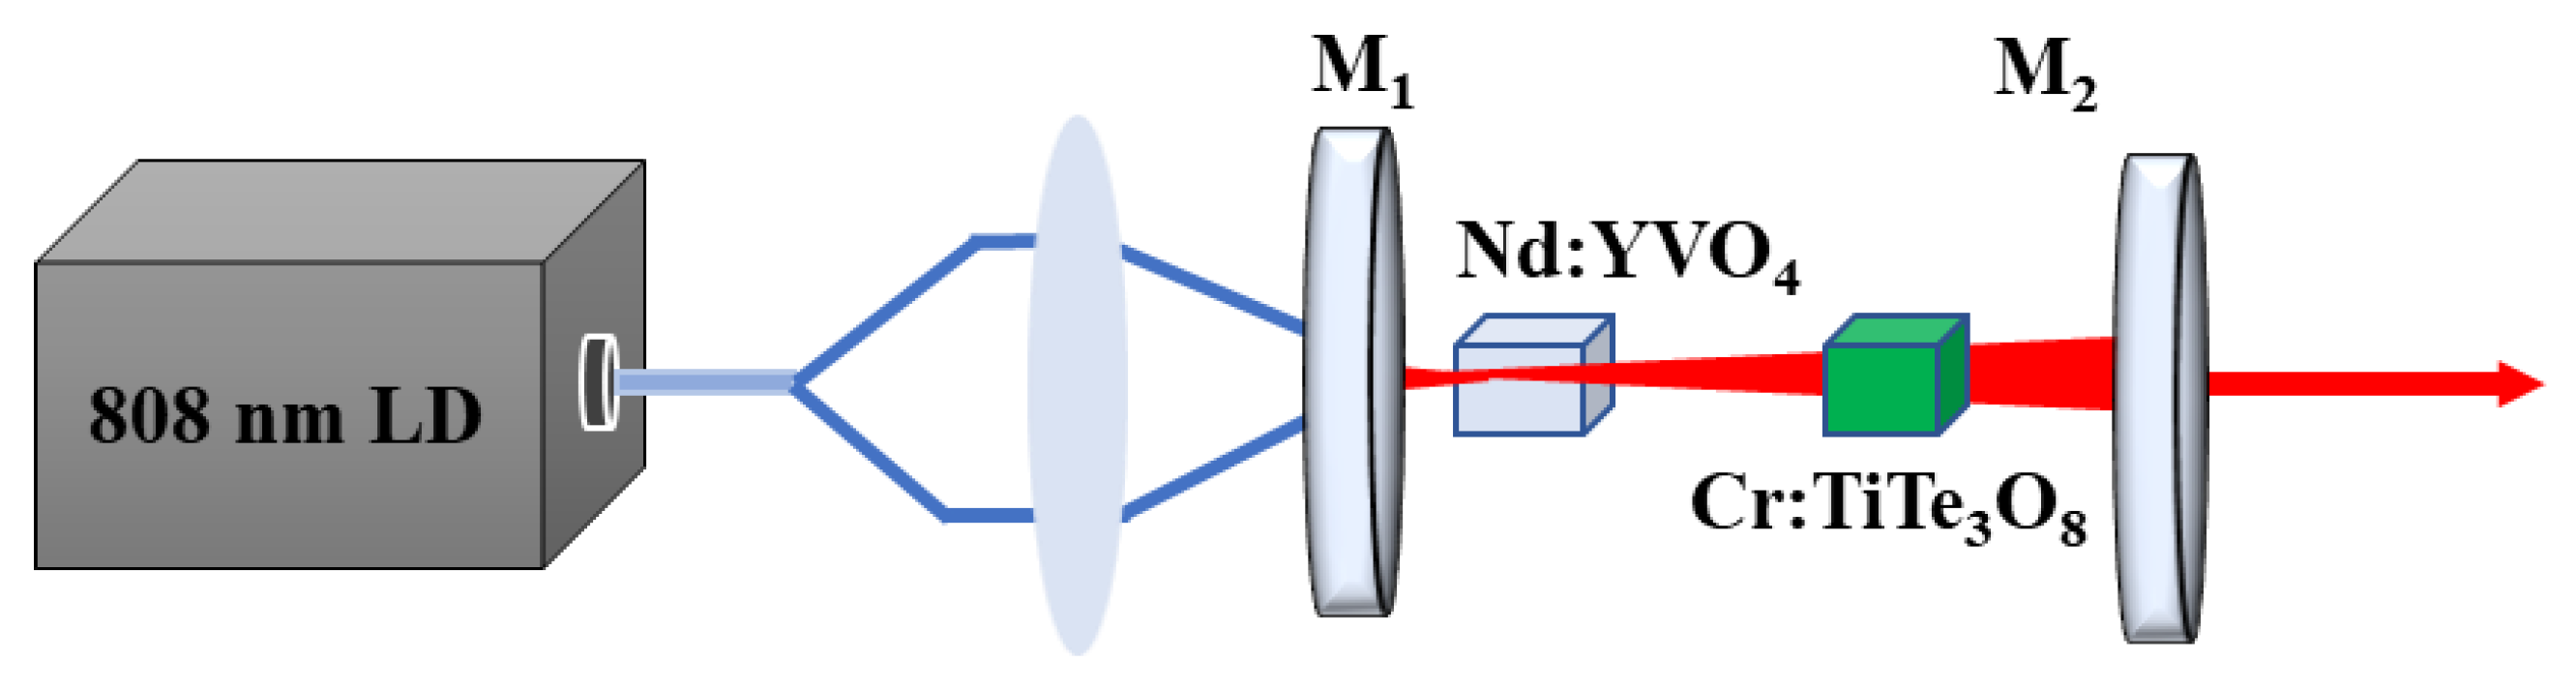
In this section, the Cr:TiTe3O8 single crystal was tried to use as a saturable absorber in the laser operating. The schematic diagram of the experimental setup is shown in Figure 6. A Cr:TiTe3O8 crystal in size of 4 mm × 4 mm × 1 mm and a Nd:YVO4 crystal in size of 3 mm × 3 mm × 10 mmwere inserted into a 30 mm long resonant cavity. The Nd:YVO4 crystal is coated with AR films working at 808 and 1064 nm. The cavity consists of an input-coupling mirror M1 and an output-coupling mirror M2 with the curvature radii of 100 mm and 200 mm, respectively. The mirror M1 exhibits a high transmission of 808 nm (AR, R < 0.2%) and a high reflectivity at 1064 nm (HR, R > 99.8%). The mirror M2 is coated with HR at 808 nm and partially reflective film at 1064 nm (R = 60%). The cavity is pumped by a fiber-coupled 808 nm CW-diode-pumped laser. Both the Nd:YVO4 and Cr:TiTe3O8 crystals are wrapped with indium foil and mounted in water-cooled copper blocks and cooled to 15 °C. The output energy is measured by a PM100 digital power meter. The temporal behaviors of the pulse are recorded by a digital oscilloscope (DPO4104B-L, Tektronix).

Figure 6.
Schematic diagram of experimental setup.
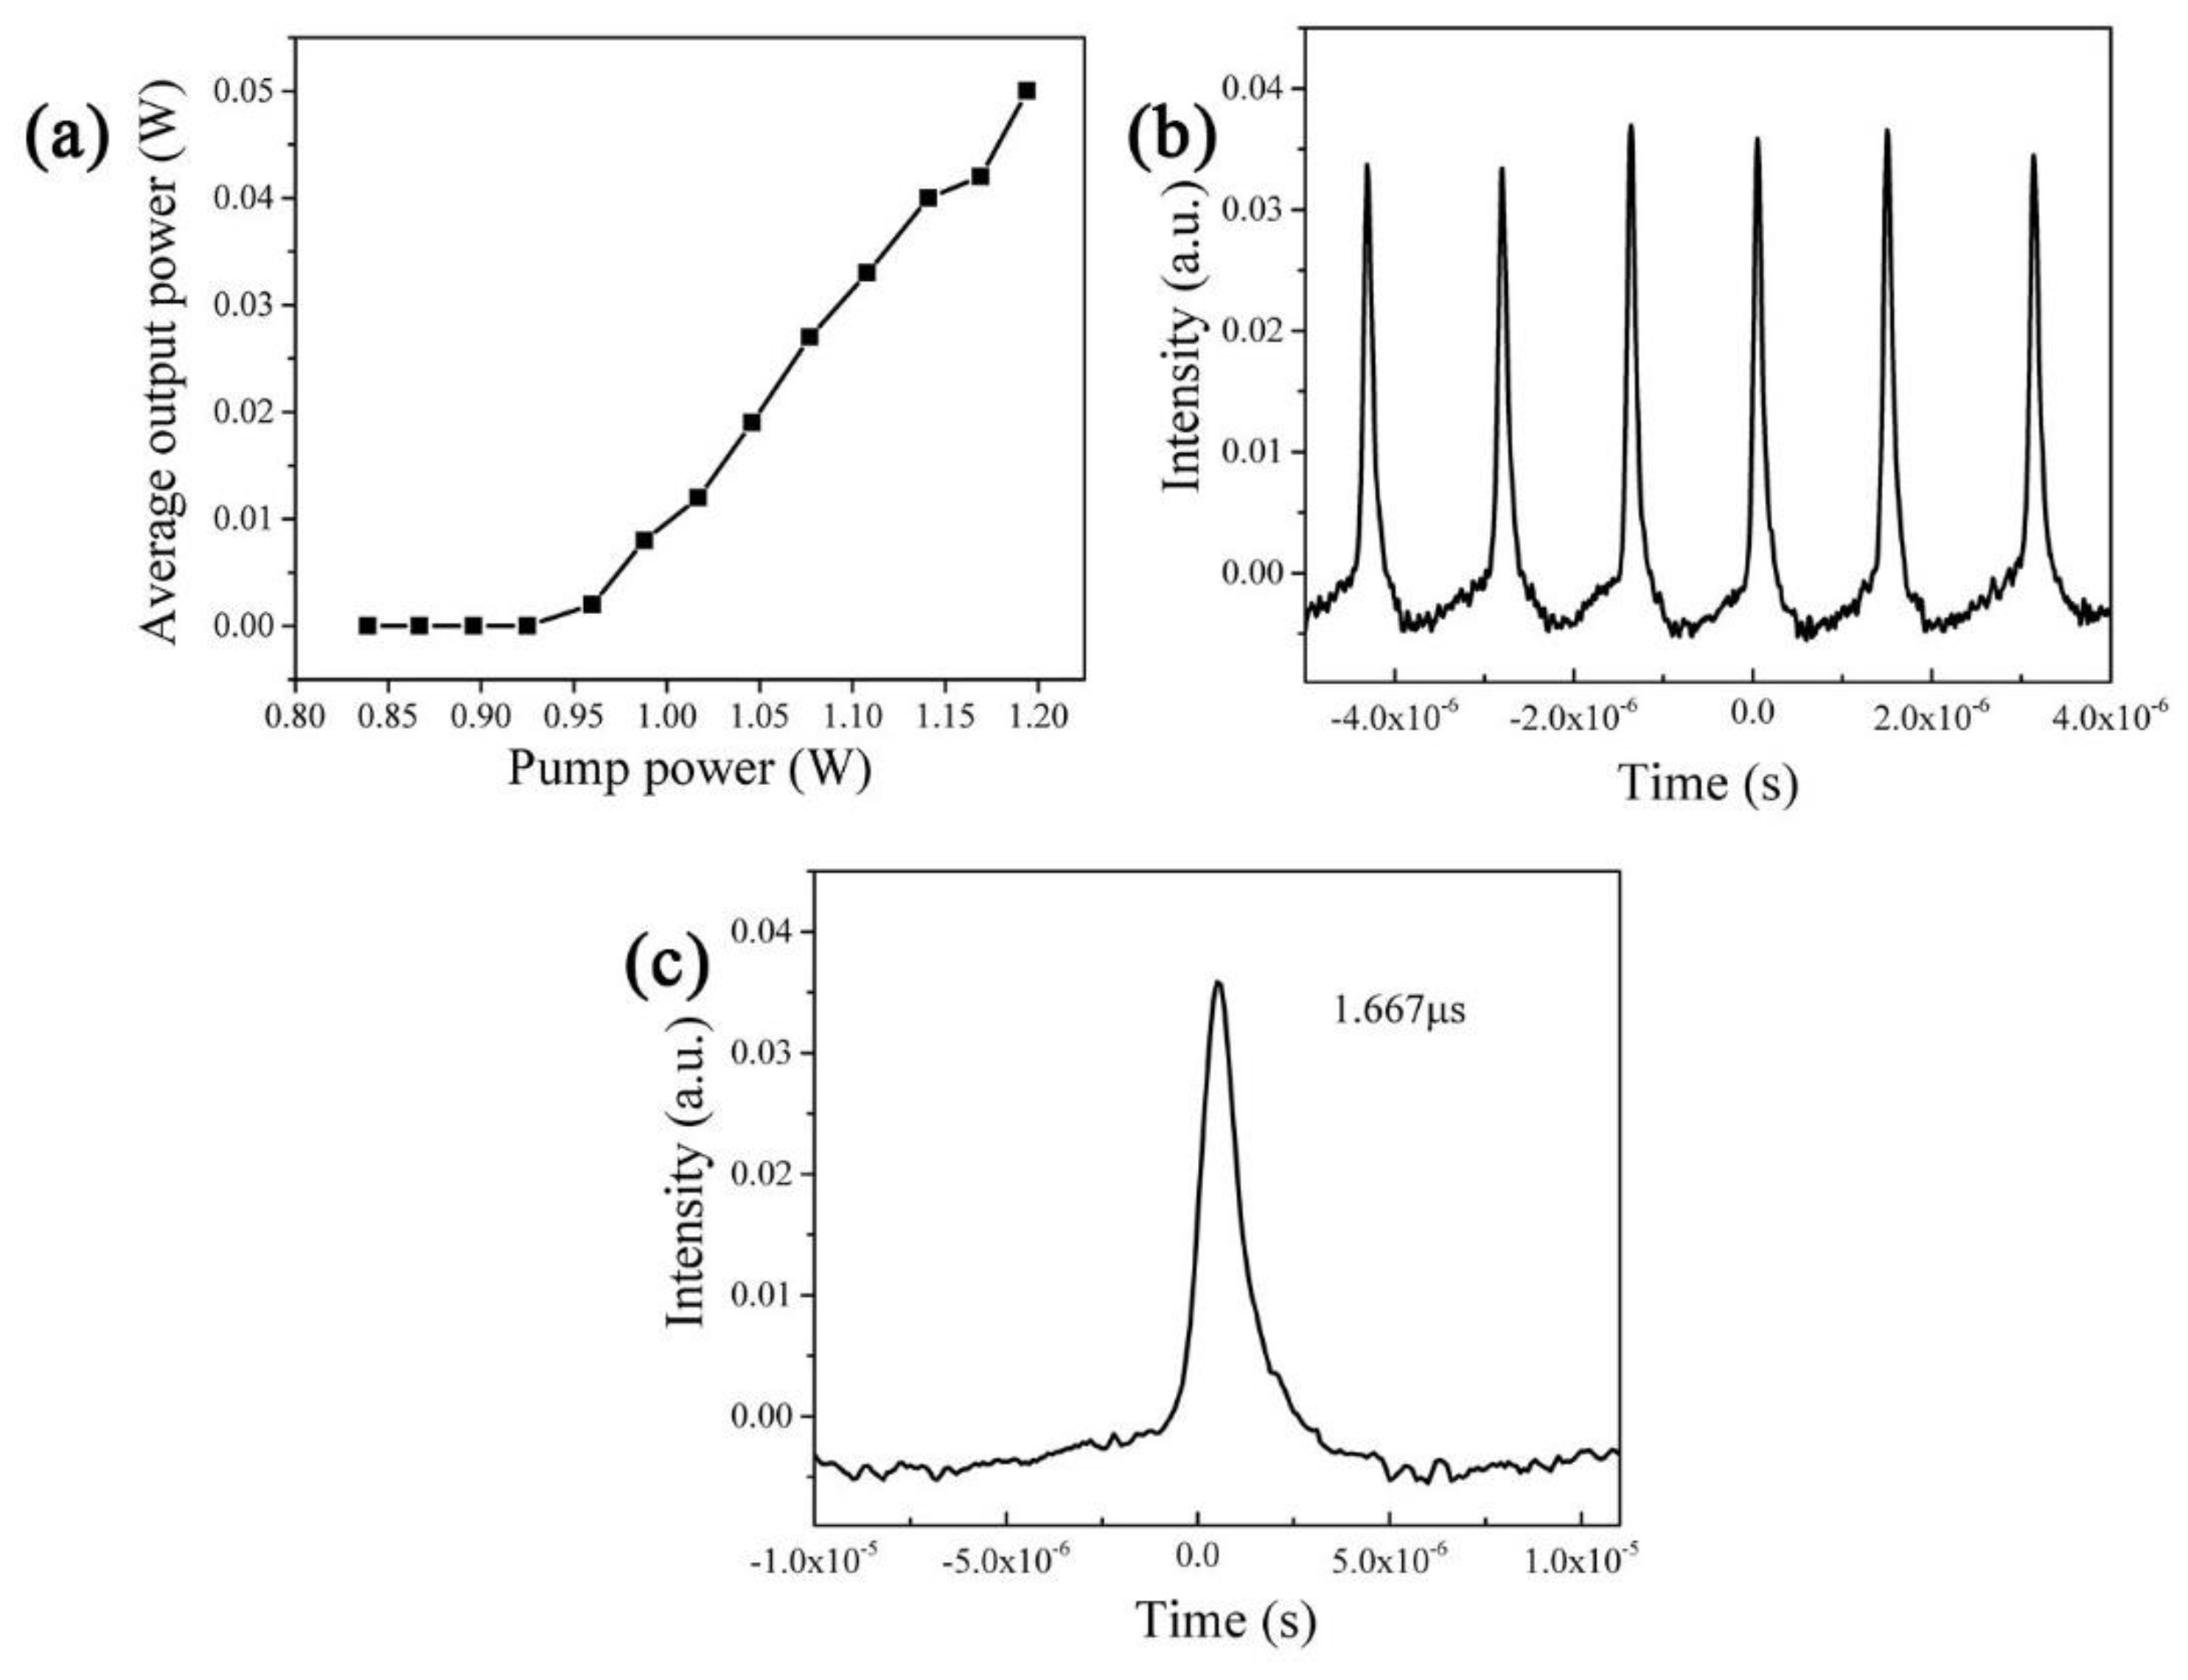
In our experiments, the Q-switching pulses were observed, which means that the Cr:TiTe3O8 has realized the saturable absorber property. The performances of the Cr:TiTe3O8 Q-switching laser are shown in Figure 7. The curve of output power changing with pump power is shown in Figure 7a. The maximum output power can reach 50 mW with the pump power 1.194 W. Then, the repetition frequency and pulse width are determined to be 67 kHz and 1 μs. The maximum laser pulse energy is calculated to be 0.7 μJ, and the maximum peak power reaches 0.7 W. The laser pulse trains are displayed in Figure 7b. The pulses are equally spaced and there are no impurity peaks. Figure 7c is a typical monopulse with a pulse width of 1.667μs.

Figure 7.
(a) The average output powers versus pump powers; (b) the passive Q-switching laser pulse train; (c) a typical pulse shape of 1.667 μs width.
4. Conclusions
In this work, the Cr:TiTe3O8 crystal, which can be used as a saturable absorber, was successfully grown by top-seeded solution growth method. The molar percentage of Cr4+ ions in TiTe3O8 crystal is determined to be 4.9%. Cr:TiTe3O8 crystal shows the absorption range from 995 to1565 nm. A passive Q-switching solid-state laser with Cr:TiTe3O8 crystal as the saturable absorber operating at 1064 nm was realized.
Author Contributions
Conceptualization, C.L., Z.G. and Y.S.; methodology, C.L., Z.G. and Z.Z.; validation, C.L. and Z.G.; investigation, C.L., Z.G., Z.Z. and Y.S.; data curation, C.L., S.Y.; writing—original draft preparation, C.L.; writing—review and editing, C.L. and Z.G. All authors have read and agreed to the published version of the manuscript.
Funding
National Natural Science Foundation of China (Grant Nos. 62175129, 61975098).
Institutional Review Board Statement
Not applicable.
Informed Consent Statement
Not applicable.
Data Availability Statement
Not applicable.
Conflicts of Interest
The authors declare no conflict of interest.
References
- Waynant, R.W.; Ilev, I.K.; Gannot, I. Mid–infrared laser applications in medicine and biology. Philos. Trans. R. Soc. A Math. Phys. Eng. Sci. 2001, 359, 635–644. [Google Scholar] [CrossRef]
- Stupl, J.; Neuneck, G. Assessment of Long Range Laser Weapon Engagements: The Case of the Airborne Laser. Sci. Glob. Secur. 2010, 18, 1–60. [Google Scholar] [CrossRef]
- Tunc, B.; Gulsoy, M. The Comparison of Thermal Effects of a 1940-nm Tm:fiber Laser and 980-nm Diode Laser on Cortical Tissue: Stereotaxic Laser Brain Surgery. Lasers Surg. Med. 2020, 52, 235–246. [Google Scholar] [CrossRef] [PubMed]
- Zhao, J.L.; Wu, R.; Wang, L.; Wu, Y. The Application of 3D Laser Scanning Technology in Ancient Architecture Protection. Appl. Mech. Mater. 2013, 353–356, 3476–3479. [Google Scholar] [CrossRef]
- Shepelev, A.E.; Antipov, A.A.; Putilov, A.G.; Osipov, A.V.; Arakelian, S.M. Methods for the solid-state lasers generation modes control for the material laser processing efficiency improving. J. Phys. Conf. Ser. 2021, 1822, 012015. [Google Scholar] [CrossRef]
- Lin, H.-Y.; Sun, D.; Copner, N.; Zhu, W. Nd:GYSGG laser at 1331.6 nm passively Q-switched by a Co:MgAl2O4 crystal. Opt. Mater. 2017, 69, 250–253. [Google Scholar] [CrossRef]
- Hecht, H.; Burshtein, Z.; Katzir, A.; Noach, S.; Sokol, M.; Frumker, E.; Galun, E.; Ishaaya, A.A. Passive Q-switching of a Tm:YLF laser with a Co2+ doped silver halide saturable absorber. Opt. Mater. 2017, 64, 64–69. [Google Scholar] [CrossRef]
- Lin, H.; Liu, H.; Li, Y.; Sun, D. Passively Q-switched Nd:GGG laser at 1110.2 nm by Cr:YAG. Laser Phys. 2018, 28, 125001. [Google Scholar] [CrossRef]
- Song, T.; Li, P.; Chen, X.; Ma, B.; Dun, Y. Passively Q-switched Nd:GYSGG laser operating at 1.3 μm with V:YAG as saturable absorber. Optik 2016, 127, 10621–10625. [Google Scholar] [CrossRef]
- Lefever, R.A.; Torpy, J.W.; Chase, A.B. Growth of Single Crystals of Yttrium Aluminum Garnet from Lead Oxide—Lead Fluoride Melts. J. Appl. Phys. 1961, 32, 962–963. [Google Scholar] [CrossRef]
- Shannon, R.D. Revised effective ionic radii and systematic studies of interatomic distances in halides and chalcogenides. Acta Crystallogr. Sect. A 1976, 32, 751–767. [Google Scholar] [CrossRef]
- Lu, W.; Gao, Z.; Wu, Q.; Tian, X.; Sun, Y.; Liu, Y.; Tao, X. Tailored fabrication of a prospective acousto–optic crystal TiTe3O8 endowed with high performance. J. Mater. Chem. C 2018, 6, 2443–2451. [Google Scholar] [CrossRef]
- Meunier, G.; Galy, J. Sur une déformation inédite du reseau de type fluorine. Structure cristalline des phases MTe3O8 (M = Ti, Sn, Hf, Zr). Acta Crystallogr. 1971, B27, 602–608. [Google Scholar] [CrossRef]
- Jiao, X.; Zhong, C.; Zhang, S.; Liu, X.; Li, B. Microwave dielectric properties of BaO–TiO2–TeO2 ternary system. J. Mater. Sci. 2010, 45, 3331–3335. [Google Scholar] [CrossRef]
- Li, C.; Xu, J.; Liu, W.; Zheng, D.; Zhang, S.; Zhang, Y.; Lin, H.; Liu, L.; Liu, J.; Zeng, F. Synthesis and characterization of Cr4+-doped Ca2GeO4 tunable crystal. J. Alloys Compd. 2015, 636, 211–215. [Google Scholar] [CrossRef]


Publisher’s Note: MDPI stays neutral with regard to jurisdictional claims in published maps and institutional affiliations. |
© 2022 by the authors. Licensee MDPI, Basel, Switzerland. This article is an open access article distributed under the terms and conditions of the Creative Commons Attribution (CC BY) license (https://creativecommons.org/licenses/by/4.0/).