Article

Study of the Preferred Orientation of Hydroxyapatite in Ivory from Zimbabwe and Mammoth Ivory from Siberia

1
School of Gemology, China University of Geosciences, Beijing 100083, China
2
National Gemstone Testing Center Shenzhen Laboratory, Shenzhen 518020, China
*
Author to whom correspondence should be addressed.
Crystals 2021, 11(5), 572; https://doi.org/10.3390/cryst11050572
Submission received: 11 April 2021 / Revised: 10 May 2021 / Accepted: 16 May 2021 / Published: 20 May 2021
(This article belongs to the Special Issue Gem Crystals)

Abstract

:
In this paper, the pole figures plotted from X-ray diffraction data are employed to analyze the orientation of hydroxyapatite in ivory and mammoth ivory for the first time. The results present evidence of the lamellar structure and the hydroxyapatite appeared as tabular. A preferred orientation of hydroxyapatite was revealed in terms of the calculated orientation factor and the characteristics found in the pole figures. The c-axes of hydroxyapatite are mainly oriented along the growth direction. Both a-axes are on the left of the angle bisector of Retzius. Approximately 25–30° separates the a-axes and the angle bisector of Retzius in ivory, whereas the figure is approximately 10–15° in mammoth ivory. Our work is significant in providing more accurate knowledge of the shapes and organizational state of bio-mineral crystals and providing insight into crystal formation and development in bio-mineralization.

1. Introduction

Biomineralization has aroused interest for a long time. Unique chemical and physical properties of bio-material and the function of organic material help researchers understand the specific process of biomineralization [1,2,3]. Ivory and mammoth ivory are common and valuable biological materials, which highlight the significant distinction between the inorganic and bioinorganic material world [1,4,5]. Fossil records indicate that biological hard tissue on earth was formed approximately 570 million years ago through bio-mineralization. These two ivory materials are composed of Type I collagen fibrils and Mg-containing hydroxyapatite [6,7,8,9,10]. Their structural chemistry is complex because CO32− replaces PO43− ions in various lattice sites. Due to this reason, this bio-material is often called “carbonated apatite” [1]. The surfaces of ivory and mammoth ivory show a geometrically regular pattern composed of two systems of radiating curved lines [5].
Many researchers have made great efforts to explore the two materials and have focused on the structure and the relationship between hydroxyapatite and a matrix of collagen fibrils [5,11,12]. For ivory and mammoth ivory, the orientation of hydroxyapatite crystals is strictly controlled by the organic matter during bio-mineralization, which leads to some of their excellent properties, such as high toughness. The details of the exquisite architectures and the formation mechanisms for ivory and mammoth ivory are still not clearly known, particularly regarding the sizes, shapes and organizational states of hydroxyapatite. Significant progress has been made on hard tissues of several species using electron microscopy. The size of hydroxyapatite crystal has generally been accepted to be 35–70 nm in length, with a width of approximately 25–50 nm and a minimum uniform thickness of 2–5 nm [7,13,14,15,16,17,18,19,20]. Such crystal sizes present a conceptual problem related to the ultrastructure accommodation at the molecular level in collagen. The crystals are inferred to be located within the collagen fibrils or between the fibrils [18,19]. However, these studies all provided evidence of a morphological orientation. The actual crystallographic orientation, which is also called the fabric, remained conjectural.
When observing the shape and size of the mineral crystals in bone, systematic disaggregation should be made to remove the interference of the organic matter [6,18,19]. To determine the fabric of ivory and mammoth ivory without complex disaggregation, X-ray pole figures, which can display the three-dimensional distribution of specific crystallographic directions, have been employed but have not been applied to this particular problem. The fabric of aragonite, one type of common biological material, has been determined using X-ray pole figures [21,22]. These results demonstrate the value of studying hydroxyapatite in ivory and mammoth ivory.
In this paper, X-ray pole figures were utilized by analyzing the statistical regularity of a certain lattice, (002), (211) and (300), of hydroxyapatite in ivory and mammoth ivory. The microstructure was also observed by scanning electron microscope. The results from the X-ray pole figures are the first to be employed to illustrate the preferred orientation in ivory and mammoth ivory, to the best of our knowledge, and provide a more accurate understanding of the shapes and organizational state of mineral crystals.

2. Materials and Methods
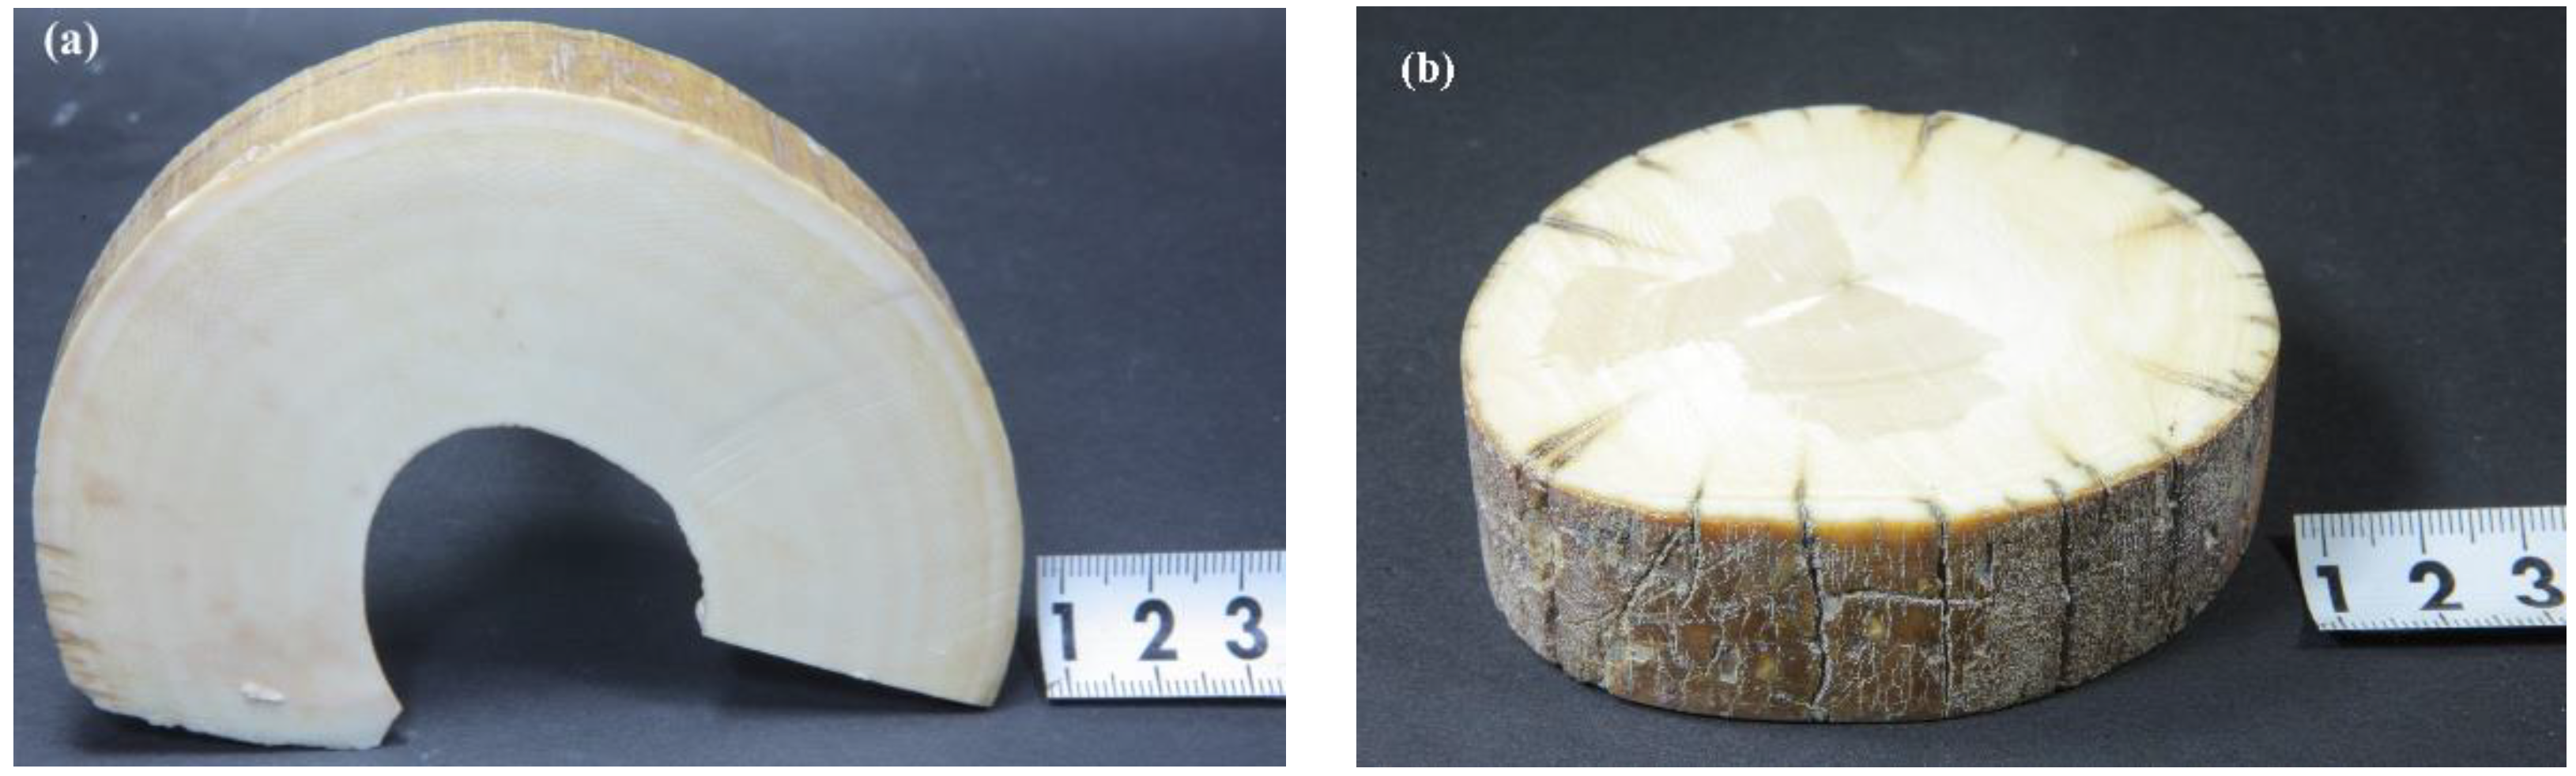
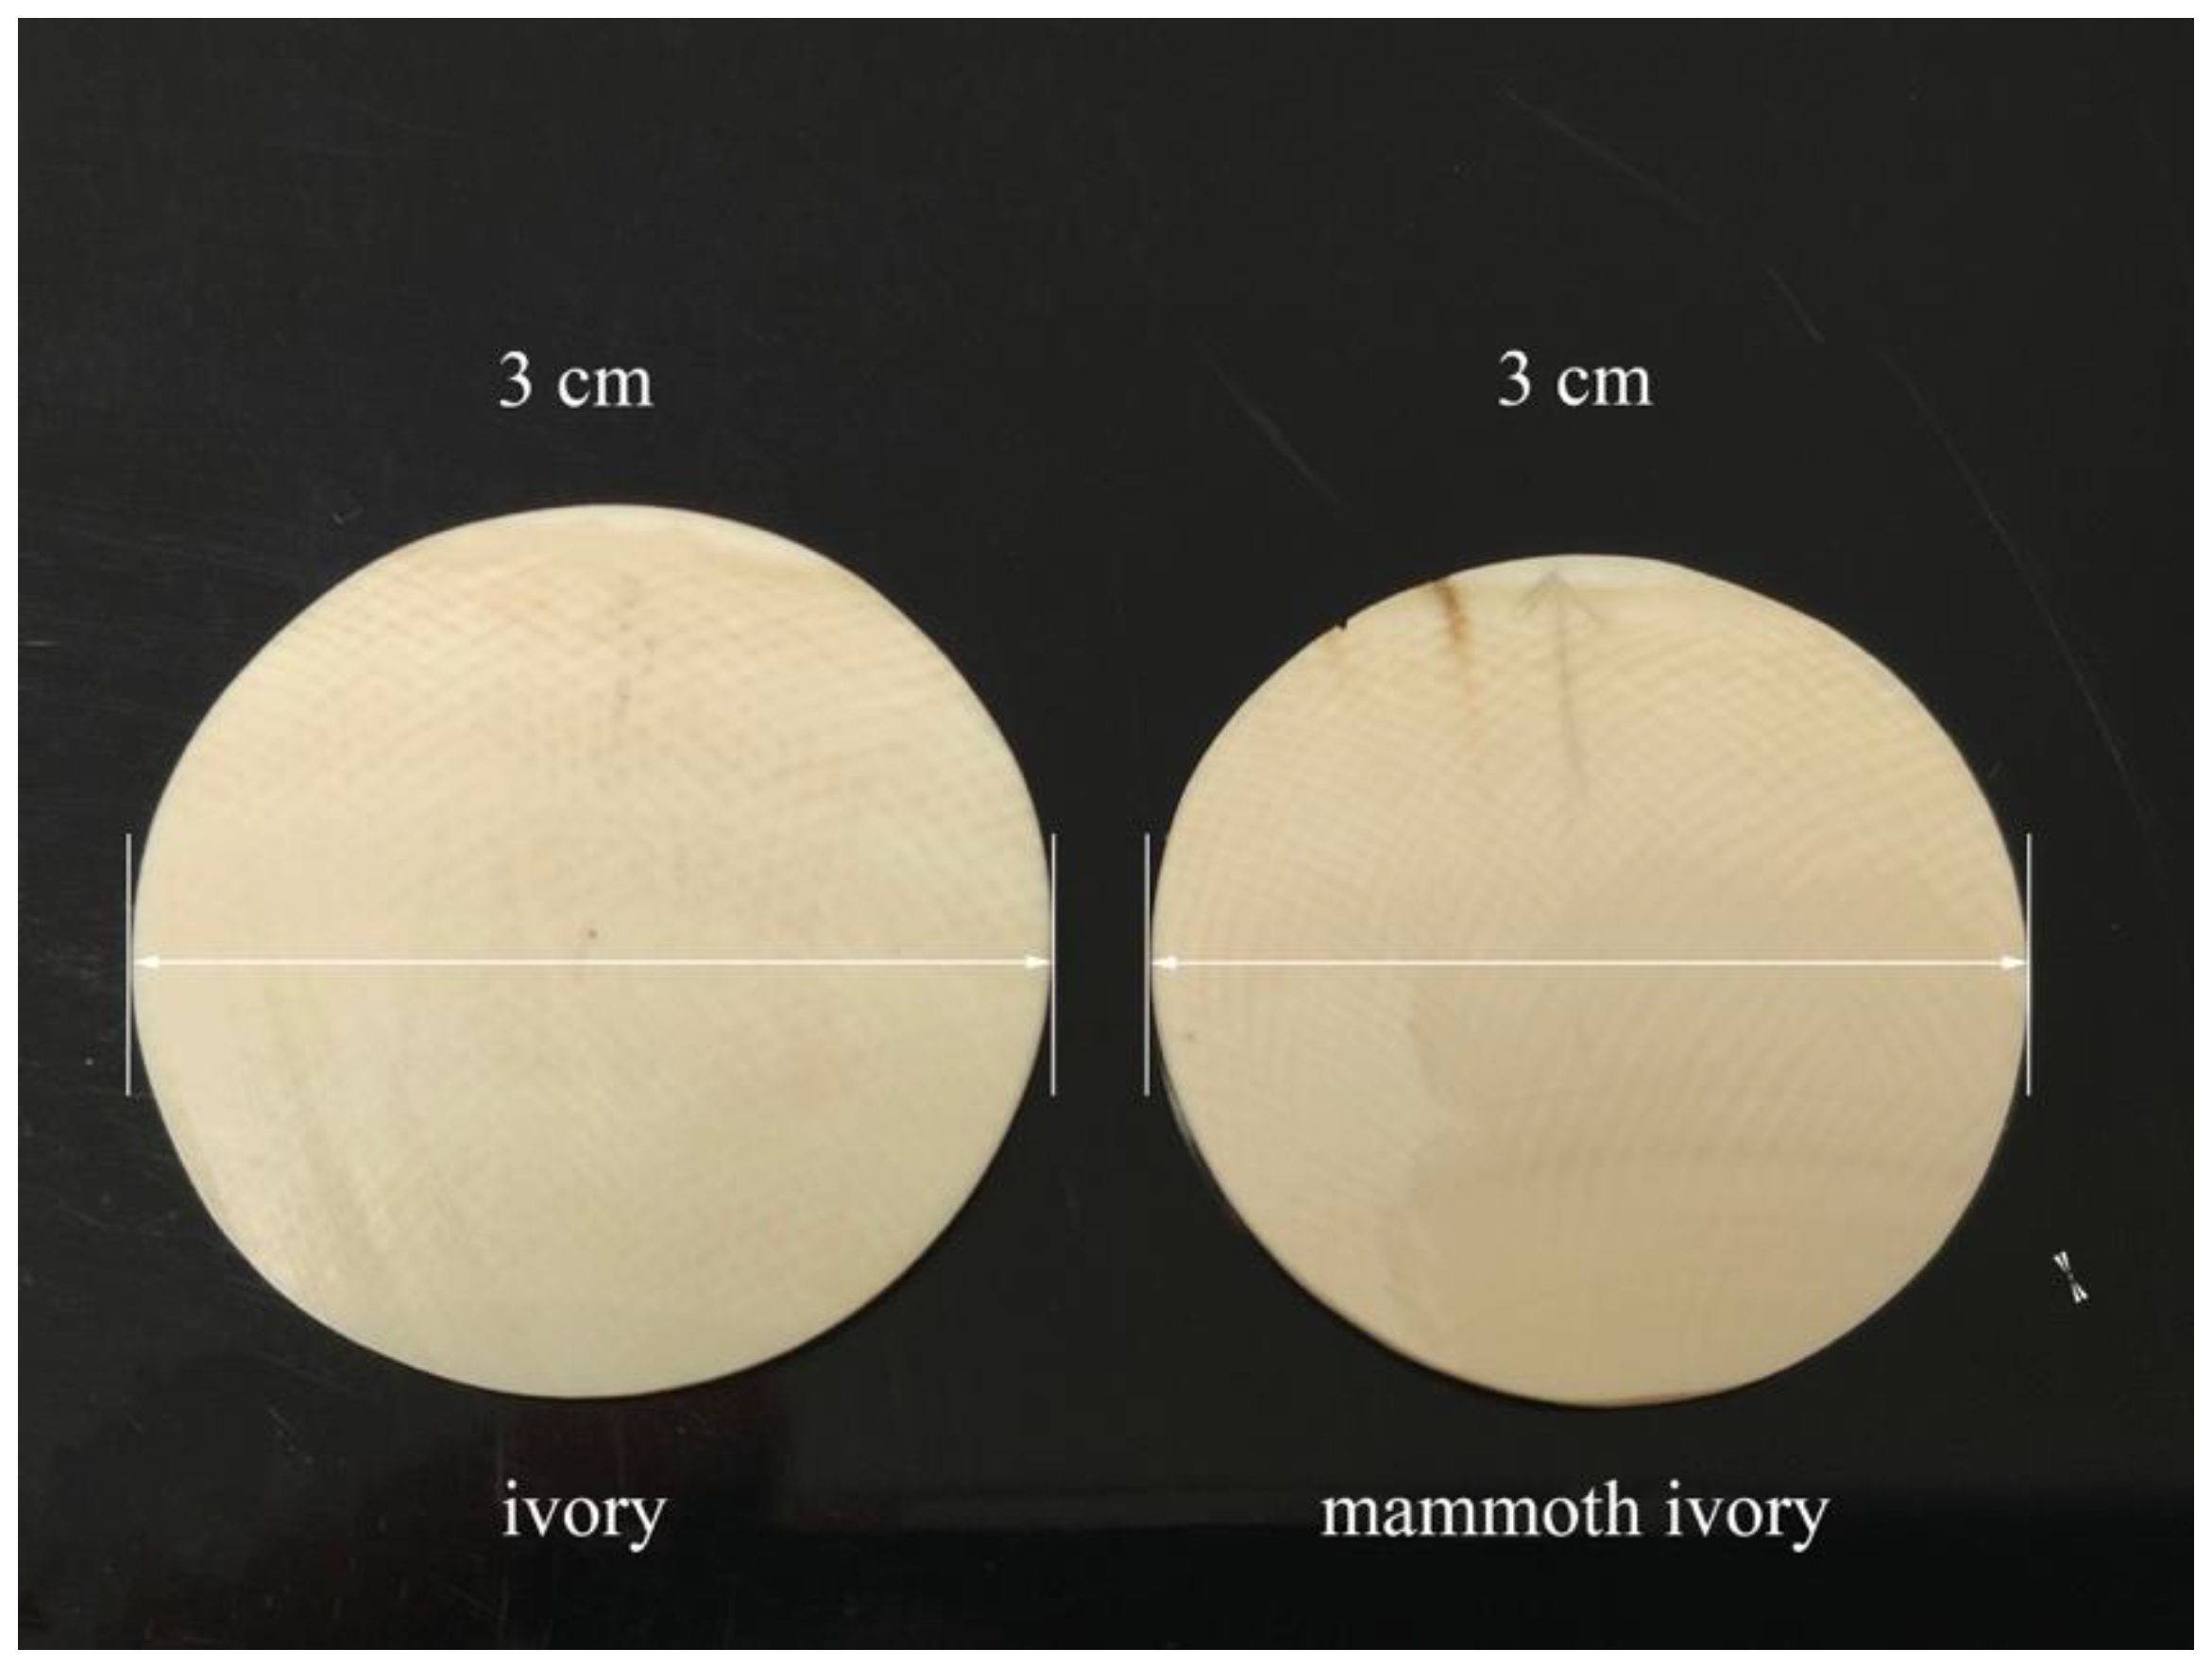
2.1. Materials

Samples of ivory from adult Zimbabwean elephants (Figure 1a) and mammoth ivory from elephants in Russia (Siberia) (Figure 1b), which were buried in permafrost, were provided by a trusted dealer, Fenghai Liu. The transverse plane consists of 3 layers, including the outermost layer, Retzius layer and innermost layer. This plane, which is cut perpendicular to the axis of the tusk, shows a geometrically regular pattern composed of two systems of radiating curved lines which begin at the center of the tusk and sweep outwards to the periphery [5]. This pattern consists of alternative light and dark lines interweaving to form a network, which can also be called Retzius (Figure 2).

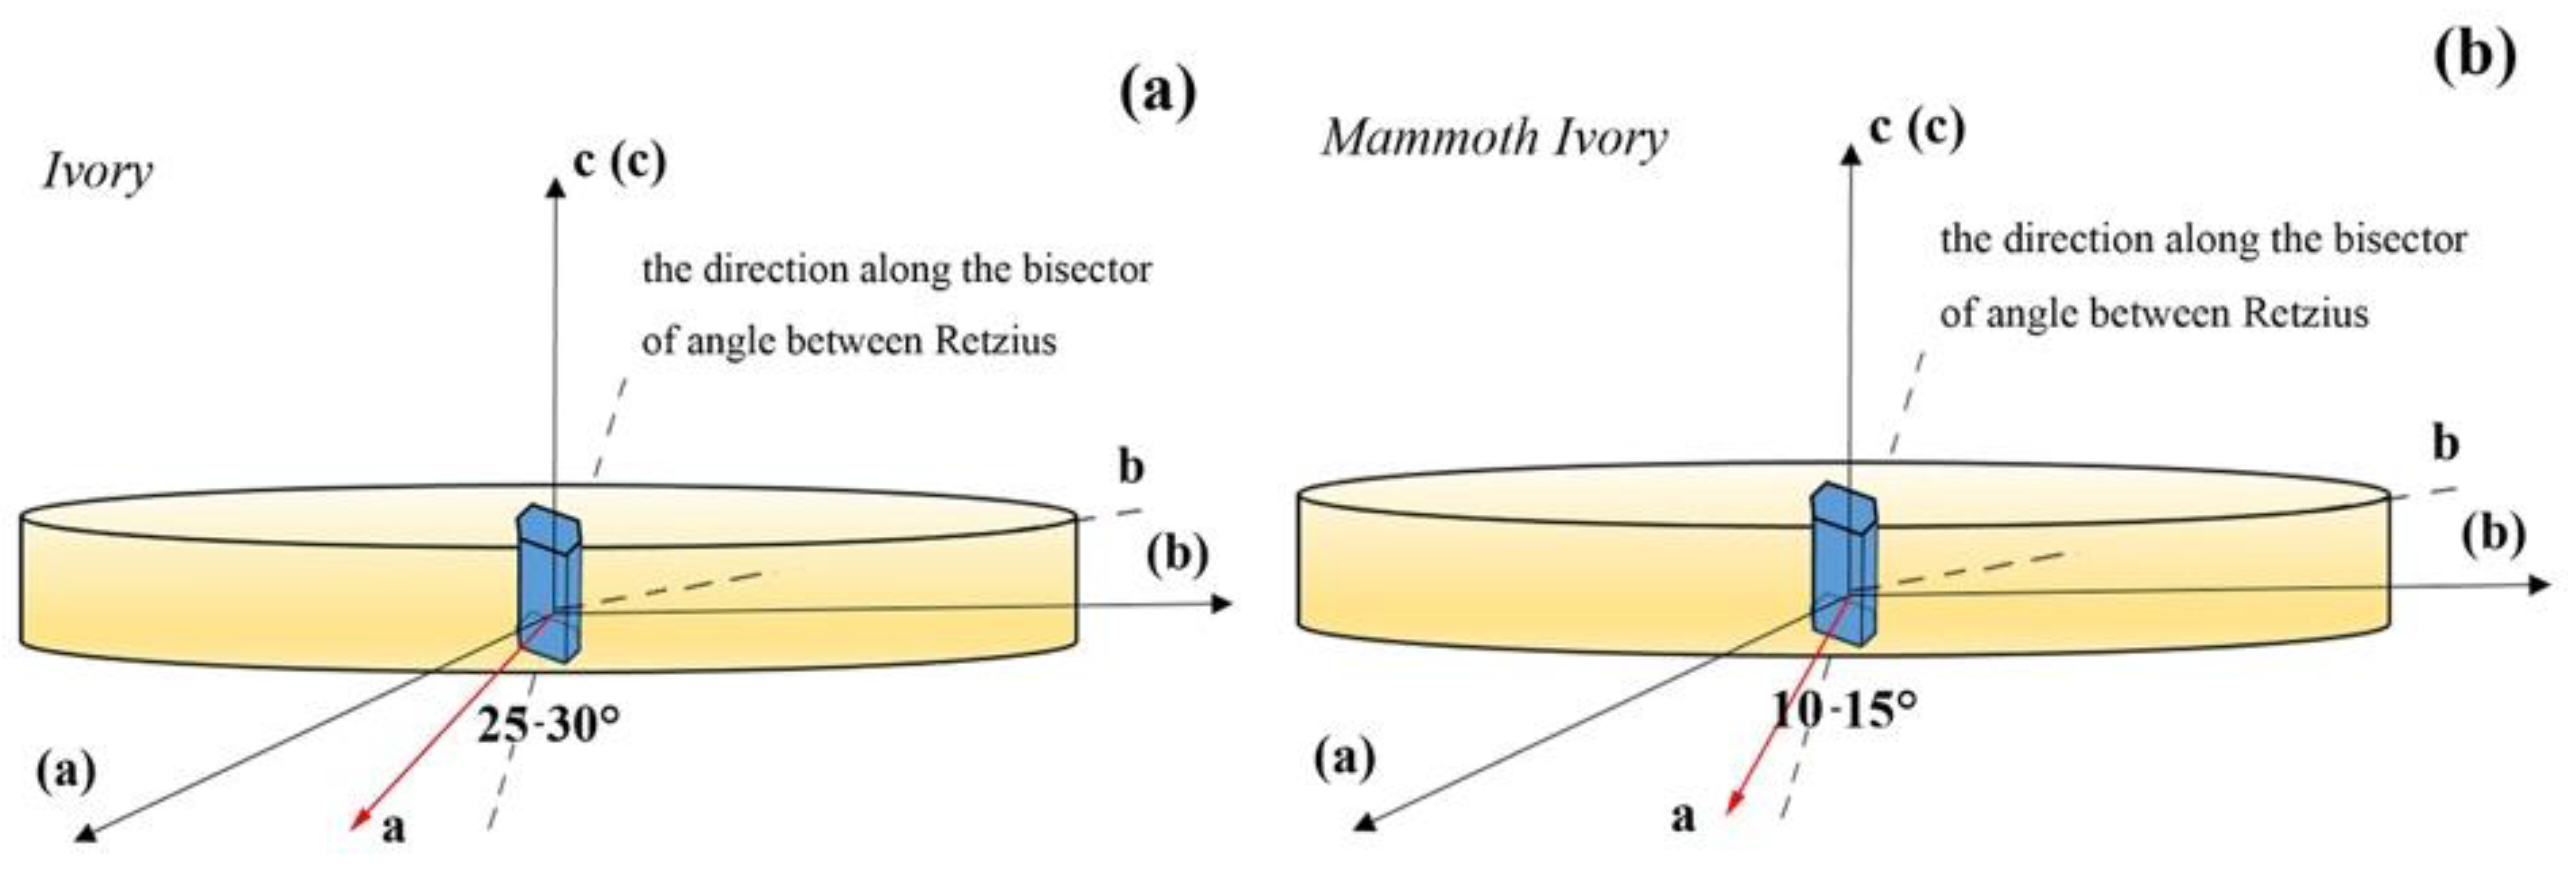
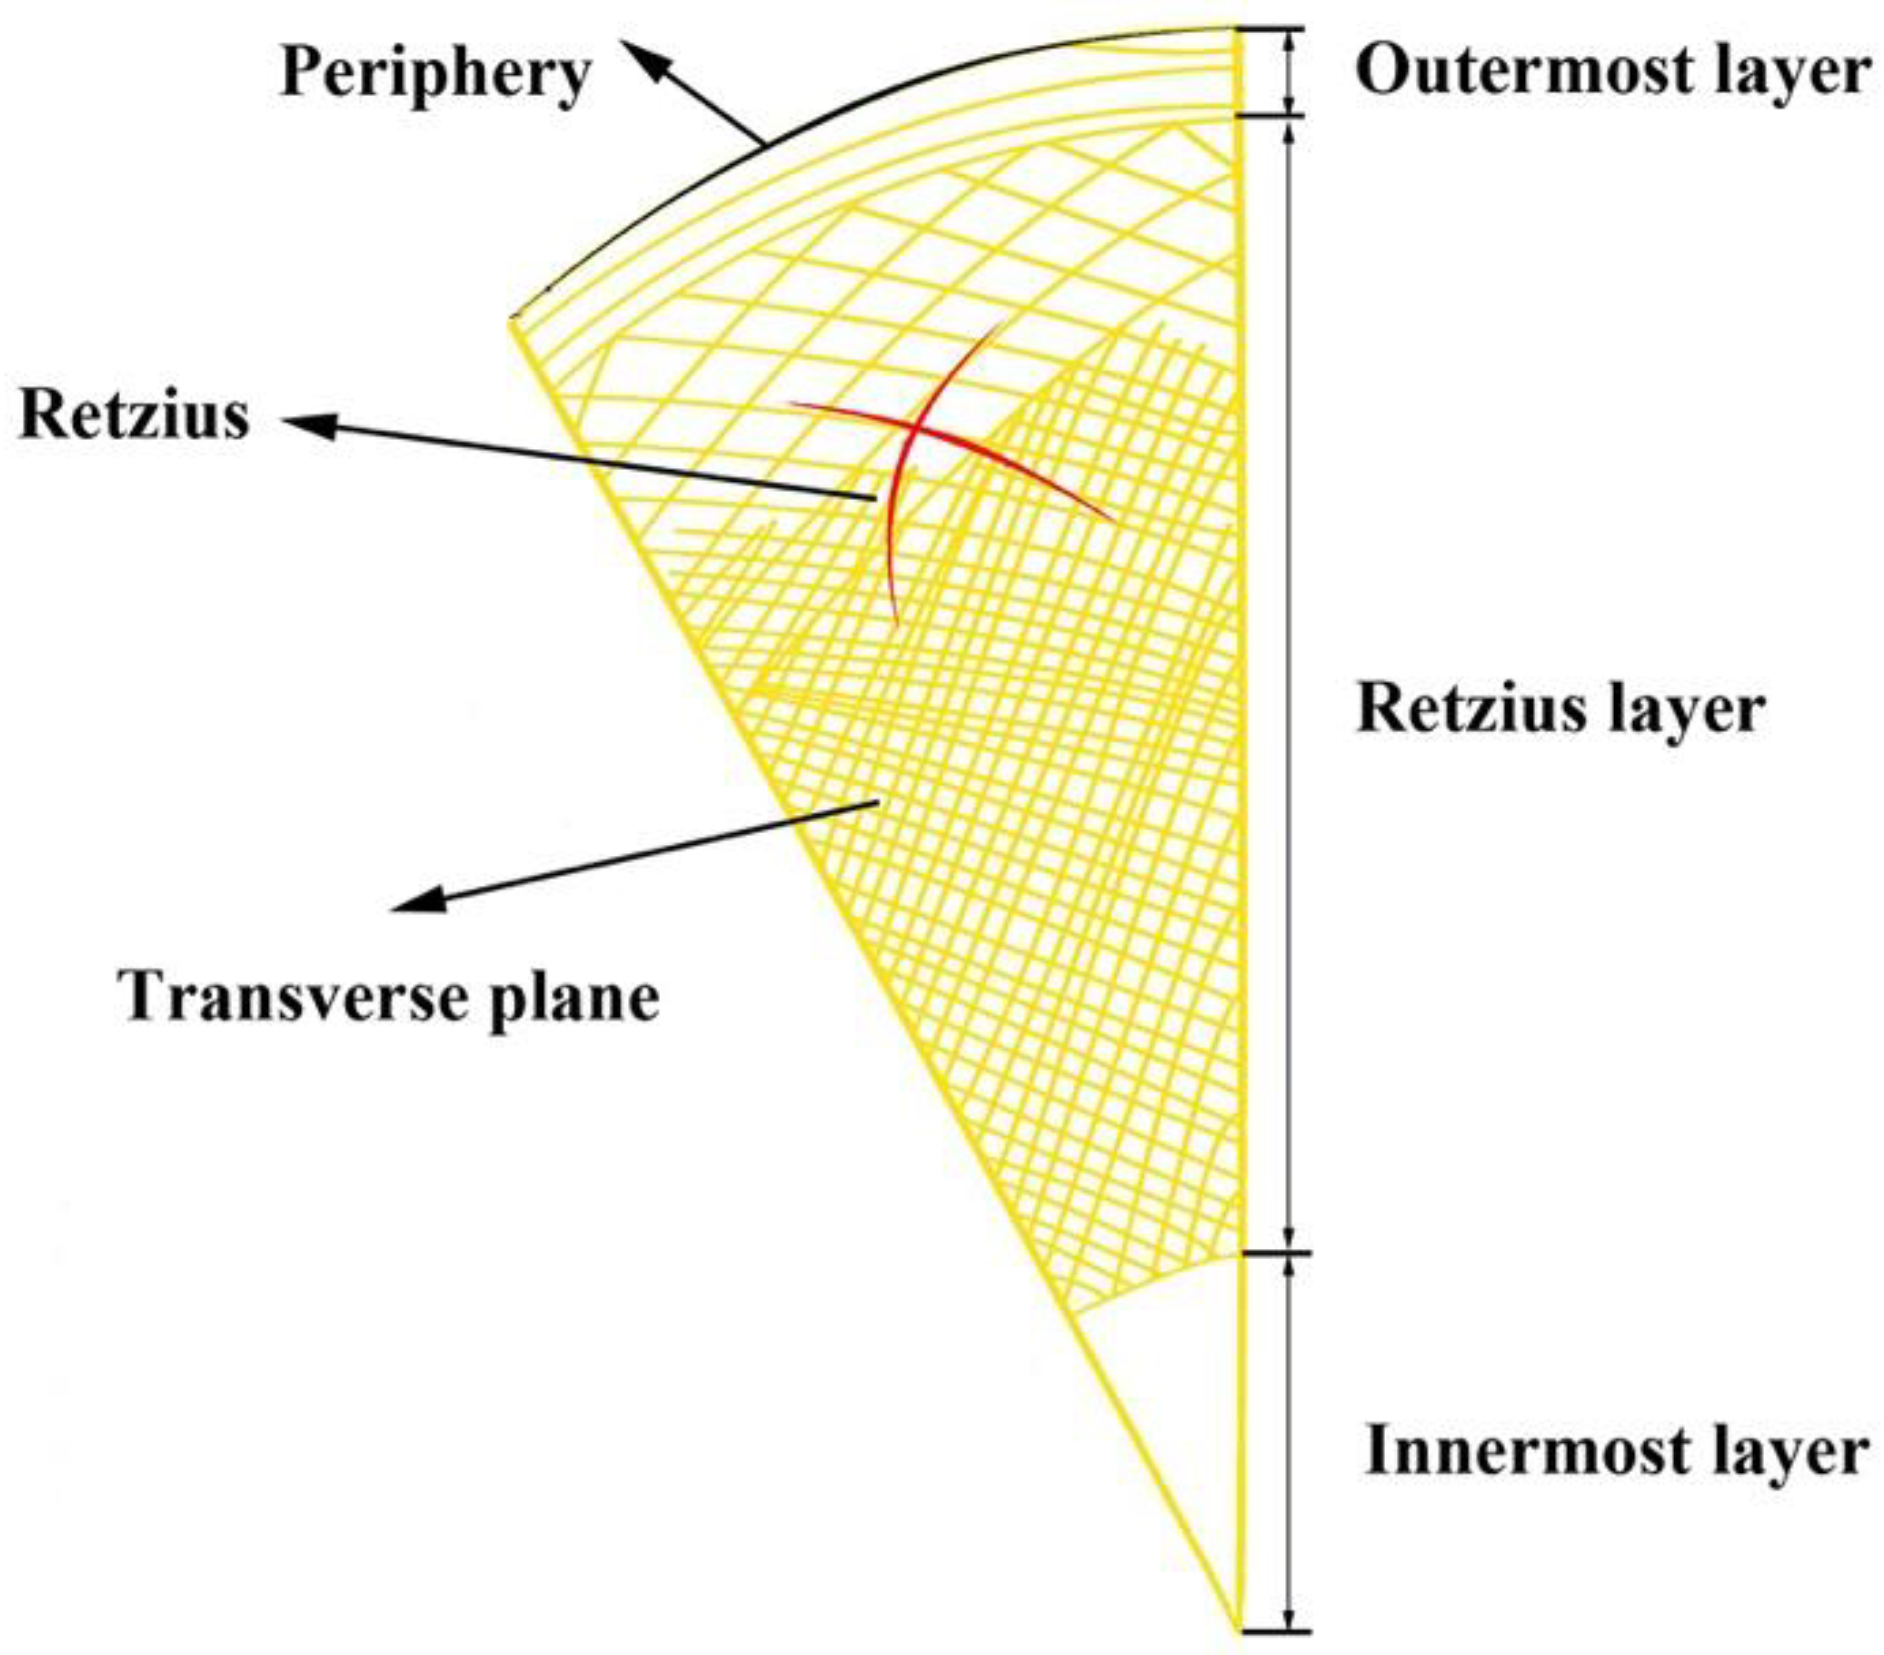
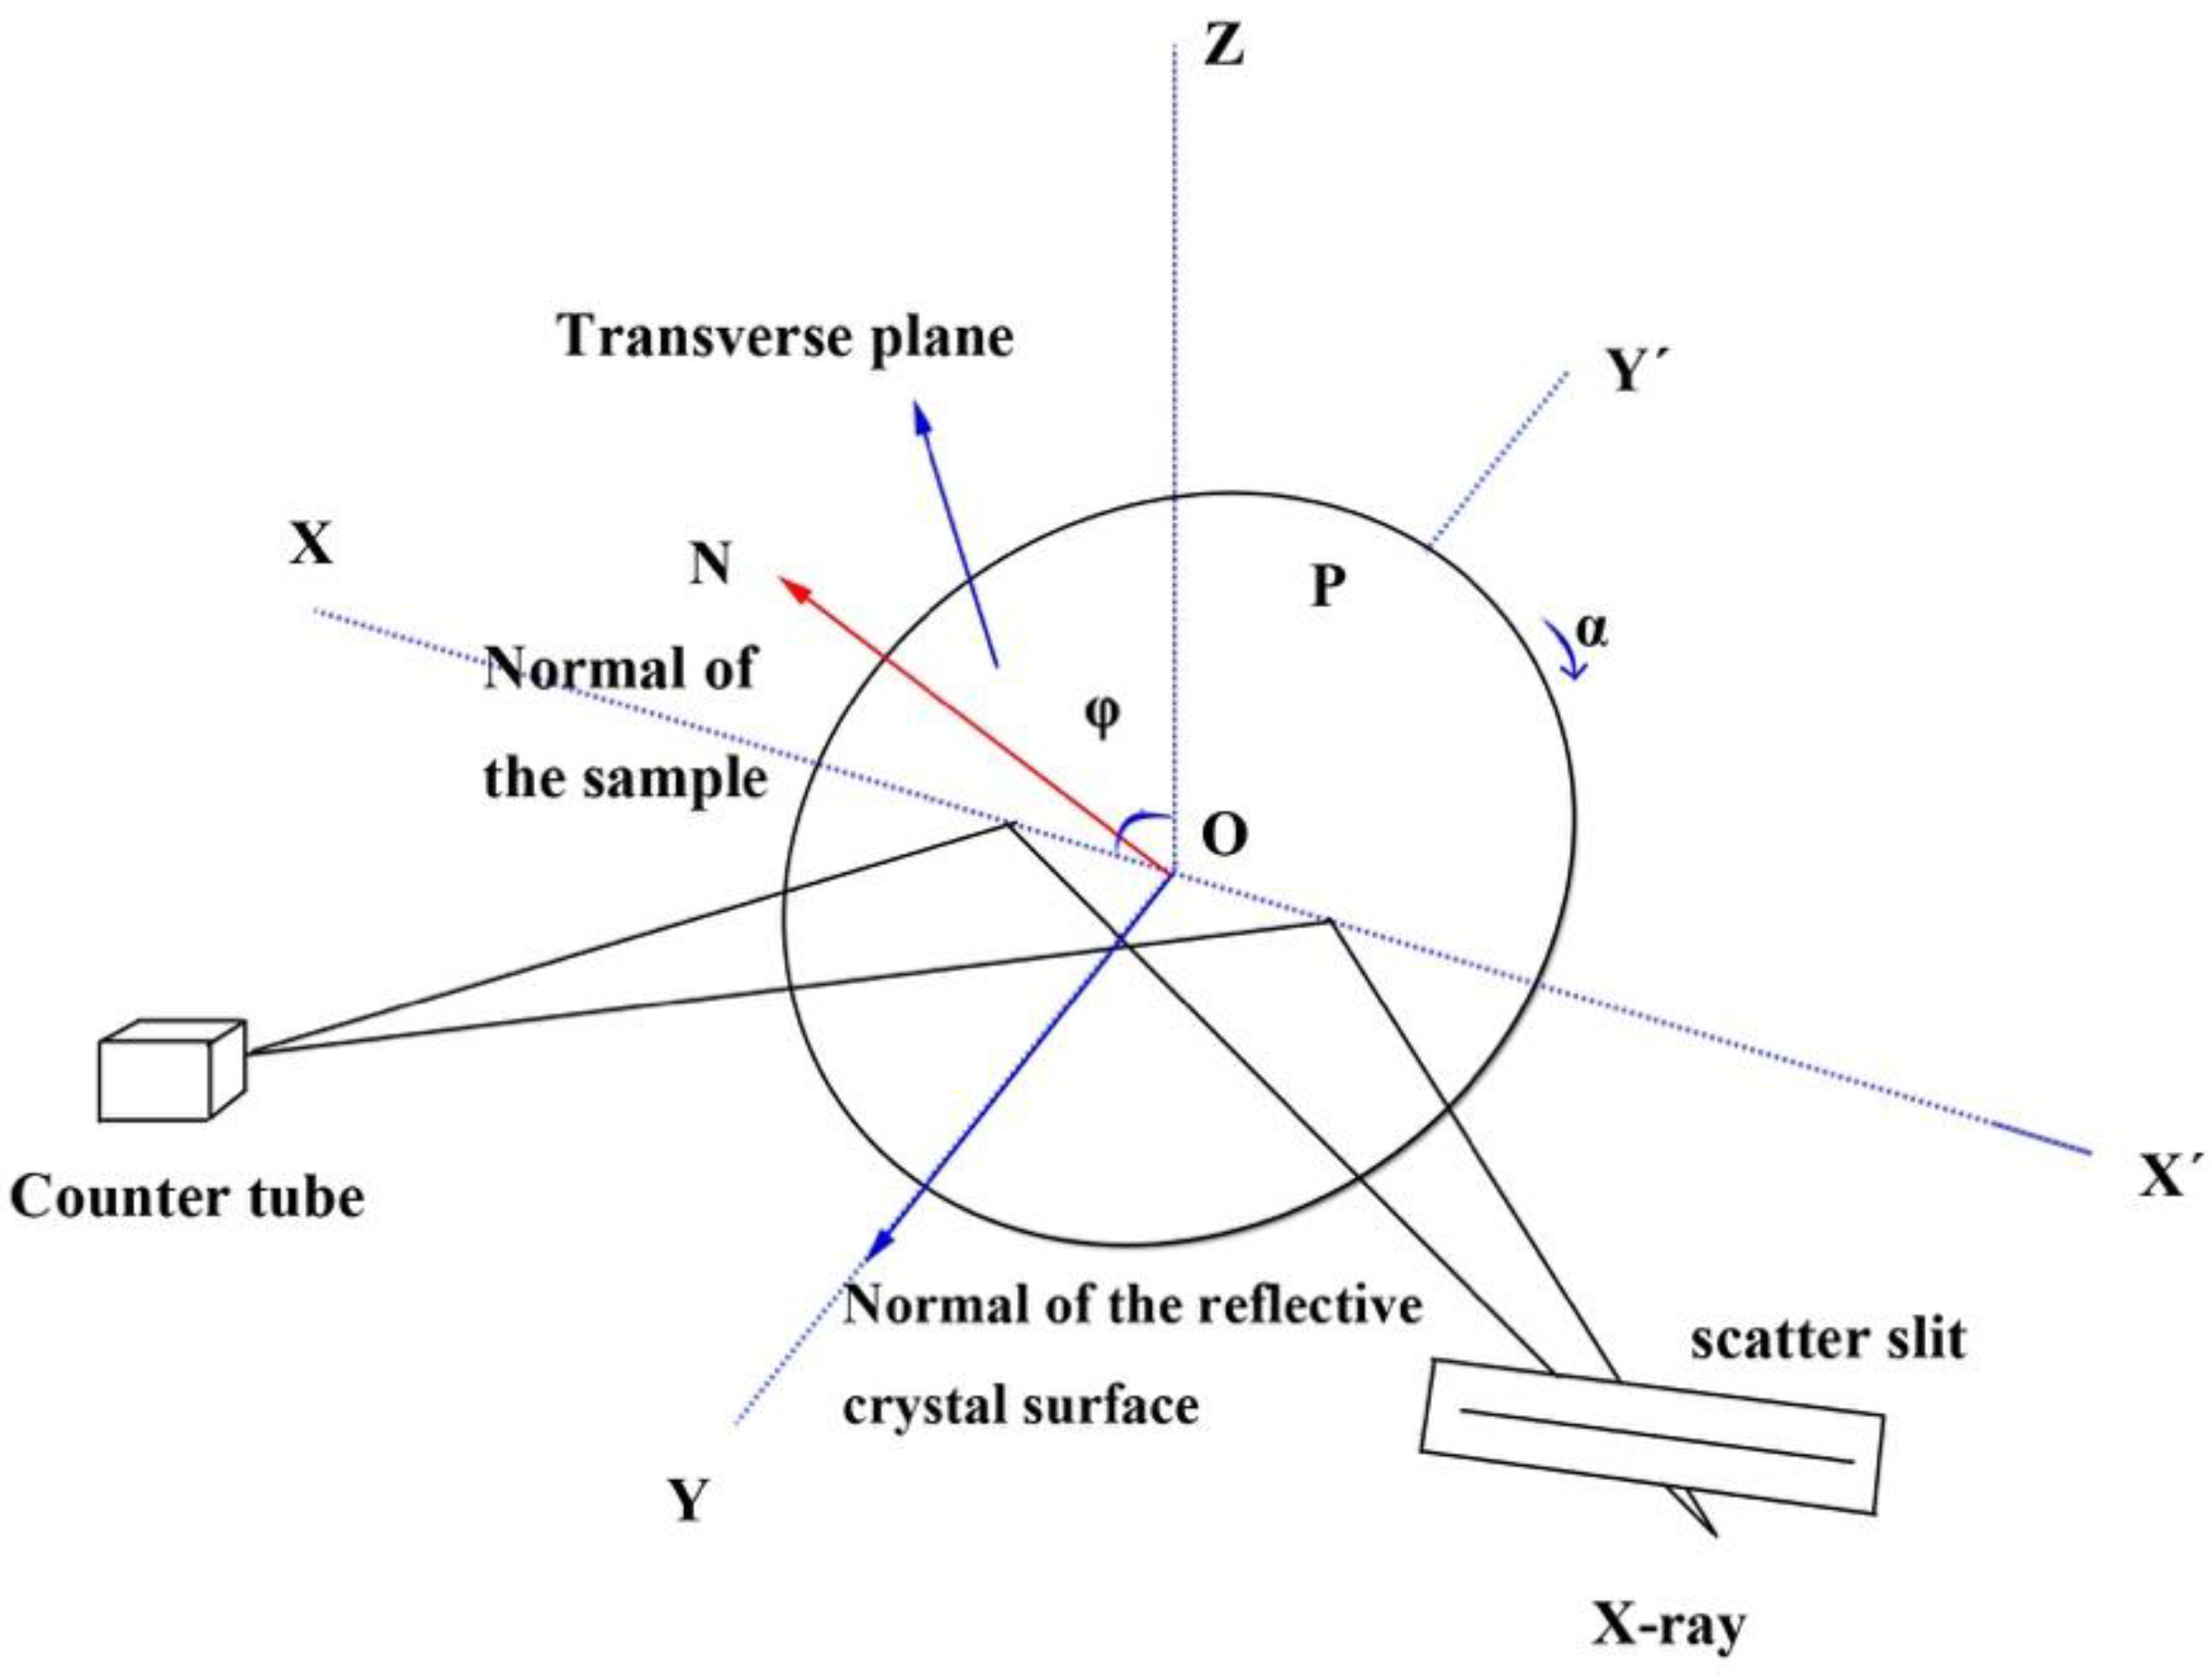
2.2. X-ray Diffraction and X-Ray Pole Figures

When a certain number of the axes of particular crystals in a polycrystalline aggregate tended to be arranged in a specific direction, this polycrystalline aggregate was considered to have a crystallographically preferred orientation [23]. The distribution law of particular surfaces of minerals in the polycrystalline aggregate can be adequately determined by X-ray pole figures. The orientation of crystals can be plotted as a pole figure, an inverse pole figure and an orientation distribution function with contours indicating intensity levels, which are in proportion to the number of effective grains involved in the diffraction in a particular direction (Figure 3). Registration of the pole figures is necessary to characterize the preferred orientation of crystals and their influence on the anisotropy of properties in textured materials. It is also beneficial to understand the development of highly organized microstructures in polycrystalline materials [24].
For the X-ray diffraction study, the specimens were cleaned and then, in order to control the fracture direction, grooves were cut around the specimens first. The samples were fractured into small lumps by a microtome, with an approximate size of 1.3 cm × 1.3 cm × 1.3 cm. The samples were polished before testing. The texted planes include transverse planes (TP), circumferential planes (CP) and radial planes (RP) (Figure 4). This test was performed using a Smartlab X-ray diffractometer (Rigaku, Tokyo, Japan) using CuKα1 radiation at 45 kV and 200 mA. Data were collected in the high precision step-scan mode: 10°–70° 2θ range, 0.02° step size, and 1 s/step counting time. All the data were analyzed by the software Jade 6.5.
For the X-ray pole figures, the specimens were cleaned and then sectioned into a round sheet with transverse surfaces up, 3 cm in diameter and 2 mm in thickness using a microtome (Figure 5). The transverse surfaces were polished and studied in a D/MAX 3A X-ray diffractometer (Rigaku, Tokyo, Japan) at 30 kV and 25 mA using Co radiation and equipped with an area detector. Figure 6 shows the schematic diagram of the testing method. Samples were placed with the transverse planes normal to the vertical axis and tilted about a horizontal axis XXˊ from tilt angle φ = 0° to φ = 88° in 10° steps, as well as rotated about their normal N from azimuth angle α = 0° to α = 360° in 3° steps with a 20 s time of exposition. A divergent slit width of 1.2° and a scatter slit width of 5° were employed for the beam source, and a receiving slit width of 3 mm was used for the detector.
We took the transverse plane as the reference plane and the angle bisector direction of Retzius as the reference direction to determine the preferred orientation of hydroxyapatite relative to the transverse plane. We located the positions of the 002, 211 and 300 poles associated with the (002), (211) and (300) crystallographic planes in the corresponding Debye-Scherrer rings from the two-dimensional frames taken at different α angles. The pole figure pattern we used depends on the orientation of the crystal lattice and implicitly contains information concerning the space group of the crystal structure. In the testing procedure, reflected lattice surfaces of effective grains are perpendicular to the sample surface when the tilt angle φ is near 88°. Therefore, it is challenging to produce diffraction in this specific position, and there are almost no contours in the edges of pole figures, which influences the following (300) pole figures.

2.3. Scanning Electron Microscope

The samples were fractured along both the circumferential planes and radial planes. The fracture surfaces with Retzius layer (RL) were gold-coated and studied in a Merlin VP Compact scanning electron microscope (15 KV) (Zeiss, Jena, Germany). The prepared samples were embedded in a resin under vacuum when testing.

3. Results and Discussion

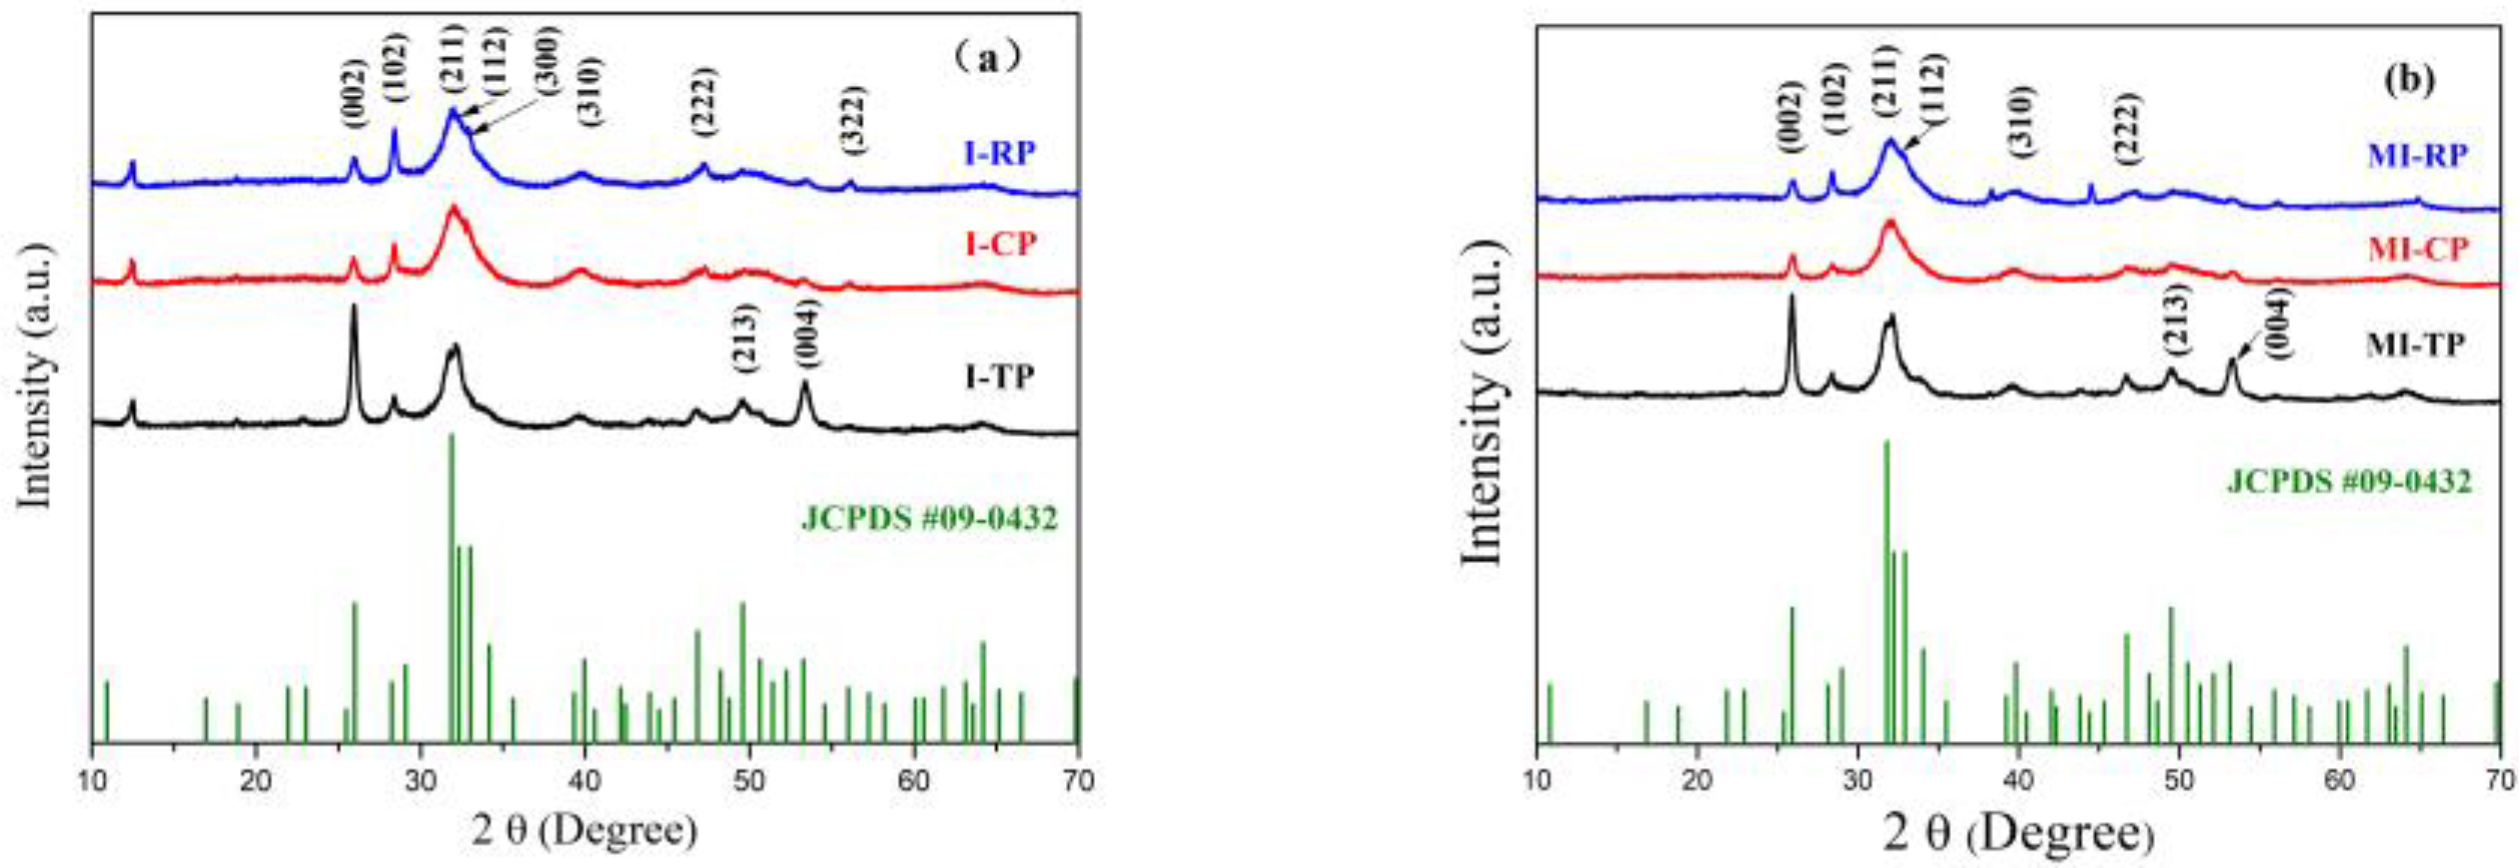
3.1. Phase Analysis and Microstructure

X-ray diffraction patterns of ivory and mammoth ivory with three different testing planes are presented in Figure 7a,b, respectively. These patterns show that the d values of the characteristic peaks at approximately 25.9° (d = 3.439Å), 31.8° (d = 2.815 Å) and 32.2° (d = 2.779Å) present no significant difference from the standard pattern of hydroxyapatite (Ca10(PO4)6OH2), according to JCPDS 09-0432, indicating that the predominant inorganic phase of these samples is hydroxyapatite. The number of diffraction peaks of the specimens is less than the number of diffraction peaks of standard hydroxyapatite. Moreover, it is noted that the peaks assigned to (211), (112) and (300) moved to a higher angle area at 31–33°, while the peaks assigned to (002) and (102) moved to a lower angle area at 25–28°.
Notably, there are some slight differences in the number, d values, shape and intensity of peaks between ivory and mammoth ivory because mammoth ivory had been buried for over ten thousand years. Notably, the X-ray diffraction patterns of ivory contain a relatively well-resolved reflection at 12.5° (d = 7.07–7.10), which can be inferred to clay minerals, such as chlorite and kaolinite, whereas there is only a weak peak for mammoth ivory.
The crystalline characteristics were determined from the X-ray diffraction patterns. Since the peak intensity reflects the degree of crystal order or the perfection of a phase, the relative degree of crystallinity of hydroxyapatite was compared using the full width at half maximum (FWHM) of the (002) peak of different planes, and these two values are inversely proportional [25]. The FWHM of the (002) peak of different planes is shown in Table 1, where all the values for the planes of mammoth ivory are lower than those of ivory.
Based on the above results, the relative degree of crystallinity of hydroxyapatite in mammoth ivory appears to be higher than that of hydroxyapatite in the ivory. We further propose that the difference between these two species may be caused by the influence of the burial environment of the mammoth ivory in permafrost.
The SEM images along radial planes show the lamellar structure (Figure 8a and Figure 9a) and the hydroxyapatite appeared as tabular ranged regularly and tightly (Figure 8b and Figure 9b). As shown in Figure 8c,d and Figure 9c,d, circumferential planes were permeated by tubules that run from the central pulp to the periphery of the outermost layer and the collagen fibril arranged along perpendicular to the long axes of the tubules.

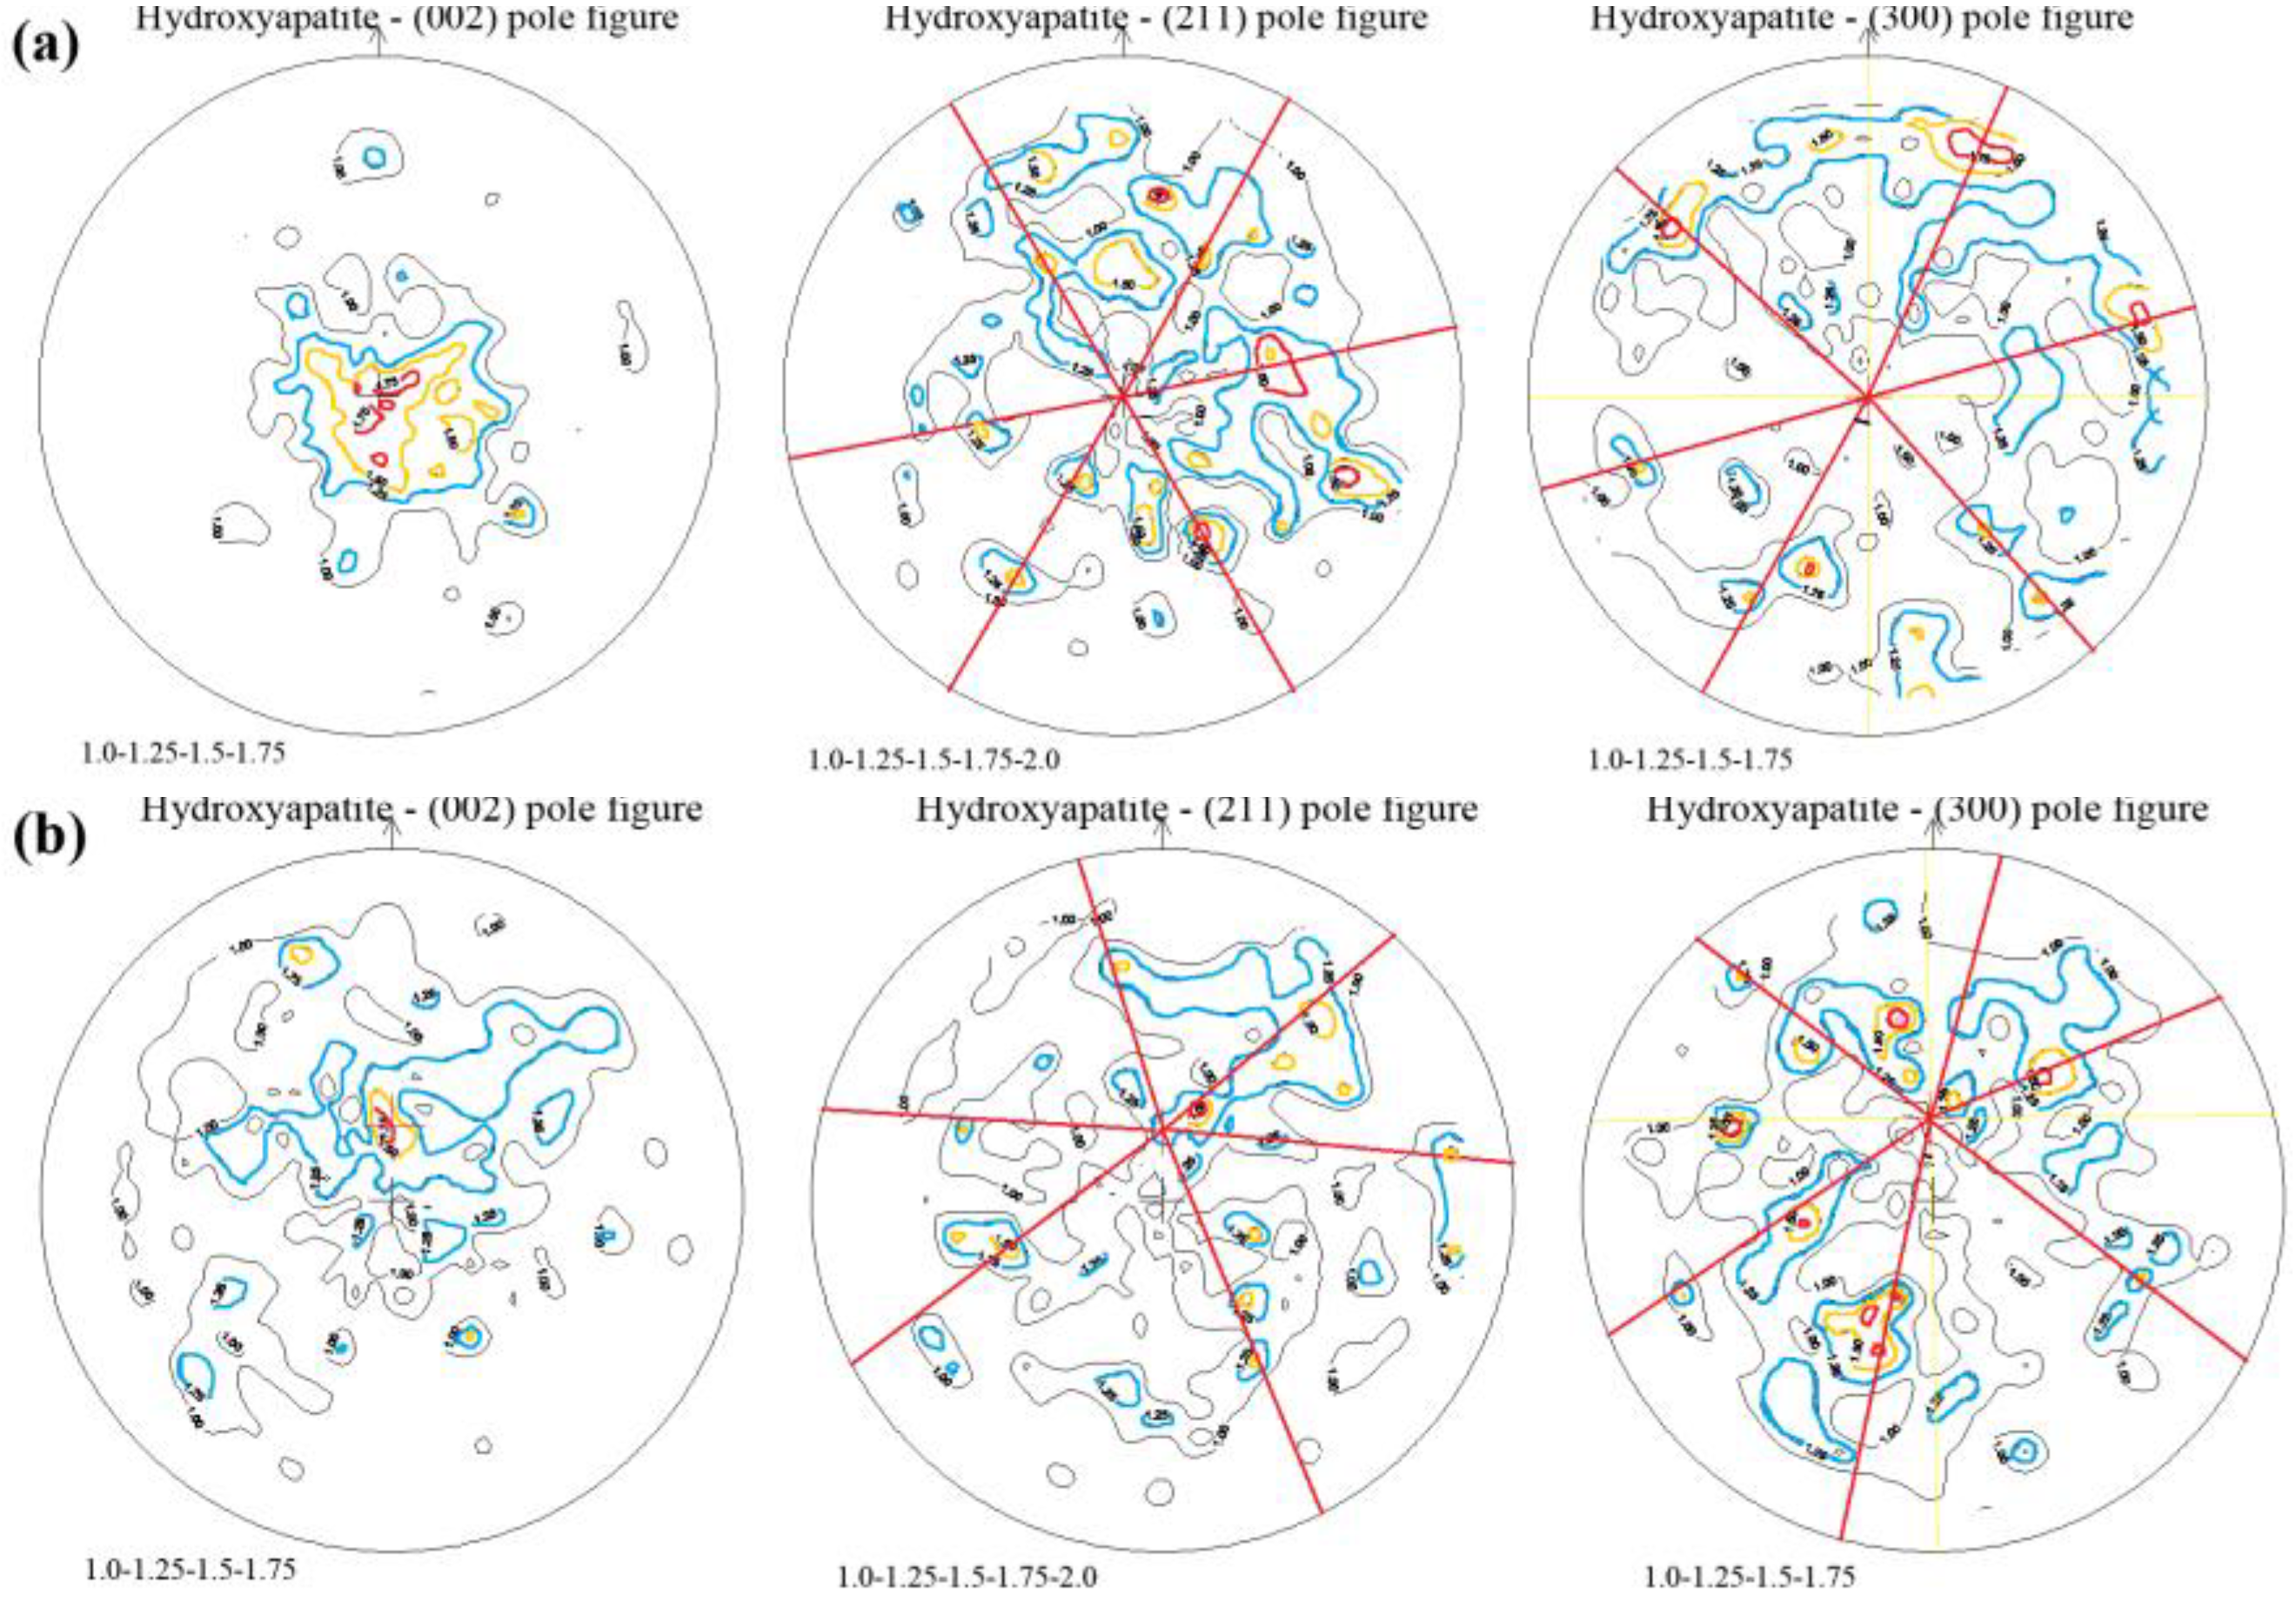
3.2. Preferred Orientation

The X-ray diffraction patterns of three planes in each species have similar peaks with different relative intensities, indicating an obvious preferred orientation of hydroxyapatite grains in ivory and mammoth ivory. To quantify the degree of texture present, the parameter R (the texture index), was proposed [26]. The values of R for specific planes were calculated according to the Equation (1).
R ( ( hkl ) ) = I ( 211 ) / I ( hkl ) K ( hkl )
where I(hkl) refers to the intensity of the (hkl) reflection and K(hkl) is equal to I(211)/I(hkl) from JCPDS 09-0432. The (211) reflection was chosen because it was the most intense peak and not sensitive to the effect of preferred orientation. According to JCPDS 09-0432, the reference intensity ratios for (002), (102), (300) and (400) are, respectively, K(002) = 2.5, K(102) = 8.33, K(300) = 1.67 and K(400) = 50 for a random hydroxyapatite powder mixture. When R = 1.0, the hydroxyapatite grains are randomly distributed, where R >1.0 or R <1.0 indicate the presence of a preferred grain orientation.
Table 2 showed the values of R(002), R(102), R(300) and R(400) for ivory and mammoth ivory and indicated the existence of a preferred orientation in the corresponding planes. There is clearly a distinct contrast in the R values depending on the alignment of the hydroxyapatite within the microstructure. When the hydroxyapatites are aligned perpendicularly to the transverse plane, the R(002) value is less than 1.0, whereas this value is greater than 1.0 when the hydroxyapatites are aligned parallel to the transverse plane [26]. The R(002) values in the two species are both less than 1 in the transverse plane, whereas there are almost close to 1 in the circumferential plane and the radial plane, which indicates that the c-axes of hydroxyapatite are mainly distributed perpendicular to the transverse plane, which is in line with the finding by Landis et al. [19]. The calculated values of R(102) in three directions showed the preferred orientation with different degree. Similarly, when the values of R(300) and R(400) are considered together, they are slightly greater than 1 in the transverse plane and almost close to 1 in the radial plane. In addition, the R(400) values in the circumferential plane are much less than 1. Based on the four-axis orientation, the a-axes of hydroxyapatites at the equivalent position of approximately 30° are near the radial direction. As a check, the orientation of hydroxyapatites was also evaluated by X-ray pole figures, which indicated the same result and were shown below.
To gain further insight into the texture of ivory and mammoth ivory, X-ray pole figures were employed. As shown in Figure 10, the (002), (211) and (300) pole figures showed a maximum intensity of 1.75 or 2 and an orientation distribution density of 1-1.25-1.5-1.75 (-2) due to the low reflective intensity of the hydroxyapatite. Blue, orange and red curved lines represented the density from 1.25 to 1.75, respectively. In all measured cases, the central maximum of the 002 pole figures indicated that the c-axis is perpendicular to or at a high angle to the transverse plane. The 002 poles figures fall in a ring with approximately φ = 30°, and the extreme maximum points fall in the range of φ = 0–15° for ivory. By comparison, the 002 pole figures of mammoth ivory showed a relatively low degree of centralization and fall in a ring with the range φ = 5–35°, and the extreme maximum points fall in the range of φ = 18–28°. In line with the X-ray powder diffraction findings, the figures here also supported that these two species retain their c-axes, are perpendicular to the transverse plane and all approximately parallel to each other, despite their slightly reclined orientation deviating from the growth direction within 20 ± 15° based on the semicircular appearance with a large radian of ivory and the helical appearance of mammoth ivory. Furthermore, the degree of alignment of crystallographic directions for hydroxyapatites is higher in ivory.
The space group of hydroxyapatite is known as C 6 h 2 -P63/m [27], which indicates that six equivalent surfaces can be found in the hexagonal dipyramid and the hexagonal prism. The acute angle between these equivalent crystal surfaces from the same sample is 60°. The 211 and 300 pole figures are distributed in a ring, indicating that the a-axes and b-axes rotate freely around the c-axes. The maximum points, respectively, colonize in the same large circle centered on the extreme maximum points shown in the 002 pole figures, and there are six maximum points approximately 60° apart, which are shown as red circles in Figure 10. The angular distance is 62–64° between each six maximum points and the center in 211 pole figures, which is the same as the angle of 65.9° between the (211) crystal surface and the (002) crystal surface. In general, the maximum points fall in the areas with φ = 70–85° and clearly show six axisymmetries in the 300 pole figures. Besides, the staggered angle between the six maximum points in the 211 pole figures and the corresponding one in the 300 pole figures is approximately 31°, close to the angle of 30.4° between the crystal faces (300) and (211). We can also conclude from the six maximum points of (300) pole figures that the a-axes of the hydroxyapatites are majorly positioned at the equivalent position of approximately 25–30° near the radial direction in ivory, while the equivalent position is 10–15° in mammoth ivory. Figure 11 depicted the orientation and the spatial relationship of hydroxyapatites in ivory and mammoth ivory in the schematic form.
Because the fastest growth of hydroxyapatite occurs along the [001] direction, organic molecules modulate the growth of hydroxyapatite along the (001) surface by molecular recognition. The only difference between the two species was in the position of the a-axes. Since the crystallographic orientation of the hydroxyapatite crystals is directly determined by the animal species and their genetic control, the internal structure patterns differ between ivory and mammoth ivory.
The unique structural characteristics of ivory and mammoth ivory are considered to have great importance with regard to the mechanical properties. The hardness values and indentation morphology exhibit rather different behavior in the three orthogonal planes (the transverse, circumferential and radial planes) related to the cylindrical geometry of the tusk [28].
The data in this study may be vital to the development of general concepts concerning nucleation and crystal growth, but complete characterization required additional investigation. The non-collagenous proteins or other matrix components dictate crystal formation. Then, more crystals are located in the collagen hole zones than in the overlap regions at the earlier stages of the mineralization [19]. The occurrence of bio-mineralization of hydroxyapatites is related to the binding to one type of non-collagenous protein. The negatively charged protein surface is bound to 5 Ca2+ in the hydroxyapatite crystal in a particular spatial orientation. Some specific secondary structure conformations (such as the β-sheet) in collagen molecules can preferentially interact with the specific crystal plane of bone mineral crystals and the coordination network of Ca–O atoms at the non-collagenous protein–hydroxyapatite interface closely mimics that in the hydroxyapatite crystal lattice, thereby influencing the nucleation and morphology of minerals, indicating that the organic matrix in the organism regulates the orientation of bio-mineralized crystals in three dimensions [29].
A final point of discussion that pertains to potential implications is that X-ray pole figures are employed mainly for the macro-texture and due to the strict limitation for samples, there is difficulty in performing a detailed study of different structure layers, thus limiting the analysis of orientation differences and the trend of orientation during growth. In future, transmission electron microscopy and electron backscatter diffraction can be employed to compensate for this limitation.

4. Conclusions

This study demonstrates that the mineral phases of ivory and mammoth ivory are both composed of hydroxyapatite crystals. The relative degree of crystallinity of hydroxyapatite attained in ivory is lower than the relative degree of crystallinity attained in mammoth ivory. The existence of a preferred orientation of hydroxyapatite in ivory and mammoth ivory was verified by X-ray diffraction and X-ray pole figures, which are inclined to the growth direction and are almost evenly distributed. The a-axes and b-axes freely rotate around the c-axes. Besides, the a-axes are mainly distributed at the equivalent position of approximately 25–30° near the radial direction in ivory and about 10–15° in mammoth ivory.

Author Contributions

Formal analysis, X.S.; Funding acquisition, M.H.; Investigation, X.S. and J.W.; Methodology, X.S. and M.H.; Project administration, M.H.; Resources, M.H.; Software, J.W.; Supervision, M.H.; Validation, X.S. and M.H.; Visualization, X.S. and J.W.; Writing—original draft, X.S.; Writing—review and editing, M.H. All authors have read and agreed to the published version of the manuscript.

Funding

This research was funded by National Science & Technology Infrastructure-The National Infrastructure of Mineral, Rock and Fossil Resources for Science and Technology (http://www.nimrf.net.cn/), and the Program of the Data Integration and Standardization in the Geological Science and Technology from MOST, China, grant number 2013FY110900-3.

Acknowledgments

The authors wish to express their great appreciation to Liu Fenghai for providing the samples. Also, we would like to thank for the staff members from the X-ray Powder Diffraction Laboratory at the China University of Geosciences (Beijing) and the Institute of Geomechanics of the Chinese Academy of Geological Sciences.

Conflicts of Interest

The authors declare no conflict of interest.

References

  1. Mann, S. Biomineralization: Principles and Concepts in Bioinorganic Materials Chemistry, 1st ed.; Oxford University Press: Oxford, UK, 2001; pp. 6–12, 24–37. [Google Scholar]
  2. Falini, G.; Fermani, S. The strategic role of adsorption phenomena in biomineralization. Cryst. Res. Technol. 2013, 48, 864–876. [Google Scholar] [CrossRef]
  3. Weiner, S.; Addadi, L. Crystallization Pathways in Biomineralization. Annu. Rev. Mater. Res. 2011, 41, 21–40. [Google Scholar] [CrossRef]
  4. Cui, F.Z. Biomineralization, 1st ed.; Tsinghua University Press: Beijing, China, 2007; pp. 118–132. [Google Scholar]
  5. Su, X.W.; Cui, F.Z. Hierarchical Structure of Ivory: From Nanometer to Centimeter. Materials Sci. Eng. C 1999, 7, 19–29. [Google Scholar] [CrossRef]
  6. Robinson, R.A.; Watson, M.L. Collagen-crystal Relationships in Bone as seen in the Electron Microscope. Anat. Rec. 1952, 114, 383–409. [Google Scholar] [CrossRef] [PubMed]
  7. Nganvongpanit, K.; Brown, J.L.; Buddhachat, K.; Somgird, C.; Thitaram, C. Elemental Analysis of Asian Elephant (Elephasmaximus) Teeth Using X-ray Fluorescence and a Comparison to Other Species. Biol. Trace Elem. Res. 2016, 170, 94–105. [Google Scholar] [CrossRef] [PubMed]
  8. Michel, V.; Ildefonse, P.; Morin, G. Chemical and Structural Changes in Cervus Elaphus Tooth Enamels during Fossilization (Lazaret cave): A combined IR and XRD Rietveld analysis. Appl. Geochem. 1995, 10, 145–159. [Google Scholar] [CrossRef]
  9. Rehman, I.; Smith, R.; Hench, L.L.; Bonfield, W. Structural Evaluation of Human and Sheep Bone and Comparison with Synthetic Hydroxyapatite by FT-Raman Spectroscopy. J. Biomed. Mater. Res. 1995, 29, 1287–1294. [Google Scholar] [CrossRef]
  10. Vignoles, M.; Bonel, G.; Holcomb, D.W.; Young, R.A. Influence of Preparation Conditions on the Composition of Type B Carbonated Hydroxyapatite and on the Localization of the Carbonate Ions. Calcif. Tissue Int. 1988, 43, 33. [Google Scholar] [CrossRef] [PubMed]
  11. Locke, M. Structure of Ivory. J. Morphol. 2008, 269, 423–450. [Google Scholar] [CrossRef] [PubMed]
  12. Qi, L.J.; Zhou, Z.Y.; Liao, G.L.; Lin, S.S. Differences on Growth Microstructure and FTIR Absorption Spectra between Mammoth Teeth and Ivory. J. Gems Gemol. 2010, 12, 1–4. [Google Scholar]
  13. Robinson, R.A. An Electron-Microscopic Study of the Crystalline Inorganic Component of Bone and its relationship to the organic matrix. J. Bone Jt. Surg. 1952, 34, 389–435. [Google Scholar] [CrossRef]
  14. Johansen, E.; Parks, H.F. Electron Microscopic Observations on the 3-Dimensional Morphology of Apatite Crystallites of Human Dentine and Bone. J. Biophys. Biochem. Cytol. 1960, 7, 743–746. [Google Scholar] [CrossRef]
  15. Bocciarelli, D.S. Morphology of crystallites in bone. Calcif. Tissue Res. 1969, 5, 61–269. [Google Scholar]
  16. Fernandez-Morán, H.; Engström, A. Electron Microscopy and X-ray Diffraction of Bone. Biochim. Et Biophys. Acta 1957, 23, 260–264. [Google Scholar] [CrossRef]
  17. Jackson, S.A.; Cartwright, A.G.; Lewis, D. (1978) The Morphology of Bone Mineral Crystals. Calcif. Tissue Res. 1978, 25, 217–222. [Google Scholar] [CrossRef]
  18. Weiner, S.; Price, P.A. Disaggregation of Bone into Crystals. Calcif. Tissue Int. 1986, 39, 65–375. [Google Scholar] [CrossRef]
  19. Landis, W.J.; Song, M.J.; Leith, A.L.; McEwen, L.; McEwen, B.F. Mineral and Organic Matrix Interaction in Normally Calcifying Tendon Visualized in Three Dimensions by High-Voltage Electron Microscopic Tomography and Graphic Image Reconstruction. J. Struct. Biol. 1993, 110, 39–54. [Google Scholar] [CrossRef] [PubMed]
  20. Su, X.W.; Cui, F.Z. Direct Observations on Apatite Crystals in Ivory. J. Mater. Sci. Lett. 1997, 16, 1198–1200. [Google Scholar] [CrossRef]
  21. Zhang, G.S.; Xie, X.D. Preferential Orientation of Aragonite Crystals in Nacre of Mollusc Shells. J. Inorg. Mater. 2000, 5, 765–768. [Google Scholar]
  22. Xie, X.D.; Zhang, G.S. XRD Pole Figure Analysis of the Preferential Orientations of Aragonite in Nacre. Acta Mineral. Sin. 2001, 21, 299–302. [Google Scholar]
  23. Jiang, G.X.; Liu, Z.X.; Wei, D.H.; Qu, W. X-ray Petrofabrics, 1st ed.; Geological Publishing House: Beijing, China, 1997; pp. 18–58. [Google Scholar]
  24. Rodríguez-Navarro, A.B. Registering Pole Figures Using an X-ray Single-crystal Diffractometer Equipped with an Area Detector. J. Appl. Crystallogr. 2007, 40, 631–634. [Google Scholar] [CrossRef]
  25. Sillen, A.; Sealy, J.C. Diagenesis of Strontium in Fossil Bone: A Reconsideration of Nelson (1986). J. Archaeol. Sci. 1995, 22, 313–320. [Google Scholar] [CrossRef]
  26. Low, I.M. Depth-Profiling of Crystal Structure, Texture, and Microhardness in a Functionally Graded Tooth Enamel. J. Am. Ceram. Soc. 2004, 87, 2125–2131. [Google Scholar] [CrossRef]
  27. Elliott, J.C. Space Group and Lattice Constants of Ca10(PO4)6CO3. J. Appl. Crystallogr. 1980, 13, 618–621. [Google Scholar] [CrossRef]
  28. Cui, F.Z.; Wen, H.B.; Zhang, H.B.; Li, H.D.; Liu, D.C. Anisotropic Indentation Morphology and Hardness of Natural Ivory. Mater. Sci. Eng. C 1994, 2, 87–91. [Google Scholar] [CrossRef]
  29. Hoang, Q.Q.; Sicheri, F.; Howard, A.J.; Yang, D.S.C. Bone Recognition Mechanism of Porcine Osteocalcin from Crystal Structure. Nature 2003, 425, 977–980. [Google Scholar] [CrossRef]
Figure 1. Representative specimen photographs of samples: (a) a sample of ivory from adult Zimbabwean elephants, light yellowish white, (b) a sample of mammoth ivory from mammoth in Russia (Siberia), deep yellowish white.
Crystals 11 00572 g001
Figure 2. Schematic diagram of Retzius. This pattern consists of alternative light and dark lines interweaving to form a network, which begin at the center of the tusk and sweep outwards to the periphery.
Crystals 11 00572 g002
Figure 3. Part of the grain producing effective diffraction for a certain face in the polycrystalline aggregate [23].
Crystals 11 00572 g003
Figure 4. Schematic diagram of the sample acquired from the ivory or mammoth ivory. ABCD: transverse plane, CDHG: outer circumferential plane, ADHE: radial plane.
Crystals 11 00572 g004
Figure 5. Specimens for the X-ray pole figures.
Crystals 11 00572 g005
Figure 6. Schematic diagram of the testing method for X-ray pole figures. XY: horizontal plane, Z: vertical axis, P: sample, φ: tilt angle, α: azimuth angle.
Crystals 11 00572 g006
Figure 7. X-ray diffraction patterns: (a) ivory with three testing planes, (b) mammoth ivory with three testing planes.
Crystals 11 00572 g007
Figure 8. SEM images of the Retzius layer in ivory: (a) lamellar structure in radial plane (scale bar: 10 µm), (b) tabular hydroxyapatite in radial plane (scale bar: 100 nm), (c) tubules run from the central pulp to the periphery of the outmost layer in circumferential plane (scale bar: 2 µm), (d) collagen fibrils arranged along perpendicular to the long axes of the tubules in circumferential plane (scale bar: 2 µm).
Crystals 11 00572 g008
Figure 9. SEM images of the Retzius layer in mammoth ivory: (a) lamellar structure in radial plane (scale bar: 10 µm), (b) tabular hydroxyapatite in radial plane (scale bar: 100 nm), (c) tubules run from the central pulp to the periphery of the outmost layer in circumferential plane (scale bar: 1 µm), (d) collagen fibrils arranged along perpendicular to the long axes of the tubules in circumferential plane (scale bar: 1 µm).
Crystals 11 00572 g009
Figure 10. X-ray pole figures of hydroxyapatite: (a) (002), (300) and (211) pole figures of hydroxyapatite in ivory, (b) the same in mammoth ivory.
Crystals 11 00572 g010
Figure 11. Crystallographic orientation of hydroxyapatite: (a) ivory, (b) mammoth ivory.
Crystals 11 00572 g011
Table 1. Full width at half maximum of the (002) peak of different planes.
θ/(°)FWHM (°)
IvoryTP12.960.375
CP12.960.399
RP12.960.426
Mammoth ivoryTP12.940.348
CP12.960.392
RP12.960.395
Table 2. Values of the textural index R.
IvoryMammoth Ivory
TPCPRPTPCPRP
R(002)0.17720.60690.73170.22160.79520.7055
R(102)0.26190.10560.09770.38880.16260.4027
R(300)2.12220.52800.72532.21160.81141.1193
R(400)0.21200.0317
Publisher’s Note: MDPI stays neutral with regard to jurisdictional claims in published maps and institutional affiliations.

