Abstract
This study investigates the evolution of different grain boundaries in two-dimensional wet foam (2D) together with the width and the roughness of the interface. The foam around the boundaries coarsened and became disordered. The level of the disorder increased with time over a range and is consistent with the results from previous studies on relatively ordered soap froths. Although the misorientation angle comprising the grain boundaries did not affect the evolution of the foam, the nature of the system boundaries had a significant effect on the degree of the disorder along the grain boundaries. This result is in good agreement with earlier published simulation results.
1. Introduction
Disordered 2D foams are known to contain grain boundaries between the domains of the crystal arrays of bubbles, as well as substitutional point defects. The evolution of these grain boundaries in the context of 2D soap froths may be of interest, but the lack of studies concerning this domain is a major disadvantage. Earlier experiments and simulations were performed on the dynamic behavior of grain boundaries in soap bubble rafts as a function of the angle of disorientation between the two domains [1].
Several theories have been reported on grain boundaries in crystals. However, none of these theories have been entirely effective in explaining the overall properties of grain boundaries. Although the width of grain boundaries was well addressed in these theories, the explanation of the energy of the boundary failed [2,3]. On the other hand, the dislocation theory of grain boundaries has precisely identified the atomic arrangement and has enabled the energy of the grain boundary to be calculated as a function of the misorientation between the two crystals separated by the boundary [4,5,6]. The theory, however, does not provide a satisfactory explanation of mechanical behavior, except in the very limited case of the asymmetrical low-angle boundary [7,8,9]. In principle, the width of a grain boundary is affected by the difference in orientation between the two crystals it separates. When this difference is low (a smaller number of dislocations and the grain boundaries region is not compact), it leads to relatively wide boundaries with a width that depends on the value of the misorientation. When the difference in orientation is large (a greater number of dislocations and the grain boundaries region is compact), the boundaries are narrow, and the width is hardly affected by changes in the misorientation. To study the properties of a grain boundary in more detail, an experimental model was realized in the bubble raft model using two identical bubbles forming a 2D-crystal. When such arrays are joined together, the boundary between them is regarded as a one-dimensional grain boundary. A limitation of this 2D-model is that only simple tilt boundaries can be studied. Their structures are studied as a function of the difference in orientation between the two rafts [10].
Fukushima and Ookawa et al. [11] created a boundary by applying torsional stress to a single crystal raft, whereupon dislocations formed at the edges and traveled inward to create a boundary. The authors observed boundaries similar to the two types found by Lomer and Nye [10]; the symmetrical dislocation type gives way to the random misfit type at a misorientation of 15°–20°.
A variety of grain boundary studies have been explored [12,13], but these studies provided very different attention from the current work. The studies concerned the modeling of grain boundaries in materials, building on the ground-breaking use of the bubble raft similar to a 2D crystal rather than the present concern with the evolution of the wet foam.
Z. Zhang and X. Zou et al. [14] demonstrated that dislocations and grain boundaries in the 2D metal can advance the material by giving it a qualitatively new physical property, magnetism, while N. Hansen and X. Huang et al. [15] investigated the effect of grain boundaries and grain orientation on structure and properties.
Our 2D foam model contains wet bubbles that connect the surface of a soap solution and a glass cover plate of a few mm above the solution. This cover prevents gas loss from the bubbles to the atmosphere so that the wet foam has an unlimited life span, allowing its growth to be examined over long periods. The bubbles are flattened by buoyancy giving the raft a constant thickness, thus making it a suitable 2D wet foam pattern.
Finally, Z. Huang and M. Su et al. [16] established an approach to manipulate the growth of 2D wet foams with a micropatterned surface. According to their studies, 2D wet foams can grow beyond the so-called Ostwald ripening when huge bubbles override smaller ones.
The current study presents a brief review of the grain boundaries. Details of the experimental methods used to create different types of 2D foam grain boundaries are presented, and their behaviors towards other interfaces in disordered media are compared [17,18,19,20].
2. Experimental Methods
All the information about the 2D foam, such as the area of bubbles, coordination number, etc. were obtained from recorded images of the foam using the actual optical images from the Voronoi diagram. The latter emphasizes the use of a photographic camera by applying an enhanced contrast. The prints are then analyzed manually or using an image processing system.
In the current study, the dislocations were studied in two situations. The first situation comprised the wet foam as contained in the hexagonal cells (hard cell), where the following two types of grain boundaries are formed: the grain boundary loop and the incommensurate grain boundary. The grain boundary loop is surrounded by a latticelike domain misoriented to the regular wet foam occupying the remaining parts of the cell (Figure 1).
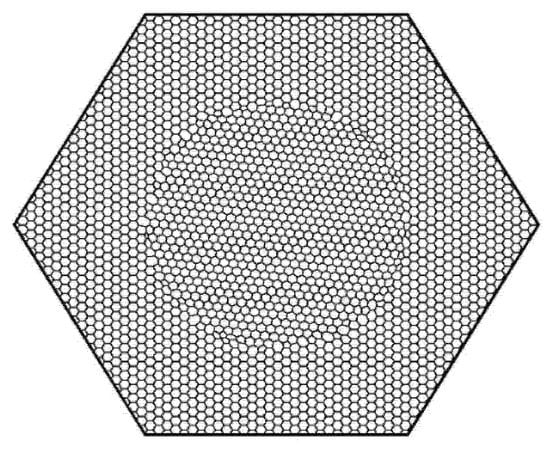
Figure 1.
A photographic picture of a 2D wet foam containing a loop grain boundary.
The incommensurate grain boundary comprised a quasi-linear grain boundary between two areas of ideal wet foam composed of different sized bubbles (Figure 2).
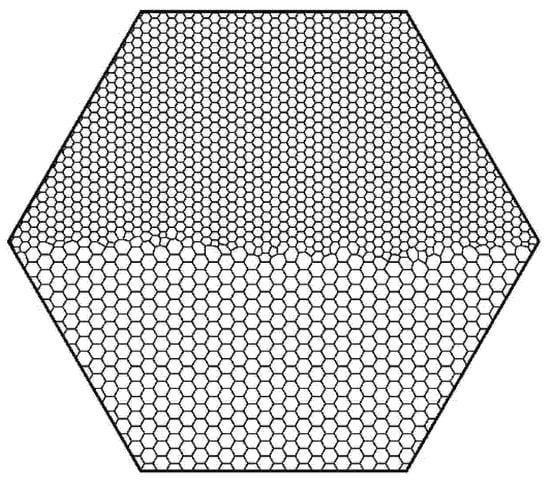
Figure 2.
A picture of a 2D wet foam containing an incommensurate grain boundary.
The second case used a new soft deformable cell (rubber band cell) in which relatively low angle grain boundaries between areas of ideal foam of equal size bubbles were formed, as presented in Figure 3. In the following, the formation of all types of the aforementioned grain boundaries is defined.
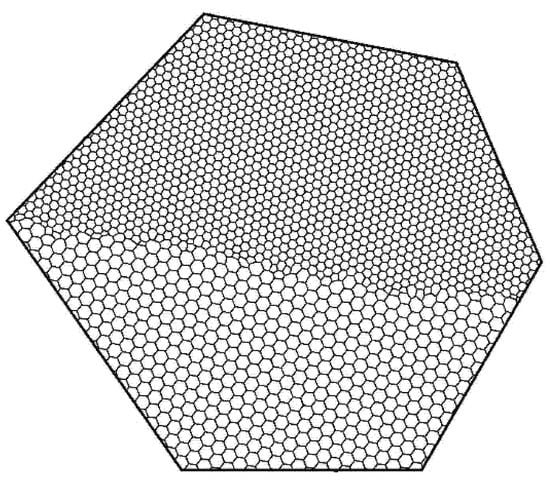
Figure 3.
A picture of a 2D wet foam with low angle grain boundaries.
The proposed method allowed the creation of a large perfect crystal by restricting the 2D foam to a hexagonal shape, which helped to enforce the desired symmetry. The soap solution used in all the experiments was made from water and liquid detergent in the ratio 90:10. The equipment used for preparing the soap solution was washed to prevent impurities, which could destabilize the foam. Fairy liquid detergent was chosen for the stability of the foam formed. The system consisted of a glass tray of dimensions 450 × 350 × 60 mm3 which contained the soap solution. This was set horizontally on a lightbox to provide uniform illumination. A horizontal metal plate (250 × 250 mm2) containing a hexagonal hole of several centimeters on one side was placed in the solution. The metal plate was supported on four legs so that its upper face was 1–3 mm above the surface of the soap solution. The glass tray had a drain hole with a valve for effective control of the level of the solution inside it. The metal plate supported a glass cover of dimensions 200 × 200 mm2.
The 2D foam was formed by bubbling N2 (N2 has low solubility which causes slow coarsening) into the solution below the hexagonal hole via a long hypodermic needle of suitable diameter. The bubbles were attracted to the wall of the cell and to each other by comparatively long-range forces due to surface tension, while at small distances there were strong repulsion forces. Different hypodermic needles were used to collect bubbles of different diameters; in addition, cells with hexagonal holes of different dimensions were used to study the effects of system size. Different types of 2D foam model, such as perfect foams (all bubbles 6-coordinated) and those grain boundaries, required different techniques for their creation.
The hexagonal cell was filled by bubbling N2 through a needle as it was swept in a closed path following the cell walls. The filling continued until the area adjacent to the walls attained a maximum width of 5–7 bubbles. The next step was to generate an isolated ideal foam patch of the same size of bubbles in the center of the hexagonal cell where the patch slowly spreads towards the foam in contact with the wall of the cell. On the other hand, the bubbling N2 was stopped as soon as there was contact between the two areas of the foam. One or two dislocations might appear in an anticipated manner inside the internal or external lattice around the loop of the grain boundary but could conveniently be removed by manipulation. Moreover, it was not possible to form two misoriented areas of ideally 6-fold coordinated bubbles within the hexagonal hard cell. The only grain boundary that could be formed, apart from the loop just described, was that between two different size bubbles.
The overall filling process was completed in two stages. First, the cell was partly-filled with bubbles of the same size. Upon filling half of the hexagonal hole, the needle was replaced by a different gauge. The rest of the cell was then filled with the ideal foam of different bubble sizes. The two areas of the foam were ultimately in contact with each other through a line of dislocations. The number of dislocations in the latter depends on the difference in bubble size, provided little difference gives a small number of dislocations; a very small difference yields a bending line of bubbles instead of a line of dislocations.
Moreover, a modified approach is required to create a grain boundary between two misoriented areas of hexagonal foam of different size bubbles. A cell comprising two parts is required to form an ideal foam, with which each part should be half a hexagon (a quadrilateral with base angles of 120°), and the two parts should be misoriented by a slight angle to each other. Unlike the hexagonal hard cell used in the investigation of the loop and incommensurate grain boundaries, the boundary of this new cell was deformable (made by a rubber band:“soft boundary”), Figure 3. We believe that this “soft boundary” condition explains certain differences in the behavior of the “hard boundary” condition of the previous case, which will be discussed below. The same experimental method described in the case of “incommensurate grain boundaries” was adopted; first, one of the sides of the cell was filled with bubbles, and then a grain boundary between two domains of bubbles of different sizes was created. In the extreme case where the cell was deformable, the same method was used to create a grain boundary between two domains of similar-sized bubbles.
3. Results and Discussion
A series of experimental studies on the evolution of the various types of grain boundaries in an ideal hexagonal wet foam were conducted. Here, the different properties of the grain boundaries such as the evolution, the effect of the nature of the boundary conditions, and the angular misorientation of the domains will be discussed. In addition, the width and roughness of the interface between the two domains for the different types of grain boundaries was explored.
To study the evolution of the boundary, the whole stripe of dislocations forming the grain boundary was considered as a single defect. Then, the previous definition [21] of the cluster as the set of bubbles around the defect with at least one nonhexagonal neighbor, plus the belt of 6-coordinated bubbles denoted as (nc) separating any pair of dislocations along its line was adopted. The disorder around the initial dislocations, which forms the grain boundary, appeared in the early stages of the experiment and increased due to coarsening. The first observable changes occurred around the individual dislocations. This disorder propagated outwards with time. As the grain boundary evolved, a gradient of cell size developed in the spreading direction. Generally, the size of the bubbles increases as the distance to the original boundary decreases, but for this study, due to the wetness of the foam (lack of T1 process), several small bubbles appeared close to the largest bubbles. This result is in agreement with the previously reported simulation results [22] and experiments [23]. Time (t) is an independent variable in the simulations [17,18]. In our experiments, other factors influenced the time evolution of foams containing dislocations. The simulations suggested increased cluster sizes with time [17,18]. This suggests that the number of bubbles in the cluster (nc) can be used as the independent variable, instead of time itself. Although it cannot be stated as a fact that nc depends linearly on t (such as the case for at least certain types of defects in simulations; [17]), it provides a measure of the temporal evolution of the system. The number of bubbles in the cluster (nc) was adopted as an independent variable, similar to the previous definition [21]. A relatively smooth relationship was obtained by plotting the number of bubbles nc as a function of time. The actual rate of growth within every experiment differs for different sizes of hexagonal cells, different numbers of bubbles inside the cluster, and different initial numbers of dislocations.
For both types of incommensurate and loop grain boundaries, the growth rate of the wet foam about the boundaries depends on the original number of dislocations in the cell. It reveals that the higher the number of dislocations, the higher the compactness of the 2D foam and the thinner the liquid films between the bubbles forming the grain boundaries, leading to rapid evolution and the fast disorder. Our data are related to three experiments which have different degrees of compactness.
A Mathematica program was used to construct the Voronoi diagram of the foam allowing the computation of the distribution of the number of sides of bubbles. A foam in 2D can be characterized by the statistical distributions P(n) of the numbers of sides of bubbles. It is easy to measure P(n) with an exact mean of 6 with the assumption of threefold vertices. The function usually has a simple shape with a single peak at n = 6, so the specification of its second moment (μ2) is usually sufficient to describe it for practical purposes.
Figure 4 displays the topological class distribution P(n) of the cluster and its evolution for one experiment, where the foam was compact. As seen, the peak of the distribution remained at n = 6, while the cluster ages P(6) decreased, and the tail of P(n) spread towards larger values of n. The general features of this distribution are similar to those of 2D foam [24,25]. However, they differed from the many 2D cellular network types: specifically, P(6) was always quite high and with a significant population at n = 3. These wet 3-coordinated bubbles were very small and inclined towards the large bubbles. The vanishing of these small bubbles by the T2 process was somewhat inhibited by the slow diffusion of N2 to neighboring bubbles due to the small contact area [19,23].
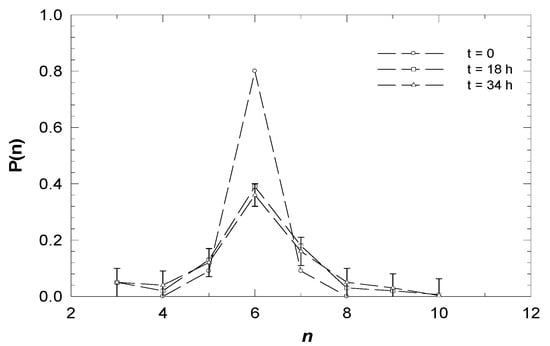
Figure 4.
Topological class distributions as an example of an evolving wet foam containing an incommensurate grain boundary (θ = 0).
Vaz and Fortes [23] claimed that the peaks in μ2 such as those obtained in Figure 5 were due to the interaction of growing clusters of disorder around disjointed dislocations. In fact, for these grain boundaries, the detected peaks arose when the disorder regions growing around the separated dislocations interrupted each other.
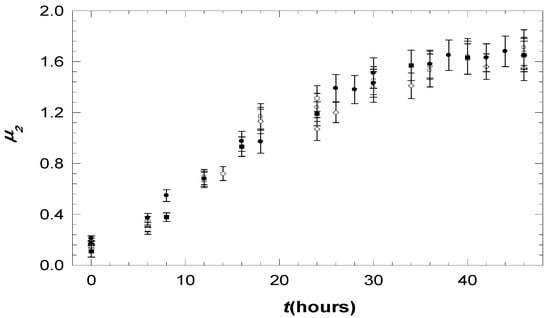
Figure 5.
The variation of µ2 with the time (t) as different wet foams containing different low angle grain boundaries evolve.
The increase in disorder reflected by the widening of P(n) can be characterized through the temporal evolution of μ2, as shown in Figure 5 for the three sets of data. Principally, μ2 increased to high values with t but ultimately decreased due to the disappearance of 3-fold coordinated bubbles. Since the data represent three different experiments, the higher initial number of dislocations was found to represent the higher degree of disorder along the boundary. These observations are in good agreement with the results reported in the case of a single dislocation, in particular, separated dislocations [25]. As μ2 reached a rather small value for the cluster containing a single dislocation, its size increased in the case of pair dislocations. This value reached a maximum when the dislocation pair separated due to the interaction between the two clusters surrounding the original dislocations. In principle, a grain boundary exhibited more than a single pair of specially separated dislocations. Thus, a very high degree of disorder was expected in later times. The latter agrees with the fact that the fewer the original number of dislocations comprising the grain boundary, the larger the area of the 6-sided belt and the slower the growth of the foam.
Referring to the data of grain boundary loops in the usual hexagonal cell, and as mentioned in the experimental methods, the bubbles, in this case, were of the same size. This type of grain boundary behaves exactly like the incommensurate grain boundaries with different sizes of bubbles. As expected, the peak of P(n) remained at n = 6, with its tail extending towards larger values of n at later times (n ˃ 10). Figure 6 shows a smooth monotonic increase in μ2 with nc, similar to the case of incommensurate grain boundaries. However, μ2 eventually declined, which is in agreement with previous simulations [17].
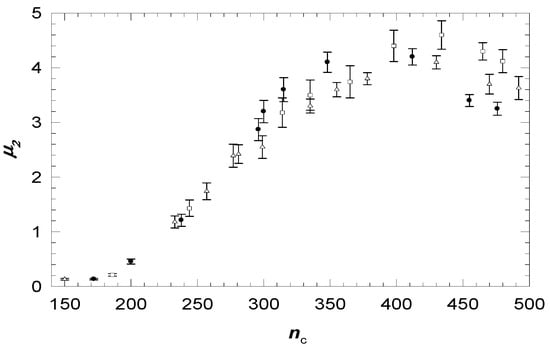
Figure 6.
The variation of µ2 with nc as different wet foams containing grain boundaries evolve.
Typical analysis was followed for different experiments of the grain boundary, which had different sizes of bubbles in each of the soft-sided regular and deformable cell. In general, the degree of the disorder appeared relatively less than that observed in the case of the incommensurate grain boundary in the hard boundary cell. However, the misorientation angles did not affect the behavior of the grain boundary.
The irregularity of the soft cell allowed the creation of a grain boundary separating the two halves of the foams inside the cell, where the size of the bubbles was the same. The behavior of this type differs from that previously mentioned; an increase in time presents no significant change in the bubbles which form the boundary. The delay of bubbles evolving is due to both the soft boundary of the cell and the bubbles, which have the same size.
Furthermore, one could wonder about why the foam in the cell with a hard boundary reached a higher degree of disorder than the soft boundary.
One possibility could be the difference in the grain boundary angle concerning the incommensurate grain boundary in the hard-sided cell when the misorientation is zero (θ = 0), whereas for the grain boundaries studied in the soft-sided cells where (θ = 0) in one experiment and (θ ≠ 0) in the other experiments, the evolution of the foam did not indicate a great difference between both cases. In addition, the variation of μ2 with nc for grain boundary loops in the hard-sided cell was very similar to that for the incommensurate grain boundaries, indicating that θ plays a fairly significant role in the growth of disorder. Thus, we hypothesize that the difference between the cells affects evolution. Considering the latter, two parameters were put forward that could intervene in the difference in the evolution of the foam: the size of the cells and the boundary conditions. For the first parameter, the hard-sided hexagonal cell used in most experiments was 6 cm on a side, whereas the soft-sided cell was 10 cm. The experiments of the hard and soft boundaries were repeated for a 10 cm cell. Since the size of the cell did not affect the evolution of the 2D wet foam, the boundary conditions were regarded as the origin of the difference in the evolution of the foam. In addition, the foams in this study were in a state of attraction together with the tension. However, in the case of a hard boundary cell, the walls exerted a further homogeneous tension. In contrast, in the soft boundary case, the boundary comprised an elastic material that could yield and deform in response to the tension within the foam. The evolution of the bubbles caused strains within the foam, which could be, in the latter case, more easily accommodated within the entire system (foam + cell) by bending the boundaries.
The difference between the two cases indicates the difficulty in forming a model, which could adequately mimic the real physical system. A given subset of bubbles in a real foam of great extent will presumably correspond more closely to our “soft” boundary conditions rather than the “hard” ones used in most of the current work. The latter is attributed to the fact that the surrounding foam can expand or contract in response to changes in the sample subset.
In literature, the topological correlation of 2D random cellular structures revealed that μ2 varies with P(6) in a universal manner [26,27]. This relation is claimed to be the equivalent for random tessellations of the virial equation of state in statistical mechanics [28,29]. While one might expect the virial coefficients to vary from one case to another, depending on the form of P(n), the latter does not seem to be the case in our current study. Data for a very wide range of 2D mosaics collapse on to a universal curve which can be parameterized as expressed by Le Caer and Delannay [26].
μ2P(6)2 = 0.150 ± 0.014
This implies that the various examined P(n) belong to a single universality class [28].
Contrary to a previous study [25], the relationship between P(6) and μ2 was examined, and the data from all experiments for both hard and soft boundaries showed very strong collapse on the same line (Figure 7). When compared with the case of point defects, the data had the same general behavior where values higher than those stated by Lemaitre were obtained [27]. This similarity could be due to the nature of the cluster of the grain boundary, which could reach a high degree of disorder. We conclude that our findings vary greatly from Lemaitre’s law, although slightly closer in multiple dislocations due to the high degree of disorder. Despite all outcomes, it is rather remarkable to notice that while the clusters in this study have their initial conditions, the data still show a reasonable collapse onto a common form. Seemingly, the initial conditions of the clusters have a slightly minor effect.
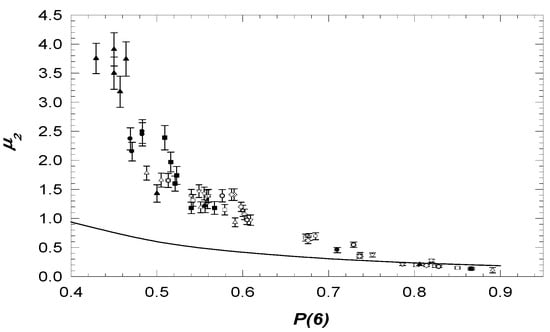
Figure 7.
A plot of µ2 against P(6) for the various grain boundaries. The line represents Equation (1).
As previously mentioned, the studied foams were ordered even in the late stages of the experiments, and the large values of μ2 in the current study resulted from 3-coordinated bubbles, which in the case of froth, disappeared through T2 processes. P(n) was further investigated for the entire foam in the hexagonal cell in its final phases of evolution when the wet foam seemed generally very disordered. In addition, μ2 and P(6) were investigated for some areas of foam in the initially ordered region (outside the clusters), which became generally disordered; the data agree quite well with the trends shown in Figure 8. The values of P(6) and μ2 fit excellently well with Equation (1) and ultimately, with the previously reported results [22].
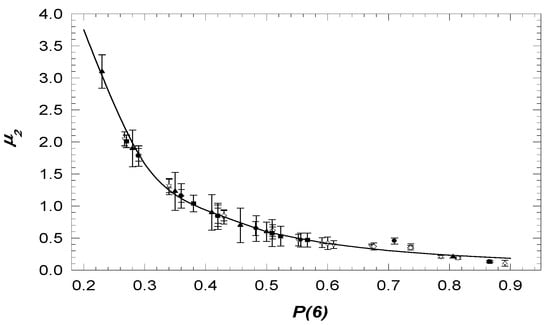
Figure 8.
A plot of µ2 against P(6) for the entire disordered wet foam of the cell. The line represents Equation (1).
It is noteworthy to mention that as the Lemaitre law is valid only for foam in equilibrium, it is not surprising that the clusters in this study do not obey this law.
Many observations in real life could demonstrate interfacial motion in disordered media, which represent interesting examples of the roughening process, i.e., of how interfaces propagate through homogeneous media. For example, when coffee spills on a tablecloth, it spreads to give a certain shape of the patch with a rough surface. In addition, when a sheet of paper is ignited at one end and kept horizontal, it is partially burnt, and the roughness of the interface between the burned and unburned parts will be apparent [29]. Motivated by the latter context, the foam invasion by the grain boundary was considered, and the current approaches to such matters were briefly outlined. With an interface propagating through a medium—for example—the edge of the burnt part of the paper was considered. Thus, the interface was defined as the set of particles that were the “highest” at each position across the system. If the lateral position is to be reduced to a set {i} of discrete points, two functions could be introduced to quantitatively describe the growth:
- The mean height of the surface, ⟨h⟩, which is defined bywhere h(i, t) is the height at lateral position i at time t, and L is the system size indicating the number of positions across the system. If the rate of growth is constant, the mean height increases linearly with time as
- The interface width, which characterizes the roughness of the interface, is defined by the rms fluctuation in the height,
To monitor the roughening process quantitatively, the width of the interface was measured as a function of time. By definition, the growth begins from a line that represents the interface at time zero with zero width. As growth evolves, the interface gradually roughens. A typical plot of the time evolution of the surface width shows two regions identified by growth and saturation, separated by a crossover time tx [29] as follows:
(a) The width grows as a power of time,
Generally, the exponent β is defined as the growth exponent which characterizes the time-dependent dynamics of the roughness process.
(b) The width increase in the power-law crosses to a saturation regime.
Barabasi and Stanley et al. [29] plotted four different curves that correspond to the time evolution of the width obtained by simulating systems with four different system sizes L. As L increases, the saturation width, Wsat, increases accordingly, following a power law,
The exponent is defined as the roughness exponent, which is a second critical exponent that characterizes the roughness of the saturated interface.
The crossover time tx depends on the system size,
where z is defined as the dynamic exponent.
The data presented are from the two interfaces between the disorder about the grain boundary and the areas of the ideal 2D foam. The data reveal that as time increased, the two surfaces of the grain boundary moved outwards. At this stage, the width was redefined as h to describe the position of the hexagonally coordinated bubbles representing the cluster edges. At certain points, and for a few cases, the disorder extended into an order. Within the latter, the width was measured as the maximum separation of two surfaces. The average value of the width, denoted as (⟨h⟩), was calculated from h at the lateral positions of all 6-coordinated bubbles.
Thus, Equation (2) is rewritten as
where ⟨h⟩ is the width at a given position at time t, and L is the number of bubbles defining the surface.
Figure 9 shows the dependence of ⟨h⟩ on time (t) for the hard and the soft boundary cells, respectively. It can be inferred from the Figure that at the early stages (below 40–45 h), ⟨h⟩ increased linearly with t. On the other hand, ⟨h⟩ exhibited an evolution towards a saturation value above 40–45 h. These findings confirm the earlier reported results about the average rate of propagation of the interfaces where h(t) is proportional with t to a certain limit [30,31].
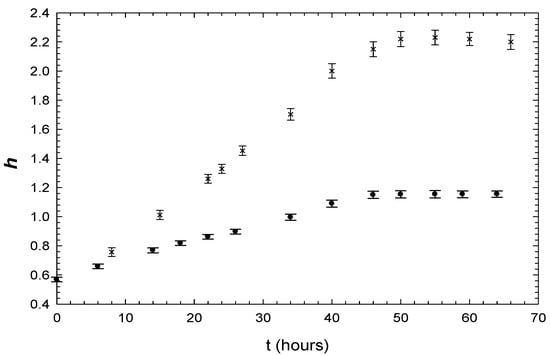
Figure 9.
The variation of the height (h) with time for grain boundary in the hard (×) and soft cell (•), respectively.
The rate of the propagation of the interfaces in the case of the hard boundary cell was found to be larger than that for the soft cell. This reflects the fact that the foam in the hard cell reached a higher degree of disorder than that in the soft cell. Since our media were 2D foam, and as time progresses, the foam became very disordered, and eventually, the two surfaces showed a high degree of roughness, the rms fluctuation in the width within the roughness of the interface defined by Equation (4), could be reconsidered as
In the proposed foam, the interface at time zero was nearly one bubble width, fluctuating somewhat at the i values, where dislocation occurred. As the growth (disordering) occurred, the interface gradually roughened. A typical plot of the time evolution of the surface roughness initially had two regions: (i) the roughness increased as the time increased due to the growth of the grain boundary, as illustrated by Figure 10, and (ii) the bubbles comprised the interfaces adjacent to each other in a roughly straight line, except for those containing the dislocations, which would be off the line. After a short time, these bubbles started to evolve and become closer to each other and the line. This minimized the roughness, but as time progressed, the disorder increased and the data evolved towards a higher value. These general features were independent of the type of the cell, except that for the case of a soft boundary cell, where the initial region extended to later times. The latter difference was related to what was earlier reported; that is, as the disorder increased, the roughness also increased. Since the degree of disorder in the case of soft grain boundaries was too low, the growth of the roughness would also be low. The latter appeared quite significant in the late stages. When time was equal to zero (t = 0), the interface was not exactly a straight line; thus, as the time increased, some bubbles would grow at the expense of other disappearing ones. Accordingly, the bubbles would become closer to each other and the interface would evolve towards linear functionality. Our estimations agree quite well with published results for the observed saturation state by calculating the roughness of the surfaces for different lengths of the boundary [29].
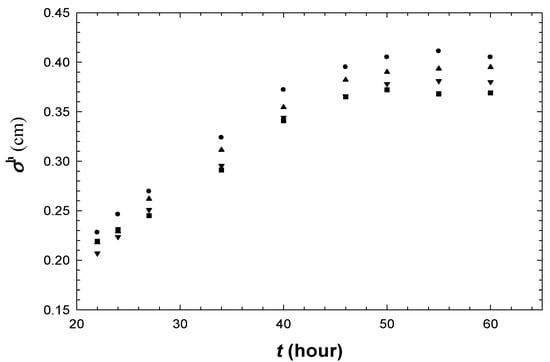
Figure 10.
Variation of the roughness, σh with t for different lengths of the boundary.
4. Conclusions
The evolution of grain boundaries in wet foams was studied. Different hexagonal cells, with regular (hard) and irregular (deformable) shapes, were designed to create models of 2D foam grain boundaries. The exact behavior, which was observed in the case of low angle grain boundaries, and between both a grain boundary loop and incommensurate grain boundary, suggests that the misorientation angle does not affect the evolution of the wet foam. It is believed that the maxima in µ2 observed in Figure 4 and Figure 5 are intrinsic to the evolution of the wet foam. In conclusion, the nature of the boundary of the cell (hard or soft) significantly affects the degree of disorder achieved in the final stages of the experiments. The relationship between P(6) and µ2 is in agreement with the Lemaitre law (Figure 8). Finally, the spread of the interface of the ordered wet foam bordering the grain boundaries and the roughening of the face between the two areas were as projected and the scaling of the roughening hypothesis tested (Figure 9 and Figure 10). This provided a remarkable pattern of a roughening system.
Author Contributions
Data curation, E.A.D.; Formal analysis, A.F.I.A. and A.K.H.I.; Resources, S.H.Z. All authors have read and agreed to the published version of the manuscript.
Funding
This research received no external funding.
Conflicts of Interest
The authors declare no conflict of interest.
References
- Read, W.T.; Shockley, W. Dislocation Models of Crystal Grain Boundaries. Phys. Rev. 1950, 78, 275. [Google Scholar] [CrossRef]
- Burgers, J.M. Mathematical Examples Illustrating Relations Occurring in the Theory of Turbulent Fluid Motion; North-Holland Pub. Co.: Amsterdam, the Netherlands, 1939. [Google Scholar]
- Bragg, W.L. The structure of a cold-worked metal. Proc. Phys. Soc. 1940, 52, 54. [Google Scholar] [CrossRef]
- Steiner, F.; Poelking, C.; Niedzialek, D.; Andrienkob, D.J. Influence of orientation mismatch on charge transport across grain boundaries in tri-isopropylsilylethynyl (TIPS) pentacene thin films. Phys. Chem. Chem. Phys. 2017, 19, 10854–10862. [Google Scholar] [CrossRef] [PubMed]
- Hirvonen, P.Z.; Fan, M.; Ervasti, M.; Harju, A.; Elder, K.R.; Ala-Nissila, T. Energetics and structure of grain boundary triple junctions in grapheme. Energetics and structure of grain boundary triple junctions in grapheme. Sci. Rep. 2017, 7, 4754. [Google Scholar] [CrossRef]
- Janai, E.; Butenko, A.V.; Schofield, B.A.; Sloutskin, E. Periodic buckling and grain boundary slips in a colloidal model of solid friction. Soft Matter 2019, 15, 5227–5233. [Google Scholar] [CrossRef]
- Kim, S.I.; Lee, K.H.; Mun, H.A.; Kim, H.S.; Hwang, S.W.; Roh, J.W.; Yang, D.J.; Shin, W.H.; Li, X.S.; Lee, Y.H.; et al. Dense dislocation arrays embedded in grain boundaries for high-performance bulk thermoelectrics. Science 2015, 348, 109–114. [Google Scholar] [CrossRef]
- Kacher, J.; Eftink, B.P.; Cui, B.; Robertson, I.M. Dislocation interactions with grain boundaries. Curr. Opin. Solid State Mater. Sci. 2014, 18, 227–243. [Google Scholar] [CrossRef]
- Yuanyue, L.; Zou, X.; Yakobson, B.I. Dislocations and Grain Boundaries in Two-Dimensional Boron Nitride. ACS Nano 2012, 6, 7053–7058. [Google Scholar]
- Lomer, W.M.; Nye, J.F. A Dynamical Model of a Crystal Structure. IV. Grain Boundaries. Proc. R. Soc. A 1952, 212, 576. [Google Scholar]
- Fukushima, E.; Ookawa, A.J. Observation of the Grain Boundary in Soap Bubble Raft Part I. Static Feature of the Grain Boundary. Phys. Jpn. 1953, 8, 609. [Google Scholar] [CrossRef]
- Zou, X.; Liu, Y.; Yakobson, B.I. Predicting Dislocations and Grain Boundaries in Two-Dimensional Metal-Disulfides from the First Principles. Nano Lett. 2013, 13, 253–258. [Google Scholar] [CrossRef] [PubMed]
- Azizi, A.; Zou, X.; Ercius, P.; Zhang, Z.; Elías, A.L.; Perea-López, N.; Stone, G.; Terrones, M.; Yakobson, B.I.; Alem, N. Dislocation motion and grain boundary migration in two-dimensional tungsten disulphide. Nat. Commun. 2014, 5, 4867. [Google Scholar] [CrossRef] [PubMed]
- Zhang, Z.; Zou, X.; Crespi, V.H.; Yakobson, B.I. Intrinsic Magnetism of Grain Boundaries in Two-Dimensional Metal Dichalcogenides. ACS Nano 2013, 7, 10475–10481. [Google Scholar] [CrossRef] [PubMed]
- Hansen, N.; Huang, X.; Winther, G. Effect of Grain Boundaries and Grain Orientation on Structure and Properties. Metall. Mater. Trans. A 2011, 42, 613–625. [Google Scholar] [CrossRef]
- Huang, Z.; Su, M.; Yang, Q.; Li, Z.; Chen, S.; Li, Y.; Zhou, X.; Li, F.; Song, Y. A general patterning approach by manipulating the evolution of two-dimensional liquid foams. Nat. Commun. 2017, 8, 14110. [Google Scholar] [CrossRef]
- Jiang, Y.; Mombach, M.; Glazier, J.A. Correlated squeezed-state approach for a dissipative two-state system. Phys. Rev. 1995, 52, 3333. [Google Scholar]
- Ruskin, H.J.; Feng, Y.J. The evolution of a two-dimensional soap froth with a single defect. Phys. Condens. Matter 1995, 7, L553. [Google Scholar] [CrossRef]
- Levitan, B.; Domany, E. Topological simulations of dynamical features in coarsening soap froth. Phys. Rev. 1996, 54, 2766. [Google Scholar] [CrossRef]
- AbdelKader, A. The effect of cell boundary on 2D foam. The effect of cell boundary on 2D foam. MATEC Web Conf. Proc. 2018, 192, 01011. [Google Scholar] [CrossRef][Green Version]
- AbdelKader, A.; Dawi, E.A. Evolution of a Defect in a 2D Wet Foam. Int. J. Recent Technol. Eng. 2019, 7, 6S. [Google Scholar]
- Herdtle, T.; Aref, H.J. Numerical experiments on two-dimensional foam. Fluid Mech. 1992, 241, 233. [Google Scholar] [CrossRef]
- Vas, M.F.; Fortes, M.A. Simulation of defects in bubble clusters. J. Phys. Condens. Matter 1997, 9, 8921. [Google Scholar]
- Weaire, D.; Rivier, N. Soap, cells and statistics—Random patterns in two dimensions. Contemp. Phys. 1984, 25, 59. [Google Scholar] [CrossRef]
- AbdelKader, A.; Earnshaw, J.C. Growth of disorder about point defects in a two-dimensional foam. Phys. Rev. 1998, 58, 760. [Google Scholar]
- Le Caer, G.; Delannay, R.J. Correlations in topological models of 2D random cellular structures. Phys. A 1993, 26, 3931. [Google Scholar] [CrossRef]
- Lemaitre, J.; Gervois, A.; Bideau, D.; Troadec, J.P.; Ammi, M.; Oger, L.; Bideau, D. Arrangement of cells in Voronoi tesselations of monosize packing of discs. Philos. Mag. B 1992, 315, 35. [Google Scholar] [CrossRef]
- Rivier, N. Aboav’s law for an assembly of discs of different sizes. J. Phys. 1 1994, 4, 127. [Google Scholar] [CrossRef]
- Barabasi, A.; Stanley, H. Fractal Concepts in Surface Growth; Cambridge University Press: Cambridge, UK, 1995. [Google Scholar]
- Kwon, T.H.; Hopkins, A.E.; O’Donnell, S.E. Dynamic scaling behavior of a growing self-affine fractal interface in a paper-towel-wetting experiment. Phys. Rev. 1996, 54, 685. [Google Scholar] [CrossRef]
- Gokhale, S.; Nagamanasa, K.H.; Ganapathy, R.; Soodac, A.K. Grain growth and grain boundary dynamics in colloidal polycrystals. Soft Matter 2013, 9, 6634–6644. [Google Scholar] [CrossRef]
© 2020 by the authors. Licensee MDPI, Basel, Switzerland. This article is an open access article distributed under the terms and conditions of the Creative Commons Attribution (CC BY) license (http://creativecommons.org/licenses/by/4.0/).