Abstract
Pale yellow crystals of LnSb2O4Br (Ln = Eu–Tb) were synthesized via high temperature solid-state reactions from antimony sesquioxide, the respective lanthanoid sesquioxides and tribromides. Single-crystal X-ray diffraction studies revealed a layered structure in the monoclinic space group P21/c. In contrast to hitherto reported quaternary lanthanoid(III) halide oxoantimonates(III), in LnSb2O4Br the lanthanoid(III) cations are exclusively coordinated by oxygen atoms in the form of square hemiprisms. These [LnO8]13− polyhedra form layers parallel to (100) by sharing common edges. All antimony(III) cations are coordinated by three oxygen atoms forming ψ1-tetrahedral [SbO3]3− units, which have oxygen atoms in common building up meandering strands along [001] according to (v = vertex-sharing, t = terminal). The bromide anions are located between two layers of these parallel running oxoantimonate(III) strands and have no bonding contacts with the Ln3+ cations. Since Sb3+ is known to be an efficient sensitizer for Ln3+ emission, photoluminescence studies were carried out to characterize the optical properties and assess their suitability as light phosphors. Indeed, for both, GdSb2O4Br and TbSb2O4Br doped with about 1.0–1.5 at-% Eu3+ efficient sensitization of the Eu3+ emission could be detected. For TbSb2O4Br, in addition, a remarkably high energy transfer from Tb3+ to Eu3+ could be detected that leads to a substantially increased Eu3+ emission intensity, rendering it an efficient red light emitting material.
1. Introduction
Lanthanoid compounds containing complex oxoanions are an interesting material class for application as light phosphors because the valence 4f-states of lanthanoids typically give rise to photoluminescence characteristic for the respective lanthanoid. However, direct photoexcitation into 4f-levels is an inefficient way to stimulate photoluminescence, because of the forbidden character of these transitions. For all-inorganic materials this problem can be circumvented through charge-transfer sensitization or by energy transfer (ET) from other metal cations, which are all allowed processes. Both processes are possible in lanthanoid(III) oxopnictogenates(III/V) [1,2,3,4], such as oxoantimonates, which are readily available through high-temperature solid-state reaction of the respective binary starting materials, i.e., the respective lanthanoid(III) and pnictogen(III) sesquioxides (Ln2O3 and Pn2O3). Moreover, the lanthanoid(III) oxoarsenates(III) or -antimonates(III) generally feature a quite high stability in water and air. Varying the host lattice and the lanthanoid(III) dopant in these systems reveals the possibility to fine-tune the selective emission properties in a wide range [2,5,6]. For example, current research on Y[PO4] co-doped with Gd3+ and Sb3+ revealed that antimon(III) cations are appropriate to activate gadolinium(III) emission in the ultraviolet (UV-B) range [7]. This inspired us to synthesize lanthanoid(III) containing oxoantimonates(III) to have materials at hand equipped with intrinsic Sb3+ cations as sensitizer for Ln3+ cations and therefore being suitable as efficient luminescent material class.
The structural diversity of lanthanoid(III) oxopnictogenates(III) is quite large and varies not only with the lanthanoid, but also on the pnictogen (As or Sb). Structural complexity can be enlarged through the incorporation of halide anions. For ternary lanthanoid(III) oxoarsenates(III) the compositions LnAsO3 (Ln = La, Ce) and Ln2As4O9 (Ln = Pr, Nd, Sm) are known [8,9,10,11]. The Ln[AsO3] representatives crystallize either with the α-Pb[SeO3]- or the K[ClO3]-type structure exhibiting coordination numbers of eight or nine for the lathanoid(III) cations and feature isolated ψ1-tetrahedral [AsO3]3– anions without any bridging As–O–As contacts as the dominating structural feature. These anions occur as discrete triangular pyramids with stereochemically active lone pairs at the As3+ cations. In contrast, the oxoarsenates Ln2As4O9 display both [As2O5]4– pyroanions and cyclic [As4O8]4– units as condensation products of ψ1-tetrahedral [AsO3]3– entities according to Ln4[As2O5]2[As4O8]. Up to now, no other further ternary lanthanoid(III) oxoarsenates(III) are known.
The addition of fluxes, such as alkali-metal halides, to the oxide reaction mixtures in order to improve crystallization and reduce the reaction temperature often results in the formation of different halide-anion containing quaternary compounds, enriching the structural diversity. So far, three different compositions for lanthanide oxoarsenates(III) containing trivalent lanthanoids are known, i.e., Ln5 × 3[AsO3]4, Ln3OX[AsO3]2 and Ln3X2[As2O5][AsO3]. Similar to their halide-free congeners, they have in common ψ1-tetrahedral [AsO3]3− anions, and also feature pyroanionic [As2O5]4− groups. In contrast to them, because of the presence of halide anions, mixed oxide-halide coordination polyhedra around the Ln3+ cations occur, providing coordination numbers as high as seven, eight or nine [12,13,14,15,16,17,18].
With antimony as the heavier congener of arsenic, lanthanoid(III) oxoantimonates(III) with three different compositions are known: LnSb5O12 (Ln = La), Ln3Sb5O12 (Ln = Pr, Nd, Sm–Gd and Yb) and LnSbO3 (Ln = Ce). While LaSb5O12 contains both Sb3+ and Sb5+ cations with coordination numbers of three and six, respectively, featuring pyramidal [SbO3]3– as well as octahedral [SbO6]7– anions, Ln3Sb5O12 and CeSbO3 include antimony(III) cations exclusively. In the Ln3Sb5O12 series, coordination numbers of three and four for the Sb3+ cations with oxygen atoms are present in the shape of vertex-connected [SbO3]3– ψ1-tetrahedra and [SbO4]5– ψ1-square pyramids, while the unique central lanthanoid(III) cation is coordinated eightfold by oxygen atoms. In cubic CeSbO3, coordination numbers of 8 for cerium and 6 for antimony are reported with identical interatomic distances (d(Ce‒O) = d(Sb‒O) = 234 pm). However, both crystallographically independent oxygen-atom sites have to be only occupied by about 85% to realize trivalent antimony, so the true crystal structure of CeSbO3 remains puzzling [19,20,21,22,23].
Compared to the oxoarsenates(III), analogous compounds with the heavier congener antimony synthesized under halide-flux conditions seemed to be restricted to the formula type Ln5X3[SbO3]4 (tetragonal, P4/ncc for X = F; monoclinic, P2/c for X = Cl) [24,25]. For the heavier lanthanoids, divergent oxoantimonate(III) halides with the composition LnSb2O4X are encountered, which exhibit completely different structural features in their crystal structures known so far and can be interpreted as derivatives of the rare-earth metal(III) (RE) oxobismuthate(III) halides (REBi2O4X with RE = Y, Pr, Nd and Sm‒Lu for X = Cl‒I) [26,27,28,29]. For lanthanum being the largest rare-earth metal(III) cation, an antimony(III)- and bromide-containing crystal structure with the formula (La0.75Sb0.25)OBr related to LaOBr (PbFCl-type structure, tetragonal, P4/nmm) is also reported, which can be understood as heavily Sb3+-doped LaOBr [25]. Not in this compound, but in all the LnSb2O4X cases, the Ln3+ cations have only contact to oxygen atoms resulting in square [LnO8]13– square prisms. In Ln1+nSb2‒nO4X with Ln = Nd, Sm and X = Cl, Br as the only known members, tetragonal crystal structures (P4/mmm) containing anionic layers of vertex-sharing square pyramidal [SbO4]5– units (square ψ1-pyramids) according to (v = vertex-sharing) are observed. The halide anions have little or no contact to the Ln3+ cations, but settle with far away Sb3+ cations at positions, where four of them encircle their stereochemically active lone pairs. However, no knowledge of further representatives and their crystal structures for the heavier lanthanoid(III) systems Ln‒Sb‒O‒X was available up to now.
In this work, we report on the single-crystal synthesis of the short LnSb2O4Br series (Ln = Eu–Tb) crystallizing in a novel structure type featuring layered polyhedra around the central lanthanoid(III) cations without any contact to the bromide anions. With the crystal structure at hand, photoluminescence measurements of bulk GdSb2O4Br were performed to investigate the luminescence processes caused by Sb3+. With this understanding, the photoluminescence investigations of EuSb2O4Br and TbSb2O4Br as well as doped GdSb2O4Br:Eu3+ and TbSb2O4Br:Eu3+ were undertaken to examine the consequence of incorporating multiple luminescent cations. The article discusses both the relevant excitation and emission spectra and deals with possible energy transfer mechanisms of the involved ions investigated with lifetime measurements to reach an understanding about the major luminescence processes taking place and the special role of Sb3+ cations in the crystal structure as intrinsic sensitizers and possible efficient alternative to the forbidden direct excitation via 4f-4f transitions of the Ln3+ ions.
2. Materials and Methods
2.1. Synthesis of LnSb2O4Br Representatives
The lanthanoid(III) oxoantimonate(III) bromides LnSb2O4Br (Ln = Eu–Tb) were synthesized via solid-state reactions from sesquioxides with anhydrous lanthanide tribromides (Ln2O3: ChemPur, Karlsruhe, Germany, 99.9%) at elevated temperatures. About 1.0 mg (0.0028 mmol) of Eu2O3 was applied for doping and 54 mg (0.154 mmol) for the pure europium compound, gadolinium sesquioxide (Gd2O3: 54 mg, 0.153 mmol) or in case of Ln = Tb a mixture of terbium metal (Tb: ChemPur, Karlsruhe, Germany, 99.9%: 8 mg, 0.050 mmol) and terbium(III,IV) oxide (Tb4O7: ChemPur, Karlsruhe, Germany, 99.9%: 49 mg, 0.066 mmol) for in-situ synproportionation of Tb2O3, lanthanoid(III) tribromide (EuBr3, GdBr3 and TbBr3, Sigma-Aldrich, Taufkirchen, Germany, 99.99%: 61 mg, 0.153 mmol) and antimony sesquioxide (Sb2O3: ChemPur, Karlsruhe, Germany, 99.9%: 134 mg, 0.460 mmol) served as starting materials according to Equation (1). Eutectic mixtures of cesium bromide (CsBr: ChemPur, Karlsruhe, Germany, 99.9%: 530 mg, 2.490 mmol) and sodium bromide (NaBr: Merck, Darmstadt, Germany, suprapur: 127 mg, 1.234 mmol) were used as flux.
The reactions were carried out in evacuated fused silica ampoules (Quarz- und Glasbläserei Müller, Berlin-Adlershof, Germany; inner diameter: 10 mm, wall thickness: 1 mm, length: 60 mm). The starting materials were transferred into the ampoules inside of an argon-filled glove box (Glovebox Systemtechnik, GS Mega E-Line, Malsch, Germany) and sealed under dynamic vacuum. The multi-stage heating program shown in Figure A1 was applied employing a Nabertherm L 9/12 muffle furnace (Nabertherm, Lilienthal, Germany). Generally, cooling rates of 2–3 °C h−1 were chosen. An increase of the rates to 5 °C h−1 upwards resulted in a significant decrease of the obtained crystal size.
After cooling to room temperature, the samples were washed with about 250 mL demineralized water and dried subsequently in a drying oven at 80 °C for at least 6 h. First visual inspection with a stereo microscope of the powder samples revealed a homogeneous, pale yellow powder with square tabular shaped crystals of the target compound. However, using crossed-polarized light indicated the tendency for the formation of aggregated and twinned crystals.
2.2. Single-Crystal and Powder X-ray Diffraction
For single-crystal X-ray diffraction (SCXRD) measurements, crystals of adequate size were isolated under a stereomicroscope and fixed with grease into a glass capillary (outer diameter: 0.1 mm, wall thickness: 0.01 mm). The diffraction experiments were performed on a Stoe StadiVari four-circle diffractometer (Stoe and Cie, Darmstadt, Germany) with Eulerian cradle and Mo-Kα radiation at room temperature. For data collection and integration, Stoe X-Area 1.86 (2018) was used [30]. The crystal structures of EuSb2O4Br and TbSb2O4Br were solved in the space group P21/c through direct methods and subsequently refined using the ShelX-1997 program package [31,32].
Powder X-ray diffraction (PXRD) experiments were performed on a Stoe Stadi-P diffractometer with monochromatic Cu-Kα radiation (λ = 154.06 pm) in transmission geometry and a Stoe linear PSD detector with a range of 5°/2θ. As monochromator, a curved germanium single crystal with (111) as diffractive face was used. About 5 mg of the slightly crushed sample were fixed between two layers of an amorphous adhesion tape.
Since it was not possible to grow single crystals of GdSb2O4Br in sufficient quality for single-crystal X-ray diffraction analysis, a Le Bail profile fit of the powder data for GdSb2O4Br to obtain the lattice constants with the Fullprof suite was performed [33,34,35,36]. EuSb2O4Br was used as the starting model.
2.3. Electron-Beam Microprobe Analysis
Scanning electron images as well as energy- and wavelength-dispersive X-ray spectrometry were performed on a Cameca SX-100 microanalyzer (Cameca, Gennevilliers, France) equipped with one energy-dispersive X-ray spectrometer (EDXS, ThermoScientific UltraDry, Waltham, MA, USA) and five wavelength-dispersive X-ray spectrometers (WDXS). Crystals of sufficient size were placed on a conductive carbon pad (Plano G3357, Wetzlar, Germany) and afterwards coated with a thin carbon layer to prevent surface charging. An acceleration voltage of 20 kV was chosen to improve the intensities of the emission lines of the heavier elements. Quantification of an europium(III)-doped sample of TbSb2O4Br was performed by using Eu[PO4], Tb[PO4], InSb and CsBr for instrument calibration. The oxygen content was calculated using the individual valences of all present ions. As matrix correction, the Pouchou and Pichoir algorithm “PaP” as implemented in the Cameca PeakSight 6.2 package was applied [37,38,39].
2.4. Photoluminescence Investigations
Photoluminescence measurements were carried out at room temperature on a Fluorolog-3 modular spectrofluorometer (Horiba JobinYvon, France), equipped with a double excitation monochromator, a single emission monochromator (HR320), and a R928P PMT detector. A continuous xenon lamp (450 W) was used as the excitation source for steady state measurements. For lifetime acquisition, the time-correlated single photon counting (TCSPC) technique was used, with a xenon microsecond-pulsed lamp for excitation. For both steady state and lifetimes measurements, the samples were measured as powders in front field geometry, by putting the sample holder plane perpendicular to the incoming ray, and collecting the emitted light at 22.5° from the incident light.
3. Results and Discussion
3.1. Crystal-Structure Description
All members of the LnSb2O4Br series (Ln = Eu–Tb) crystallize in the monoclinic space group P21/c with four formula units per unit cell. The lanthanoid(III) cations (Ln3+) occupy only one crystallographically unique position exhibiting a coordination number of eight. Being coordinated exclusively by oxygen atoms, distorted [LnO8]13– anti- or hemiprisms are formed (Figure 1). The observed lanthanoid(III)-oxygen bond lengths fall into the range between 227 and 258 pm, which are similar to those found in the respective sesquioxides (Eu2O3 (Sm2O3- or B-type: 224–262 pm and bixbyite- or C-type: 230–239 pm), Gd2O3 (Sm2O3- or B-type: 215–270 pm and bixbyite- or C-type: 228–239 pm) and Tb2O3 (Sm2O3- or B-type: 218–273 pm and bixbyite- or C-Type: 227–239 pm) [40,41,42,43,44,45]. These [LnO8]13– polyhedra are edge-connected by common oxygen atoms to form infinite layers spreading out parallel to the (100) plane according to the Niggli formula (e = edge-sharing, Figure 2).
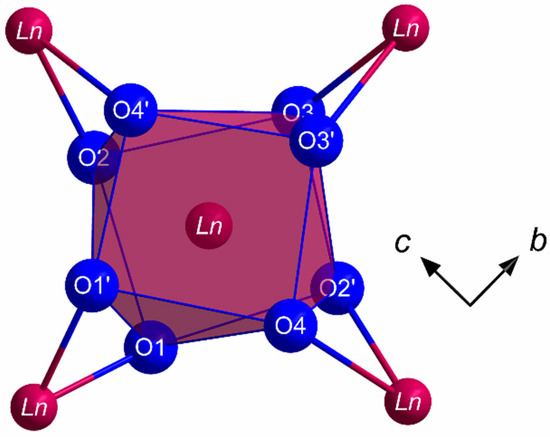
Figure 1.
Coordination sphere of the Ln3+ cations in the crystal structure of the LnSb2O4Br series (Ln = Eu–Tb) built up by eight oxygen atoms in the shape of a square [LnO8]13− hemiprism.
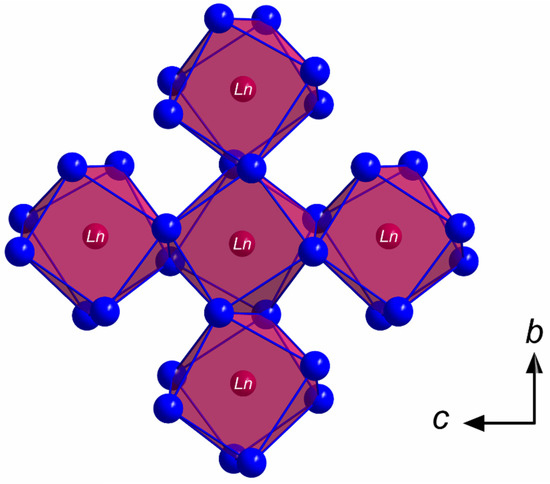
Figure 2.
Infinite layer of the composition in the crystal structure of the LnSb2O4Br series (Ln = Eu–Tb) as viewed along [100] showing edge-connected [LnO8]13− hemiprisms spreading out parallel to the (100) plane.
The Sb3+ cations occupy two different crystallographic positions. Both (Sb1)3+ and (Sb2)3+ are surrounded by three oxygen atoms each in the shape of [SbO3]3– ψ1-tetrahedra (Figure 3). These pyramidal units share common oxygen atoms and build up infinite strands of vertex-connected [SbO3]3– ψ1-tetrahedra with alternating (Sb1)3+ and (Sb2)3+ cations meandering along the c axis (Figure 4) according to (v = vertex-sharing, t = terminal). The different bonding situation is also reflected well by the interatomic Sb3+–O2– distances. While the terminal oxygen atoms reside at distances of about 193 pm to the central Sb3+ cations, the linking ones exhibit noticeable longer values with 205–212 pm. These different values are also illustrated in Figure 4 for the example of TbSb2O4Br and all lone pairs present at the Sb3+ cations are pointing into the same direction along [100].
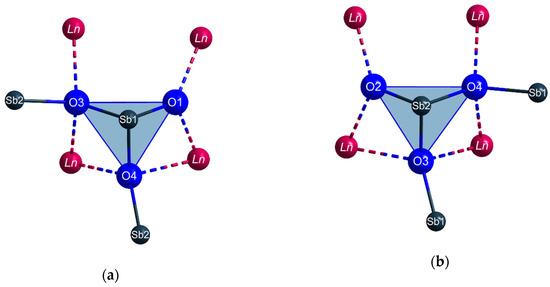
Figure 3.
The first and second coordination spheres of the two crystallographically different Sb3+ cations (a): Sb1, (b): Sb2) in the crystal structure of the LnSb2O4Br series (Ln = Eu–Tb) with vertex-connected [SbO3]3− ψ1-tetrahedra as dominant structural feature.
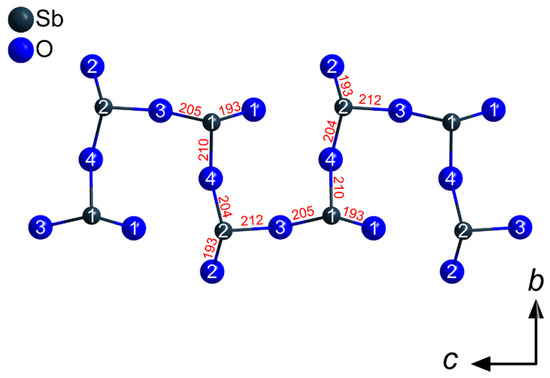
Figure 4.
Network of vertex-connected [SbO3]3− ψ1-tetrahedra in the crystal structure of the LnSb2O4Br series (Ln = Eu–Tb) building up meandering strands of the composition along [001]. The given interatomic Sb–O distances (in pm) are valid for TbSb2O4Br.
In valentinite and senarmontite, the two natural crystalline modifications of Sb2O3, the antimony(III)-oxygen distances feature values of 198–202 pm and therefore fall in between the range of our refined distances for the LnSb2O4Br series with regards to the differences of the linking and the terminal oxygen atoms [46,47]. Consequently, the sharing of an oxygen atom between two antimony(III) cations leads to an expansion of the respective bond length by at least 10 pm.
The influence of the lone electron pair of a pnictogen(III) cation has recently been reported for comparable lanthanoid(III) oxopnictogenates(III), such as the lanthanoid(III) halide oxoarsenates(III) with the compositions Ln5Cl3[AsO3]4 and Ln3X2[As2O5][AsO3] [12,14]. While the title compounds feature one-dimensional infinite strands of corner-connected [SbO3]3– units, the latter only display isolated [AsO3]3− ψ1-tetrahedra or doubles of them in vertex-condensed [As2O5]4− pyroanions. In these condensed units, the bridging oxygen atoms also show the longest distances to the arsenic(III) cations, much like in the monoclinic members of the series LnSb2O4Br, where the bond lengths to the corner-connecting oxygen atoms of the [SbO3]3− groups fall into a longer interval than the short terminal ones.
Comparing the structural features of the short LnSb2O4Br (Ln = Eu–Tb) series with the crystal structure of the long Na2Ln3Cl3[TeO3]4 series (Ln = La–Nd, Sm–Lu) featuring Te4+ as cation isoelectronic to Sb3+ reveals several similarities [48,49,50]. The lanthanoid(III) cations also exhibit an eightfold coordination sphere exclusively by oxygen atoms building up [LnO8]13− hemiprisms and thus no Ln3+‒X− bonds exist. These hemiprisms build up layers of the composition parallel to the (001) plane. Furhtermore, the Te4+ cations are coordinated by three oxygen atoms forming [TeO3]2− anions in the shape of ψ1-tetrahedra, but in this case, without any Te4+–O2−–Te4+ contacts. The halide anions X– are only connected to the sodium cations located in between two layers of [LnO8]13− hemiprisms.
The crystallographically unique bromide anions do not exhibit any bonding contacts to the Ln3+ cations, since the shortest Ln3+···Br– separations amount to 422 pm. The bromide anions are located between planes formed by edge-connected [LnO8]13– polyhedra. The antimony(III) cations connected to these oxygen atoms show distances of 318–320 pm up to 366–367 pm to the neighboring bromide anions (Figure 5). Comparing these values with ternary antimony oxide bromides seems appropriate. In Sb4O5Br2, a well-known ternary antimony(III) oxide bromide, the Sb3+ cations also show only short interatomic distances to the oxygen atoms with a major contribution to chemical bonding (189–251 pm), while the bromide anions are partially even more removed away from the Sb3+ cations with distances of 302–366 pm [51]. Almost the same holds for a second antimony(III) oxide bromide with the composition Sb8O11Br2, where Sb3+–O2– distances of 190–257 pm and Sb3+···Br– distances of 314–396 pm occur [52,53]. Therefore, in both these ternary compounds and LnSb2O4Br (Ln = Eu–Tb), the Sb3+–Br− bond lengths illustrate the tendency of Sb3+ cations to be coordinated by bromide anions with far greater interatomic distances compared to the oxygen atoms.
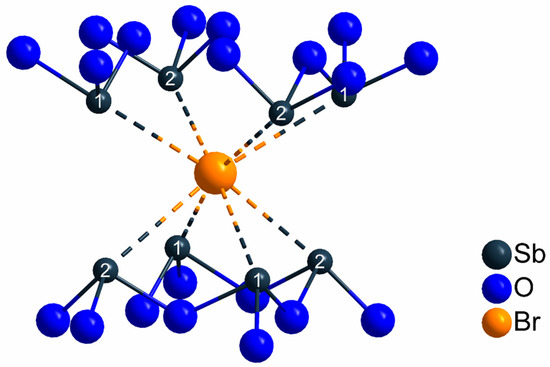
Figure 5.
Coordination sphere of the crystallographically unique bromide anions in the crystal structure of the LnSb2O4Br series (Ln = Eu–Tb) with shortest interatomic distances of d(Sb···Br) = 318–320 pm and no bonding contacts to any Ln3+ cation.
In Figure 6, a section of the crystal structure with indication of the cell edges, coordination polyhedra around the lanthanoid(III) cations and the refined anisotropic displacement ellipsoids is shown. The lattice parameters for all members of the LnSb2O4Br series (Ln = Eu–Tb) are listed in Table 1, while the crystallographic data as well as the positional atomic parameters and selected interatomic distances for EuSb2O4Br and TbSb2O4Br can be found in Table A1, Table A2 and Table A3. In the case of GdSb2O4Br, it was also possible to synthesize very flat, square platelets of crystals with the desired composition, however, the quality of the obtained single crystals revealed to be too poor for a trustworthy structure refinement. Instead, it was possible to refine the unit-cell parameters of GdSb2O4Br both via single-crystal X-ray diffraction as well as powder X-ray diffraction methods (Section 3.2).
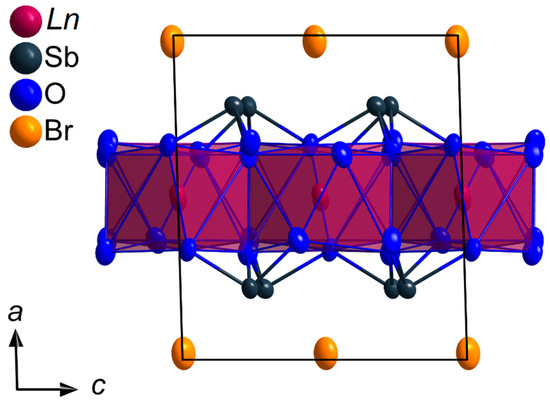
Figure 6.
Section of the crystal structure of the LnSb2O4Br series (Ln = Eu–Tb) viewed along [010] emphasizing the unit-cell edges and [LnO8]13− polyhedra (dark red) utilizing the refined anisotropic displacement parameters with an ellipsoidal probability of 95%.

Table 1.
Lattice parameters for the three members of the LnSb2O4Br series (Ln = Eu–Tb) as determined by means of powder X-ray diffractometry.
3.2. Powder X-ray Diffraction
For phase analyses of the obtained and water-washed product mixtures of all three systems, PXRD measurements were performed. Figure A2 shows the diffractogram of EuSb2O4Br and TbSb2O4Br, respectively. While good accordance among the positions of the simulated and measured reflections is observed, a remarkable variance of the relative reflection intensities occurs. This kind of texture effects can be attributed to the extreme platelet habit of the crystals (Figure 8). Intensive crushing of the powder samples and subsequent diffraction experiments showed an improvement of the relative intensities towards the theoretical values, however, strong reflex broadening was observed. Therefore, the samples were only slightly crushed to avoid these broadenings.
Since it was not possible to yield single crystals of GdSb2O4Br with sufficient quality for a reliable structure determination, the lattice parameters were refined from powder X-ray diffraction methods. For comparison, single crystals of GdSb2O4Br with unit-cell parameters of a = 895.54(6) pm, b = 788.91(5) pm, c = 787.67(5) pm and β = 91.725(3)° were observed. The experimental and simulated pattern as well as the plot of the calculated deviation and the Bragg positions are given in Figure 7. The refined cell parameters for GdSb2O4Br are also given in Table 1 and are in high accordance with the values deriving from the single-crystal measurement as well as with the expected ones due to the lanthanoid contraction.
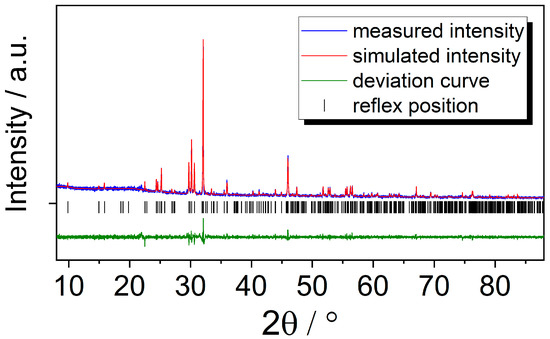
Figure 7.
Le Bail profile matching of GdSb2O4Br showing the measured pattern (blue), the simulated pattern (red), the deviation plot (green), and the reflex positions (black).
3.3. Electron-Probe Microanalysis
To evaluate the crystal morphology of the three LnSb2O4Br representatives with Ln = Eu–Tb, scanning electron images were recorded. In Figure 8, representative micrographs of all three compounds illustrating the size and crystal habit of the synthesized crystals are given. A prominent feature for all three compounds is the formation of platelet-shaped crystals.
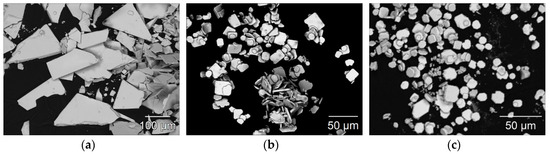
Figure 8.
Scanning electron images of EuSb2O4Br (a), GdSb2O4Br (b), and TbSb2O4Br (c) illustrating the platelet crystal habit with typical edge lengths of 50–150 µm for the europium compound and 10–35 µm for the gadolinium and terbium representatives.
All members of the LnSb2O4Br series (Ln = Eu–Tb) were characterized with energy-dispersive X-ray spectroscopy to verify the purity and validate the absence of unintended elements in the gained crystals. As shown in Figure 9, each compound exhibits the emission lines of the intended elements and no additional ones are present in the examined samples.
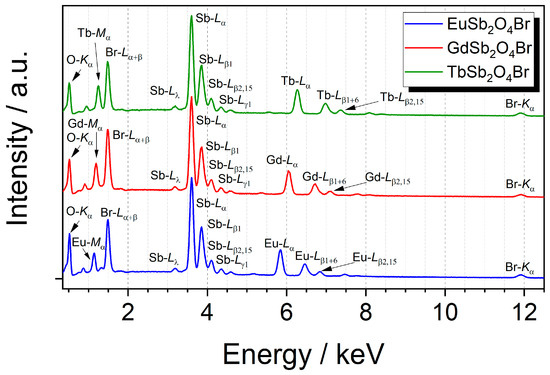
Figure 9.
Energy-dispersive X-ray spectra of the LnSb2O4Br series with Ln = Eu–Gd at an acceleration voltage of 20 kV with assignment of the relevant emission lines.
For an europium(III)-doped sample of TbSb2O4Br as representative of the series, quantitative measurements of the single crystals were performed. This was of special interest, since previous structure studies about the crystal structures in the quaternary system Sm–Sb–O–X (X = Cl and Br) revealed a mixed-Ln3+/Sb3+ occupancy of the Sb3+ position and, therefore, an incoherency with the theoretical formula “SmSb2O4X” [26]. For this new structure type in the quaternary system Ln‒Sb‒O‒Br with similarities regarding structural features and synthesis methods, it seemed appropriate to apply a second method to confirm the determined composition of at least one representative with the formula LnSb2O4Br (Ln = Eu–Tb). Moreover, the method was applied to determine the degree of doping in TbSb2O4Br, since it is not possible to refine the europium(III) content in a terbium(III) host lattice by means of X-ray diffraction methods.
The results of the quantitation using wavelength-dispersive spectrometry are compiled in Table A4. When comparing the experimental values to the expected of TbSb2O4Br doped with 1.5 at-% Eu3+ regarding the total amount of lanthanoid(III) cations, the measurements validate formula TbSb2O4Br:Eu3+ with the desired doping content.
3.4. Photoluminescence Spectroscopy
Antimony(III) compounds are known to show an excitation band in the ultraviolet range (UV) with a maximum around 270 nm corresponding to the partially forbidden 1S0 → 3P1 electronic transition. The Sb3+ emission 3P1 → 1S0 is known to occur over a broad range (from 300 to 650 nm), and often overlaps the excitation range of trivalent lanthanoid cations, such as Eu3+ and Tb3+, rendering it potentially a suitable sensitizer for lanthanoid emission [54,55]. The luminescence of Sb3+ in LnSb2O4Br representatives with Ln = Eu–Tb can be best investigated in GdSb2O4Br as Gd3+ only emits in the UV (typically around 310 nm) due to a transition from the 6P7/2 to 8S7/2 levels. However, even efficient sensitization of Gd3+ has been reported in YPO4:Sb3+, Gd3+ [7]. The excitation spectrum of GdSb2O4Br monitored at 455 nm shows a band with a maximum at 257 nm, which can be assigned to the the partially forbidden 1S0 → 3P1 electronic transition of Sb3+ (Figure 10).
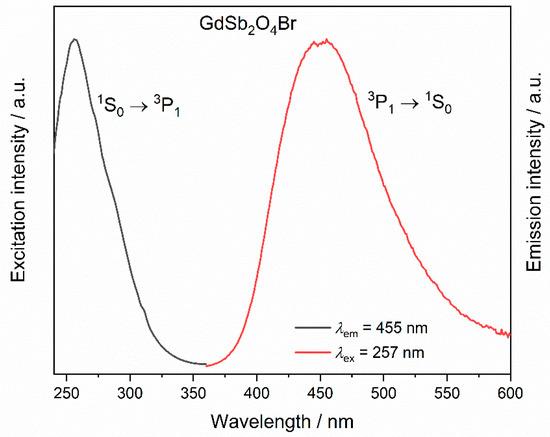
Figure 10.
Excitation (λem = 455 nm) and emission spectra (λex = 257 nm) of GdSb2O4Br.
Upon excitation into 257 nm, a broad band is visible in the emission spectrum in the region between 400 and 500 nm (Figure 10), with a maximum at 455 nm, corresponding to the transition 3P1 → 1S0. This band in the blue region of the electromagnetic spectrum occurs for all the investigated compounds upon excitation in 1S0 → 3P1 (inset in Figure 11, left). For TbSb2O4Br:Eu3+ and GdSb2O4Br:Eu3+ its intensity is negligible compared to the Eu3+ transitions (Figure 11, left) and less intense than Tb3+ transitions in the terbium derivatives (inset in Figure 11, left), suggesting the presence of an energy transfer (ET) from Sb3+ to Ln3+. The different contribution of the Sb3+ emission (blue region) compared to the Eu3+ emission (red region) as well as Tb3+ role, are demonstrated by the chromaticity coordinates calculated for TbSb2O4Br:Eu3+ and GdSb2O4Br:Eu3+ (λex = 257 nm) (Figure 11, right). In order to explain this difference, a deep investigation on the luminescence properties of both TbSb2O4Br:Eu3+ and GdSb2O4Br:Eu3+ was performed.

Figure 11.
Left: emission spectra of TbSb2O4Br:Eu3+ (green line) and GdSb2O4Br:Eu3+ (blue line) at λex = 257 nm. Inset: comparison of emission in the Sb3+ region for all the compounds upon the same excitation. These spectra were normalized for the respective Sb3+ emission maximum of each compound. Right: Commission internationale de l’éclairage (CIE) diagram (CIE 1931) for TbSb2O4Br, TbSb2O4Br:Eu3+, GdSb2O4Br, and GdSb2O4Br:Eu3+ at λex = 257 nm.
Excitation spectra of EuSb2O4Br, GdSb2O4Br:Eu3+, and TbSb2O4Br:Eu3+ are shown in Figure 12. For EuSb2O4Br, when monitoring at 611 nm, the most intense band appears at 464 nm, which belongs to the set of 7F0 → 5D2 hypersensitive dielectric dipole transitions of Eu3+. The other excitation lines correspond to 7F0 → 5L6 at 393 nm, 7F0 → 5D1 and 7F1 → 5D1 at 525 and 534 nm of Eu3+, respectively.
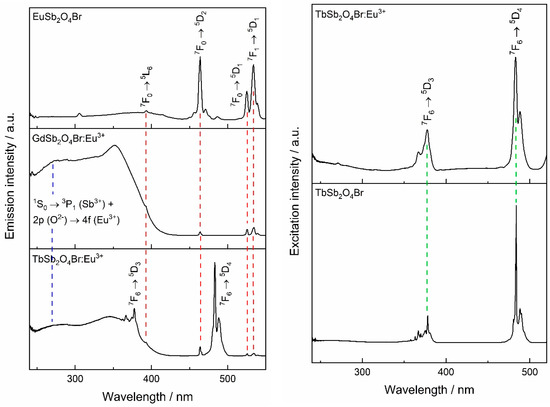
Figure 12.
Left: excitation spectra of Eu3+-containing LnSb2O4Br compounds (Ln = Eu–Tb), monitored at λem = 611 nm. Right: excitation spectra of Tb3+-based compound TbSb2O4Br, monitored at λem = 541 nm.
All the aforementioned transitions can also be observed in the two Eu3+-doped compounds, GdSb2O4Br:Eu3+ and TbSb2O4Br:Eu3+. Moreover, in both the Eu3+-doped compounds, two broad bands can be detected in the UV region. In addition to the band around 250 nm, a second broad band at higher wavelength can be observed, which is attributed to the 2p (O2−) → 4f (Eu3+) charge transfer which frequently is observed in Eu3+ oxide compounds [6,56,57,58]. Due to the eight-fold coordination of the lanthanide cations in GdSb2O4Br:Eu3+ and TbSb2O4Br:Eu3+ and to their similar radii, both compounds are supposed to have charge transfer bands in the region around 260–270 nm, similarly to Gd2Zr2O7:Eu3+ and LaPO4:Eu3+ [57]. Thus in the ultraviolet (UV) region, an overlap between the aforementioned 1S0 → 3P1 transition of Sb3+ and the Eu3+ charge transfer band occurs. For GdSb2O4Br:Eu3+, the charge transfer band is the most intense. Conversely, it is negligible in the neat Eu-compound.
By monitoring the Eu3+ emission at 611 nm in TbSb2O4Br:Eu3+, besides the characteristic interconfigurational f–f transitions of Eu3+, albeit with comparatively weak relative intensity, the bands in the UV region of light belonging to Eu3+–O2− charge transfer and the Sb3+ 1S0 → 3P1 transitions can be seen. In addition, transitions characteristic for Tb3+ are present which points to Tb3+ → Eu3+ sensitization.
Excitation spectra monitored at the Tb3+ emission for TbSb2O4Br as well as TbSb2O4Br:Eu3+ are shown in Figure 12 (right). Both materials show the characteristic bands of Tb3+ which can be assigned to the 7F6 → 5D3 and 7F6 → 5D4 transitions. The presence of Tb3+ peaks in the excitation spectrum of TbSb2O4Br:Eu3+ when detecting the Eu3+ emission indicates the presence of the Tb3+ → Eu3+ energy transfer.
When excited at 283 and 464 nm,, corresponding to 1S0 → 3P1 of Sb3+, charge transfer band, 7F0 → 5L6 and 7F0 → 5D2 of Eu3+, respectively (Figure 13), all Eu3+-containing compounds show emission from the 5D0 level of Eu3+ transitions. The low site symmetry of Eu3+ in the compound series increases the number of observable transitions [6]. The hypersensitive (or electric dipole) band 5D0 → 7F2 with five sublevels, and the magnetic dipole transition 5D0 → 7F1 with all three possible sublevels can be observed.
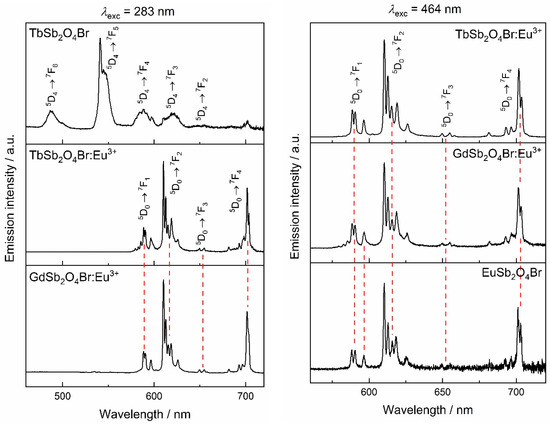
Figure 13.
Left: emission spectra upon excitation at the charge-transfer band of the Ln3+ matrix (λex = 283 nm). Right: emission spectra excited in the characteristic Eu3+ 7F0 → 5D2 transiton (λex = 464 nm).
The dominance of the 5D0 → 7F2 transition in the emission spectra relative to the 5D0 → 7F1 transition is compatible with the location of Eu3+ in a low-symmetry site [59]. The asymmetry ratio, defined as (5D0 → 7F2)/(5D0 → 7F1), is a parameter that indicates the distortion of Eu3+ site with respect to an inversion centre. As expected, the asymmetry ratio is significantly larger than 1 indicating a low-symmetry site, in agreement with a site symmetry of 1 for Ln3+ in LnSb2O4Br [59,60].
Very weak peaks corresponding to emission from higher levels are also visible: at 582 nm, attributable to the forbidden transition 5D1 → 7F0 and at 579 nm, that probably corresponds to the 5D1 → 7F3 transition and others even weaker in the 560–576 nm region [5]. The intensity of the 5D0 → 7F4 transition is higher than the magnetic dipole band, as already found in lanthanoid(III) orthoborates with Cs sites symmetry [61] or in the polyoxometalate Na9[EuW10O36] · 14 H2O with a distorted D4d symmetry [62].
Due to the full Eu3+ concentration, a partial quenching of Eu3+ emission occurs in EuSb2O4Br. This is confirmed not only by the short lifetime of 5D0 → 7F2 detected upon excitation at 464 nm (10.7 μs), but also by the absence of the transitions from levels higher than 5D0. As can be observed in the excitation spectrum (Figure 12, left) by detecting the most intense Eu3+ emission at 611 nm, no excitation transitions are present in the UV region, and for this reason, the sample does not show any emission upon excitation at 257 nm and was not included in the CIE (Commission internationale de l’éclairage) diagram. Nevertheless, upon excitation in the most intense excitation transition at 464 nm, corresponding to the 7F0 → 5D2 transition of Eu3+, EuSb2O4Br shows the characteristic luminescence features of Eu3+. This means that energy migration between ions in the bulk is not completely efficient upon excitation at lower energy.
The emission spectrum of the Tb3+-based materials upon excitation with λex = 378 nm are shown in Figure 14. The spectrum of TbSb2O4Br shows 5D4 → 7F6, 5D4 → 7F5, 5D4 → 7F4, 5D4 → 7F3 transitions, resulting overall in an impression of green light. In the Eu3+-doped compound, TbSb2O4Br:Eu3+, emission from Eu3+ are dominant whilst those for Tb3+ are hardly visible. Together with the presence of Tb3+ excitation bands by monitoring the luminescence of Eu3+, the strong Eu3+ emission at the expense of Tb3+ emission, indicates the presence of notable Tb3+ → Eu3+ energy transfer. Moreover, this can explain the red shift in the CIE diagram with respect to GdSb2O4Br:Eu3+: in TbSb2O4Br:Eu3+, Sb3+ → Eu3+ is mediated by Tb3+, that in turn transfers almost all the excitation light to Eu3+, shifting the final emission towards the red, while in GdSb2O4Br:Eu3+ some Sb3+ contribution is still present, giving a combination of both red and blue contributions.
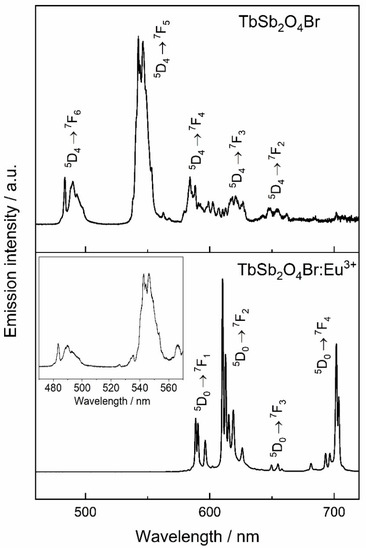
Figure 14.
Tb3+-based materials upon excitation at 378 nm, corresponding to the 7F6 → 5D3 transition of Tb3+. The inset in the bottom part of the figure shows a magnification of Tb3+ emission in the Eu3+-doped compound TbSb2O4Br emphasizing the less intense Tb3+ transitions.
Analysis of the luminescence decays were performed in order to better investigate the interactions (i.e., radiative and non-radiative processes) involved between the emitting cations, such as energy transfer (ET) and concentration quenching.
The Eu3+ emission (611 nm), upon excitation with λex = 257 nm (corresponding to the 1S0 → 3P1 electronic transition of Sb3+) was probed in order to allow for a comparison of the optical properties of GdSb2O4Br:Eu3+ and TbSb2O4Br:Eu3+ (see also the CIE diagram, Figure 11, right).
Upon this excitation, an intensity rise time can be seen for both the decay curves of GdSb2O4Br:Eu3+ and TbSb2O4Br:Eu3+, indicating that Eu3+-emitting levels are fed by energy transfer processes. The corresponding lifetime values were calculated as a weighted average of the two components [63]. As previously discussed, a difference between excitation spectra of the two materials is noticeable when monitoring the Eu3+ emission at 611 nm: In TbSb2O4Br:Eu3+ the main peak occurs at 488 nm, followed by the peak at 378 nm, both belonging to Tb3+, while the bands in the UV region have a minor importance. This demonstrates the major role of Tb3+ in sensitizing the emission of Eu3+, allowing a color more shifted towards the red. By contrast, in GdSb2O4Br:Eu3+, Eu3+ emission can only be sensitized through Sb3+ energy transfer. This is related to the greater role played by the blue component in the final emission, as shown in the different color coordinates in the CIE diagram. (see Figure 11, right).
Moreover, the lifetimes of both doped materials, TbSb2O4Br:Eu3+ and GdSb2O4Br:Eu3+, are dependent on the excitation wavelength, as an example, a comparison between the decays of GdSb2O4Br:Eu3+ upon excitation in the 1S0 → 3P1 electronic transition of Sb3+ at 257 nm vs. excitation in the Eu3+ transition at 7F0 → 5L6 at 393 nm is shown in Figure 15 (right).
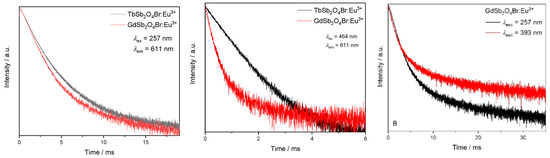
Figure 15.
Lifetime comparison upon excitation at 257 nm between the Eu3+ emission monitored at λem = 611 nm in the different matrices (GdSb2O4Br and TbSb2O4Br, left); upon excitation at 464 nm (middle); and for GdSb2O4Br:Eu3+ upon excitation at λex = 257 nm and λex = 393 nm (right). All the intensity decays are reported on a logarithm (log) intensity scale.
Eu3+ lifetime corresponding to the main emission at 611 nm was also evaluated upon excitation in the most intense band at 464 nm (7F0 → 5D2 of Eu3+). In TbSb2O4Br:Eu3+, a single exponential intensity decay was observed and an excited state lifetime of about 0.8 ms could be calculated. The single exponential behavior reflects the occupation of only one crystallographic site by Eu3+. The observed lifetime is similar to the value observed for Eu3+ in zirconia samples [56], as well as with antimony–germanate–silicate glasses [63]. However, for excitation of GdSb2O4Br:Eu3+ with 464 nm, the decay curve needed to be fitted bi-exponential (Figure 15, middle and fitted components in Table A5), pointing to two different Eu3+ emitting species, either with different environment, potentially Eu3+ in the bulk and Eu3+ as the surface (note that it was not possible to obtain single crystals of GdSb2O4Br of sufficient quality for single crystal X-ray diffraction (SCXRD) analysis).
The efficiency of Tb3+ → Eu3+ was evaluated through lifetime analysis, by using the formula:
where τDA is the lifetime of the donor (Tb3+) in presence of the acceptor (Eu3+), and τD is the lifetime of the donor in the undoped material.
ηET = 1 − τDA τD−1
Thus, the emission decays corresponding to the Tb3+ emission from the 5D4 level were acquired by exciting into the most intense excitation band, namely 483 nm (corresponding to the 7F6 → 5D4 transition), for both TbSb2O4Br and TbSb2O4Br:Eu3+ (Figure 16). The undoped sample shows a double exponential decay. The total lifetime of 0.25 ms can be calculated as a weighted average of the two components as reported by Zmojda et al. [63], while the Eu3+-doped sample shows a value of 12.3 μs, fitted by a single exponential decay. The ηET obtained from these values is around 95%.
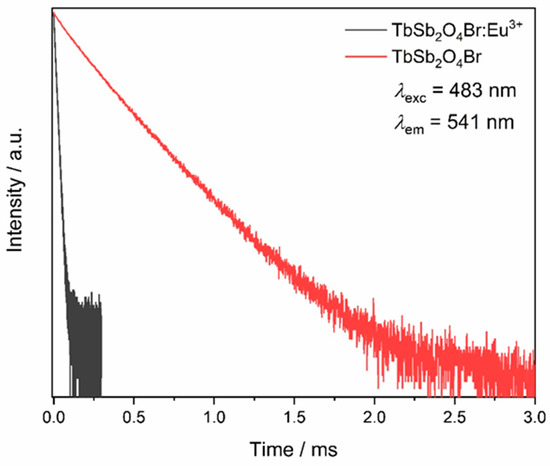
Figure 16.
Lifetimes of terbium based compounds. The Tb3+ emission at λem = 541 nm is monitored upon excitation at λexc = 483 nm for both the Eu3+-doped and the undoped TbSb2O4Br samples.
4. Conclusions
LnSb2O4Br series (Ln = Eu–Tb) presents a new material class of quaternary lanthanoid(III) oxoantimonate(III) halides. With respect to the hitherto reported quaternary samarium(III) oxoantimonate(III) halides, the presented compounds show structural similarities, such as the eightfold oxygen-coordination sphere of the lanthanoid(III) cations, but no mixed-occupied sites for the Ln3+ and Sb3+ cations. Besides La5F3[SbO3]4, the reported compounds can be viewed as a new composition type in the quaternary systems Ln(III)–Sb(III)–O–X without mixed-occupation sites so far. As important structural features, the lanthanoid(III) cations are coordinated exclusively by eight oxygen atoms in the shape of [LnO8]13‒ hemiprisms. As second structural feature worth mentioning, the antimony(III) cations build up meandering strands of vertex-connected [SbO3]3‒ anions and, therefore, show a remarkable difference to the already reported lanthanoid(III) halide oxopnictogenates(III) such as La5F3[SbO3]4 or Ln3X2[As2O5][AsO3], where mostly isolated or vertex-shared [PnO3]3− anions as dimers are present.
Whilst the bulk europium compound, EuSb2O4Br, is not suitable as luminescent material, both GdSb2O4Br and TbSb2O4Br doped with Eu3+ show strong photoluminescence thanks to Sb3+ which is acting as a blue-emitting species and sensitizer for lanthanide. TbSb2O4Br:Eu additionally benefits form strong energy transfer from Tb3+ to Eu3+. Since Sb3+ is emitting in the blue, Tb3+ in the green and Eu3+ in the red white-light emitting materials can be envisioned in this class of compound.
Author Contributions
F.C.G. synthesized the title compounds LnSb2O4Br (Ln = Eu–Tb). F.C.G. and T.S. solved their crystal structures. Funds provided to T.S. funded the chemicals, the materials, the scientific equipment and the infrastructure for synthesis, single-crystal and powder X-ray diffraction measurements as well as electron-probe microanalysis. F.C.G. investigated the LnSb2O4Br series (Ln = Eu–Tb) via electron-beam X-ray microprobe techniques. V.P. performed the photoluminescence measurements with the scientific equipment provided by support to A.-V.M., V.P. and K.V.D. were supported by fellowships provided by the Göran Gustafsson prize in Chemistry, Royal Swedish Academy of Sciences, to A.-V.M., V.P. and A.-V.M. interpreted the the data. F.C.G., V.P., K.V.D. and A.-V.M. wrote the initial paper, A.-V.M. and T.S. reviewed it carefully. All authors have read and agreed to the published version of the manuscript.
Funding
This research was funded by the State of Baden-Württemberg (Stuttgart).
Acknowledgments
The authors would like to thank Falk Lissner for the single-crystal X-ray diffraction measurements. A.-V.M. acknowledges the Royal Swedish Academy of Sciences for support through the Göran Gustafsson prize in Chemistry and Stockholm University.
Conflicts of Interest
The authors declare no conflict of interest.
Appendix A
Table A1.
Crystallographic data of the end-members of the LnSb2O4Br series (Ln = Eu and Tb).
Table A1.
Crystallographic data of the end-members of the LnSb2O4Br series (Ln = Eu and Tb).
| Formula | EuSb2O4Br | TbSb2O4Br |
|---|---|---|
| Crystal system | monoclinic | |
| Space group | P21/c (no. 14) | |
| Lattice constants, a/pm | 895.69(6) | 895.37(6) |
| b/pm | 791.82(5) | 786.14(5) |
| c/pm | 790.38(5) | 785.09(5) |
| β/° | 91.817(3) | 91.638(3) |
| Formula units, Z | 4 | |
| Calculated density, Dx/g∙cm–3 | 6.394 | 6.569 |
| Molar volume, Vm/cm3∙mol–1 | 84, 36 | 83, 17 |
| Diffractometer | StadiVari (STOE, four-circle diffractometer) | |
| Wavelength (λ/pm) | 71.07 (Mo-Kα) | |
| F(000) | 928 | 936 |
| 2θmax/° | 63.58 | 63.72 |
| hkl range (±hmax, ±kmax, ±lmax) | 13, 11, 11 | 12, 11, 11 |
| Observed reflections | 19853 | 12173 |
| Unique reflections | 1840 | 1438 |
| Absorption coefficient, µ/mm–1 | 27.68 | 29.52 |
| Absorption correction | numerical (Stoe X-Shape 2.21) | |
| Rint/Rσ | 0.076/0.041 | 0.078/0.045 |
| R1/R1 with |FO| ≥ 4σ(FO) | 0.055/0.034 | 0.047/0.033 |
| wR2/GooF | 0.082/1.047 | 0.071/1.019 |
| Structure determination and refinement | Program package ShelX-1997 [31,32] | |
| Extinction coefficient, ε/pm–3 | 0.00012(9) | 0.00022(9) |
| Residual electron density, ρ/e– 10–6 pm–3 | +1.91/−1.78 | +2.02/−1.95 |
| CCDC number | CSD-2016635 | CSD-2016636 |
Table A2.
Fractional atomic coordinates and coefficients of the equivalent isotropic displacement parameters of EuSb2O4Br (top) and TbSb2O4Br (bottom). All atoms occupy the general Wyckoff site 4e.
Table A2.
Fractional atomic coordinates and coefficients of the equivalent isotropic displacement parameters of EuSb2O4Br (top) and TbSb2O4Br (bottom). All atoms occupy the general Wyckoff site 4e.
| Atom | x/a | y/b | z/c | Ueq/pm2 |
|---|---|---|---|---|
| Eu | 0.48857(4) | 0.23760(5) | 0.50274(5) | 104(1) |
| Sb1 | 0.78149(6) | 0.05812(7) | 0.75756(7) | 108(1) |
| Sb2 | 0.21659(6) | 0.00677(7) | 0.79543(7) | 103(1) |
| O1 | 0.6332(6) | 0.0021(7) | 0.5856(7) | 147(12) |
| O2 | 0.3642(6) | 0.1758(7) | 0.7481(7) | 123(11) |
| O3 | 0.6656(6) | 0.0086(7) | 0.9703(7) | 112(11) |
| O4 | 0.6686(6) | 0.2105(7) | 0.2594(7) | 107(10) |
| Br | 0.02117(11) | 0.23521(12) | 0.50388(12) | 205(2) |
| Tb | 0.48990(4) | 0.23728(5) | 0.50185(5) | 85(1) |
| Sb1 | 0.78039(6) | 0.05548(7) | 0.75626(7) | 92(2) |
| Sb2 | 0.21888(6) | 0.00810(7) | 0.79380(7) | 90(1) |
| O1 | 0.6321(6) | 0.0028(7) | 0.5804(7) | 128(14) |
| O2 | 0.3675(6) | 0.1777(7) | 0.7465(7) | 111(13) |
| O3 | 0.6617(6) | 0.0069(7) | 0.9696(7) | 100(13) |
| O4 | 0.6686(6) | 0.2102(7) | 0.2597(7) | 118(13) |
| Br | 0.01915(12) | 0.23617(11) | 0.50403(11) | 188(2) |
Table A3.
Selected interatomic distances (d/pm, e.s.d.: ±0.5 pm) for EuSb2O4Br (left) and TbSb2O4Br (right).
Table A3.
Selected interatomic distances (d/pm, e.s.d.: ±0.5 pm) for EuSb2O4Br (left) and TbSb2O4Br (right).
| Contact | EuSb2O4Br | TbSb2O4Br |
|---|---|---|
| Ln–O1 | 228.7 | 226.6 |
| Ln–O1′ | 235.2 | 231.4 |
| Ln–O2 | 231.9 | 228.7 |
| Ln–O2′ | 237.1 | 235.4 |
| Ln–O3 | 256.4 | 253.0 |
| Ln–O3′ | 257.7 | 254.9 |
| Ln–O4 | 255.8 | 252.9 |
| Ln–O4′ | 258.4 | 257.7 |
| Sb1–O1 | 192.2 | 193.3 |
| Sb1–O3 | 204.5 | 204.5 |
| Sb1–O4 | 209.3 | 209.7 |
| Sb2–O2 | 192.6 | 192.7 |
| Sb2–O3 | 210.3 | 212.0 |
| Sb2–O4 | 205.7 | 204.0 |
| Br–Sb1 | 328.8 | 327.9 |
| Br–Sb1‘ | 329.7 | 328.6 |
| Br–Sb1‘‘ | 360.6 | 358.7 |
| Br–Sb1‘‘‘ | 360.8 | 358.8 |
| Br–Sb2 | 318.4 | 318.3 |
| Br–Sb2‘ | 337.5 | 337.0 |
| Br–Sb2‘‘ | 344.8 | 343.9 |
| Br–Sb2‘‘‘ | 367.2 | 366.2 |
Table A4.
Quantitative electron-beam microprobe analysis of TbSb2O4Br doped with 1.5 at-% Eu3+ using wavelength-dispersive spectrometry and the Pouchou and Pichoir (PaP) matrix correction algorithm. The oxygen content was calculated stoichiometrically.
Table A4.
Quantitative electron-beam microprobe analysis of TbSb2O4Br doped with 1.5 at-% Eu3+ using wavelength-dispersive spectrometry and the Pouchou and Pichoir (PaP) matrix correction algorithm. The oxygen content was calculated stoichiometrically.
| Ion | Emission Line | Content (wt-%) | Normalized Content (at-%) | Theoretical Content (at-%) |
|---|---|---|---|---|
| Tb3+ | Lα | 28.0(8) | 12.3(3) | 12.31 |
| Eu3+ | Lα | 0.43(7) | 0.20(3) | 0.19 |
| Sb3+ | Lα | 43.2(7) | 25.0(4) | 25.00 |
| Br− | Kα | 14.4(7) | 12.6(6) | 12.50 |
| O2− | – | 11.6(9) | 49.9(9) | 50.00 |

Figure A1.
Applied multi-stage furnace program for the synthesis of single crystals with the composition LnSb2O4Br (Ln = Eu–Tb).
Figure A1.
Applied multi-stage furnace program for the synthesis of single crystals with the composition LnSb2O4Br (Ln = Eu–Tb).


Figure A2.
Measured (blue) and corresponding simulated (red) powder X-ray pattern of EuSb2O4Br (a) and TbSb2O4Br (b). While a high accordance of the measured and calculated reflection positions is given, texture effects probably due to the crystal habit generate visible differences in the relative intensities.

Table A5.
Components and the average time of the multi-exponential decays reported in the manuscript. For the single-exponential decays, the fitted lifetime is reported as only the average value.
Table A5.
Components and the average time of the multi-exponential decays reported in the manuscript. For the single-exponential decays, the fitted lifetime is reported as only the average value.
| Sample | λex/nm | λem/nm | A1 | τ1/s | A2 | τ2/s | τavg/s |
|---|---|---|---|---|---|---|---|
| TbSb2O4Br:Eu3+ | 257 | 611 | 34.11 | 3.08 × 10⁻³ | 65.89 | 1.09 × 10⁻³ | 2.3 × 10⁻³ |
| 464 | 611 | 0.8 × 10⁻³ | |||||
| 483 | 541 | 12.3 × 10⁻⁶ | |||||
| GdSb2O4Br:Eu3+ | 257 | 611 | 22.88 | 4.12 × 10⁻³ | 77.12 | 1.04 × 10⁻³ | 3.5 × 10⁻³ |
| 464 | 611 | 33.45 | 2.87 × 10⁻³ | 66.55 | 7.74 × 10⁻⁴ | 2.1 × 10⁻³ | |
| 393 | 611 | 64.87 | 9.06 × 10⁻⁴ | 35.13 | 4.65 × 10⁻³ | 3.6 × 10⁻³ | |
| TbSb2O4Br | 483 | 541 | 22.54 | 1.39 × 10⁻⁴ | 74.46 | 2.74 × 10⁻⁴ | 0.25 × 10⁻³ |

Figure A3.
Intensity decay curves as measured (black) and fitted decay curves (red).
Figure A3.
Intensity decay curves as measured (black) and fitted decay curves (red).

References
- Ledderboge, F.; Nowak, J.; Massonne, H.-J.; Förg, K.; Höppe, H.A.; Schleid, T. High-pressure investigations of yttrium(III) oxoarsenate(V): Crystal structure and luminescence properties of Eu3+-doped scheelite-type Y[AsO4] from xenotime-type precursors. J. Solid State Chem. 2018, 263, 65–71. [Google Scholar] [CrossRef]
- Siqueira, K.P.F.; Lima, P.P.; Ferreira, R.A.S.; Carlos, L.D.; Bittar, E.M.; Granado, E.; González, J.C.; Abelenda, A.; Moreira, R.L.; Dias, A. Lanthanide Orthoantimonate Light Emitters: Structural, Vibrational, and Optical Properties. Chem. Mater. 2014, 26, 6351–6360. [Google Scholar] [CrossRef]
- Li, C.; Hou, Z.; Zhang, C.; Yang, P.; Li, G.; Xu, Z.; Fan, Y.; Lin, J. Controlled Synthesis of Ln3+ (Ln = Tb, Eu, Dy) and V5+ Ion-Doped YPO4 Nano-/Microstructures with Tunable Luminescent Colors. Chem. Mater. 2009, 21, 4598–4607. [Google Scholar] [CrossRef]
- Bühler, G.; Feldmann, C. Microwave-assisted synthesis of luminescent LaPO4:Ce,Tb nanocrystals in ionic liquids. Angew. Chem. Int. Ed. 2006, 45, 4864–4867. [Google Scholar] [CrossRef]
- Dieke, G.H. Spectra and Energy Levels of Rare Earth Ions in Crystals; Interscience Publishers—John Wiley & Sons: New York, NY, USA, 1968. [Google Scholar]
- Binnemans, K. Interpretation of europium(III) spectra. Coord. Chem. Rev. 2015, 295, 1–45. [Google Scholar] [CrossRef]
- Deng, T.; Yan, S.; Hu, J. A novel narrow band UV-B emitting phosphor-YPO4:Sb3+,Gd3+. J. Rare Earths 2016, 34, 137–142. [Google Scholar] [CrossRef]
- Ben Hamida, M.; Warns, C.; Wickleder, M.S. Syntheses and Crystal Structures of RE2As4O9 (RE = Nd, Sm): Oxo-Arsenates(III) according to RE4(As2O5)2(As4O8) Exhibiting the Cyclic As4O84– Anion. Z. Naturforsch. 2005, 60b, 1219–1223. [Google Scholar] [CrossRef]
- Kang, D.-H.; Schleid, T. Sm2As4O9: Ein ungewöhnliches Samarium(III)-Oxoarsenat(III) gemäß Sm4[As2O5]2[As4O8]. Z. Anorg. Allg. Chem. 2006, 632, 91–96. [Google Scholar] [CrossRef]
- Metzger, S.J.; Heymann, G.; Huppertz, H.; Schleid, T. La[AsO3]: Lanthanum Oxoarsenate(III) with K[ClO3]-Type Crystal Structure. Z. Anorg. Allg. Chem. 2012, 638, 1119–1122. [Google Scholar] [CrossRef]
- Ledderboge, F.; Metzger, S.J.; Heymann, G.; Huppertz, H.; Schleid, T. Dimorphic cerium(III) oxoarsenate(III) Ce[AsO3]. Solid State Sci. 2014, 37, 164–169. [Google Scholar] [CrossRef]
- Goerigk, F.C.; Schander, S.; Hamida, M.B.; Kang, D.-H.; Ledderboge, F.; Wickleder, M.S.; Schleid, T. Die monoklinen Seltenerdmetall(III)-Chlorid-Oxidoarsenate(III) mit der Zusammensetzung SE5Cl3[AsO3]4 (SE = La – Nd, Sm). Z. Naturforsch. 2019, 74b, 497–506. [Google Scholar] [CrossRef]
- Ben Hamida, M.; Wickleder, M.S. Nd5(AsO3)4Cl3: The First Oxo-Arsenate(III)-Chloride of the Lanthanides. Z. Anorg. Allg. Chem. 2006, 632, 2195–2197. [Google Scholar] [CrossRef]
- Goerigk, F.C.; Schleid, T.; Schander, S.; Wickleder, M. The Triclinic Lanthanoid(III) Halide Oxidoarsenates(III) Sm3Cl2[As2O5][AsO3] and Tm3Br2[As2O5][AsO3]. Z. Anorg. Allg. Chem. 2020, 646, 985–991. [Google Scholar] [CrossRef]
- Kang, D.-H.; Schleid, T. La3OCl[AsO3]2: Ein Lanthan-Oxidchlorid-Oxoarsenat(III) mit “Lone-Pair”-Kanalstruktur. Z. Anorg. Allg. Chem. 2007, 633, 1205–1210. [Google Scholar] [CrossRef]
- Yahia, H.B.; Pöttgen, R.; Rodewald, U.C. Crystal Structure of La3OBr[AsO3]2. Z. Naturforsch. 2010, 65, 1289–1292. [Google Scholar] [CrossRef]
- Yahia, H.B.; Rodewald, U.C.; Pöttgen, R. Non-centrosymmetric Ce3OCl[AsO3]2. Z. Naturforsch. 2009, 64b, 896–900. [Google Scholar] [CrossRef]
- Kang, D.-H.; Schleid, T. Ce5Cl3[AsO3]4: The Second Chloride Oxoarsenate(III) of the Lanthanides, but the First One with Proper Crystallography. Z. Kristallogr. 2007, 25, 98. [Google Scholar]
- Ok, K.M.; Gittens, A.; Zhang, L.; Halasyamani, P.S. Synthesis, structure and characterization of two new antimony oxides – LaSb3O9 and LaSb5O12: Formation of LaSb5O12 from the reaction of LaSb3O9 with Sb2O3. J. Mater. Chem. 2004, 14, 116–120. [Google Scholar] [CrossRef]
- Marcano, C.M.; Rasines, I.; Vegas, A.; Otero-Diaz, L.C. Crystal Growth and Crystal Structure of Gd3Sb5O12: A New Relation between the ccp and the Mn5Si3 and Apatite Structures. Z. Anorg. Allg. Chem. 1987, 555, 176–182. [Google Scholar] [CrossRef]
- Cascales, C.; Marcano, C.M.; Rasines, I.; Fernández, F.; Sáez-Puche, R. Synthesis and characterization of R3Sb5O12 (R = Nd, Sm Gd and Yb). J. Less-Common Met. 1989, 149, 63–66. [Google Scholar] [CrossRef]
- Garcia Casado, P.; Mendiola, A.; Rasines, I. Preparation and crystal data of cerium antimony(III) trioxide. Inorg. Chem. 1982, 21, 2902–2903. [Google Scholar] [CrossRef]
- Fernández, F.; Sáez-Puche, R.; Cascales, C.; Marcano, C.M.; Rasines, I. X-ray diffraction data and magnetic properties of the oxides R3Sb5O12 (R = Pr, Nd, Sm, Eu, Gd, Yb). J. Phys. Chem. Solids 1989, 50, 871–875. [Google Scholar] [CrossRef]
- Gukalova, A.G.; Tsejtlin, M.N. Crystal structure of lanthanum fluoroantimonite La5Sb4O12F3. Kristallografiya 1988, 33, 499–501. [Google Scholar]
- Goerigk, F.C. Synthese und Charakterisierung von Seltenerdmetall-Oxidoarsenaten und -antimonaten, sowie deren Anwendungsbezug. Ph.D. Thesis, University of Stuttgart, Stuttgart, Germany, 2021. in preparation. [Google Scholar]
- Goerigk, F.C.; Schleid, T. Composition and Crystal Structure of SmSb2O4Cl Revisited—And the Analogy of Sm1.5Sb1.5O4Br. Z. Anorg. Allg. Chem. 2019, 645, 1079–1084. [Google Scholar] [CrossRef]
- Schmidt, M.; Oppermann, H.; Hennig, C.; Henn, R.W.; Gmelin, E.; Söger, N.; Binnewies, M. Untersuchungen zu Bismutseltenerdoxidhalogeniden der Zusammensetzung Bi2SEO4X (X = Cl, Br, I). Z. Anorg. Allg. Chem. 2000, 626, 125–135. [Google Scholar] [CrossRef]
- Schmidt, M.; Oppermann, H. Synthese und Kristallstruktur von Bi2ErO4I. Z. Anorg. Allg. Chem. 1999, 625, 544–546. [Google Scholar] [CrossRef]
- Aurivillius, B. Crystal structure of NdBi5O8Cl2. Single crystal investigations on Bi3O4Br and Bi12O17Cl2. Chem. Scr. 1984, 24, 125–129. [Google Scholar]
- Hahn, F. STOE X-AREA. In Software for Single-Crystal X-Ray Diffraction; Stoe & Cie GmbH: Darmstadt, Germany, 2018. [Google Scholar]
- Sheldrick, G.M. Crystal Structure Refinement with SHELXL. Acta Crystallogr. 2015, 71, 3–8. [Google Scholar] [CrossRef]
- Sheldrick, G.M. SHELX-97 Program Package for Single-Crystal Structure Solution and Refinement of X-Ray Diffraction Data; University of Göttingen: Göttingen, Germany, 1997. [Google Scholar]
- Rodriguez-Carvaja, J. Recent advances in magnetic structure determination by neutron powder diffraction. Physica B. 1993, 192, 55–69. [Google Scholar] [CrossRef]
- Rodriguez-Carvajal, J. Fullprof Suite. Crystallographic tools for Rietveld, profile matching & integrated intensity refinements of X-Ray and/or neutron data. Phys. B 1995, 55, 192. [Google Scholar]
- Roisnel, T.; Rodriguez-Carvajal, J. WinPLOTR: A Windows tool for powder diffraction patterns analysis. Mater. Sci. Forum 1999, 378, 118–123. [Google Scholar] [CrossRef]
- Le Bail, A. Whole powder pattern decomposition methods and applications: A retrospection. Powder Diffr. 2005, 20, 316–326. [Google Scholar] [CrossRef]
- Pouchou, J.-L.; Pichoir, F. A new model for quantitative X-ray microanalysis. Rech. Aerosp. 1984, 3, 167–192. [Google Scholar]
- Pouchou, J.-L.; Pichoir, F. Quantitative Analysis of Homogeneous or Stratified Microvolumes Applying the Model “PaP”. In Electron Probe Quantitation; Heinrich, K.F.J., Newbury, D.E., Eds.; Plenum Press: New York, NY, USA, 1991; pp. 31–75. [Google Scholar]
- PeakSight: CAMECA; Société par Actions Simplifiée (SAS): Gennevilliers, France, 2019.
- McCarthy, G.J. Crystal data on C-type terbium sesquioxide (Tb2O3). J. Appl. Crystallogr. 1971, 4, 399–400. [Google Scholar] [CrossRef]
- Hubbert-Paletta, E.; Müller-Buschbaum, H. Röntgenographische Untersuchung an Einkristallen von monoklinem Tb2O3. Z. Anorg. Allg. Chem. 1968, 363, 145–150. [Google Scholar] [CrossRef]
- Kohlmann, H.; Hein, C.; Kautenburger, R.; Hansen, T.C.; Ritter, C.; Doyle, S. Crystal structure of monoclinic samarium and cubic europium sesquioxides and bound coherent neutron scattering lengths of the isotopes 154Sm and 153Eu. Z. Kristallogr. 2016, 231, 517–523. [Google Scholar] [CrossRef]
- Yakel, H.L. A refinement of the crystal structure of monoclinic europium sesquioxide. Acta Crystallogr. 1979, B 35, 564–569. [Google Scholar] [CrossRef]
- Pires, A.M.; Davolos, M.R.; Paiva-Santos, C.O.; Stucchi, E.B.; Flor, J. New X-ray powder diffraction data and Rietveld refinement for Gd2O3 monodispersed fine spherical particles. J. Solid State Chem. 2003, 171, 420–423. [Google Scholar] [CrossRef]
- Atou, T.; Kusaba, K.; Fukuoka, K.; Kikuchi, M.; Syono, Y. Shock-induced phase transition of M2O3 (M = Sc, Y, Sm, Gd, and In-type compounds. J. Solid State Chem. 1990, 89, 378–384. [Google Scholar] [CrossRef]
- Svensson, C. The crystal structure of orthorhombic antimony trioxide, Sb2O3. Acta Crystallogr. 1974, B 30, 458–461. [Google Scholar] [CrossRef]
- Svensson, C. Refinement of the crystal structure of cubic antimony trioxide, Sb2O3. Acta Crystallogr. 1975, B 31, 2016–2018. [Google Scholar] [CrossRef]
- Charkin, D.O.; Zitzer, S.; Greiner, S.; Dorofeev, S.G.; Olenev, A.V.; Berdonosov, P.S.; Schleid, T.; Dolgikh, V.A. Synthesis, Structures, and Luminescent Properties of Sodium Rare-Earth Metal(III) Chloride Oxotellurates(IV), Na2Ln3Cl3[TeO3]4 (Ln = Sm, Eu, Gd, Tb, Dy, and Ho). Z. Anorg. Allg. Chem. 2017, 643, 1654–1660. [Google Scholar] [CrossRef]
- Zitzer, S.; Schleifenbaum, F.; Schleid, T. Na2Y3Cl3[TeO3]4: Synthesis, Crystal Structure and Spectroscopic Properties of the Bulk Material and its Luminescent Eu3+-doped Samples. Z. Naturforsch. 2014, 69b, 150–158. [Google Scholar] [CrossRef]
- Greiner, S.; Zitzer, S.; Strobel, S.; Berdonosov, P.S.; Schleid, T. The complete series of sodium rare-earth metal(III) chloride oxotellurates(IV) Na2RE3Cl3[TeO3]4 (RE = Y, La–Nd, Sm–Lu). Z. Kristallogr. 2020, 235, 341–352. [Google Scholar] [CrossRef]
- Edstrand, M.; Brodersen, R.; Sillén, L.G.; Linnasalmi, A.; Laukkanen, P. On the Crystal Structure of the Antimony Oxychloride Sb4O5Cl2 and Isomorphous Oxybromide. Acta Chem. Scand. 1947, 1, 178–203. [Google Scholar] [CrossRef]
- Mayerová, Z.; Johnsson, M.; Lidin, S. The structure of onoratoite, Sb8O11X2 (X = Cl, Br) revisited. Solid State Sci. 2006, 8, 849–854. [Google Scholar] [CrossRef]
- Lissner, F.; Schleid, T. Sb8O11Br2: Ein sauerstoffreiches Antimon(III)-Oxidbromid. Z. Kristallogr. 2001, 18, 157. [Google Scholar]
- Yu, Q.; Zeng, H.; Liu, Z.; Ren, J.; Chen, G.; Wang, Z.; Sun, L. Novel Sb3+/Eu3+ Co-doped phosphate luminescent glasses with adjustable emission. J. Alloys Compd. 2014, 590, 92–95. [Google Scholar] [CrossRef]
- Zhu, C.; Zhang, X.; Ma, H.; Timlin, C. Sb-, Dy-, and Eu-doped oxyfluoride silicate glasses for light emitting diodes. J. Alloys Compd. 2015, 647, 880–885. [Google Scholar] [CrossRef]
- Hui, Y.; Zhao, Y.; Zhao, S.; Gu, L.; Fan, X.; Zhu, L.; Zou, B.; Wang, Y.; Cao, X. Fluorescence of Eu3+ as a probe of phase transformation of zirconia. J. Alloys Compd. 2013, 573, 177–181. [Google Scholar] [CrossRef]
- Hoefdraad, H.E. The charge-transfer absorption band of Eu3+ in oxides. J. Solid State Chem. 1975, 15, 175–177. [Google Scholar] [CrossRef]
- Dorenbos, P. Journal of Physics: Condensed Matter Systematic behaviour in trivalent lanthanide charge transfer energies. J. Phys. Condens. Matter 2003, 15, 8417–8434. [Google Scholar] [CrossRef]
- Shi, X.; Li, J.-G.; Zhu, Q.; Li, X.; Sun, X. Hydrothermal assisted synthesis and photoluminescence of (Y1−xEux)2WO6 red phosphors. J. Alloys Compd. 2017, 695, 1984–1992. [Google Scholar] [CrossRef]
- Reisfeld, R.; Zigansky, E.; Gaft, M. Europium probe for estimation of site symmetry in glass films, glasses and crystals. Mol. Phys. 2004, 102, 1319–1330. [Google Scholar] [CrossRef]
- Avella, F.J.; Sovers, O.J.; Wiggins, C.S. Rare Earth Cathodoluminescence in InBO3 and Related Orthoborates. J. Electrochem. Soc. 1967, 114, 613. [Google Scholar] [CrossRef]
- Sá Ferreira, R.A.; Nobre, S.S.; Granadeiro, C.M.; Nogueira, H.I.S.; Carlos, L.D.; Malta, O.L. A theoretical interpretation of the abnormal 5D0→7F4 intensity based on the Eu3+ local coordination in the Na9[EuW10O36]·14H2O polyoxometalate. J. Lumin. 2006, 121, 561–567. [Google Scholar] [CrossRef]
- Zmojda, J.; Kochanowicz, M.; Miluski, P.; Baranowska, A.; Pisarski, W.A.; Pisarska, J.; Jadach, R.; Sitarz, M.; Dorosz, D. Optical Characterization of Nano- and Microcrystals of EuPO₄ Created by One-Step Synthesis of Antimony-Germanate-Silicate Glass Modified by P2O5. Materials 2017, 10, 1059. [Google Scholar] [CrossRef]


Publisher’s Note: MDPI stays neutral with regard to jurisdictional claims in published maps and institutional affiliations. |
© 2020 by the authors. Licensee MDPI, Basel, Switzerland. This article is an open access article distributed under the terms and conditions of the Creative Commons Attribution (CC BY) license (http://creativecommons.org/licenses/by/4.0/).