Abstract
Mechanism analysis and kinetic modeling of glycerol conversion into lactic acid in the alkaline media with and without heterogeneous catalyst Cu NPs are reported. The reaction pathways were determined in agreement with the experimental results and comprise several types of reactions, namely dehydrogenation, hydrogenolysis, dehydration and C–C cleavage. Experimental concentration-time profiles were obtained in a slurry batch reactor at different glycerol, NaOH and Cu NPs concentrations in a temperature range of 483–518 K. Power law, Langmuir–Hinshelwood (LH) and Eley–Rideal (ER) models were chosen to fit the experimental data. The proposed reaction pathways and obtained kinetic model adequately describe the experimental data. The reaction over Cu NPs catalyst in the presence of NaOH proceeds with a significantly lower activation barrier (Ea = 81.4 kJ∙mol−1) compared with the only homogeneous catalytic conversion (Ea = 104.0 kJ∙mol−1). The activation energy for glycerol hydrogenolysis into 1,2-propanediol on the catalyst surface without adding hydrogen is estimated of 102.0 kJ∙mol−1. The model parameters obtained in this study would be used to scale an industrial unit in a reactor modeling.
1. Introduction
Nowadays, the use of renewable raw materials to produce various valuable chemicals is actively developing due to the decreasing reserves of petroleum resources and increasing environmental problems. Vegetable oils can be promising, cheapest and available types of renewable sources for chemicals production. A large amount of vegetable oils is currently used for fatty acid methyl esters (FAMEs, biodiesel) production [1]. Glycerol is formed as a by-product with 10% of the total volume of biodiesel. In 2016, according to the international market, the production capacity of biodiesel is estimated to be 37 billion liters; accordingly, 4 billion liters of crude glycerol has been produced [2].
A large number of surplus glycerol processing methods have already been proposed such as hydrogenolysis to 1,2-propanediol [3], dehydration to acrolein [4,5], oxydehydration to acrylic acid [6], chlorination to epichlorohydrin [7], carbonation to glycerol carbonate [8]. One of the most promising chemicals, which can be obtained from glycerol, is lactic acid known as 2-hydroxypropanoic acid. This product is widely used in the food [9], cosmetic and pharmaceutical industries [10]. Lactic acid (LA) has great potential in the production of biodegradable polymers (PLA), whose production is estimated to reach 1 million tons per year by 2020 [11]. Lactic acid is used for starting material in the synthesis of acrylic acid [12], pyruvic acid [13], 1,2-propanediol [14], alkyl lactates [15], lactide [16], and other chemicals [17].
The glycerol conversion into lactic acid has shown promise as a means of obtaining lactic acid from a cost-efficient, renewable source. Previous studies have shown that lactic acid can be produced from glycerol through various catalytic approaches, including hydrothermal conversion [18] and selective oxidation [19]. Kishida et al. [20] found that 90% LA yields could be obtained by the hydrothermal treatment of glycerol at 573 K in the presence of NaOH. The synthesis of LA from glycerol has also been studied in alkaline media in the presence of various water-soluble homogeneous catalytic systems: pincer-type ruthenium complexes [21], thermally robust Ir(I), Ir(III), and Ru(II) N-heterocyclic carbene complexes with sulfonate-functionalized wingtips [22] and others complexes [23,24]. Oxidative conversion of glycerol to LA in an alkaline media in the presence of Pt and Au based catalysts supported on various surfaces proceeds under milder conditions compared to the hydrothermal treatment [25,26]. However, the high cost and shortage of these catalytic systems reduces the prospects for their using on an industrial scale [18].
Recently, great attention is focused on the use Cu-based catalytic systems for this process such as metallic Cu0 [27], CuO/ZrO2 [28], Cu/hydroxyapatite [29,30], etc. due to their high activity, availability, recyclability, low cost, and low toxicity (especially for metallic copper). In the presence of CuO/Al2O3, Cu/SiO2, Cu2O catalysts in an alkaline media, the selectivity for lactic acid was 79.7%, 78.6%, and 78.1% with a conversion of glycerol of 75.2%, 97.8%, and 93.6% (513 K, 6 h), respectively [31].
The present work aims at mechanism analysis and kinetic investigating of hydrothermal conversion of glycerol over heterogeneous catalyst (copper nanoparticles (Cu NPs)) in the presence of NaOH in an autoclave reactor. Kinetic experiments have been performed by varying operating conditions such as temperature, molar ratio NaOH/glycerol, load on the catalyst and various initial glycerol concentrations at different residence time. Based on the obtained experimental results, kinetic model is developed, aiming at a quantified understanding of the catalytic chemistry both for the main and the side products.
2. Results and Discussion
2.1. Reactions Pathway Analysis
Table 1 shows the results obtained in the conversion of glycerol with and without additives.

Table 1.
Conversion of glycerol without catalyst and with addition of NaOH and Cu NPs.
As can be seen from Table 1, the glycerol consumption and lactic acid formation are observed only in the presence of NaOH. An addition of Cu NPs increases significantly the rate of glycerol consumption, and increasing of LA selectivity from 43.4% to 69.1% is observed.
GC-MS analysis of the obtained reaction liquid-phase products (Table 2 and Table 3) showed that LA, 1,2–propanediol (PG), diglycerol (DG), acetic acid (AA) are formed as the main products of glycerol conversion. Carboxylic acids (formic acid, propionic acid, methylpropanoic acid, acrylic acid, and pyruvic acid) are formed in smaller quantities.
Table 2.
The composition of the reaction mixture after the conversion of various substrates in the presence of NaOH.
Table 3.
The composition of the reaction mixture after the conversion of various substrates in the presence of Cu NPs and NaOH.
The resulting acids quantitatively interact with NaOH, so sodium salts are found in the reaction mixture. HPLC-MS analysis revealed (Table 2 and Table 3) the presence of insignificant amounts of resinification products among the liquid-phase products with a molecular weight of 300–900 Da. GC-TCD analysis of the gas phase after the process showed that he main gas product is hydrogen. The amount of carbon-containing components (CO, CO2, CH4) is totally less than 0.05% by volume. The samples were analyzed for total carbon content before and after synthesis, because the resulting carbon dioxide can be absorbed by the sodium hydroxide solution and converted to sodium carbonate. The analysis results showed that the difference in the carbon content in the initial sample and the samples taken during the process was less than 2%, which indicates the extremely low formation of carbonates.
In order to establish detailed reaction network experiments were carried out using detected substances as substrates. Table 2 and Table 3 show the selectivity to products and the conversion of various substrates in the presence of sodium hydroxide and NaOH + Cu NPs.
Based on the obtained results (Table 2 and Table 3), a scheme that includes a set of homogeneous and heterogeneous (surface) transformations was proposed (Figure 1).
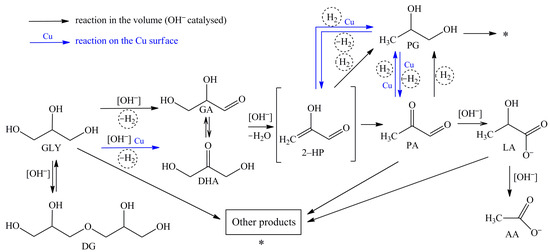
Figure 1.
Proposed reaction pathways of the glycerol conversion into LA in the alkaline media (black arrows indicate homogeneous catalytic conversion; blue arrows show reactions occurring on the surface of Cu NPs).
As can be seen from Table 2 and Table 3, lactic acid is formed as the main product in all cases, except for the use of AA as a substrate. When PG was used as a substrate, the LA formation was observed only using a tandem catalytic system. According to modern ideas about the possible pathway of the process [25,32,33], the reaction of LA formation consists of several consecutive steps. On the first step, glyceraldehyde and dihydroxyacetone, which is tautomeric pair, are formed by the removal of hydrogen from glycerol (Figure 1). At the same time, the equilibrium between glyceraldehyde (GA) and dihydroxyacetone (DHA) depends on the pH of the media. Dihydroxyacetone is completely isomerised into glyceraldehyde at high pH values [34]. On the second step, the dehydration of glyceraldehyde via unstable 2-hydroxypropenal into pyruvaldehyde with its subsequent conversion into lactate by the Benzilic acid rearrangement reaction (the rearrangement reactions of 1,2–diketones with the formation of carboxylate anion) occurs. As a result of these reactions, H2 and H2O are formed in situ in addition to LA.
It should be noted that we have not found intermediate products (GA, DHA, pyruvaldehide (PA)) in all the experiments. This indicates an instantaneous reaction on the route glycerol (GLY)→LA. In addition to that, the authors [35] showed the complete conversion of PA into LA at 323–373 K.
Based on the data presented in Table 2 and Table 3, AA is formed using GLY, DG, PA, and LA as substrates. AA was formed only with the use of the Cu NPs and NaOH catalytic system when PG was used as a substrate. The highest selectivity to AA (86–87%) was obtained at the LA conversion. It should be noted that the AA yield is almost identical in the case of using only NaOH, and using the Cu NPs and NaOH. Thus, it can be argued that AA is formed mainly due to the interaction of LA with hydroxyl ions in the volume.
Using AA as a substrate, its concentration remained unchanged, and the products of its transformation were not found (both when using NaOH, and with addition Cu NPs).
As can be seen from Table 2 and Table 3, the conversion of GLY and DG leads to the formation of PG. Using PA, LA, and AA as substrates, the PG formation was not observed. Hydrogen, which formed in situ from glycerol, reacts with 2-hydroxypropenal and/or pyruvaldehyde. Propylene glycol is generated as a result of hydrogenation –С=С– bonds and carbonyl groups –C=O (reactions 2-HP→PG and PA→PG). At the same time, the use of Cu NPs as a catalyst leads to some increase of the PG selectivity.
The PG conversion in the alkaline media was only 1.4% after 120 min of the reaction in the absence of a Cu catalyst (Table 2). Only gas and resinification products were formed. The PG conversion increased significantly to 26.9% when the process was conducted under the same conditions with the addition of Cu NPs. LA and AA were detected in significant quantities in the reaction mixture. In this case, LA and AA can be formed only due to conversion of 2-HP and PA. Thus, it can be argued that the reactions 2-HP→PG and PA→PG are reversible and occur on the surface of a heterogeneous catalyst.
Diglycerol was also detected by the glycerol conversion products analyzing (Table 2 and Table 3). The glycerol oligomerization with the formation of mixtures of di–, tri–, tetra– and other oligoglycerols is possible in the alkaline media at 470 K [36]. Since oligomerization is the reversible reaction and glycerol is constantly consumed along the target route (GLY→LA), the equilibrium is shifted towards the formation of glycerol. As a result, polyglycerols do not accumulate. The use of Cu NPs as a catalyst leads to a decrease in the yield of DG. The DG selectivity using NaOH and NaOH with Cu NPs is 48.2% and 1.6%, respectively.
In addition to the listed reactions, other side reactions occur. The following products are generated: carbon oxides, methane, acrolein, 2,3-butanediol, formic acid, propionic acid, methylpropanoic acid, acrylic acid, and condensation products (they are labeled «Other products» in Figure 1). The total selectivity to these products does not exceed 4–19% and depends on the reaction conditions.
2.2. Kinetic Modeling
2.2.1. Proposed Kinetic Model
Based on the experimental data, a scheme of glycerol conversion is proposed (Figure 2).
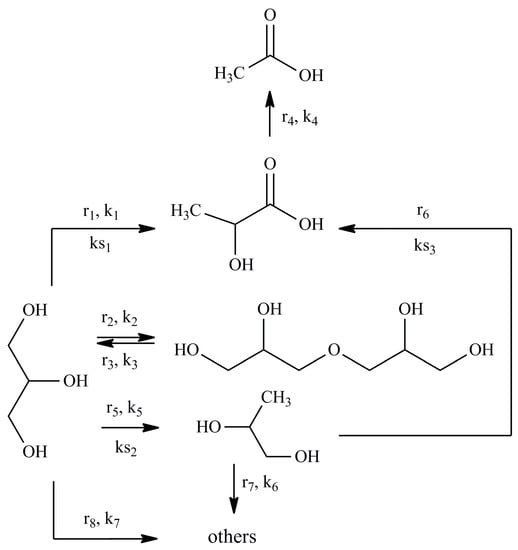
Figure 2.
A simplified scheme of glycerol conversion reaction pathways.
The assumptions underlying the kinetic modeling are given below:
(1) To construct a kinetic model of the reaction occurring in the volume, power law kinetic modeling was used. The reagent concentration exponents are based on the stoichiometry of the corresponding reactions. The LA and NaOH concentration exponents in the equation for the rate of consumption of lactic acid into acetic acid were calculated in the range from 0.1 to 1.5.
(2) The adsorption of hydroxyl ions on the Cu NPs surface is negligible and does not affect on the adsorption of substrates. The hydroxyl ion attacks the adsorbed substrate molecule from the volume in the course of the surface heterogeneous reactions.
(3) For the description of the surface reactions in the presence of Cu NPs catalyst, LH and ER type models were used. These models are commonly used realistic approach to derive the rate expression for heterogeneous reactions. The selection of models was based on the analysis of literature data on the kinetic modeling of the conversion of glycerol into PG [37], LA [38,39] and other carboxylic acids [40] in an alkaline media.
(3.1) To construct a kinetic model of the reaction r1 occurring on the surface of a heterogeneous catalyst, Eley–Rideal type reaction mechanism was used. A glycerol molecule adsorbed on the catalyst surface is attacked by a hydroxyl ion from the reaction volume. The formed product (GA) desorbs from the surface (see Section 2.2.2 for more details about this reaction pathway).
(3.2) For the surface reaction r5, combined Eley–Rideal type and Langmuir–Hinshelwood type reaction mechanism was used. First, a hydroxyl ion attacks of a glycerol molecule on the surface with GA formation. Then, GA reacts with adsorbed hydrogen on the surface with PG formation (see Section 2.2.2 for more details about this reaction pathway).
(3.3) For the surface reaction r6, Langmuir–Hinshelwood type reaction mechanism was used. PG dehydrogenates with PA formation on the catalyst surface, and PA desorbs into the reaction volume (see Section 2.2.2 for more details about this reaction pathway).
(4) The carboxylic acids are present in the system in the form of Na salts (carboxylic acid anion + Na cation) under strongly alkaline conditions. The adsorption of carboxylic anions on the Cu catalyst surface is negligible. Since the formation of LA and AA occurs in the volume, but not on the surface (reactions r1, r4, r6), their presence in the system can be neglected when describing the surface conversions.
(5) As shown previously (see Table 1), the glycerol conversion does not occur in a given temperature range in the absence of sodium hydroxide both in the presence and absence of a copper catalyst. Thus, the NaOH concentration was included in all the kinetic equations.
(6) The adsorption of organic substrates is competitive.
(7) In situ formation of hydrogen occurs as a result of the formation of LA from both glycerol and PG (reactions r1 and r6), and its consumption occurs as a result of the hydrogenolysis of glycerol into PG (r5). It is worth noting that hydrogen is produced much more than it is consumed by the reaction r5, which leads to its excess in the reaction system. The hydrogen desorption rate from the catalyst surface increases and its solubility in the reaction volume decreases due to the high reaction temperature. As a result, the main amount of hydrogen moves to the gas phase (the hydrogen content in the gas phase in all the experiments exceeded 95% vol) (Table S1 in the Supplementary Information). Thus, the hydrogen pseudo equilibrium in the gas-liquid-catalyst surface system is created, i.e. the hydrogen content on the catalyst surface and in the liquid phase is almost unchanged. A similar pattern is observed for a homogeneous process. Thus, the hydrogen concentrations in the kinetic equations were included in the values of the effective reaction rate constants k5, ks2 and ks3.
(8) The reaction mixture volume is constant.
2.2.2. Description of Proposed Model
Based on this mechanistic hypothesis, the reaction rate equations can be written as the sum of the homogeneous and heterogeneous-catalyzed ones, as follows:
1. r1: conversion of glycerol into LA.
This reaction rate is the sum of the homogeneous reaction rate in the volume and the heterogeneous reaction rate on the surface.
Reaction in the volume. The reaction includes the following steps [20]: activation of glycerol molecule by HO− with glycerolate–ion formation, its conversion into GA, further conversion of GA into unstable 2-hydroxypropenal, which is transformed into pyruvaldehide PA. Benzilic acid rearrangement reaction of PA into LA is the final step (Figure 3).

Figure 3.
A schematic conversion of glycerol into lactic acid in the volume.
Reaction on the surface. Eley–Rideal-type reaction mechanism. Under this mechanism, conversion of molecules comprises the following steps: equilibrium adsorption of glycerol molecules on the Cu surface, interaction of adsorbed glycerol molecules with hydroxyl ions which attack from solution, formation of intermediate reaction product (GA), its instantaneous desorption into the reaction volume, where instantaneous LA formation takes place under alkaline conditions according to the scheme:
Step 1. Adsorption of GLY on the surface vacant site (*):
GLY + * ↔ GLY*
Step 2. Activation of adsorbed glycerol molecule by HO− with glycerolate–ion and hydrogen atom formation on the surface:
GLY* + HO− ↔ GLY−* + H*
Step 3. Conversion of glycerolate–ion into GA on the catalyst surface:
GLY−* → GA* + H*
Step 4. Desorption of GA from catalyst surface:
GA* ↔ GA
Step 5. Conversion of GA into PA through intermediate unstable 2-HP:
GA → PA
Step 6. Benzilic acid rearrangement of PA into LA (very fast):
PA + HO− → LA
Figure 4 presents a schematic conversion of glycerol into LA on the catalyst surface.
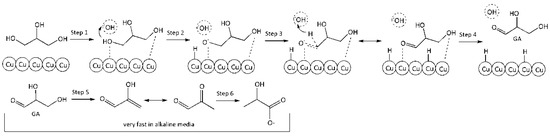
Figure 4.
A schematic conversion of glycerol into lactic acid on the surface.
Thus, the generalized reaction rate equation is:
2. r2: conversion of glycerol into diglycerol (Figure 5).

Figure 5.
A schematic conversion of glycerol into diglycerol in the volume.
The Reaction in the volume. The reaction rate equation is:
3. r3: conversion of diglycerol into glycerol (Figure 5).
Reaction in the volume. The reaction rate equation is:
4. r4: consumption of LA into AA in an alkaline media (Figure 6).
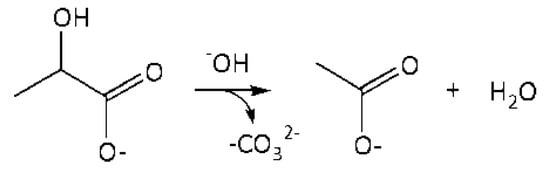
Figure 6.
A schematic conversion of LA into AA in the volume.
Reaction in the volume. The reaction rate equation is:
5. r5: hydrogenolysis of glycerol into PG.
This reaction rate is the sum of the homogeneous reaction rate in the volume and the heterogeneous reaction rate on the surface.
Reaction in the volume. The reaction includes the following steps: activation of glycerol molecule by HO− with glycerolate–ion formation, its conversion into GA, further conversion of GA into unstable 2–HP, which is transformed into PA, hydrogenation of 2–hydroxypropenal (2–HP) and PA with PG formation (Figure 7).
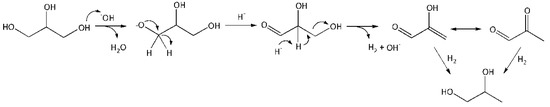
Figure 7.
A schematic conversion of glycerol into PG in the volume.
Reaction on the surface. Combined Eley–Rideal (steps 1–4) and Langmuir–Hinshelwood (steps 5 and 6) mechanism.
Step 1. Adsorption of GLY on the surface vacant site (*):
GLY + * ↔ GLY*
Step 2. Activation of adsorbed glycerol molecule by HO− with glycerolate–ion and hydrogen atom formation on the surface:
GLY* + HO− ↔ GLY−* + H*
Step 3. Conversion of glycerolate–ion into GA on the catalyst surface (very fast):
GLY−* → GA* + H*
Step 4. Elimination of water from GA molecule on the surface with unstable 2-HP formation:
GA* → 2–HP* + H2O
Step 5. Hydrogenation of 2-HP on the surface:
2–HP* → PG*
Step 6. Desorption of PG from the surface into the volume:
PG* → PG
Figure 8 presents a schematic conversion of glycerol into PG on the catalyst surface.
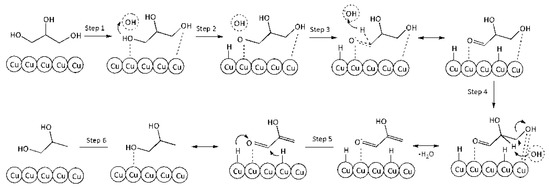
Figure 8.
A schematic conversion of glycerol into PG on the catalyst surface.
Thus, the reaction rate equation of PG formation from glycerol (competitive adsorption of GLY and PG) is:
6. r6: consumption of PG into LA.
Reaction on the surface. Langmuir–Hinshelwood mechanism.
Step 1: Adsorption of PG on the Cu surface vacant site (*):
PG + * ↔ PG*
Step 2: Dehydrogenation of PG into PA on the Cu surface:
PG* ↔ PA* + 2H*
Step 3: Desorption of PA from catalytic surface into reaction volume:
PA* ↔ PA
Step 4: Benzilic acid rearrangement of PA into LA (very fast in alkaline media):
PA + HO− ↔ LA
A schematic representation of this mechanism is given in Figure 9.
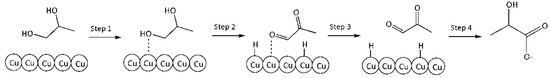
Figure 9.
A schematic conversion of PG into LA on the catalyst surface.
By analogy with the reaction rate equation r5, the final equation (ks3,—effective reaction rate constant of conversion PG into LA) can be written as:
7. r7: consumption of PG into others.
Reaction in the volume. The reaction rate equation is:
8. r8: consumption of glycerol into others.
Reaction in the volume. The reaction rate equation is:
All the reaction rate equations are placed in Table 4 for clarity.
Table 4.
Reaction rate equations for the Model.
The concentration of NaOH was not measured during the experiments, but was determined by the difference between its initial concentration and the concentration of LA and AA. The formation of one mole of LA and AA required one mole of NaOH, respectively. The part of NaOH was consumed to absorb CO2, but this fact was neglected and not considered in the kinetic model. Thus, the concentration of NaOH was calculated by the material balance proposed below:
The formation/consumption equations for each component are presented in Table 5.
Table 5.
Reaction rate equations.
The analysis of the reaction mixture after ~100% glycerol conversion showed that the amount of H2 presented in the system does not contribute to further side reactions.
2.2.3. Criteria for Parameter Estimation
The following criteria were chosen to calculate the constants:
(A) Minimization of the residual sum of squares between the calculated and the experimental concentrations of the reaction mixture components for all experimental data.
(B) All the rate and adsorption constants must be positive; the reaction constants must increase with increasing the temperature, and the adsorption constants must decrease with increasing the temperature.
The residual sum of squares (RSS) between the calculated and experimental data was used to obtain the optimum kinetic parameters:
where n refers to the considered experimental data set.
Mathematical processing and finding of the kinetic constants were performed in the MATLAB software (R2009a, Version 7.8.0.347, The MathWorks, Inc., Natick, MA, USA) using Runge–Kutta method (ode23s subroutine). Therefore, there were 82 parameters to be estimated, namely: 50 kinetic constants (7 constants for homogeneous and 3 constants for surface reactions for five temperature values (483, 493, 503, 513, and 518 K)), 10 adsorption constants of glycerol and PG on catalyst surface bGLY, bPG, 10 activation energies Eaj, 2 adsorption enthalpies, 10 concentration exponents for LA and AA in the reaction rate equation r4 optimized in the range from 0.1 to 1.5. The calculated concentration profiles were then compared with the experimental ones.
2.2.4. Determination of the Constants and Verification of the Model
The kinetic experiments were performed in the temperature range of 483–518 К, the glycerol concentration in solution was 0.27–2.06 mol·L−1, the initial molar ratio NaOH/glycerol was 0.25–3.0, the initial molar ratio glycerol/Cu was 0.26–160.0, the stirring speed was 1000 rpm, the reaction time was 0–480 min, the volume of the reaction mixture was 250 mL in all the experiments.
Evaluation of external and internal mass transfer limitation [41] was performed using the Weisz–Prater and Mears criterions (Sections S2–S4 in the Supplementary Information).
The calculated rate constants, adsorption constants and concentration exponents for LA and AA (m, n) in the reaction rate equation r4 are presented in Table 6.
Table 6.
The calculated reaction rate constants, adsorption constants and concentration exponents for LA and AA.
The Arrhenius equation was used for the temperature dependence of reaction rates:
where k0,i is the pre-exponential factor for the homogeneous reaction, mol min−1; k0,si is the pre-exponential factor for the surface reaction, mol·gcat−1·min−1; Eai and Ea,si is the activation energies for the homogeneous and surface reaction, respectively, J·mol−1; R is the universal gas constant; the gas constant value is 8.314 J·mol−1·K−1; T is the temperature, K.
The van’t Hoff equation was used for the temperature dependence of adsorption constants:
where bj is the adsorption constant of component j on catalyst surface, L·mol−1; bo,j is the constant of integration, L·mol−1; ΔHj is the adsorption enthalpy, J·mol−1; R is the universal gas constant; the gas constant value is 8.314 J·mol−1·K−1; T is the temperature, K.
Figure 10 shows the ten Arrhenius plots used to calculate the activation energies and pre-exponential factors.
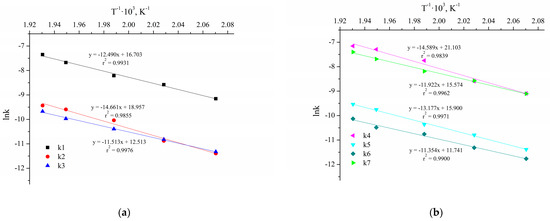
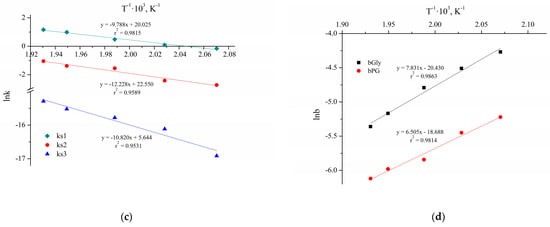
Figure 10.
The Arrhenius plots for the reactions without Cu NPs (a,b) and with Cu NPs and NaOH (c,d).
The results of the parameters calculation of the Arrhenius and van’t Hoff equations are presented in Table 7. The parameters and their confidence intervals are determined at a significance level of 0.05 (95% confidence interval).
Table 7.
The calculated values for the activation energies and pre-exponential factors.
Comparison of the obtained values of activation energies with those described in the literature is shown in Table 8.
Table 8.
Comparison of the obtained values of activation energies with those described in the literature.
Comparison of the calculated and experimental values of the component concentrations in the presence of NaOH without and with Cu NPs is shown in Figure 11. The deviation of the calculated from the experimental values does not exceed 20%. Figure 12 presents the experimental and calculated C/t-profiles of the glycerol conversion without and with Cu NPs catalyst.
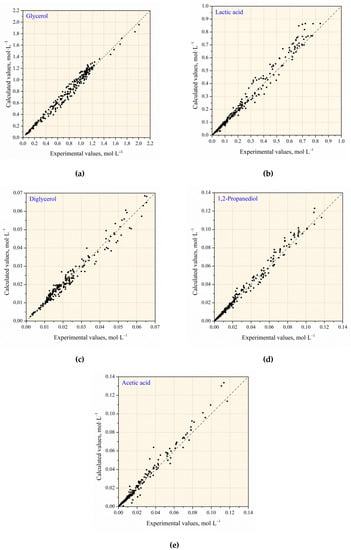
Figure 11.
Comparison of the calculated and experimental values of the components concentration: (a) glycerol; (b) lactic acid; (c) diglycerol; (d) 1,2–propanediol; (e) acetic acid.
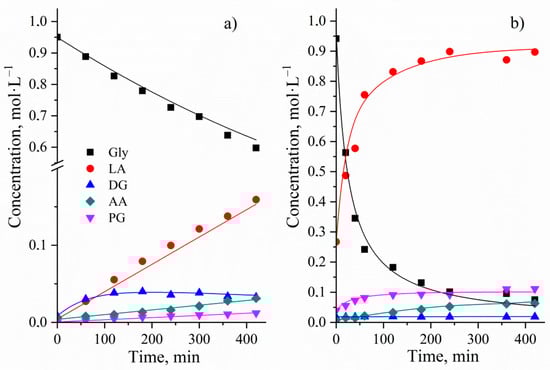
Figure 12.
Experimental and calculated C/t-profile of the glycerol conversion without (a) and with Cu NPs catalyst (b). Reaction conditions: initial concentration of glycerol of 0.95 mol∙L−1, reaction temperature of 513 K, stirring speed of 1000 rpm, NaOH/glycerol molar ratio of 1.1:1 (a) and glycerol/Cu molar ratio of 25.4:1, NaOH/glycerol molar ratio of 1.1:1 (b).
Adequacy of the obtained catalytic conversion of glycerol into LA kinetic model was evaluated using the Fisher criterion (Fc) at a significance level of 0.05 (95% confidence interval). The Fc value must be lower than the Fcrit to consider the proposed model statistically significant.
The variance of optimization which shows the reproducibility of the results was 0.0024. The variance of adequacy which is equal to the sum of squares of deviations between the experimental and calculated values was 0.0009. Thereby, the experimental value of the Fisher’s criterion is equal 0.3864. Since the experimental value of the Fisher’s criterion is less than the critical value (2.5418), the obtained kinetic model adequately describes of the experimental data.
3. Materials and Methods
3.1. Materials
Chemicals such as glycerol (99.9%), LA (85.0%), PG (99.5%), AA (>99.0%), PA (40.0%wt aqueous solution), DHA (99.0%), NaOH (>99.0%) copper sulfate pentahydrate (CuSO4·5H2O, 99.0%), sodium borohydride (NaBH4, 96%) were purchased from Sigma. Diglycerol (CAS No. 627-82-7, 80.0%) was purchased from TCI Europe NV (Zwijndrecht, Belgium). Deionized water was used in all of the experiments. All the chemicals were used as received without further purification.
3.2. Catalyst Preparation
Metallic Cu nanoparticles were prepared with NaBH4 by aqueous reduction method without adding organic modifiers [44]. An aqueous solution of NaOH (0.2 mol∙L−1, 40 mL) was added with stirring to an aqueous solution of CuSO4∙5H2O (Cu2+ concentration was 0.2 mol∙L−1, 60 mL). Then, NaBH4 in water (0.4 mol∙L−1, 100 mL) was added dropwise (50 mL∙min−1) to the resulting solution. The solution was mixed at 313 K to obtain a brown color. The Cu precipitate was separated from the solution by centrifugation (5000 rpm, 10 min), was washed several times with an aqueous ethanol solution, and was dried in vacuum at room temperature to constant weight. The obtained Cu NPs was used as a catalyst for kinetic experiments.
3.3. Catalyst Characterization
The micrographs were obtained on a JEOL JSM–IT300LV (JEOL, Tokyo, Japan) scanning electron microscope. Scanning electron microscope was chosen for the determination of particle size distribution. The average particle size of catalyst was 234 nm. Energy Dispersive X-ray spectrums (EDS) of Cu NPs were obtained on an EDS spectrometer (Oxford Instruments, Abington, UK). Phase-pure metallic Cu nanoparticles were obtained because no peaks were observed associated with possible impurities. XRD patterns were recorded with a Shimadzu XRD–6100 diffractometer (Shimadzu, Kyoto, Japan) using Cu Kα radiation in the 2θ range from 10 to 80 deg with a step size of 0.02 deg. The sample exhibits X-ray diffraction peaks at 43.22, 50.36, 74.04 degrees corresponding to (111), (200), and (220) planes of copper (JCPDS card No. 04–0836). Standard diffraction angle of Cu, 2θ degrees: 43.297, 50.433, 74.130. The surface area of catalyst was determined by using the adsorption desorption method by the standard Brunauer–Emmett–Teller (BET) method using Sorbi MS (META, Novosibirsk, Russia). Sample was preliminarily kept in vacuum at 383 K for 2 hours. The BET surface area value of Cu NPs was determined to be 5.5 m2∙g−1. XRD patterns, SEM images, EDS and particle size distribution of Cu NPs are shown in the Supplementary Information (Figures S1–S3).
3.4. Experimental Procedure and Analysis
The catalytic hydrothermal conversion of glycerol was carried out in a stainless steel autoclave with the capacity 0.35 L equipped with a sampler, thermostatic jacket, and thermocouple. The aqueous glycerol solution (0.25 L) and NaOH together with the catalyst were placed into the reactor, after which the reaction mixture was heated to the required temperature. Intermediate and final substances in various initial concentrations were also introduced into the reactor when the kinetic experiments were conducted. The process was carried out at a stirring speed of 1000 rpm. After heating to the required temperature, the initial sample was taken. Further samples were taken at a predetermined frequency and analyzed by various methods.
The identification of liquid reaction products was performed using gas chromatograph mass spectrometer GC/MS–QP2010 (Shimadzu, Kyoto, Japan) on a ZB–FFAP (Phenomenex, Torrance, CA, USA) and VB–1701 (VICI AG Int., Schenkon, Switzerland) capillary columns and using HPLC/MS Agilent 1200 (mass detector Agilent 6310, Agilent, San Jose, CA, USA) with C18 column (4.6 × 250 mm). The liquid reaction mixture was filtered, and the filtrate was acidified with sulfuric acid (40 wt.%) to a pH value of ~2 and was analyzed using HPLC (RI detector, Waters, Milford, MA, USA) with Rezex ROA-Organic acid column (00H–0138–K0, 300 × 7.8 mm, particle size 5 μm, Phenomenex, Torrance, CA, USA) at 328 K with 0.005 M aqueous sulfuric acid solution (0.5 mL∙min−1) as an eluent. The identification and quantification of the substrate and products (GLY, DG, LA, PG, AA) concentrations were conducted by comparison with standard solutions. The identification of gas reaction products was performed using gas chromatograph (Chromos GC–1000) equipped with thermal conductivity detector using Hayesep N and NaX columns. The absolute calibration method was used as the calculation method.
Total organic carbon analysis was performed using elemental analyzer Elementar Vario EL cube (Elementar Analysensysteme GmbH, Langenselbold, Germany).
The conversion of substrate and the selectivities for various products were calculated based on the following equation: Conversion:
Selectivity to component j:
4. Conclusions
Cu0 nanoparticles and NaOH synergistically increased rate of the glycerol conversion into lactic acid. In this work, a kinetic model of the glycerol conversion into lactic acid in the liquid phase has been developed. Based on the reaction mixture analysis using various substrates, the process scheme has been proposed. This scheme takes into account the direction of formation and consumption of the side products (DG, PG, AA) in addition to the main pathway for the LA formation from glycerol.
The obtained results showed that the proposed combined Power law-Eley–Rideal-Langmuir–Hinshelwood model, which considers the influence of the reaction temperature, the NaOH/GLY ratio and the initial concentrations of GLY and mixtures of GLY/products, predicts effectively the experimental concentrations.
The activation energy of the homogeneous reaction of glycerol into lactic acid was 1.04 × 10⁵ J∙mol−1. The activation energy of the reaction in the presence of Cu NPs with NaOH was 8.14 × 10⁴ J∙mol−1.
Supplementary Materials
The following are available online at https://www.mdpi.com/2073-4344/9/3/231/s1, Figure S1: XRD patterns of Cu NPs catalyst, Figure S2: EDS of Cu NPs catalyst, Figure S3: SEM image and particle size distribution of Cu NPs catalyst, Table S1: Composition of the gas phase in the course of glycerol conversion, Table S2: Effect of stirring speed on glycerol conversion in the presence of NaOH, Table S3: Effect of stirring speed on glycerol conversion in the presence of Cu NPs and NaOH, Table S4: Parameters for calculating the Weisz–Prater criterion, Table S5: Results of repeated experiments with NaOH, Table S6: Results of repeated experiments with Cu NPs catalyst in the base media.
Author Contributions
S.A.Z. and A.L.E. planned and designed the experiments. S.A.Z. and S.Yu.Z. performed the catalyst synthesis and all the experiments. A.S.B. and A.V.V. performed the catalyst characterization. S.A.Z. and A.L.E. wrote the manuscript. A.S.B. revised the manuscript. A.L.E. supervised the project and revised the manuscript. All authors discussed the results and approved the final version of the manuscript.
Funding
The kinetic experiments were funded by RFBR according to the research project No. 18-33-00159. The XRD and SEM analysis were financially supported by The Ministry of Education and Science of the Russian Federation (State assignment No. 10.2326.2017/PP).
Conflicts of Interest
The authors declare no conflict of interest.
Nomenclatures
| Subscripts | |
| GLY | glycerol |
| LA | lactic acid |
| PG | 1,2–propanediol |
| AA | acetic acid |
| PA | pyruvaldehide |
| DG | diglycerol |
| DHA | dihydroxyacetone |
| 2–HP | 2–hydroxypropenal |
| GA | glyceraldehyde |
| Cu NPs | copper nanoparticles |
| Symbols | |
| Cj | the concentration of component j in liquid phase, mol·L−1 |
| Ea | the activation energy, J·mol−1 |
| k0,i | the pre-exponential factor of reaction i, L·mol−1·min−1 |
| ki | the reaction rate constant of homogeneous reaction i, L·mol−1·min−1 |
| ksi | the reaction rate constant of surface reaction i, L·gcat−1·min−1 |
| bj | the adsorption constant of component j on catalyst surface, L·mol−1 |
| ri | the reaction rate of homogeneous reaction i, mol·gcat−1·min−1 |
| rs,i | the reaction rate of surface reaction i, mol·gcat−1·min−1 |
| mcat | the catalyst mass, g |
| R | the universal gas constant, J·K−1·mol−1 |
| Selj | the selectivity of component j, % |
| T | the temperature, K |
| X | the conversion, % |
| RSS | the residuals sum of squares |
References
- Esipovich, A.L.; Rogozhin, A.E.; Belousov, A.S.; Kanakov, E.A.; Danov, S.M. A comparative study of the separation stage of rapeseed oil transesterification products obtained using various catalysts. Fuel Process. Technol. 2018, 173, 153–164. [Google Scholar] [CrossRef]
- Yin, H.; Yin, H.; Wang, A.; Shen, L. Catalytic conversion of glycerol to lactic acid over graphite-supported nickel nanoparticles and reaction kinetics. J. Ind. Eng. Chem. 2018, 57, 226–235. [Google Scholar] [CrossRef]
- Manuale, D.L.; Santiago, L.V.; Torres, G.C.; Sepúlveda, J.H.; Torresi, P.A.; Vera, C.R.; Yori, J.C. Hydrogenolysis of glycerol to 1,2-propanediol in a continuous flow trickle bed reactor. J. Chem. Technol. Biotechnol. 2018, 93, 1050–1064. [Google Scholar] [CrossRef]
- Danov, S.M.; Esipovich, A.L.; Belousov, A.S.; Rogozhin, A.E. Gas-phase dehydration of glycerol over commercial Pt/γ-Al2O3 catalysts. Chin. J. Chem. Eng. 2015, 23, 1138–1146. [Google Scholar] [CrossRef]
- Danov, S.M.; Esipovich, A.L.; Belousov, A.S.; Rogozhin, A.E. Deactivation of acid catalysts in vapor-phase dehydration of glycerol into acrolein. Russ. J. Appl. Chem. 2014, 87, 461–467. [Google Scholar] [CrossRef]
- Deleplanque, J.; Dubois, J.-L.; Devaux, J.-F.; Ueda, W. Production of acrolein and acrylic acid through dehydration and oxydehydration of glycerol with mixed oxide catalysts. Catal. Today 2010, 157, 351–358. [Google Scholar] [CrossRef]
- Santacesaria, E.; Tesser, R.; Di Serio, M.; Casale, L.; Verde, D. New process for producing epichlorohydrin via glycerol chlorination. Ind. Eng. Chem. Res. 2010, 49, 964–970. [Google Scholar] [CrossRef]
- Vieville, C.; Yoo, J.W.; Pelet, S.; Mouloungui, Z. Synthesis of glycerol carbonate by direct carbonatation of glycerol in supercritical CO2 in the presence of zeolites and ion exchange resins. Catal. Lett. 1998, 56, 245–247. [Google Scholar] [CrossRef]
- Choi, S.H.; Chin, K.B. Evaluation of sodium lactate as a replacement for conventional chemical preservatives in comminuted sausages inoculated with Listeria monocytogenes. Meat Sci. 2003, 65, 531–537. [Google Scholar] [CrossRef]
- Kornhauser, A.; Coelho, S.; Hearing, V. Applications of hydroxy acids: classification, mechanisms, and photoactivity. Clin. Cosmet. Invest. Dermatol. 2010, 3, 135–142. [Google Scholar] [CrossRef] [PubMed]
- Morales, M.; Dapsens, P.Y.; Giovinazzo, I.; Witte, J.; Mondell, I.C.; Papadokonstantakis, S.; Hungerbuhler, K.; Perez-Ramirez, J. Environmental and economic assessment of lactic acid production from glycerol using cascade bio- and chemocatalysis. Energy Environ. Sci. 2015, 8, 558–567. [Google Scholar] [CrossRef]
- Sun, P.; Yu, D.; Tang, Z.; Li, H.; Huang, H. NaY zeolites catalyze dehydration of lactic acid to acrylic acid: studies on the effects of anions in potassium salts. Ind. Eng. Chem. Res. 2010, 49, 9082–9087. [Google Scholar] [CrossRef]
- Ai, M.; Ohdan, K. Oxidative dehydrogenation of lactic acid to pyruvic acid over iron phosphate catalyst. Appl. Catal. A 1997, 150, 13–20. [Google Scholar] [CrossRef]
- Zhang, Z.; Jackson, J.E.; Miller, D.J. Aqueous-phase hydrogenation of lactic acid to propylene glycol. Appl. Catal. A 2001, 219, 89–98. [Google Scholar] [CrossRef]
- Delgado, P.; Sanz, M.T.; Beltrán, S.; Núñez, L.A. Ethyl lactate production via esterification of lactic acid with ethanol combined with pervaporation. Chem. Eng. J. 2010, 165, 693–700. [Google Scholar] [CrossRef]
- Van Wouwe, P.; Dusselier, M.; Vanleeuw, E.; Sels, B. Lactide synthesis and chirality control for polylactic acid production. ChemSusChem 2016, 9, 907–921. [Google Scholar] [CrossRef] [PubMed]
- Fan, Y.; Zhou, C.; Zhu, X. Selective catalysis of lactic acid to produce commodity chemicals. Catal. Rev.: Sci. Eng. 2009, 51, 293–324. [Google Scholar] [CrossRef]
- Shen, L.; Zhou, X.; Wang, A.; Yin, H.; Yin, H.; Cui, W. Hydrothermal conversion of high-concentrated glycerol to lactic acid catalyzed by bimetallic CuAux (x = 0.01–0.04) nanoparticles and their reaction kinetics. RSC Adv. 2017, 7, 30725–30739. [Google Scholar] [CrossRef]
- Xu, J.; Zhang, H.; Zhao, Y.; Yu, B.; Chen, S.; Li, Y.; Hao, L.; Liu, Z. Selective oxidation of glycerol to lactic acid under acidic conditions using AuPd/TiO2 catalyst. Green Chem. 2013, 15, 1520–1525. [Google Scholar] [CrossRef]
- Kishida, H.; Jin, F.M.; Zhou, Z.Y.; Moriya, T.; Enomoto, H. Conversion of glycerin into lactic acid by alkaline hydrothermal reaction. Chem. Lett. 2005, 34, 1560–1561. [Google Scholar] [CrossRef]
- Li, Y.; Nielsen, M.; Li, B.; Dixneuf, P.H.; Junge, H.; Beller, M. Ruthenium-catalyzed hydrogen generation from glycerol and selective synthesis of lactic acid. Green Chem. 2015, 17, 193–198. [Google Scholar] [CrossRef]
- Finn, M.; Ridenour, J.A.; Heltzel, J.; Cahill, C.; Voutchkova-Kostal, A. Next-generation water-soluble homogeneous catalysts for conversion of glycerol to lactic acid. Organometallics 2018, 37, 1400–1409. [Google Scholar] [CrossRef]
- Sharninghausen, L.S.; Campos, J.; Manas, M.G.; Crabtree, R.H. Efficient selective and atom economic catalytic conversion of glycerol to lactic acid. Nat. Commun. 2014, 5, 5084. [Google Scholar] [CrossRef] [PubMed]
- Lu, Z.; Demianets, I.; Hamze, R.; Terrile, N.J.; Williams, T.J. A prolific catalyst for selective conversion of neat glycerol to lactic acid. ACS Catal. 2016, 6, 2014–2017. [Google Scholar] [CrossRef]
- Oberhauser, W.; Evangelisti, C.; Tiozzo, C.; Vizza, F.; Psaro, R. Lactic acid from glycerol by ethylene-stabilized platinum-nanoparticles. ACS Catal. 2016, 6, 1671–1674. [Google Scholar] [CrossRef]
- Redina, E.; Greish, A.; Novikov, R.; Strelkova, A.; Kirichenko, O.; Tkachenko, O.; Kapustin, G.; Sinev, I.; Kustov, L. Preparation of bimetallic gold catalysts by redox reaction on oxide-supported metals for green chemistry applications. Catal. Today. 2015, 246, 216–231. [Google Scholar] [CrossRef]
- Haixu, Y.; Hengbo, Y.; Aili, W.; Lingqin, S.; Ye, L.; Yu, Z. Catalytic conversion of glycerol to lactic acid over metallic copper nanoparticles and reaction kinetics. J. Nanosci. Nanotechnol. 2017, 17, 1255–1266. [Google Scholar] [CrossRef]
- Yang, G.-Y.; Ke, Y.-H.; Ren, H.-F.; Liu, C.-L.; Yang, R.-Z.; Dong, W.-S. The conversion of glycerol to lactic acid catalyzed by ZrO2-supported CuO catalysts. Chem. Eng. J. 2016, 283, 759–767. [Google Scholar] [CrossRef]
- Yin, H.; Zhang, C.; Yin, H.; Gao, D.; Shen, L.; Wang, A. Hydrothermal conversion of glycerol to lactic acid catalyzed by Cu/hydroxyapatite, Cu/MgO, and Cu/ZrO2 and reaction kinetics. Chem. Eng. J. 2016, 288, 332–343. [Google Scholar] [CrossRef]
- Zavrazhnov, S.A.; Esipovich, A.L.; Danov, S.M.; Zlobin, S.Y.; Belousov, A.S. Catalytic conversion of glycerol to lactic acid: state of the art and prospects. Kinet. Catal. 2018, 59, 459–471. [Google Scholar] [CrossRef]
- Roy, D.; Subramaniam, B.; Chaudhari, R.V. Cu-based catalysts show low temperature activity for glycerol conversion to lactic acid. ACS Catal. 2011, 1, 548–551. [Google Scholar] [CrossRef]
- Rodrigues, A.; Maia, D.; Fernandes, F. Production of lactic acid from glycerol by applying an alkaline hydrothermal process using homogeneous catalysts and high glycerol concentration. Braz. J. Chem. Eng. 2015, 32, 749–755. [Google Scholar] [CrossRef]
- Liu, B.; Greeley, J. Decomposition pathways of glycerol via C–H, O–H, and C–C bond scission on Pt (111): a density functional theory study. J. Phys. Chem. C 2011, 115, 19702–19709. [Google Scholar] [CrossRef]
- Katryniok, B.; Kimura, H.; Skrzyńska, E.; Girardon, J.-S.; Fongarland, P.; Capron, M.; Dumeignil, F. Selective catalytic oxidation of glycerol: perspectives for high value chemicals. Green Chem. 2011, 13, 1960–1979. [Google Scholar] [CrossRef]
- Lux, S.; Siebenhofer, M. Synthesis of lactic acid from dihydroxyacetone: use of alkaline-earth metal hydroxides. Catal. Sci. Technol. 2013, 3, 1380–1385. [Google Scholar] [CrossRef]
- Ionescu, M.; Petrović, Z. On the mechanism of base-catalyzed glycerol polymerization and copolymerization. Eur. J. Lipid Sci. Technol. 2018, 120, 1800004. [Google Scholar] [CrossRef]
- Mondal, S.; Malviya, H.; Biswas, P. Kinetic modelling for the hydrogenolysis of bio-glycerol in the presence of a highly selective Cu–Ni–Al2O3 catalyst in a slurry reactor. React. Chem. Eng. 2019. [Google Scholar] [CrossRef]
- Díaz, J.; Skrzyńska, E.; Girardon, J.-S.; Capron, M.; Dumeignil, F.; Fongarland, P.; Díaz, J.A.; Skrzyńska, E.; Girardon, J.-S.; Capron, M.; et al. Glycerol oxidation in the liquid phase over a gold-supported catalyst: kinetic analysis and modelling. ChemEngineering 2017, 1, 7. [Google Scholar] [CrossRef]
- Jin, X.; Subramaniam, B.; Chaudhari, R. V.; Thapa, P.S. Kinetic modeling of Pt/C catalyzed aqueous phase glycerol conversion with in situ formed hydrogen. AIChE J. 2016, 62, 1162–1173. [Google Scholar] [CrossRef]
- Brainer, J.E.N.; Sales, D.C.S.; Medeiros, E.B.M.; Lima Filho, N.M.; Abreu, C.A.M. Wet oxidation of glycerol into fine organic acids: catalyst selection and kinetic evaluation. Braz. J. Chem. Eng. 2014, 31, 913–923. [Google Scholar] [CrossRef]
- Fogler, H.S. Elements of Chemical Reaction Engineering, 4th ed.; Pearson Education Ltd.: Harlow, Essex, USA, 2014; 875p. [Google Scholar]
- Chen, L.; Ren, S.; Philip, Y.-X. Glycerol conversion to lactic acid with sodium hydroxide as a homogeneous catalyst in a fed-batch reactor. React. Kinet. Mech. Catal. 2015, 114, 93–108. [Google Scholar] [CrossRef]
- Kishida, H.; Jin, F.; Moriya, T.; Enomoto, H. Kinetic study on conversion of glycerin to lactic acid by alkaline hydrothermal reaction. Kagaku Kogaku Ronbunshu 2006, 32, 535–541. [Google Scholar] [CrossRef]
- Liu, Q.-M.; Zhou, D.-B.; Yamamoto, Y.; Ichino, R.; Okido, M. Preparation of Cu nanoparticles with NaBH4 by aqueous reduction method. Trans. Nonferrous Met. Soc. China 2012, 22, 117–123. [Google Scholar] [CrossRef]


© 2019 by the authors. Licensee MDPI, Basel, Switzerland. This article is an open access article distributed under the terms and conditions of the Creative Commons Attribution (CC BY) license (http://creativecommons.org/licenses/by/4.0/).