Abstract
Deconvolution of the evolved isobutene data obtained from temperature-programmed, low-pressure steady-state conversion of isobutane over HZSM-5 has yielded apparent activation energies for isobutane dehydrogenation, isobutene dimerization and desorption. Intrinsic activation energies and associated isobutane collision frequencies are also estimated. A combination of wavelet shrinkage denoising, followed by time-varying flexible least squares of the evolved mass-spectral abundance data over the temperature range 150 to 450 °C, provides accurate, temperature-dependent, apparent rate parameters. Intrinsic activation energies for isobutane dehydrogenation range from 86 to 235.2 kJ mol−1 (average = 150 ± 42 kJ mol−1) for isobutene dimerization from 48.3 to 267 kJ mol−1 (average = 112 ± 74 kJ mol−1) and for isobutene desorption from 64.4 to 97.8 kJ mol−1 (average = 77 ± 12 kJ mol−1). These wide ranges reflect the heterogeneity and acidity of the zeolite surface and structure. Seven distinct locations and sites, including Lewis and Brønsted acid sites can be identified in the profiles. Isobutane collision frequencies range from 10−0.4 to 1022.2 s−1 and are proportional to the accessibility of active sites, within the HZSM-5 micropores or on the external surface.
1. Introduction
The technique of temperature-programmed, low-pressure, steady-state catalysis was developed to accurately monitor the kinetics of gas–solid reactions under conditions where both secondary reactions and heat fluctuations are minimized [1,2]. The methodology for extracting rate parameters from these experiments only allowed high-temperature data to be modeled, the kinetics of multiple reactions could not be individually determined and average parameters were reported.
Recently, time-varying flexible least squares methods [3] have been used to calculate temperature-dependent apparent activation energies and prefactors from mass spectral evolved-gas profiles obtained from the low-pressure, steady-state technique [4,5]. Ordinary linear least squares provides a single set of rate parameters for each series of rate constants, and so does not provide information on time-varying effects such as lateral interactions between absorbed species [6], mass and heat transfer processes [7], shape selectivity [8], surface heterogeneity and restructuring [9]. Flexible least squares can exactly simulate each data set by varying each of the parameters at each temperature. The resultant distribution provides information on the heterogeneity of the gas–surface reactions. A limitation to the flexible least-squares modeling has been the quality of the experimental data and so wavelet shrinkage denoising [10] has been employed in this paper to remove noise in the mass-spectral data without affecting the signal. As a consequence, temperature-dependent rate parameters can be determined at temperatures where the product pressures and hence mass-spectral abundances are low.
Small alkane catalysis over pure zeolites has been widely studied and reported [8,11]. The results on such model systems have provided an understanding of the important and complex petrochemical processes involving acidic zeolite substrates that lead to high activity and selectivity. Many experimental and theoretical studies have been undertaken on isobutane adsorption and conversion reactions over zeolites. Experiments have provided a range of carbon–carbon bond cleavage and dehydrogenation mechanisms and rate parameters [1,4,12,13,14,15]. Isobutene dimerization [16,17,18,19] and oligomerization [20] reactions over acidic catalysts in the liquid-phase have also been investigated. The mechanism of the selective hydrogenation of propene in excess H2 on Brønsted sites and the relationship with propane dehydrogenation has recently been reported [21]. Theoretical methods have been used for detailed investigations of zeolite catalyzed isobutane conversions: carbon–carbon bond cleavage; hydrogen exchange; hydride abstraction; dehydrogenation [22,23,24,25]. Surface acidity is the main driver of zeolite catalysis. The chemical nature, concentration, strength distribution and accessibility of acid sites are fundamental to understanding this heterogeneous catalysis [26].
2. Kinetics of Steady-State, Low-Pressure Catalysis
The mechanism of heterogeneous catalysis involves reactant adsorption, diffusion to active sites, reaction, product diffusion followed by desorption, which causes an increase in product pressure in the Knudsen cell. All steps are reversible and product may further react at active sites on the zeolite surface. Gaseous products and reactant escape through the cell aperture into the quadrupole mass spectrometer. The experimental conditions allow the steady-state approximation to be used and the rate laws simplified.
2.1. Mechanism
Isobutane (IA(g)) flows into the Knudsen cell and collides with the external surface of the zeolite catalyst. Adsorption (IA-S) may occur at non-specific sites on the surface (S) with rate constant, k1. The reverse step, desorption with rate constant, k−1 will also be prevalent.

Isobutane diffusion to and adsorption at active sites or into the zeolite micropores (IA-S*) with rate constant, k2 and reverse desorption and diffusion (k−2) will control the density of reactants bound to active sites.

Dehydrogenation to adsorbed isobutene and hydrogen(IE-S*), with rate constant k3 then proceeds. The reverse hydrogenation step may also occur in the confines of the zeolite channels.

An alternative is dimerization of isobutene to adsorbed 2,4,4-trimethyl-2-pentene and 2,4,4-trimethyl-1-pentene, (IE2-S*).

Competition then is apparent between direct product desorption (P(g)) and diffusion to non-specific surface sites (PS). Each of these steps is reversible:


Both reactant and product gas-phase molecules then exit from the Knudsen cell and into the mass spectrometer with escape rate constants, kescIA and kescIE, respectively.

Escape rate constants are calculated from Equation (23), below [1,2,27].
2.2. Rate Laws
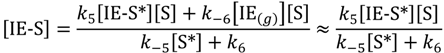
The rate of escape of isobutene from the Knudsen cell, under steady-state conditions is simplified to desorption from non-specific sites:

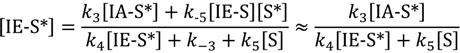
Steady-state isobutene concentrations on the surface of the catalyst at non-specific sites [IE-S] and specific active sites [IE-S*] are shown in Equations (2) and (3). Equation (2) has been reduced by assuming that the reverse step in the numerator does not make a significant contribution to the concentrations.
For product isobutene coverage at specific active sites, dimerization (R4) is chosen as the more prevalent reaction when compared with hydrogenation (reverse of R3):
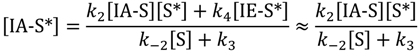
Steady-state concentrations of adsorbed isobutane at specific active sites [IA-S*] are shown in Equation (4). Here dimerization (R4) is taken to be negligible.
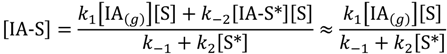
Finally, steady-state isobutane concentration on non-specific catalyst sites, [IA-S] is approximated by:
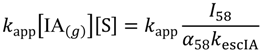
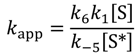
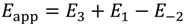
The overall rate law for escape from the Knudsen cell can be approximated by Equation (6) and the apparent rate constant, kapp:

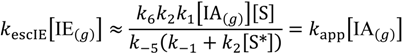
This can be further deconvoluted to three rate laws. The first is when neither dehydrogenation nor dimerization is rate-determining, while the rate is dependent on product desorption from non-specific sites. That is, k4[IE-S*] ≪ k5[S], k−2[S] ≪ k3, and k−5[S*] ≫ k6
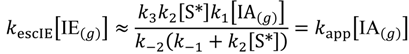
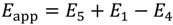
The second rate law is when dehydrogenation is dominant, and product desorption and dimerization are not rate determining: k−2[S] ≫ k3, k−5[S*] ≪ k6 and k4[IE-S*] ≪ k5[S].
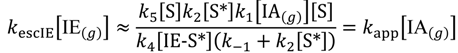
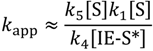
The third rate law is when dimerization (R4) is causing an apparent decrease in isobutene partial pressure, while dehydrogenation and product desorption do not affect the rate: k−2[S] ≪ k3, k−5[S*] ≪ k6 and k4[IE-S*] ≫ k5[S].
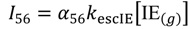
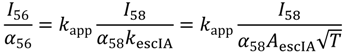
Isobutene mass spectral abundances at m/e = 56, I56 is proportional to the mass spectral sensitivity factor, a56, escape rate constant from the Knudsen cell and steady-state concentration [IE(g)] in the Knudsen cell.
The concentration of isobutane at sites on the surface or in the pores of the catalyst is unlikely to be directly proportional to the steady-state isobutane pressure [IA(g)] in the Knudsen cell and hence the associated mass-spectral abundance, I58. As a consequence, an adjustable correction exponent, n, is included in the optimization:
Including Equations (7) and (8) into Equation (6) gives:
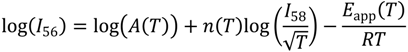
Taking logarithms and rearranging
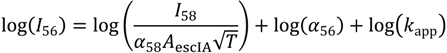 Writing the rate constant expression with apparent Arrhenius prefactors and activation energies yields:
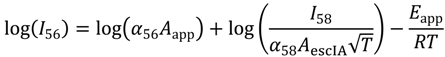
The simulations undertaken in this paper of the temperature-dependent reactant and product mass-spectral abundances give three temperature-dependent parameters, A(T), n(T) and Eapp(T). The exponent n(T) is a correction for differences in the steady-state pressure of reactant in the cell and concentrations at the external surface and within the zeolite pores.
By assuming intrinsic reaction, diffusion and desorption prefactors are equal and so cancel in the deconvoluted rate laws (6a, 6b and 6c), apparent prefactors can be associated with reactant collision frequencies on the surface of the zeolite. They can be calculated from:

3. Results and Discussion
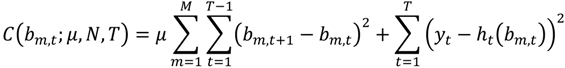
Figure 1, Figure 2 and Figure 3 are plots of the temperature-dependent parameters determined from Equations (12) and (13). Apparent activation energies and prefactors are calculated from isobutane and isobutene abundances monitored as a function of temperature during the first three steady-state temperature-programmed exposures of isobutane to HZSM-5 from 100 to 500 °C. Flexible-least squares methodology, and insufficient data points in rapidly changing abundances, has caused the removal of parameters at the high- and low-temperature extremes. A wide range of at least eleven distinct peaks, plateaus or shoulders are apparent in the rate parameters over the temperature range for the runs plotted in Figure 1, Figure 2 and Figure 3. Corresponding average apparent rate parameters with standard deviations for at least three data-points at the maxima, minima and inflexions are listed in Table 1 Table 2, Table 3.

Figure 1.
Apparent activation energies (blue circles) and prefactors (red circles) for the first temperature-programmed run for isobutene evolution over HZSM-5.
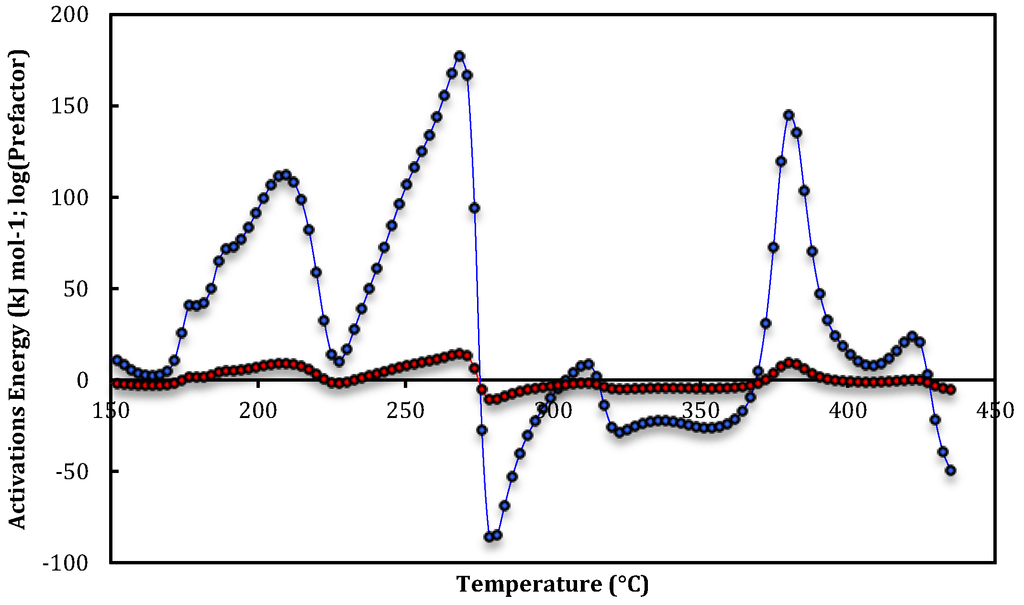
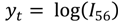
Figure 2.
Apparent activation energies (blue circles) and prefactors (red circles) for the second temperature-programmed run for isobutene evolution over HZSM-5.
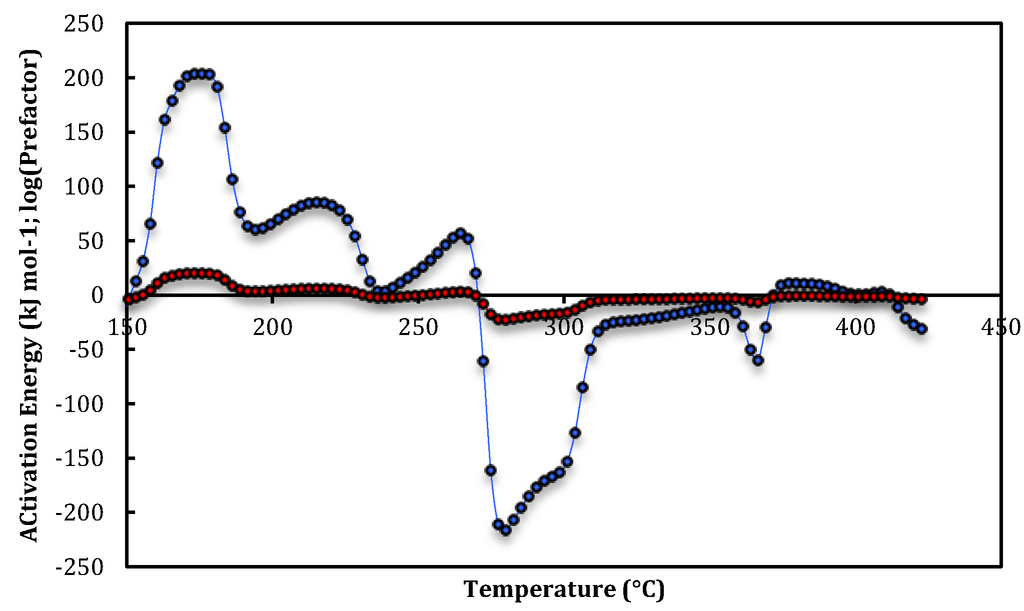
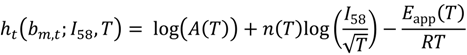
Figure 3.
Apparent activation energies (blue circles) and prefactors (red circles) plotted against temperature for the third temperature-programmed run for isobutene evolution over HZSM-5.

Table 1.
Apparent activation energies and prefactors for each peak, plateau and shoulder plotted in Figure 1. Site-1are assigned to isobutene desorption. Site-2a, Site-2b and Site-2c are isobutane dehydrogenation and Site-3a and Site-3b are isobutene dimerization parameters.
| Run 1 | T-range (°C) | E app(T) (KJ mol-1) | log10(Aapp(T))(s−1) |
|---|---|---|---|
| Site-1 | 140–156 | 7.9 ± 0.3 | −2.49 ± 0.03 |
| Site-1 | 173–178 | 34 ± 12 | 0.6 ± 1.4 |
| Site-2a | 183–190 | 93 ± 6 | 7.2 ± 0.6 |
| Site-2a | 205–211 | 138.5 ± 1.2 | 11.80 ± 0.15 |
| Site-2b | 243–251 | 99.4 ± 1.6 | 7.09 ± 0.12 |
| Site-2b | 261–266 | 105.0 ± 1.0 | 7.44 ± 0.10 |
| Site-3a | 276–281 | −32 ± 2 | −5.7 ± 0.2 |
| Site-3a | 305–310 | −3.5 ± 0.7 | −2.91 ± 0.06 |
| Site-3b | 318–344 | −20.4 ± 0.7 | −4.30 ± 0.11 |
| Site-2c | 375–378 | 90 ± 2 | 5.05 ± 0.18 |
| Site-1 | 388–393 | 31.1 ± 1.6 | 0.42 ± 0.10 |
| Site-1 | 406–419 | 13.7 ± 1.7 | −0.69 ± 0.15 |
Table 2.
Apparent activation energies and prefactors for each peak, plateau and shoulder plotted in Figure 2. Site-1 are assigned to isobutene desorption. Site-2a, Site-2b and Site-2c are isobutane dehydrogenation and Site-3a to Site-3b are isobutene dimerization parameters.
| Run 2 | T-range (°C) | E app(T) (KJ mol-1) | log10(Aapp(T))(s−1) |
|---|---|---|---|
| Site-1 | 141−155 | 10.7 ± 1.8 | −1.9 ± 0.2 |
| Site-1 | 177−182 | 41.3 ± 0.8 | 1.72 ± 0.07 |
| Site-2a | 189−194 | 74 ± 3 | 5.3 ± 0.3 |
| Site-2a | 207−213 | 111 ± 2 | 9.0 ± 0.3 |
| Site-2b | 250−256 | 116 ± 9 | 8.9 ± 0.9 |
| Site-2b | 266−271 | 171 ± 6 | 13.8 ± 0.5 |
| Site-3a | 278−284 | −80 ± 10 | −10.0 ± 0.9 |
| Site-3a | 310−312 | 8.2 ± 0.7 | −1.71 ± 0.06 |
| Site-3b | 320−357 | −24.8 ± 1.9 | −4.50 ± 0.19 |
| Site-2c | 380−383 | 140 ± 7 | 9.1 ± 0.5 |
| Site-1 | 406−411 | 8.5 ± 0.6 | −1.11 ± 0.07 |
| Site-1 | 419−424 | 21.8 ± 1.9 | 0.04 ± 0.15 |
Table 3.
Average apparent activation energies and prefactors for each peak, plateau and shoulder in Figure 3. Site-1 are assigned to isobutene desorption. Site-2a and Site-2b are isobutane dehydrogenation and Site-3a, Site-3b and Site-3c are isobutene dimerization parameters.
| Run 3 | T-range (°C) | E app(T)(KJ mol-1) | log10(Aapp(T))(s−1) |
|---|---|---|---|
| Site-2b | 163–166 | 170 ± 12 | 16.7 ± 1.4 |
| Site-2b | 171–178 | 203.0 ± 1.0 | 20.03 ± 0.15 |
| Site-2a | 210–220 | 84.0 ± 1.4 | 5.91 ± 0.15 |
| Site-1 | 249–254 | 26 ± 6 | 0.1 ± 0.6 |
| Site-2a | 262–267 | 54 ± 3 | 2.9 ± 0.3 |
| Site-3a | 277–283 | −211 ± 5 | −22.2 ± 0.5 |
| Site-3a | 293–298 | −167 ± 4 | −17.5 ± 0.5 |
| Site-3b | 314–322 | −25.0 ± 1.6 | −4.2 ± 0.4 |
| Site-3b | 351–356 | −11.1 ± 0.5 | −3.25 ± 0.04 |
| Site-3c | 367–369 | −47 ± 15 | –5.6 ± 1.1 |
| Site-1 | 374–388 | 10.3 ± 0.7 | −0.82 ± 0.06 |
At the commencement of the first run the density of Brønsted acid sites would be at a maximum and adsorbed impurity gases maybe present. The activation energy and prefactor profiles can be divided into regions of desorption of isobutene, dehydrogenation of isobutane and dimerization of isobutene. These regions are correlated across the three temperature-programmed runs and have been assigned based on temperature range equivalence across the runs and magnitude of the parameters. That is, desorption apparent parameters are small (<50 kJ mol−1), dehydrogenation large and dimerization negative.
3.1. Isobutene Desorption
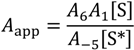
Low- and high-temperature sites (Site-1) for isobutene desorption are identified in Figure 1, Figure 2 and Figure 3, by the low apparent activation energies, less than 50 kJ mol−1. The dehydrogenation products at low-temperatures are likely to have formed during the initial extended exposure at 100 °C. As a consequence isobutane desorption and diffusion are not rate-limiting and k−1 ≪ k2[S*]. Equation (6a) becomes:
 That is, the rate constant for desorption, multiplied by the apparent isobutane collision frequency and divided by the rate constant for diffusion of adsorbed isobutene from the external surface to either an active site or into the micropores of the zeolite. This can be expanded as apparent prefactors
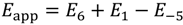
 and activation energies
Apparent activation energies for the low-temperature sites over the three runs range from 7.9 ± 0.3 to 41.3 ± 0.8 kJ mol−1, with mean 24 ± 14 kJ mol−1. The high-temperature sites range from 8.5 ± 0.6 to 31.1 ± 1.6 kJ mol−1. The mean is 17 ± 9 kJ mol−1.
Adsorption and diffusion kinetic parameters for branched-chained alkenes in zeolites are not widely reported in the literature. Hufton et al. [28] report adsorption and diffusion energies for isobutane and isobutene in large silicalite crystals at low concentrations, measured by chromatographic techniques. Silicalite has the same structure as HZSM-5 and adsorption energies have been found to be independent of the Si/Al ratio [25]. For isobutene in silicalite the heat of adsorption and diffusion are 72.8 and 56.5 kJ mol−1 respectively [28].
Table 4.
Intrinsic isobutene desorption activation energies (E6) and collision frequencies (log10A1) calculated from Equations (15) and (16) for the three runs. Isobutene diffusion activation energy is E−5 = 56.5 kJ mol−1 [1] and E1 = 0, and the ratio log10A6: A−5 ≈ 0.
| Site-1 (Low T) | Site-1 (High T) | |
|---|---|---|
| E6 (kJ mol-1) | E6 (kJ mol-1) | |
| Run 1 | 64.4 ± 0.3; 90.5 ± 12 | 87.6 ± 1.6; 70.2 ± 1.7 |
| Run 2 | 67.2 ± 1.8; 97.8 ± 0.8 | 65.0 ± 0.6; 78.3 ± 1.9 |
| Run 3 | 83 ± 6 | 66.8 ± 0.7 |
| Average | 77 ± 12 | |
| log10A1(s-1) | log10A1(s-1) | |
| Run 1 | –2.49 ± 0.03; 0.6 ± 1.4 | 0.42 ± 0.10; –0.69 ± 0.15 |
| Run 2 | –1.9 ± 0.2; 1.72 ± 0.07 | –1.11 ± 0.07; 0.04 ± 0.15 |
| Run 3 | 0.1 ± 0.6 | –0.82 ± 0.06 |
| Average | –0.4 ± 1.2 | |
Table 4 lists isobutene average desorption activation energies, E6 calculated using Equation (16) and with E−5 = 56.5 kJ mol−1 and E1 = 0, i.e., non-activated isobutane adsorption. The overall average of all energies is 77 ± 12 kJ mol−1. The mean value is within 4.2 kJ mol−1 of the heat of adsorption of isobutene in silicalite (72.8 kJ mol−1) [28]. Isobutene desorption from Sites-1 are assigned to desorption from non-specific sites within the zeolite micropores, because energies are close to the literature heat of adsorption [28], silicalite would not have strong acid sites.
A first approximation for the desorption and diffusion prefactors are log10A6 ≈ log10A−5 ≈ 13 [29] and [S] ≈ [S*]. Hence the apparent prefactor is the isobutane collision frequency, Aapp ≈ A1, and are also listed in Table 4. The overall mean collision frequency is log10A1(s−1) = –0.4 ± 1.2. Low and negative values demonstrate that isobutane collisions are not rate-determining.
3.2. Isobutane Dehydrogenation
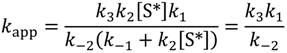
Due to the large and positive apparent activation energies the rate parameters at Sites-2a, 2b and 2c are assigned to isobutane dehydrogenation. For runs 1 and 2 the average parameters at Site-2a and 2b are paired. That is, each pair is linked with increasing rate parameters. For run 3, Site-2a shows a linked pair at lower temperatures then for the first two runs, while Site-2b parameters are not linked. For dehydrogenation isobutane adsorption and diffusion is also expected to play a part. Both isobutane desorption and diffusion to active sites may affect the rate. The heat of adsorption of isobutane has been measured in silicalite in low concentrations to be 49.0 kJ mol−1 [1]. Calculated adsorption energies for isobutane on HZSM-5 are 38 kJ mol−1 for primary carbons and 48 kJ mol−1 for tertiary carbons [25]. These magnitudes would be similar to the isobutane desorption energy, E−1, assuming adsorption is not activated (E1 = 0). In comparison the heat of diffusion of isobutane in silicalite is less by only 16.8 kJ mol−1, i.e., 32.2 kJ mol−1 [28]. Equation (6b) can, however be simplified by setting k−1 ≪ k2[S*] and the apparent rate constant, becomes independent of the site concentration:
 This can be expanded as apparent Arrhenius prefactors
 and activation energies
Dehydrogenation activation energies, E3 are calculated from the Eapp values in Table 2 and by setting E−2, isobutane diffusion activation energy from active sites to 32.2 kJ mol−1. These dehydrogenation energies are listed in Table 5 for each of the three Sites and three temperature-programmed runs.
Site-2a intrinsic activation energies in Table 5 increase with increasing temperature and decrease with consecutive runs. Decreasing activity (i.e., increasing E3) with increasing temperature demonstrates that the most active sites take priority in dehydrogenation catalysis. Increasing activity (i.e., decreasing E3) maybe related to increasing dehydration due to repeated heating to 500 °C, and hence increasing exposure of Lewis acid sites. The overall average of the Site-2a dehydrogenation activation energies is 125 ± 30 kJ mol−1 and energy barriers range from 86 ± 3 to 170.7 ± 1.2 kJ mol−1.
The Site-2b intrinsic dehydrogenation activation energies also show decreasing activity with increasing temperature. However, in contrast to Site-2a, increasing E3 is apparent for consecutive runs. This suggests that the active sites at Site-2b are Brønsted acid sites with the most active sites deactivating first, as the zeolite becomes dehydrated. Overall average activation energy for isobutane dehydrogenation at Site-2b is 152 ± 31 kJ mol−1 and the energy barriers range from 131.6 ± 1.6 to 235.2 ± 1.0 kJ mol−1.
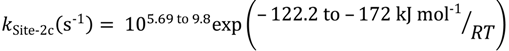
For Site-2c, a sharp E3 positive peak at around 380 °C is observed for both runs 1 and 2. The magnitude of the first run dehydrogenation energy of 122.2 ± 2.0 kJ mol−1 is similar in magnitude to the possible Lewis acid sites of Site 1, while 172 ± 7 kJ mol−1 for the second run is a closer match to the possible Brønsted acid site activation energy at Site 2. However, the average of E3 for the two runs (147 ± 35 kJ mol−1) is similar to the overall average Brønsted acid Site-2b energy (152 ± 31 kJ mol−1). A sharp peak suggests hydrogenation is occurring in confined spaces within the zeolite micropore structure, followed by release to the gas phase. The average of all the proposed intrinsic dehydrogenation activation energies is 150 ± 42 kJ mol−1.
Table 5.
Intrinsic isobutane dehydrogenation activation energies (E3) and collision frequencies (log10A1) calculated from Equations (15) and (16) for the three runs. Isobutane diffusion activation energy is E−2 = 32.2 kJ mol−1 [1] and E−1 = 0, and the ratio log10A3: A−2 ≈ 0.
| Site-2a | Site-2b | Site-2c | |
|---|---|---|---|
| E3 (kJ mol−1) | E3 (kJ mol−1) | E3 (kJ mol−1) | |
| Run 1 | 125 ± 6 to 170.7 ± 1.2 | 131.6 ± 1.6 to 137.2 ± 1.0 | 122.2 ± 2.0 |
| Run 2 | 106 ± 3 to 143 ± 2 | 148 ± 9 to 203 ± 6 | 172 ± 7 |
| Run 3 | 86 ± 3 to 116.2 ± 1.4 | 202 ± 12 to 235.2 ± 1.0 | – |
| Range | 86 ± 3 to 170.7 ± 1.2 | 131.6 ± 1.6 to 235.2 ± 1.0 | 122.2 ± 2.0 to 172 ± 7 |
| log10A1(s−1) | log10A1(s−1) | log10A1(s−1) | |
| Run 1 | 7.2 ± 0.6 to 11.80 ± 0.15 | 7.09 ± 0.12 to 7.44 ± 0.10 | 5.05 ± 0.18 |
| Run 2 | 5.3 ± 0.3 to 9.0 ± 0.3 | 8.9 ± 0.9 to 13.8 ± 0.5 | 9.1 ± 0.5 |
| Run 3 | 2.9 ± 0.3 to 5.91 ± 0.15 | 16.7 ± 1.4 to 20.03 ± 0.15 | – |
| Range | 2.9 ± 0.3 to 11.80 ± 0.15 | 7.09 ± 0.12 to 20.03 ± 0.15 | 5.05 ± 0.18 to 9.1 ± 0.5 |
The apparent prefactors are again equivalent to effective isobutane collision frequencies, when it is assumed that desorption and diffusion prefactors are log10A3 ≈ log10A−2 ≈ 13 [29]. The paired and single average apparent collision frequencies from the three dehydrogenation sites are: log10A1(s−1) =7.8 ± 2.6, 10.8 ± 4.3 and 7.1 ± 2.9. The large ‘errors’ reflect the large range of parameters, rather than experimental errors. Values significantly greater than zero demonstrate that isobutane collisions and coverage are affecting the dehydrogenation rate. Sites-2a and 2c show similar average collision frequencies, although the Site-2c log10A1 values increase between the first and second runs, equivalent to the Site-2b trend. Site-2c reactions need to be considered with the dimerization reactions at Sites-3a, 3b and 3c, below.
Zheng and Bowers [23] used ab initio and density functional theory methods to investigate the conversion reactions of isobutane over zeolites. For dehydrogenation, calculated activation energies varied from 220 to 263 kJ mol−1, depending on zeolite proton acidity (high to low). The equilibrium value is 242 kJ mol−1. These activation energies are similar in magnitude to the highest Site-2b values (Brønsted acid sites): 235.2 ± 1.0 kJ mol−1. Measured activation energies for isobutane dehydrogenation over three acidic zeolites (one MWW and two MFI) range from 150 ± 9 to 178 ± 9 kJ mol−1 [13]. These also fall most comfortably within the Site-2a, Brønsted acid range listed in Table 2. Other reported experimental dehydrogenation activation energies over HZSM-5 are 100 kJ mol−1 [14] and 136 ± 6 kJ mol−1 [1]. The latter was calculated using the same data sets and at the highest temperatures (>395 °C). These studies do not distinguish between acid sites; however, they are within the range of dehydrogenation activation energies associated with Site-2a (Lewis acid sites). Activation energies for the dehydrogenation of isobutane at Lewis acid sites (extra-framework aluminum species) have been calculated using density functional theory to be in the range 163 to 172 kJ mol−1 [24]. Like the Brønsted site calculations [23], these magnitudes are similar to the highest Site-2b values.
An alternative mechanism for one or more of the low-activation energy sites is low-temperature activation of isobutane to isobutene and hydrogen, caused by weak hydrogen bonding between C–H and O on the zeolite [4,30]. This measured average and apparent activation energy was previously calculated to be 62.8 ± 1.0 kJ mol−1 for this same isobutane/HZSM-5 system [4]. The corresponding intrinsic activation energy for dehydrogenation, from Equation (19) is 95.0 ± 1.0 kJ mol−1, and is most closely aligned with the Site-2a values (86 ± 3 to 170.7 ± 1.2 kJ mol−1).
3.3 Isobutene Dimerization (or Hydrogenation)
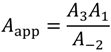
The Site-3a, 3b and 3c regions of the profiles in Figure 1, Figure 2 and Figure 3 are dominated by negative activation energies are associated with dimerization, oligomerization or hydrogenation of isobutene. This is because they represent a decrease in the pressure of isobutene within the Knudsen cell. Dimerization is chosen for this analysis, but hydrogenation could equally be causing the isobutene pressure drop. A simplification of rate constant, Equation (6c) is when isobutene diffusion from active sites is competing with dimerization, and again, k−1 ≪ k2[S*], because isobutane diffusion and desorption are next expected to be rate limiting:
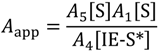
 Expanded as apparent Arrhenius prefactors, which is dependent on availability of non-specific sites squared and the coverage of isobutene at active sites:
 and activation energies:
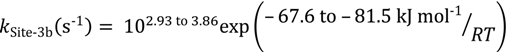
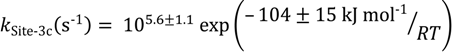
Again using the isobutene diffusion activation energy of E5 = 56.5 kJ mol−1 [28] and E1 = 0, energies for dimerization can be calculated and are listed in Table 6. Three sites are observed, the first, Site-3a has E4 ranging from 48.3 to 267 kJ mol−1, the second, Site-3b from 67.6 to 81.5 kJ mol−1 and the third site, Site-3c has a single sharp peak in run 3, with an activation energy of 104 ± 15 kJ mol−1. In contrast with the dehydrogenation sites, energies decrease with increasing temperature for the linked pairs. This trend of increasing activity within a run maybe a consequence of E5, the isobutene diffusion energy, increasing with increasing temperature, rather than a significant change to E4. That is, as the isomers oligomerize and aromatize there may be blockage and hence isobutene is trapped within the micropores of the zeolite leading to decreased apparent activation energies. This blockage is further demonstrated by the increasing activation energies between succeeding runs; isobutene has reduced access to the most active sites. Site-3b demonstrates a much narrower range of activation energies across the three runs. In this case the size of the cavities maybe larger and active sites, where dimerization is occurring shows higher density, than for Site-3a. The single sharp peak observed for the third run at Site 3c, occurs at the same temperatures as the positive dehydrogenation peaks in the first and second runs and immediately following the dimerization sites. This suggests that Sites-3b, 2c and 3c are at equivalent locations within the HZSM-5 micropores. At lower temperatures dimerization or hydrogenation of isobutene dominates, while at higher temperatures (Sites-2c) decomposition of the 2,4,4-trimethylpentene products or dehydrogenation takes over. For Site-3c, where there may be pore blockage, decomposition or dehydrogenation leads to further dimerization or hydrogenation. These are similar arguments to the transition state, reactant and product shape selectivities reviewed by Smit and Maesen [8].
Kinetic modeling of isobutene dimerization over a commercial ion-exchange resin catalyst in a continuous stirred tank rank at 60–120 °C gives apparent activation energies of 30 ± 3 kJ mol−1 [16,17]. Other experimental and theoretical studies [18,19] reported higher activation energies using different models: 51.49, 52.59, 47.91 and 89.34 kJ mol−1. Hauge et al. [20] also investigated isobutene dimerization in the liquid phase over a range of zeolites, including HZSM-5. Rapid deactivation was observed and an apparent activation energy of 48 kJ mol−1 was reported. These apparent energies are likely to include isobutene adsorption terms at two active sites [16], i.e., one for each monomer, and so are in agreement with the very broad range of intrinsic activation energies listed in Table 6.
Table 6.
Intrinsic isobutene dimerization activation energies (E4) and collision frequencies (log10A1) calculated from Equations (21) and (22) for the three runs. Isobutene diffusion activation energy is E5 = 56.5 kJ mol−1 [1] and E1 = 0, and the ratio log10A5: A4 ≈ 0.
| Site-3a | Site-3b | Site-3c | |
|---|---|---|---|
| E4 (kJ mol−1) | E4 (kJ mol−1) | E4 (kJ mol−1) | |
| Run 1 | 88 ± 2 to 60.0 ± 0.7 | 76.9 ± 0.7 | – |
| Run 2 | 136 ± 10 to 48.3 ± 0.7 | 81.3 ± 1.9 | – |
| Run 3 | 267 ± 5 to 223 ± 4 | 81.5 ± 1.6 to 67.6 ± 0.5 | 104 ± 15 |
| Range | 48.3 ± 0.7 to 267 ± 5 | 67.6 ± 0.5 to 81.5 ± 1.6 | 104 ± 15 |
| log10A1(s−1) | log10A1(s−1) | log10A1(s−1) | |
| Run 1 | 5.7 ± 0.2 to 2.91 ± 0.06 | 4.30 ± 0.11 | – |
| Run 2 | 10.0 ± 0.9 to 1.71 ± 0.06 | 4.50 ± 0.19 | – |
| Run 3 | 22.2 ± 0.5 to 17.5 ± 0.5 | 4.2 ± 0.4 to 3.25 ± 0.04 | 5.6 ± 1.1 |
| Range | 1.71 ± 0.06 to 22.2 ± 0.5 | 3.25 ± 0.04 to 4.50 ± 0.19 | 5.6 ± 1.1 |
Approximate isobutene collision frequencies listed in Table 6 give an indication of the location of the sites. The broad range for site-3a, 1.71 ± 0.06 to 22.2 ± 0.5 s−1 suggests a range where isobutene density is independent of collision frequencies, i.e., deep within the micropores of the zeolite to direct involvement of collisions at the external surface of the HZSM-5 (Run 3). Sites-3b and 3c also show low to medium values of log10A1 and may also indicate dimerization within the micropores. The dependence on [IE-S*] in Equation (21) and the assumption that log10A5 = log10A4 = 13 for biomolecular processes may further complicate the interpretation of these data.
4. Experimental and Data Analysis
4.1. Experimental Technique and Materials
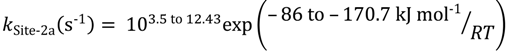
The apparatus and technique of temperature-programmed, low-pressure, steady-state catalysis has been previously described [1,2] and the data analysed in this paper was taken from work reported by Le Minh and Brown [1]. A mixture of isobutane and inert argon flow over ca. 0.3 g of HZSM-5 located in a Knudsen cell reactor at 100 °C. After typically 2 hours when molecular flow is at steady-state a linear heating program (5 °C/min) is initiated to 500 °C. Collisions of isobutane with zeolite, leads to adsorption and catalysis for the conversion of isobutane. Elementary steps can be identified due to the short residence times within the reactor, thus minimizing the opportunity for multiple reaction steps. The rates of escape of both isobutane and isobutene from the Knudsen cell are monitored by quadrupole mass spectrometry. For isobutane, the m/e = 58 peak abundance (I58) characterized the reactant and for isobutene, the m/e = 56 peak abundance (I56) was recorded. A small correction was applied to the product abundances at (I56), due to a contribution from isobutane (Table 7). Figure 4 is a plot of isobutene mass spectral abundance against temperature for the first exposure of isobutane to HZSM-5. Two subsequent and identical runs from 100 to 500 °C were carried out on this same zeolite sample on consecutive days.
Key details of the experimental technique are summarized in Table 7. The zeolite, NH4HZSM-5 (CBV 3024G) was obtained from Zeolyst International, Kansas City, KS, USA). Unit cell formula is (NH4)5.48(Si90.52Al5.48)O189.3, SiO2/Al2O3 ratio is 33.0 ± 1.8 and surface area is 358 ± 10 m2 g−1. The zeolite was pre-heated in air at 500 °C to remove ammonia. Instrument grade isobutane, isobutene and argon were obtained from BOC gases and used without further purification.
The escape rate constants from the Knudsen cell are [1,2,27]
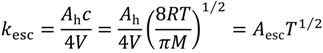 where Ah is the area of the escape aperture in cm2, V the volume of the reactor in cm3, c the mean molecular speed of isobutane or isobutene and M is the molar mass. The constant Aesc is a combination of these constants and has units K−1/2 s−1.
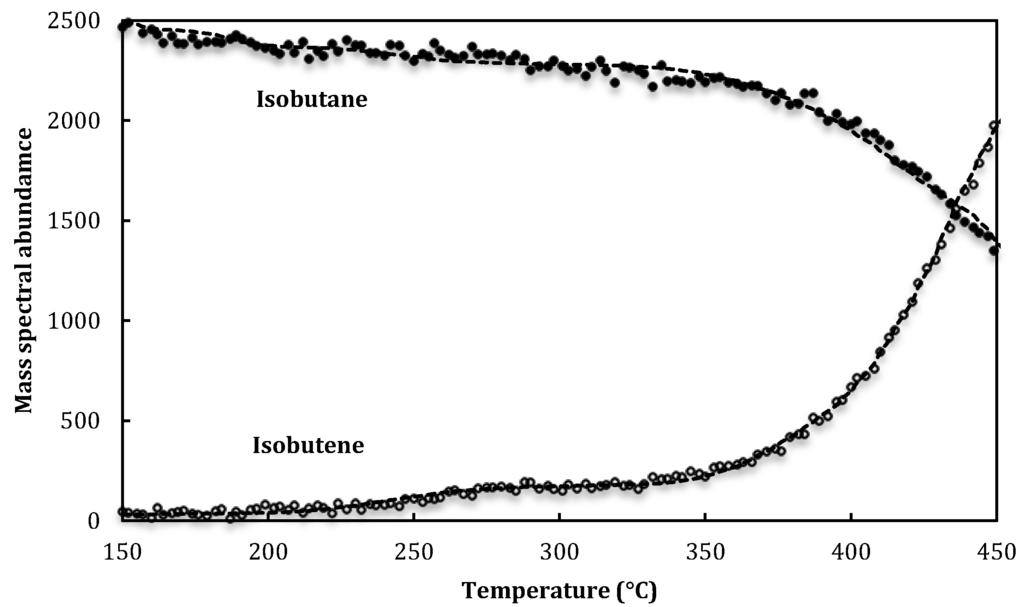
Figure 4.
Raw mass spectral abundances (black circles) and wavelet denoised abundances (dashed line) for isobutane and isobutene plotted against temperature for the first temperature-programmed run over HZSM-5.
Table 7.
List of specifications for the Knudsen cell reactors and mass spectrometer calibration and correction factors. Maximum isobutene flow rate is estimated by equating the largest cell dimension (ca. 40 mm) with the isobutane mean free path [1].
| Knudsen cell (5 reactors) | |
|---|---|
| Volumes | 8,000 to 10,000 mm3 |
| Internal surface areas | 2,000 to 3,000 mm2 |
| Exit aperture areas | 0.8 to 1.6 mm2 |
| Maximum isobutane flow rate (500°C) | 4.2 × 10¹⁵ molecules s−1 |
| Pressure in cell | 7 to 10 Pa |
| Collisions/molecule | 2500 to 1900 |
| Escape rate constant, kesc | 0.12 to 0.18 × (T/M)1/2s−1 |
| Mass spectrometer calibration | |
| Isobutane mass spec. sensitivity factor, α58 | 2.3 ± 1.5 × 10⁻¹⁶ I58 s molecule−1 |
| Isobutene mass spec. sensitivity factor, α56 | 3.5 ± 2.3 × 10⁻¹⁶ I56 s molecule−1 |
| I56 correction for isobutane | 0.1377 ± 0.0028 × I58 |
4.2. Wavelet Shrinkage Denoising
Wavelets are mathematical functions that oscillate, vanish smoothly and quickly with good localization in both time and frequency [10]. A wavelet family is a collection of primary functions that have been created by dilations and translations of a mother wavelet. In this paper the R [31] programming language is used with the package “WaveThresh” [32] to perform the signal denoising. Denoising is the process where a noisy signal is reconstructed. For this purpose the Discrete Wavelet Transform (DWT) within “WaveThresh” was applied to the mass spectral abundances using the default Daubechies Least Asymmetric wavelet family with 10 vanishing moments.
The DWT transforms the signal using filters (high or low pass) of different cut-off frequencies (high or low) to analyse the signal at different scales. The general method of wavelet shrinkage denoising consists of three steps:
- (i)
- Decompose the signal using a discrete wavelet transform; linear forward wavelet transform.
- (ii)
- Perform thresholding in the wavelet domain; non-linear shrinkage denoising.
- (iii)
- Perform a linear inverse wavelet transform.
Figure 4 shows that by using wavelet shrinkage the raw isobutene abundance data are denoised, resulting in the true signal. This methodology has been used to denoise both isobutane and isobutene abundances.
4.3. Time-Varying Flexible Least Squares
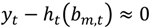
Time-varying flexible least squares [3] is a generalization of ordinary linear regression by including time-variant regression parameters. For a series of observations y1, y2, …, yT obtained at successive times 1, 2, …, T, there are known predictor functions h1, h2, …, hT that are dependent on N unknown parameters bm,1, bm,2, …, bm,T which evolve slowly over time. Minimizing both the ordinary linear measurement specification:
 and a parameter dynamic specification optimizes these parameters:
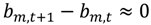
The N time-dependent parameters are ultimately calculated by minimizing the following cost function:
 Here μ is a weighting that minimizes the difference between subsequent parameters (bn,t+1 and bn,t). As μ approaches infinity the parameter determination approach the zero dynamic cost (ordinary least squares) solution [3,33]. When μ is set close to zero, priority is given to the dynamic specification and to estimates of the time-varying parameters [34], and hence a closer fit to the data (μ = 0.001 was used).
For temperature-programmed rate data
 and
and
 with
with
 These temperature-dependent parameters are calculated using code provided by Kalaba and Tesfatsion [3] and adapted for the statistical computing language R [31]. Flexible least-squares simulations were undertaken for three-parameter (log(A(T)), n(T) and Eapp(T)) fits to the isobutene evolution during the three temperature-programmed runs. Windows of 20 data points (ca. 33 °C) were fitted then averaged and moved one data point across the full range of temperatures. Optimized temperature-dependent parameters log10(Aapp(T)) from Equation (13) and Eapp(T are plotted against temperature in Figure 1, Figure 2 and Figure 3 and summarized in Table 1, Table 2 and Table 3. Flexible least-squares simulations are a near perfect fit to the wavelet denoised data.
5. Conclusions
Three reaction pathways have been identified in the conversion of isobutane over HZSM-5 during temperature-programmed, steady-state, low-pressure catalysis. These are isobutene desorption from the zeolite surface, isobutane dehydrogenation and isobutene dimerization (or hydrogenation). One site is assigned for desorption, three for dehydrogenation and three for dimerization.
Isobutene desorption is linked to non-specific sites within the zeolite micropores and have average intrinsic rate constants:

For isobutane dehydrogenation the first pathways is assigned to Lewis acid sites or is related to weak hydrogen bonding between C–H and O on the zeolite. The intrinsic rate parameters cover the range:
 The second dehydrogenation pathway is linked to Brønsted acid sites, and the intrinsic rate parameters also cover a broad range:
 The third sites are associated with isobutene evolution at Lewis or Brønsted acid sites within the zeolite micropores. The increase in isobutene pressure immediately follows a period of dimerization or hydrogenation of isobutene. The intrinsic rate constants are:
For isobutene dimerization (or hydrogenation) the rate constants for the first pathway cover a very wide range and are linked to active sites within the HZSM-5 micropores:
 The second dimerization pathway is associated with different active sites again within the HZSM-5 micropores; however in this case the range of the intrinsic parameters is narrow:
 The final dimerization pathway is a sharp fluctuation in apparent rate parameters, similar temperature range, but opposite in sign to the Site-2c peaks. This peak is associated with dimerization or hydrogenation within the zeolite mircopores:
Nomenclature:
| IA(g) and IE(g) | gas-phase isobutane and isobutene |
| S and S* | non-specific sites and acidic sites on the zeolite surface |
| IA-S and IE-S | isobutane and isobutene adsorbed on non-specific sites |
| IA-S*, IE-S* and IE2-S* | isobutane, isobutene and isobutene dimers adsorbed on acidic sites |
| ki and k−i | forward and reverse intrinsic rate constants for reaction Ri |
| kapp | apparent rate constants |
| Ai, A−i and Aapp | intrinsic and apparent prefactors |
| Ei, E−i and Eapp | intrinsic and apparent activation energies (kJ mol−1) |
| Run 1, 2 and 3 | consecutive temperature-programmed, steady-state, low-pressure experiments |
| Site-1, Site-2a, -2b, -2c and Site-3a, -3b, -3c | proposed active sites for desorption, dehydrogenation and dimerization |
| I56 and I58 | mass-spectral abundances for isobutene (m/e = 56) and isobutane (m/e = 58) |
| α56 and α58 | mass-spectral sensitivity factors for isobutene and isobutane |
| kesc1A and kesc1E | Knudsen cell escape rate constants for isobutane and isobutene (s−1) |
| Ah | area of the Knudsen cell escape aperture (mm2) |
| V and T | volume (mm3) of and temperature (K) within the Knudsen cell |
| c and M | mean molecular speed and molar mass of isobutane or isobutene |
| Aesc | Knudsen cell escape rate constant prefactor for isobutane (K−1/2 s−1) |
| yt, ht, bm,t, N: | functions and parameters for time-varying flexible least squares |
Conflicts of Interest
The authors declare no conflict of interest.
References
- Le Minh, C.; Brown, T.C. Rate parameters from low-pressure steady-state protolytic cracking and dehydrogenation of isobutane over zeolite catalysts. Appl. Catal. A 2006, 310, 145–154. [Google Scholar] [CrossRef]
- Yanping, S.; Brown, T.C. Kinetics of isobutane dehydrogenation and cracking over HZSM-5 at low pressures. J. Catal. 2000, 194, 301–308. [Google Scholar] [CrossRef]
- Kalaba, R.; Tesfatsion, L.C. Time-varying linear regression via flexible least squares. Compt. Math. Appl. 1989, 17, 1215–1245. [Google Scholar] [CrossRef]
- Le Minh, C.; Alanazi, A.K.; Miron, D.J.; Brown, T.C. Carbon-carbon bond cleavage and dehydrogenation of isobutane over HZSM-5 at low pressures and temperatures. Catal. Lett. 2012, 142, 1470–1473. [Google Scholar] [CrossRef]
- Miron, D.J.; Kendell, S.M.; Munshi, A.M.; Alanazi, A.K.; Brown, T.C. Time-varying flexible least squares for thermal desorption of gases. Int. J. Chem. Kinet. 2013, 45, 374–386. [Google Scholar] [CrossRef]
- Nieskens, D.L.S.; van Bavel, A.P.; Niemantsverdriet, J.W. The analysis of temperature programmed desorption experiments of systems with lateral interactions; implications of the compensation effect. Surface Sci. 2003, 546, 159–169. [Google Scholar] [CrossRef]
- Budrugeac, P.; Segal, E. Some methodological problems concerning nonisothermal kinetic analysis of heterogeneous solid-gas reactions. Int. J. Chem. Kinet. 2001, 33, 564–573. [Google Scholar] [CrossRef]
- Smit, B.; Maesen, T.L. Molecular simulations of zeolites: Adsorption, diffusion, and shape selectivity. Chem. Rev. 2008, 108, 4125–4184. [Google Scholar] [CrossRef]
- Zhdanov, V.P.; Kasemo, B. Surface restructuring, thermal desorption and kinetic bistability, and chemical waves. J. Stat. Phys. 1998, 90, 79–101. [Google Scholar] [CrossRef]
- Percival, D.B.; Walden, A.T. Wavelet Methods for Time Series Analysis; Cambridge University Press: New York, NY, USA, 2006. [Google Scholar]
- Kulprathipanja, S. Zeolites in Industrial Separation and Catalysis; Wiley-VCH Verlag GmbH & Co. KGaA: Weinheim, Germany, 2010. [Google Scholar]
- Stefanadis, C.; Gates, B.C.; Haag, W.O. Rates of isobutane cracking catalyzed by HZSM-5: The carbonium ion route. J. Mol. Catal. 1991, 67, 363–367. [Google Scholar] [CrossRef]
- Liu, D.; Bhan, A.; Tspatsis, M.; Al Hashimi, S. Catalytic behavior of Brønsted acid sites in MWW and MFI zeolites with dual meso- and microporosity. ACS Catal. 2011, 1, 7–17. [Google Scholar]
- Narbeshuber, T.F.; Brait, A.; Seshan, K.; Lercher, J.A. Dehydrogenation of light alkanes over zeolites. J. Catal. 1997, 172, 127–136. [Google Scholar] [CrossRef]
- Gounder, R.; Iglesia, E. Effects of partial confinement on the specificity of monomolecular alkane reactions for acid sites in side pockets of mordenite. Angew. Chem. Int. Ed. 2010, 49, 808–811. [Google Scholar] [CrossRef]
- Honkela, M.L.; Krause, A.O.I. Kinetic modeling of the dimerization of isobutene. Ind. Eng. Chem. Res. 2004, 43, 3251–3260. [Google Scholar] [CrossRef]
- Honkela, M.L.; Krause, A.O.I. Influence of linear butenes in the dimerization of isobutene. Ind. Eng. Chem. Res. 2005, 44, 5291–5297. [Google Scholar] [CrossRef]
- Talwalkar, S.; Chauhan, M.; Aghalayam, P.; Qi, Z.; Sundmacher, K.; Mahajani, S. Kinetic studies on the dimerization of isobutene with ion-exchange resin in the presence of water as a selectivity enhancer. Ind. Eng. Chem. Res. 2006, 45, 1312–1323. [Google Scholar] [CrossRef]
- Talwalkar, S.; Chauhan, M.; Katariya, A.; Aghalayam, P.; Ivanova, M.; Sundmacher, K.; Mahajani, S. Selectivity engineering with reactive distillation for dimerization of C4 olefins: Experimental and theoretical studies. Ind. Eng. Chem. Res. 2007, 46, 3024–3034. [Google Scholar] [CrossRef]
- Hauge, K.; Bergene, E.; Chen, D.; Fredriksen, G.R.; Holmen, A. Oligomerization of isobutene over solid acid catalysts. Catal. Today 2005, 100, 463–466. [Google Scholar] [CrossRef]
- Gounder, R.; Iglesia, E. Catalytic hydrogenation of alkenes on acidic zeolites: Mechanistic connections to monomolecular alkane dehydrogenation reactions. J. Catal. 2011, 277, 36–45. [Google Scholar] [CrossRef]
- Milas, I.; Nascimento, M.A.C. The dehydrogenation and cracking reactions of isobutane over the ZSM-5 zeolite. Chem. Phys Lett. 2003, 373, 379–384. [Google Scholar] [CrossRef]
- Zheng, B.; Blowers, P. Reactivity of isobutane on zeolites: A first principles study. J. Phys. Chem. A 2006, 110, 2455–2460. [Google Scholar] [CrossRef]
- Mota, C.J.A.; Bhering, D.L.; Ramirez-Solis, A. Activation of alkanes on zeolites: A DFT study of hydride abstraction and dehrydrogenation on extra-framework aluminium species. Int. J. Quantum Chem. 2005, 105, 174–185. [Google Scholar] [CrossRef]
- Milas, I.; Silva, A.M.; Nascimento, A.C. A density functional study on the nature of the adsorption complex between isobutane and H-ZSM5 and its implication for the mechanism of activation of alkane molecules over H-ZSM5. Appl. Catal. A 2008, 336, 17–22. [Google Scholar] [CrossRef]
- Weitkamp, J.; Hunger, M. Acid and base catalysis on zeolites. In Studies in Surface Science and Catalysis; Čejka, J., van Bekkum, H., Corma, A., Schüth, F., Eds.; Elsevier: Amsterdam, The Netherlands, 2007; Volume 168, pp. 787–835. [Google Scholar]
- Golden, D.M.; Spokes, G.N.; Benson, S.W. Very low-pressure pyrolysis (VLPP); A versatile kinetic tool. Angew. Chem. Int. Ed. 1973, 12, 534–546. [Google Scholar] [CrossRef]
- Hufton, J.R.; Ruthven, D.M.; Danner, R.P. Adsorption and diffusion of hydrocarbons in silicalite at very low concentration: Effect of defect sites. Microporous Mater. 1995, 5, 39–52. [Google Scholar] [CrossRef]
- Saravanan, C.; Auerbach, S.M. Modelling the concentration of diffusion in zeolites. 1. Analytical theory for benzene in Na-Y. Chin. J. Chem. Phys. 1997, 107, 8120–8131. [Google Scholar] [CrossRef]
- Truitt, M.J.; Toporek, S.S.; Rovira-Truitt, R.; White, J.L. Alkane C–H bond activation in zeolites: Evidence for direct protium exchange. J. Am. Chem. Soc. 2006, 128, 1847–1852. [Google Scholar] [CrossRef]
- R Core Team. R: A Language and Environment for Statistical Computing; R Foundation for Statistical Computing: Vienna, Austria, 2012. [Google Scholar]
- Nason, G. Wavethresh: Wavelet Statistics and Transforms, R package version 4.6.2.; Available online: http://cran.r-project.org/web/packages/wavethresh/index.html (accessed on 2 April 2013).
- Kalaba, R.; Tesfatsion, L. A Multicriteria approach to model specification and estimation. Comput. Stat. Data Anal. 1996, 21, 193–214. [Google Scholar] [CrossRef]
- Montana, G.; Triantafyllopoulos, K.; Tsagaris, T. Flexible least squares for temporal data mining and statistical arbitrage. Expert Syst. Appl. 2009, 36, 2819–2830. [Google Scholar] [CrossRef]
© 2013 by the authors; licensee MDPI, Basel, Switzerland. This article is an open access article distributed under the terms and conditions of the Creative Commons Attribution license (http://creativecommons.org/licenses/by/3.0/).