
Cu/Zn/Zr/Ga Catalyst for Utilisation of Carbon Dioxide to Methanol—Kinetic Equations


Abstract
:
1. Introduction
2. Results and Discussion
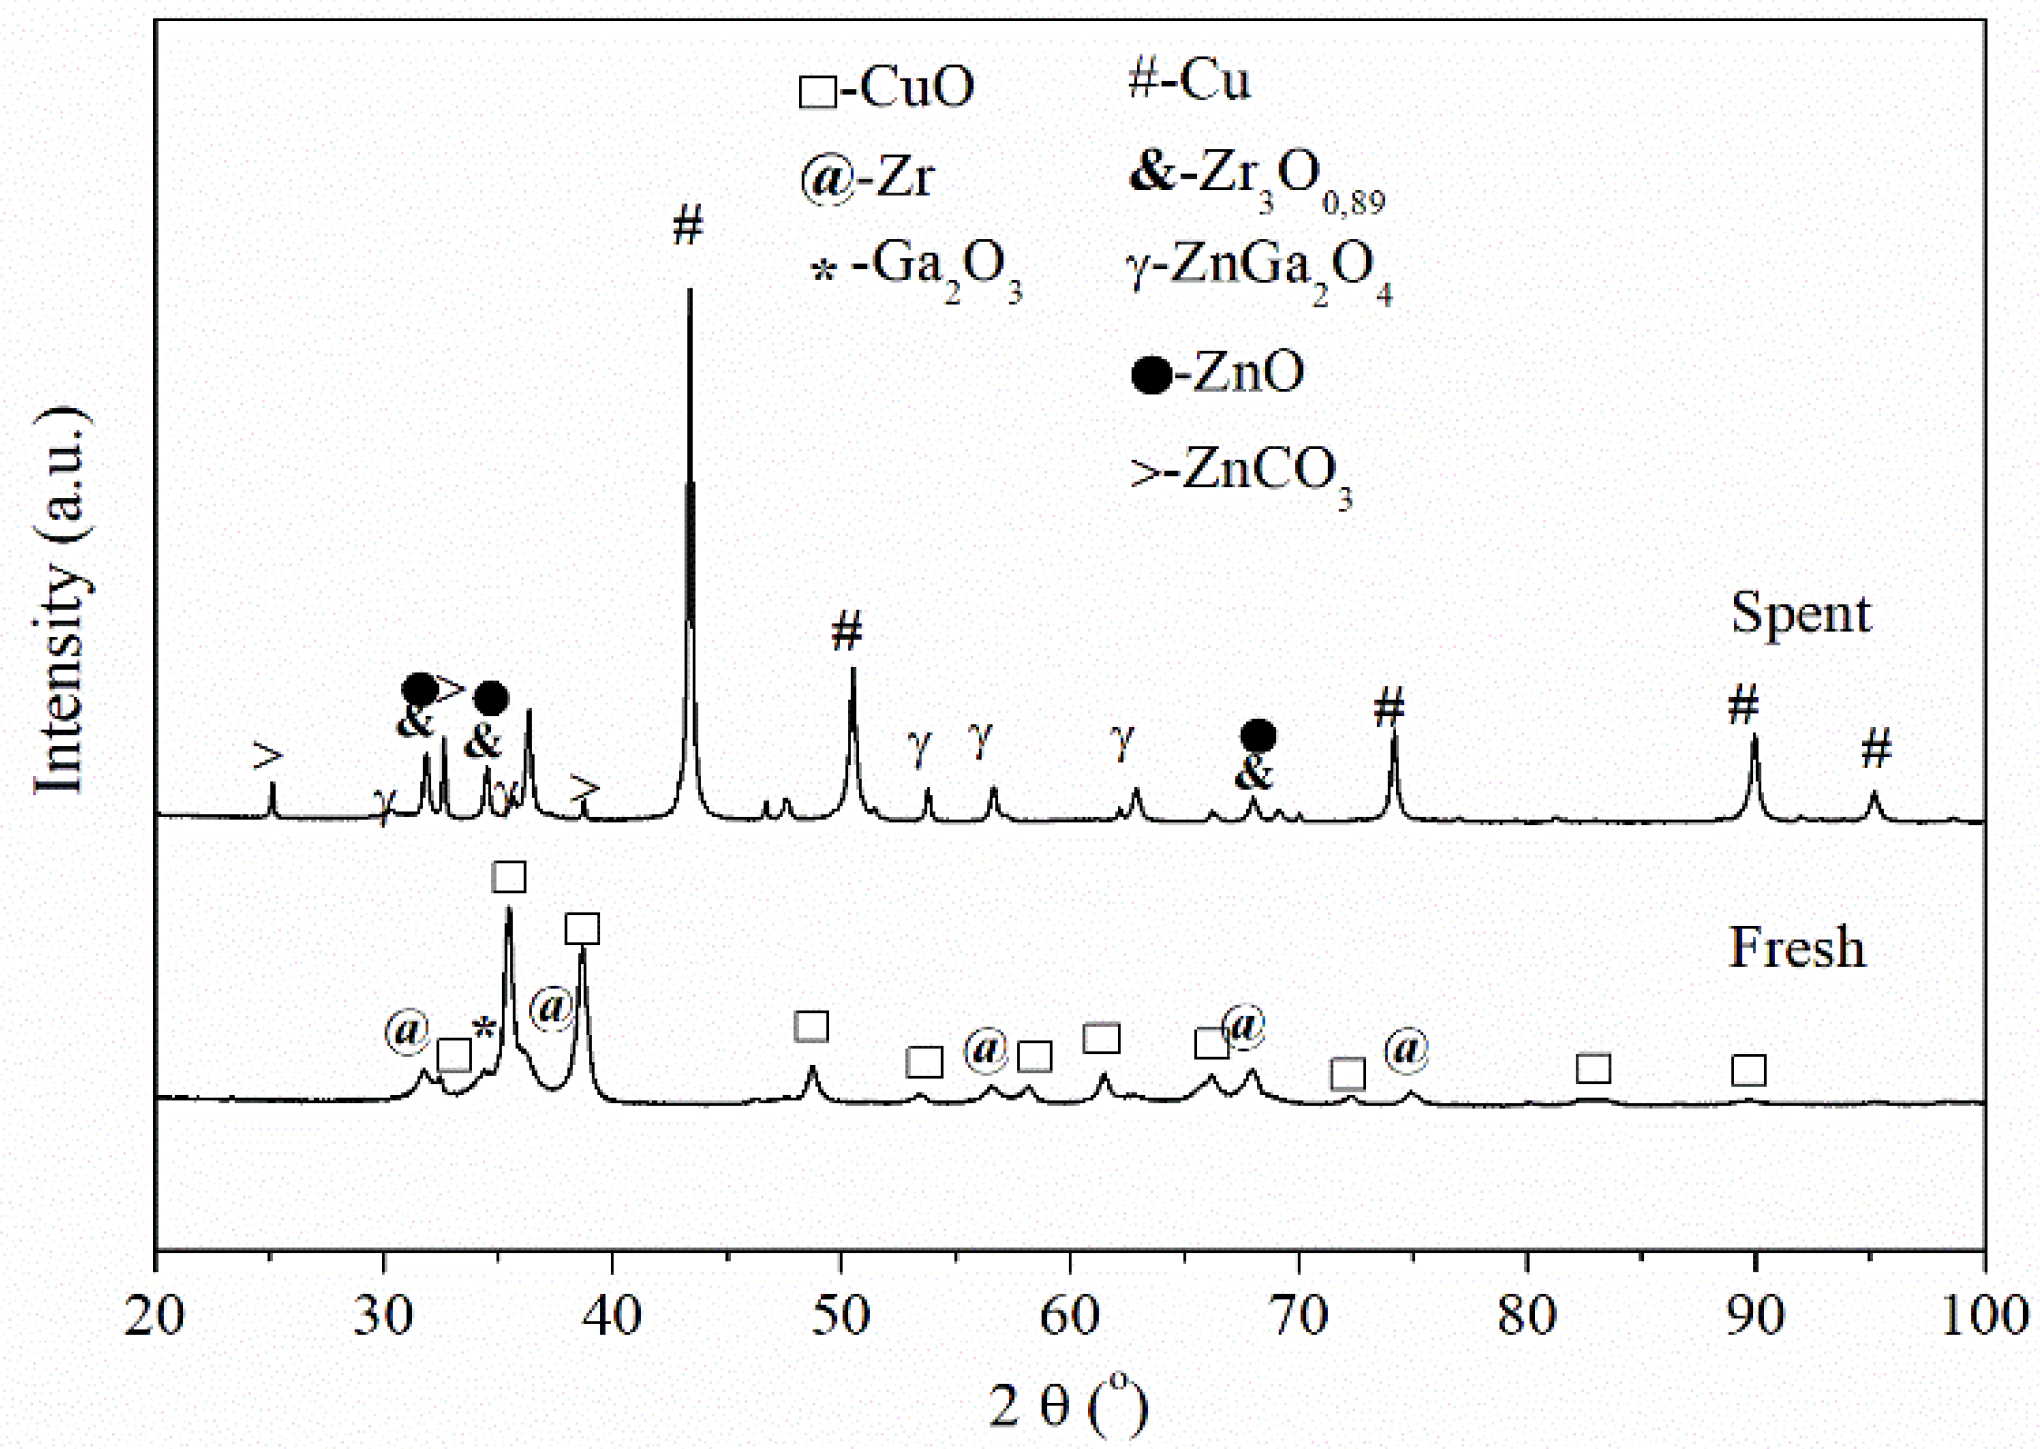
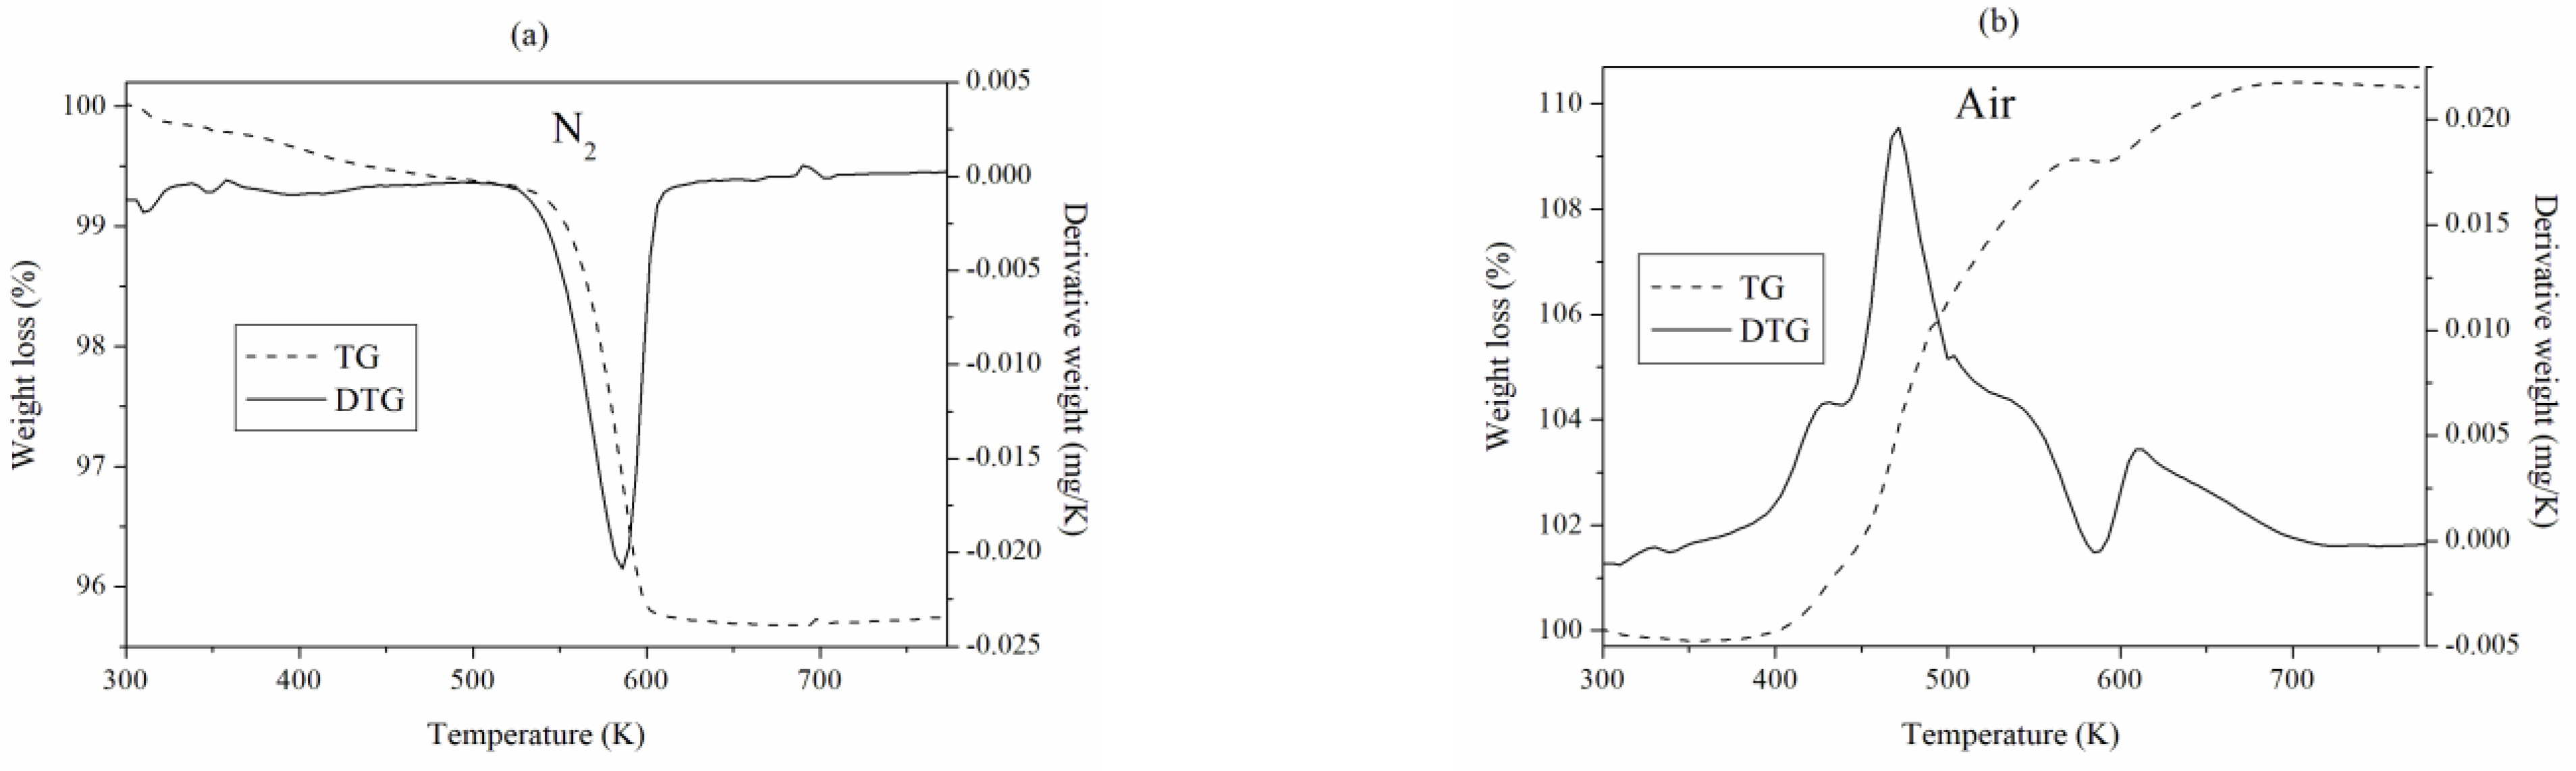
2.1. Characteristics of the Catalyst
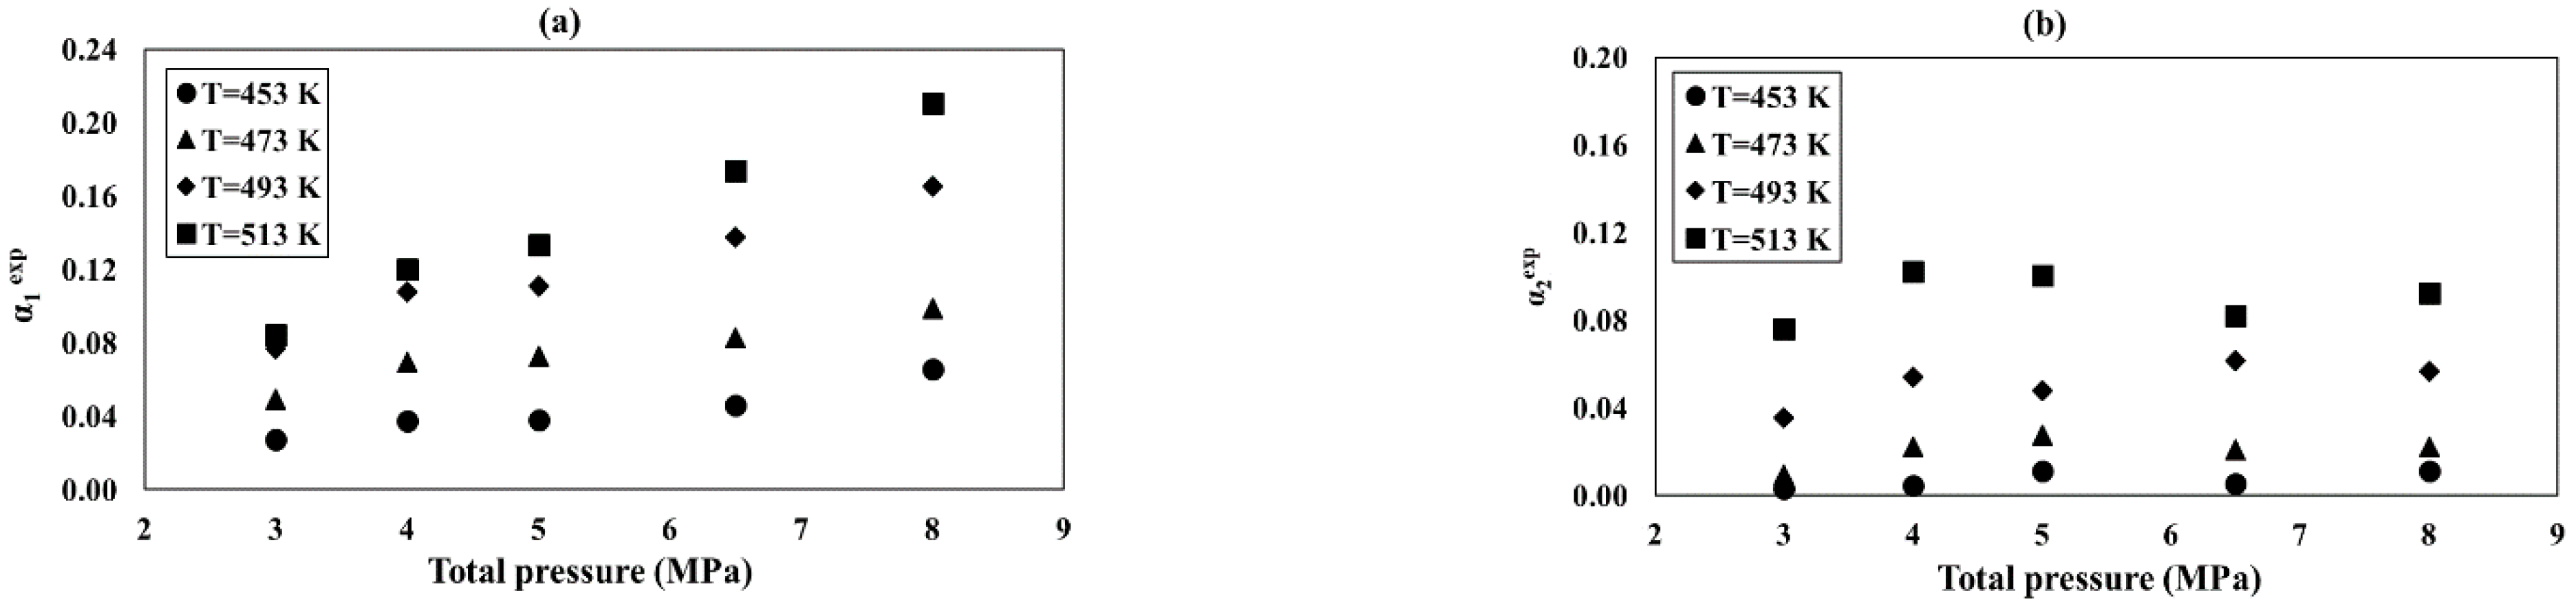
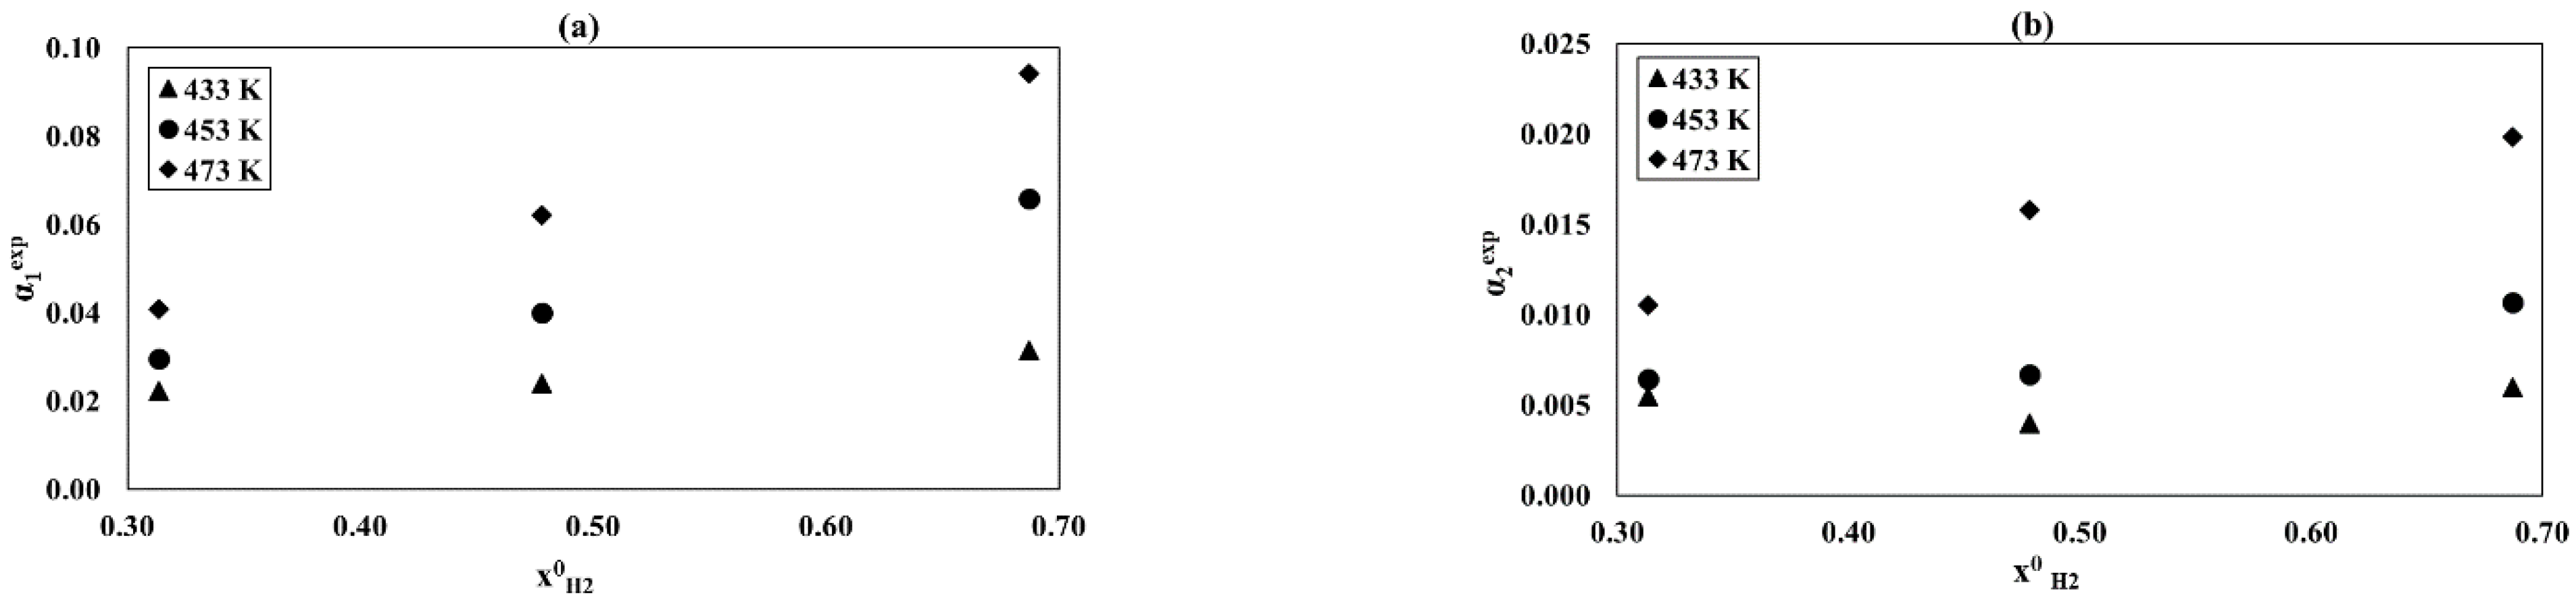
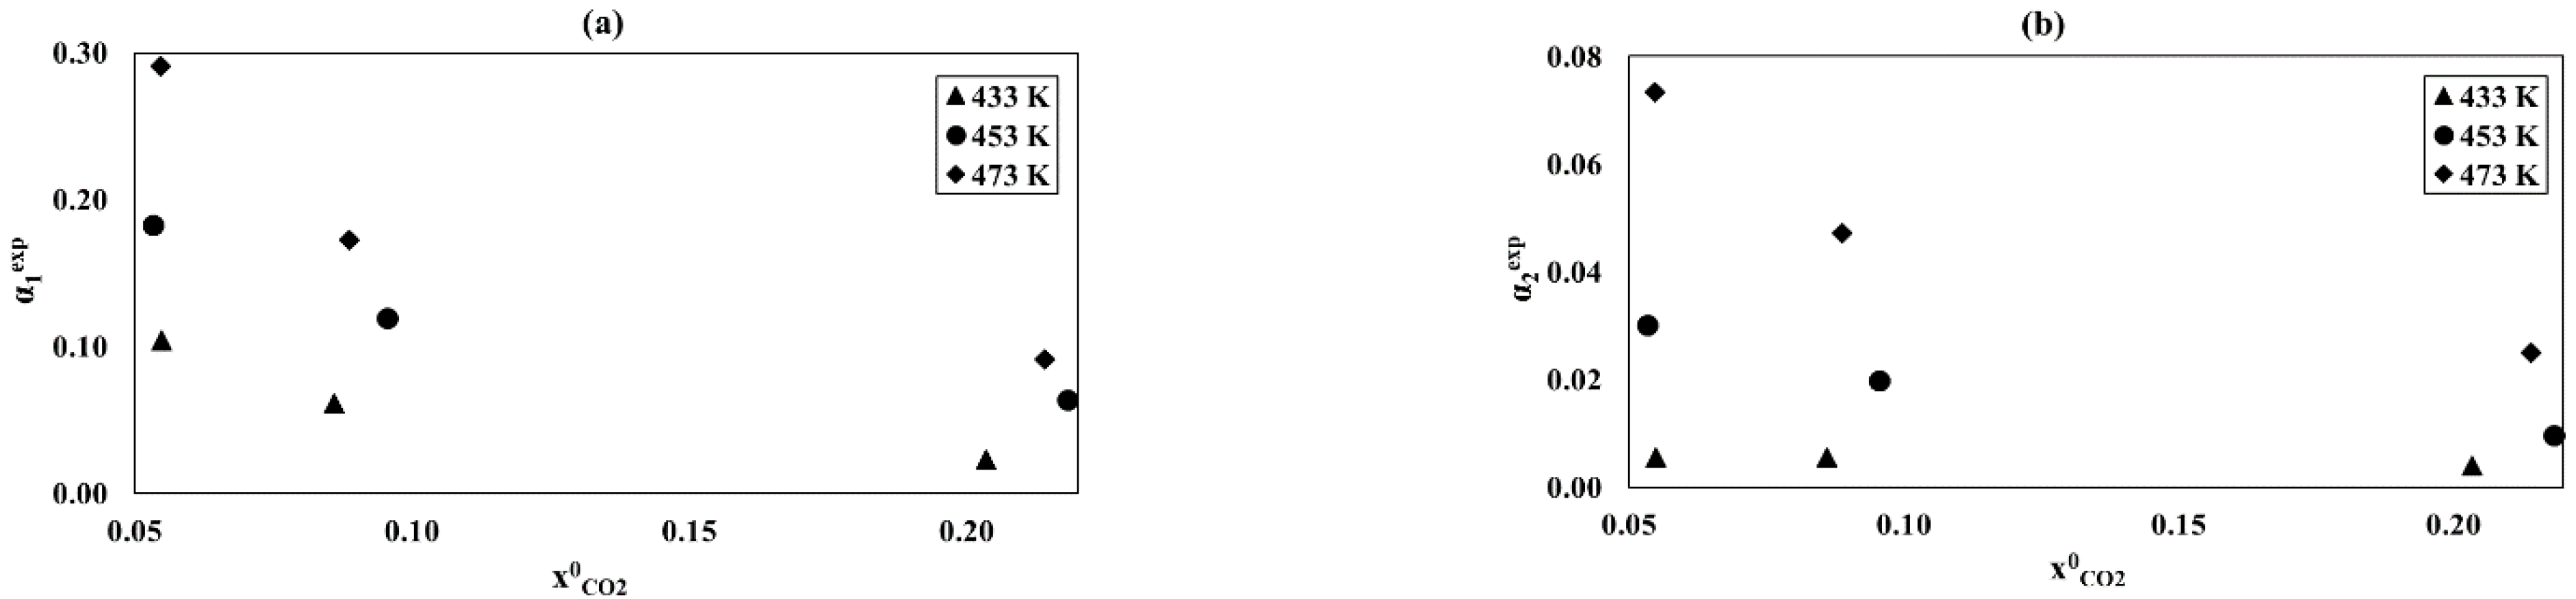
2.2. KineticsTests
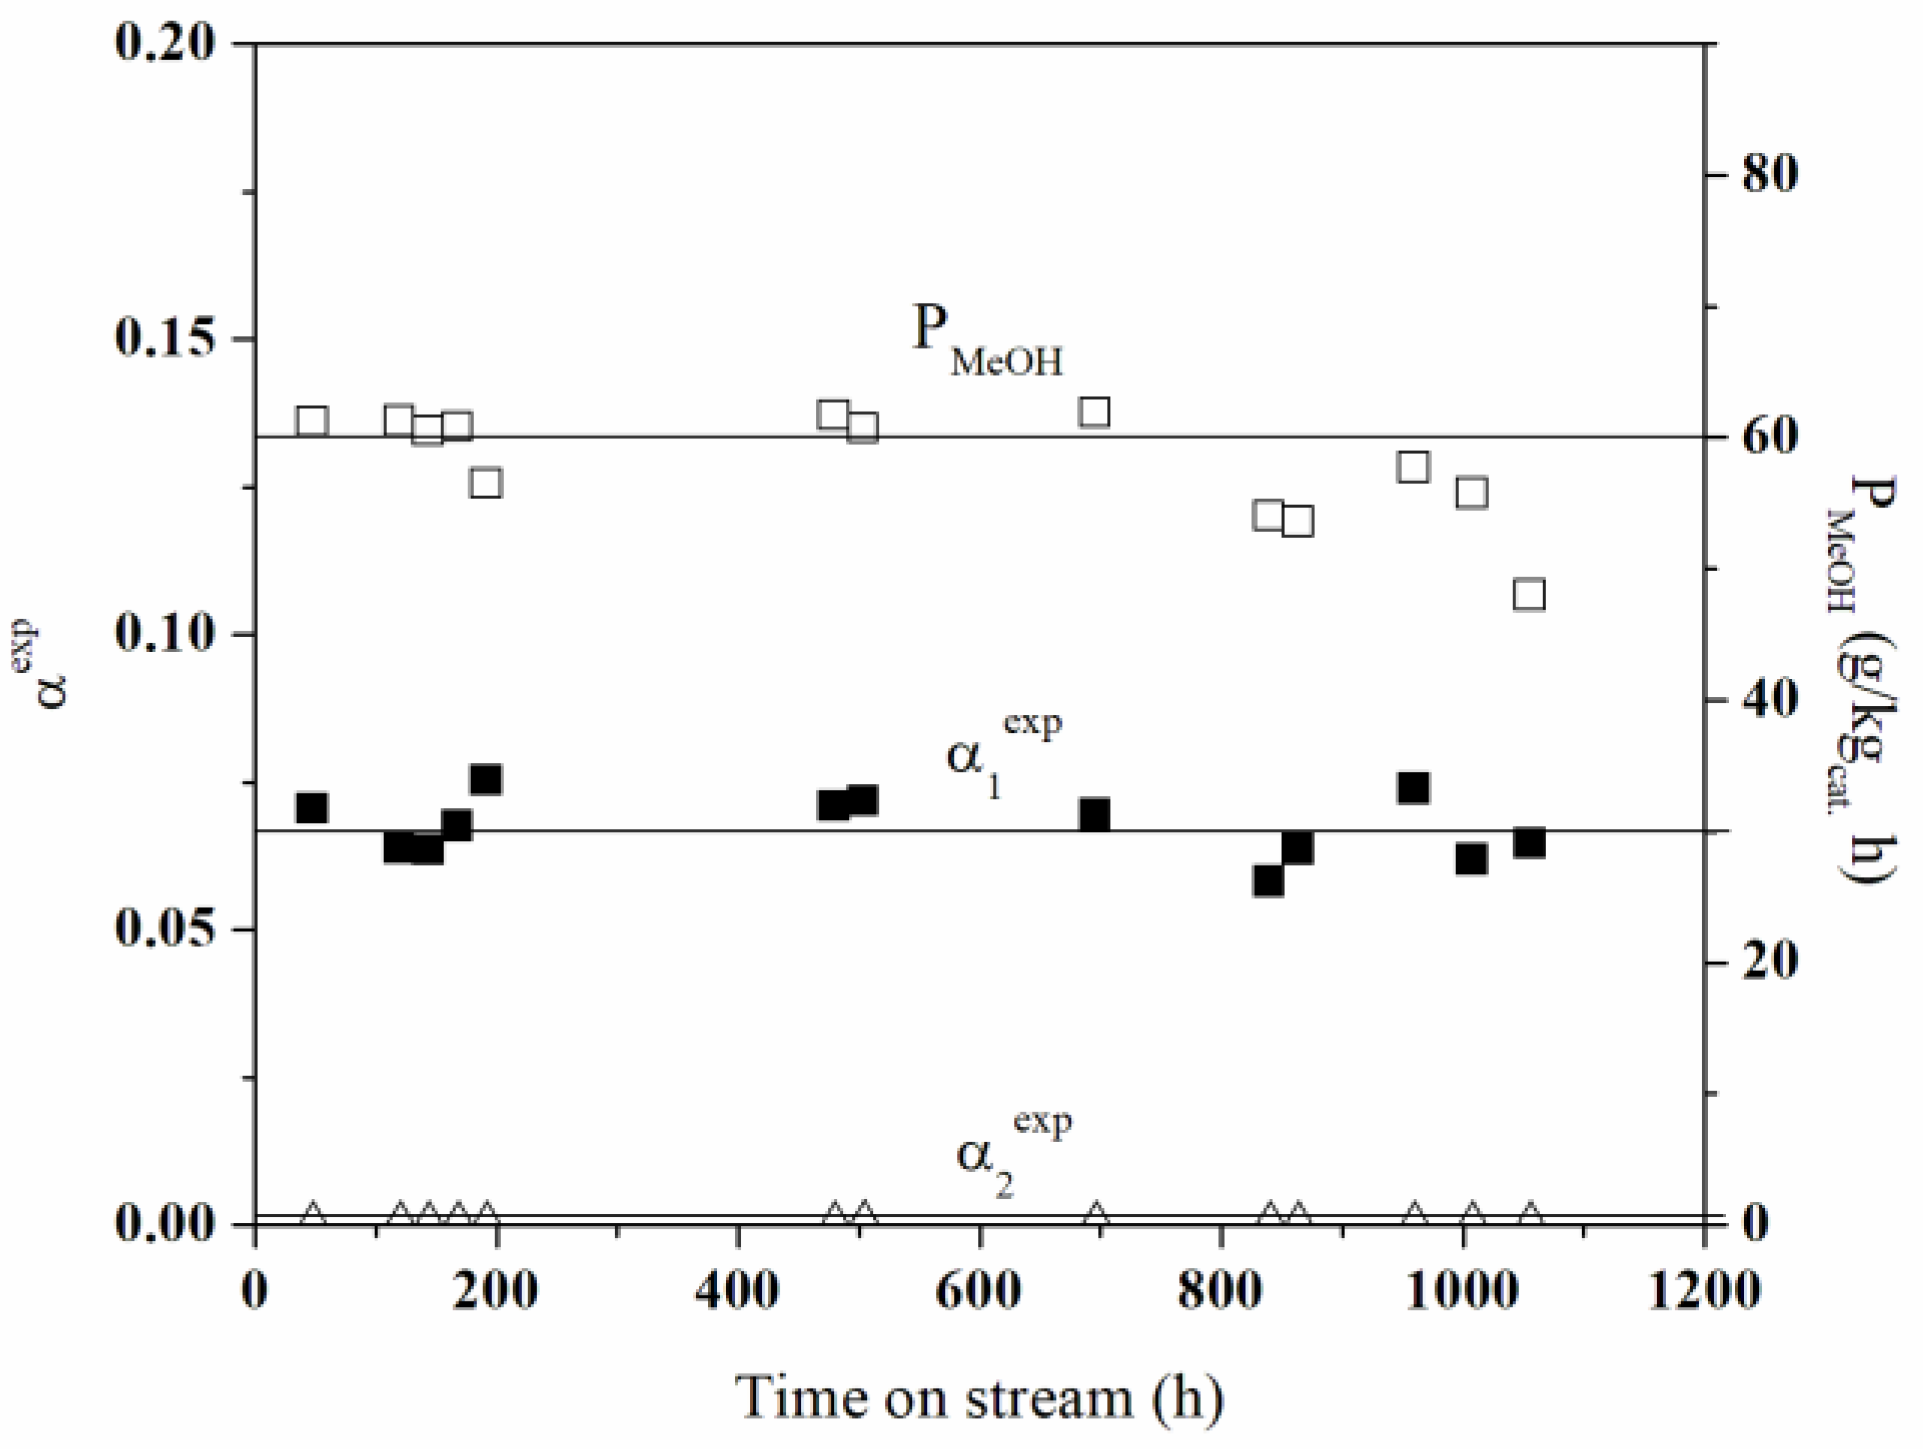
2.3. Stability
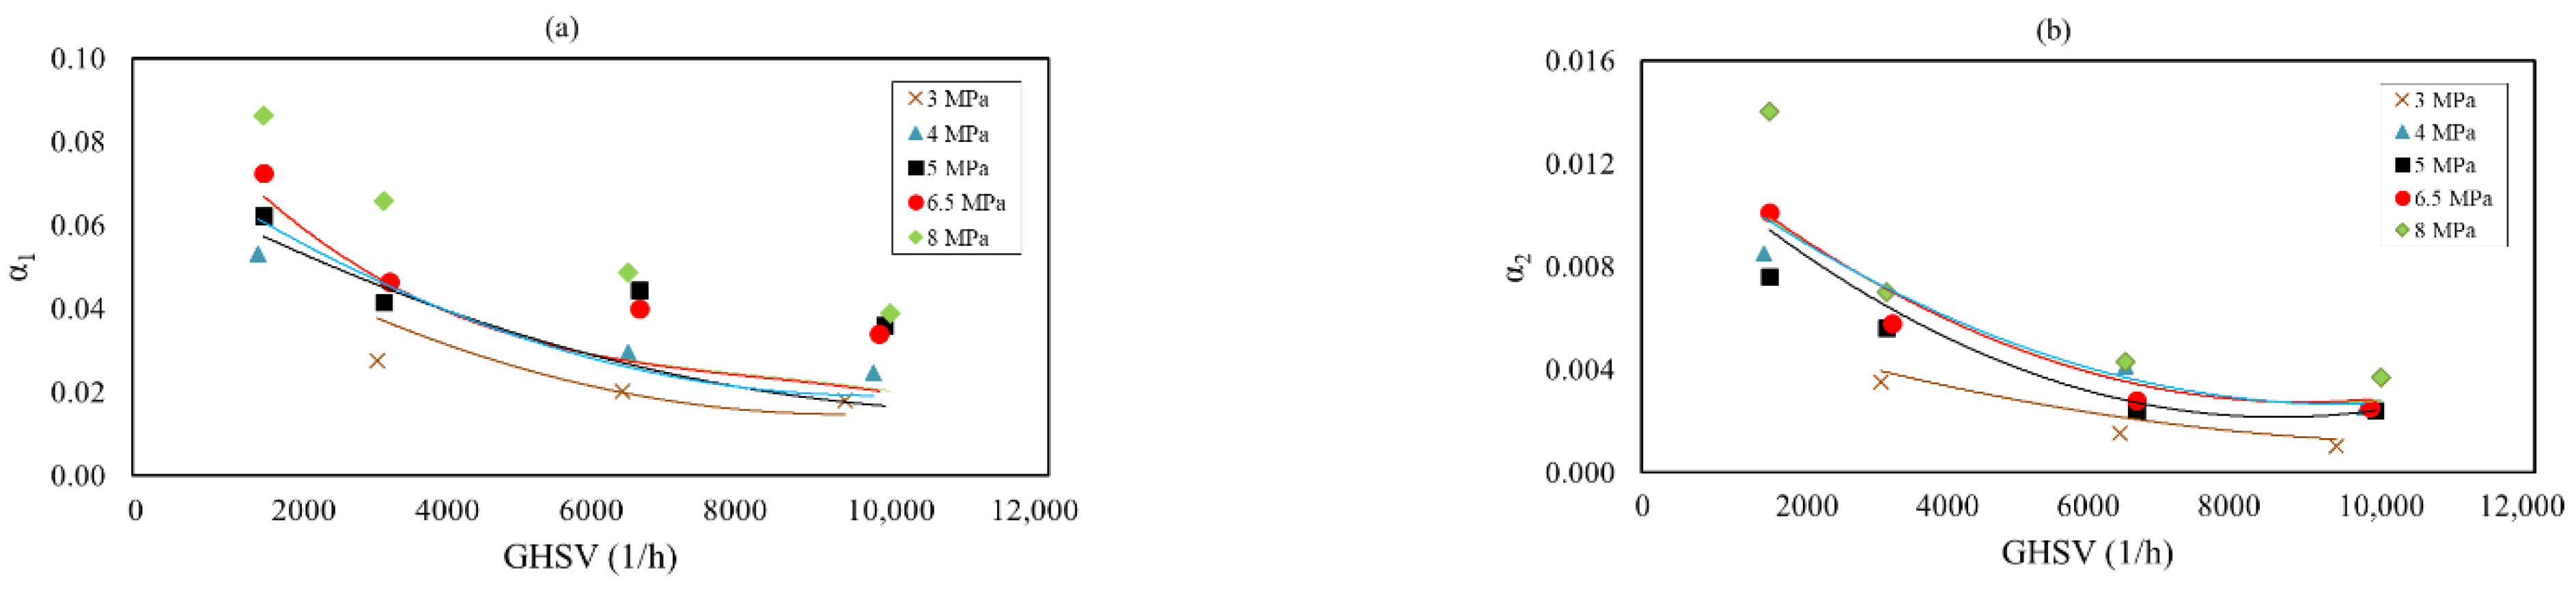
2.4. Kinetic Equations
3. Materials and Methods
3.1. Materials
3.2. Catalyst Preparation
3.3. Catalysts Characterization
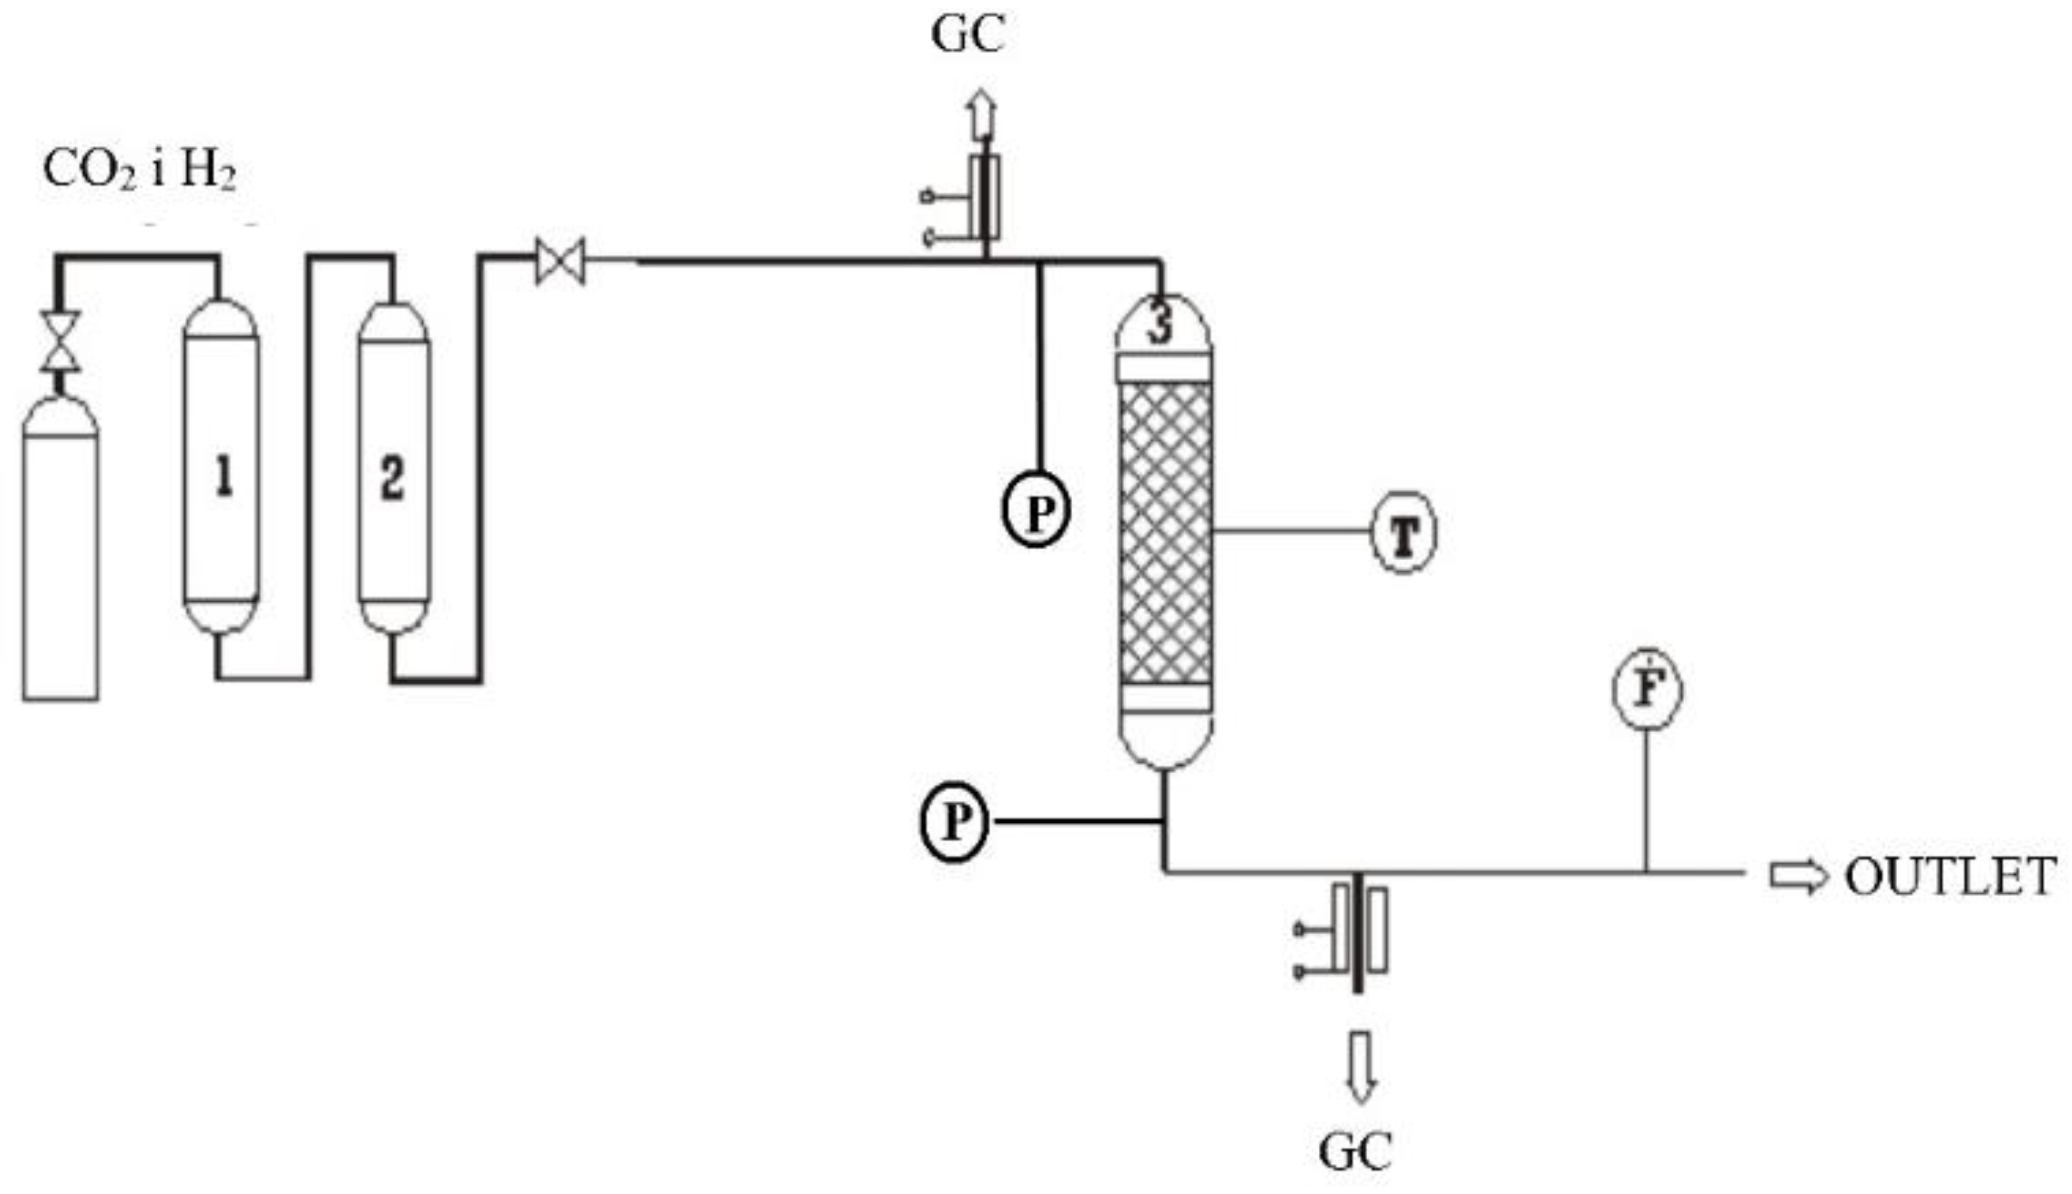
3.4. Kinetic Tests
4. Summary
Author Contributions
Funding
Data Availability Statement
Conflicts of Interest
Nomenclature
| A | total number of chemical reactions, A = 2 (Equation (15)) |
| B | total number of measurement points, B = 59 (Equation (15)) |
| E | activation energy of reaction n, J/mol |
| molar flow rate of reactant i, mol/h | |
| GHSV | gas hourly space velocity, 1/h |
| ko | pre-exponential factor of reaction n |
| K0 | initial adsorption constant of reactant i, 1/MPa |
| M | molar mass, g/mol |
| m | mass of catalyst, g |
| p | pressure, Pa |
| R | ideal gas constant, 8.314 J/mol·K |
| T | temperature, K |
| Tot | Total |
| x | mole fraction of reactanti |
| Greek symbols | |
| Δh | reaction enthalpy, J/mol |
| ΔH | adsorption enthalpy of reactanti, J/mol |
| τ | spacetime |
| superscripts | |
| 0 | initial state |
| a, b | exponents in the kinetic equations (sorption group) |
| cal | calculated value |
| exp | experimental value |
| subscripts | |
| 1 | first reaction |
| 2 | second reaction |
| ads | adsorption |
| c | total mass or pressure |
| cat. | catalyst |
| des | desorption |
| i | reactanti = CO2, H2, CO, CH3OH, H2O |
| j | number of reaction (1 or 2) in Equation (15) |
| l | numberof measuring points in Equation (15) |
| MeOH | methanol |
| n | reaction n (1 or 2) |
References
- Murthy, P.S.; Liang, W.; Jiang, Y.; Huang, J. Cu-Based Nanocatalysts for CO2 Hydrogenation to Methanol. Energy Fuels 2021, 35, 8558–8584. [Google Scholar] [CrossRef]
- Samimi, F.; Rahimpour, M.R.; Shariati, A. Development of an Efficient Methanol Production Process for Direct CO2 Hydrogenation over a Cu/ZnO/Al2O3 Catalyst. Catalysts 2017, 7, 332. [Google Scholar] [CrossRef] [Green Version]
- Wei, X.; Cao, S.; Wei, S.; Liu, S.; Wang, Z.; Dai, F.; Lu, X. Theoretical investigation on electrocatalytic reduction of CO2 to methanol and methane by bimetallic atoms TM1/TM2-N@Gra (TM = Fe, Co, Ni, Cu). Appl. Surf. Sci. 2022, 593, 153377–153386. [Google Scholar] [CrossRef]
- Siakavelas, G.I.; Charisiou, N.D.; AlKhoori, A.; AlKhoori, S.; Sebastian, V.; Hinder, S.J.; Baker, M.A.; Yentekakis, I.V.; Polychronopoulou, K.; Goula, M.A. Highly selective and stable Ni/La-M (M = Sm, Pr, and Mg)-CeO2 catalysts for CO2 methanation. J. CO2 Util. 2021, 51, 101618–101638. [Google Scholar] [CrossRef]
- Liu, K.; Xu, X.; Xu, J.; Fang, X.; Liu, L.; Wang, X. The distributions of alkaline earth metal oxides and their promotional effects on Ni/CeO2 for CO2 methanation. J. CO2 Util. 2020, 38, 113–124. [Google Scholar] [CrossRef]
- Shinde, G.Y.; Mote, A.S.; Gawande, M.B. Recent Advances of Photocatalytic Hydrogenation of CO2 to Methanol. Catalylsts 2022, 12, 94. [Google Scholar] [CrossRef]
- Xu, D.; Hong, X.; Liu, G. Highly dispersed metal doping to ZnZr oxide catalyst for CO2 hydrogenation to methanol: Insight into hydrogen spillover. J. Catal. 2021, 393, 207–214. [Google Scholar] [CrossRef]
- Stawowy, M.; Ciesielski, R.; Maniecki, T.; Matus, K.; Łużny, R.; Trawczynski, J.; Silvestre-Albero, J.; Łamacz, A. CO2 Hydrogenation to Methanol over Ce and Zr Containing UiO-66 and Cu/UiO-66. Catalysts 2020, 10, 39. [Google Scholar] [CrossRef] [Green Version]
- Dalena, F.; Senatore, A.; Marino, A.; Gordano, A.; Basile, M.; Basile, A. The Science and Engineering of Methanol; Basile, A., Dalena, F., Eds.; Elsevier: Amsterdam, The Netherlands, 2017; Chapter 1; pp. 3–28. [Google Scholar]
- Gómeza, D.; Candia, C.; Jiménez, R.; Karelovic, A. Isotopic transient kinetic analysis of CO2 hydrogenation to methanol on Cu/SiO2 promoted by Ga and Zn. J. Catal. 2022, 406, 96–106. [Google Scholar] [CrossRef]
- Stangeland, K.; Navarro, H.H.; Huynh, H.L.; Tucho, W.M.; Yu, Z. Tuning the interfacial sites between copper and metal oxides (Zn, Zr, In) for CO2 hydrogenation to methanol. Chem. Eng. Sci. 2021, 238, 116603. [Google Scholar] [CrossRef]
- Fujitani, T. Enhancement of the Catalytic Performance and Active Site Clarification of Cu/ZnO Based Catalysts for Methanol Synthesis by CO2 Hydrogenation. J. Jpn. Pet. Inst. 2020, 63, 43–51. [Google Scholar] [CrossRef] [Green Version]
- Witoon, T.; Numpilai, T.; Phongamwong, T.; Donphai, W.; Boonyuen, C.; Warakulwit, C.; Chareonpanich, M.; Limtrakul, J. Enhanced activity, selectivity and stability of a CuO-ZnO-ZrO2 catalyst by adding graphene oxide for CO2 hydrogenation to methanol. Chem. Eng. J. 2018, 334, 1781–1791. [Google Scholar] [CrossRef]
- Chang, K.; Wang, T.; Chen, J.G. Hydrogenation of CO2 to methanol over CuCeTi-Ox catalysts. Appl. Catal. B Environ. 2017, 206, 704–711. [Google Scholar] [CrossRef]
- Alias, M.S.; Kamarudin, S.K.; Zainoodin, A.M.; Masdar, M.S. Active direct methanol fuel cell: An overview. Int. J. Hydrogen Energy 2020, 45, 19620–19641. [Google Scholar] [CrossRef]
- Natesakhawat, S.; Lekse, J.W.; Baltrus, J.P.; Ohodnicki, P.R., Jr.; Howard, B.H.; Deng, X.; Matranga, C. Active Sites and Structure−Activity Relationships of Copper-Based Catalysts for Carbon Dioxide Hydrogenation to Methanol. ACS Catal. 2012, 2, 1667−1676. [Google Scholar] [CrossRef]
- Dana, M.S.; Emeric, S.; Ómar, S. Process Advantages of Direct CO2 to Methanol Synthesis. Front. Chem. 2018, 6, 446–453. [Google Scholar] [CrossRef]
- Ushikoshi, K.; Moria, K.; Watanabe, T.; Takeuchi, M.; Saito, M. A 50 kg/day class test plant for methanol synthesis from CO2and H2. Stud. Surf. Sci. Catal. 1998, 114, 357–362. [Google Scholar] [CrossRef]
- Production of Renewable Methanol from Captured Emissions and Renewable Energy Sources, for Its Utilisation for Clean Fuel Production and Green Consumer Goods. Available online: https://cordis.europa.eu/project/id/848757 (accessed on 21 January 2022).
- Methanol Production Capacity May Quintuple on Decarbonized Industry Transformation: Study. Available online: https://cleanenergynews.ihsmarkit.com/research-analysis/methanol-production-capacity-may-quintuple-on-decarbonized-ind.html (accessed on 21 January 2022).
- Goehna, H.; Koenig, P. Producing methanol from CO2. Chemtech 1994, 24, 36–38. [Google Scholar]
- Herman, R.G.; Klier, K.; Simmons, G.W.; Finn, B.P.; Bulko, J.B.; Kobylinski, T.P. Catalytic synthesis of methanol from COH2: I. Phase composition, electronic properties, and activities of the Cu/ZnO/M2O3 catalysts. J. Catal. 1979, 56, 407–429. [Google Scholar] [CrossRef]
- Brown, N.J.; Weiner, J.; Hellgardt, K.; Shaffer, M.S.P.; Williams, C.K. Phosphinate stabilized ZnO and Cu colloidal nanocatalysts for CO2 hydrogenation to methanol. Chem. Commun. 2013, 49, 11074–11076. [Google Scholar] [CrossRef] [Green Version]
- Richard, A.R.; Fan, M. Rare earth elements: Properties and applications to methanol synthesis catalysis via hydrogenation of carbon oxides. J. Rare Earth. 2018, 36, 1127–1135. [Google Scholar] [CrossRef]
- Spadaro, L.; Palella, A.; Arena, F. Totally-green Fuels via CO2 Hydrogenation. Bull. Chem. React. Eng. Catal. 2020, 15, 390–404. [Google Scholar] [CrossRef]
- Arena, F.; Barbera, K.; Italiano, G.; Bonura, G.; Spadaro, L.; Frusteri, F. Synthesis, characterization and activity pattern of Cu–ZnO/ZrO2catalysts in the hydrogenation of carbon dioxide to methanol. J. Catal. 2007, 249, 185–194. [Google Scholar] [CrossRef]
- Din, U.; Shaharun, M.S.; Subbarao, D.; Naeem, A.; Hussain, F. Influence of niobium on carbon nanofibres based Cu/ZrO2 catalysts for liquid phase hydrogenation of CO2 to methanol. Catal. Today 2016, 259, 303–311. [Google Scholar] [CrossRef]
- Huang, X.; Ma, L.; Wainwright, M.S. The influence of Cr, Zn and Co additives on the performance of skeletal copper catalysts for methanol synthesis and related reactions. Appl. Catal. A Gen. 2004, 257, 235–243. [Google Scholar] [CrossRef]
- Fujitani, T.; Saito, M.; Kanai, Y.; Takeuchi, M.; Moria, K.; Watanabe, T.; Kawai, M.; Kakumoto, T. Methanol Synthesis from CO2 and H2 over Cu/ZnO/Ga2O3Catalyst. Chem. Lett. 1993, 22, 1079–1080. [Google Scholar] [CrossRef]
- Li, C.M.; Yuan, X.D.; Fujimoto, K. Development of highly stable catalyst for methanol synthesis from carbon dioxide. Appl. Catal. A Gen. 2014, 469, 306–311. [Google Scholar] [CrossRef]
- Słoczyński, J.; Grabowski, R.; Olszewski, P.; Kozłowska, A.; Stoch, J.; Lachowska, M.; Skrzypek, J. Effect of metal oxide additives on the activity and stability of Cu/ZnO/ZrO2 catalysts in the synthesis of methanol from CO2 and H2. Appl. Catal. A Gen. 2006, 310, 127–137. [Google Scholar] [CrossRef]
- Ban, H.Y.; Li, C.M.; Asami, K.; Fujimoto, K. Influence of rare-earth elements (La, Ce, Nd and Pr) on the performance of Cu/Zn/Zr catalyst for CH3OH synthesis from CO2. Catal. Commun. 2014, 54, 50–54. [Google Scholar] [CrossRef]
- Hamryszak, Ł.; Madej-Lachowska, M.; Grzesika, M.; Kocot, K.; Ruggiero-Mikołajczyk, M. Wpływ dodatku Ce, Cr i/lub Ga do katalizatora Cu/Zn/Zr na syntezę metanolu z ditlenku węgla i wodoru. Przem. Chem. 2019, 98, 133–137. [Google Scholar] [CrossRef]
- Madej-Lachowska, M.; Kasprzyk-Mrzyk, A.; Lachowski, A.; Wyżgoł, H. Synteza metanolu z ditlenku węgla i wodoru na bazie katalizatora CuO/ZnO/ZrO2 z dodatkami. Chemik 2014, 68, 61–64. [Google Scholar]
- Ladera, R.; Pérez-Alonso, F.J.; González-Carballo, J.M.; Ojeda, M.; Rojas, S.; Fierro, J.L.G. Catalyticvalorization of CO2 via metanol synthesis with Ga-promoted Cu–ZnO–ZrO2catalysts. Appl. Catal. B Environ. 2013, 142–143, 241–248. [Google Scholar] [CrossRef]
- Graaf, G.H.; Stamhuis, E.J.; Beenackers, A.A.C.M. Kinetics of low-pressure methanol synthesis. Chem. Eng. Sci. 1988, 43, 3185–3195. [Google Scholar] [CrossRef]
- Malinovskaya, O.A.; Rozovskii, A.Y.; Zolotarskii, I.A.; Lender, Y.V.; Matros, Y.S.; Lin, G.I.; Dubovich, G.V.; Popova, N.A.; Savostina, N.V. Synthesis of methanol on Cu-based catalyst: Kinetic model. React. Kinet. Catal. Lett. 1987, 34, 87. [Google Scholar] [CrossRef]
- Skrzypek, J.; Lachowska, M.; Moroz, H. Kinetics of methanol synthesis over commercial copper/zinc oxide/alumina catalysts. Chem. Eng. Sci. 1991, 46, 2809–2813. [Google Scholar] [CrossRef]
- VandenBussche, K.M.; Froment, G.F. A Steady-State Kinetic Model for Methanol Synthesis and the Water Gas Shift Reaction on a Commercial Cu/ZnO/Al2O3 Catalyst. J. Catal. 1996, 161, 1–10. [Google Scholar] [CrossRef]
- Kubota, T.; Hayakawa, I.; Mabuse, H.; Mori, K.; Ushikoshi, K.; Watanabe, T. Kinetic study of methanol synthesis from carbon dioxide and hydrogen. Appl. Organomet. Chem. 2001, 15, 121–126. [Google Scholar] [CrossRef]
- Portha, J.-F.; Parkhomenko, K.; Kobl, K.; Roger, A.-C.; Arab, S.; Commenge, J.-M.; Falk, L. Kinetics of Methanol Synthesis from Carbon Dioxide Hydrogenation over Copper−Zinc Oxide Catalysts. Ind. Eng. Chem. Res. 2017, 56, 13133–13145. [Google Scholar] [CrossRef]
- Marcos, F.C.F.; Cavalcanti, F.M.; Petrolini, D.D.; Lin, L.; Betancourt, L.E.; Senanayake, S.D.; Rodriguez, J.A.; Assaf, J.M.; Giudici, R.; Assaf, E.M. Effect of operating parameters on H2/CO2 conversion to methanol over Cu-Zn oxide supported on ZrO2 polymorph catalysts: Characterization and kinetics. Chem. Eng. J. 2022, 427, 130947–130961. [Google Scholar] [CrossRef]
- Natesakhawat, S.; Ohodnicki, P.R., Jr.; Howard, B.H.; Lekse, J.W.; Baltrus, J.P.; Matranga, C. Adsorption and deactivation characteristics of Cu/ZnO-based catalysts for methanol synthesis from carbon dioxide. Top. Catal. 2013, 56, 1752–1763. [Google Scholar] [CrossRef]
- Zhong, C.; Guo, X.; Mao, D.; Wang, S.; Wu, G.; Lu, G. Effects of alkaline-earth oxides on the performance of a CuO–ZrO2 catalyst for methanol synthesis via CO2 hydrogenation. RSC Adv. 2015, 5, 52958–52965. [Google Scholar] [CrossRef]
- Smyrnioti, M.; Tampaxis, C.; Steriotis, T.; Ioannidesa, T. Study of CO2 adsorption on a commercial CuO/ZnO/Al2O3 catalyst. Catal. Today 2020, 357, 495–502. [Google Scholar] [CrossRef]
- Śliwa, M.; Socha, R. Modification of CuO–ZrO2–ZnO Mixed Oxide Catalyst with Mn, Ga, Ni: Impact on Physicochemical Properties and Hydrogen Production via Low Temperature Steam Reforming of Ethanol. Catal. Lett. 2022. [Google Scholar] [CrossRef]
- Zhang, S.; Fortier, H.; Dahn, J.R. Characterization of zinc carbonate hydroxides synthesized by precipitation from zinc acetate and potassium carbonate solutions. Mater. Res. Bull. 2004, 39, 1939–1948. [Google Scholar] [CrossRef]
- Zhao, Y.; Li, Y.; He, Z.; Yan, Z. Facile preparation of Cu/Cu2O nanoporous nanoparticles as a potential catalyst for non-enzymatic glucose sensing. RSC Adv. 2013, 3, 2178–2181. [Google Scholar] [CrossRef]
- Wang, G.; Mao, D.; Guo, X.; Yu, J. Enhanced performance of the CuO-ZnO-ZrO2 catalyst for CO2 hydrogenation to methanol. By WO3 modification. Appl. Surf. Sci. 2018, 456, 403–409. [Google Scholar] [CrossRef]
- Gaikwad., R.V. Carbon Dioxide to Methanol: Stoichiometric Catalytic Hydrogenation under High Pressure Conditions. Ph.D. Thesis, University Rovira and Virgili, Tarragona, Spain, 2018. [Google Scholar]
- Ash-Kurlander, U.; Martin, O.; Fontana, L.D.; Patil, V.R.; Bernegger, M.; Mondelli, C.; Pérez-Ramírez, J.; Steinfeld, A. Impact of Daily Startup–Shutdown Conditions on the Production of Solar Methanol over a Commercial Cu–ZnO–Al2O3 Catalyst. Energy Technol. 2016, 4, 565–572. [Google Scholar] [CrossRef]
- Janiczek, W. Synteza metanolu na tle układu C-H-O. Czas. Tech. Chem. 2010, 10, 108–122. [Google Scholar]
- Lachowska, M.; Skrzypek, J. Ga, Mn and Mg promoted copper/zinc/zirconia—Catalysts for hydrogenation of carbon dioxide to methanol. Studies Surf. Sci. Catal. 2004, 153, 173–176. [Google Scholar]
- Davies, P.; Snowdon, F.F.; Bridger, G.W.; Hughes, D.P.; Young, P.W. Water-Gas Conversion and Catalysts Therefor. UK Patent 1010871, 24 November 1965. [Google Scholar]
- Toyir, J.; de la Piscina, P.R.; Fierro, J.L.G.; Homs, N. Highly effective conversion of CO2 to methanol over supported and promoted copper-based catalysts: Influence of support and promoter. Appl. Catal. B Envir. 2001, 29, 207–215. [Google Scholar] [CrossRef]
- Toyir, J.; de la Piscina, P.R.; Fierro, J.L.G.; Homs, N. Catalytic performance for CO2 conversion to methanol of gallium-promoted copper-based catalysts: Influence of metallic precursors. Appl. Catal. B Envir. 2001, 34, 255–266. [Google Scholar] [CrossRef]
- Courty, P.; Ajot, H.; Marcilly, C.; Delmon, B. Oxydes mixtesou en solution solide sous forme très divisée obtenus par decomposition thermique de précurseurs amorphes. Powder Technol. 1973, 7, 21–38. [Google Scholar] [CrossRef]
- Lachowska, M. Steam reforming of methanol over Cu/Zn/Zr/Ga catalyst: Effect of the reduction conditions on the catalytic performance. Reac. Kinet. Mech. Cat. 2010, 101, 85–91. [Google Scholar] [CrossRef]
- Hamryszak, Ł.; Kulawska, M.; Madej–Lachowska, M.; Ruggiero-Mikołajczyk, M.; Samson, K.; Śliwa, M. Copper Tricomponent Catalysts Application for Hydrogen Production from Ethanol. Catalysts 2021, 11, 575. [Google Scholar] [CrossRef]


| Ref. | Kinetic Equations | Operating Conditions | Feed Composition and Catalyst | Estimated Activation Energies (kJ/mol) | |
|---|---|---|---|---|---|
| T (K) | pc (MPa) | ||||
| Graaf et al. [36] | a | 483–516 | 1.5–5 | H2: 0.67–0.90 CO2: 0.02–0.26 CO: 0.00–0.22 Cu/Zn/Al | E1 = 65 E2 = 123 E3 = 109 |
| Malinovskaya et al. [37] | 473–553 | 5–10 | H2: 0.60–0.90 CO2: 0.01–0.20 CO: 0.01–0.1 Cu/Zn/Al (SNM-3) | E1 = 69 E2 = 66 | |
| Skrzypek et al. [38] | 460–550 | 3–9 | H2: 0.10–0.80 CO2: 0.05–0.35 CO: 0.00–0.20 Cu/Zn/Al (Błasiaka) | E1 = 105 E2 = 105 | |
| VandenBussch and Froment [39] | 453–533 | 1.5–5.1 | H2: 0.7 CO2: 0.00–0.30 CO: 0.00–0.30 Cu/Zn/Al (ICI 51-2) | E1 = −37 E2 = 95 | |
| Kubota et al. [40] | 473–548 | 4.9 | H2: 0.75 CO2: 0.22 CO: 0.03 Cu/Zn/Zr/Al/Si | E1 = 32 E2 = 113 | |
| Ladera et al. [35] | 463–523 | 0.3–4.2 | – Cu/Zn/Zr/Ga | E1 = 31 E2 = 111 | |
| CuO (Mass%) | ZnO (Mass%) | Other Metal Oxides a (Mass%) | Size of Crystallites (nm) | SCu c (m2/gCu) | SBET d (m2/g) | Vp (cm3/g) | Dp (nm) | Ref. | |
|---|---|---|---|---|---|---|---|---|---|
| Fresh | Spent b | ||||||||
| CuO (111) | Cu0 (111) | ||||||||
| 65.3 | 26.3 | 8.4 | 9.7 | 29.6 | 8.7 | 29 | 0.09 | 12 | Present work |
| 61.0 | 31.0 | 8.0 | 14.5 | 16.1 | – | 21 | – | – | [31] |
| 50.0 | 15.0 | 35.0 | – | 7.0 | 13.5 | 102 | – | – | [35] |
| 39.0 | 29.0 | 32.0 | – | 12.7 | 57.1 | 143 | – | – | [43] |
| Catalyst | Peak | Tmax (K) | Weak Basic Sites (µmol/gcat.) | Totdes/Totads | Total Basicity (µmol/gcat.) |
|---|---|---|---|---|---|
| Cu/Zn/Zr/Ga | 1 | 348 | 6.6 | 0.97 | 15.5 |
| 2 | 405 | 8.9 |
| Reaction 1 | Reaction 2 | ||||||||
|---|---|---|---|---|---|---|---|---|---|
| k01 (mol/kgcat.·h) | E1 (J/mol) | k02 (mol/kgcat.·h) | E2 (J/mol) | ||||||
| 4.1 × 10⁷ | 66,280 | 5.2 × 10⁸ | 81,060 | ||||||
| Other parameters | |||||||||
(1/MPa) | (J/mol) | (1/MPa) | (J/mol) | (1/MPa) | (J/mol) | (1/MPa) | (J/mol) | (1/MPa) | (J/mol) |
| 3.1 × 10⁻⁷ | −5726 | 2.6 × 10⁻⁶ | −5410 | 3.0 × 10⁻⁷ | −11,410 | 4.5 × 10⁻⁶ | −10,605 | 8.1 × 10⁻⁷ | −11,150 |
| Confidence interval for: = = ±1 × 10⁻⁴ E1, E2, = ±100 | |||||||||
| Parameter | Value |
|---|---|
| T (K) | 433–513 |
| pc (MPa) | 3–8 |
| GHSV (1/h) | 1660–10,000 |
| Inlet gas composition (-) | |
| H2 | 0.30–0.71 |
| CO2 | 0.05–0.23 |
| CO | 0.00–0.06 |
| N2 | 0.05–0.49 |
Publisher’s Note: MDPI stays neutral with regard to jurisdictional claims in published maps and institutional affiliations. |
© 2022 by the authors. Licensee MDPI, Basel, Switzerland. This article is an open access article distributed under the terms and conditions of the Creative Commons Attribution (CC BY) license (https://creativecommons.org/licenses/by/4.0/).
Share and Cite
Hamryszak, Ł.; Madej-Lachowska, M.; Grzesik, M.; Śliwa, M. Cu/Zn/Zr/Ga Catalyst for Utilisation of Carbon Dioxide to Methanol—Kinetic Equations. Catalysts 2022, 12, 757. https://doi.org/10.3390/catal12070757
Hamryszak Ł, Madej-Lachowska M, Grzesik M, Śliwa M. Cu/Zn/Zr/Ga Catalyst for Utilisation of Carbon Dioxide to Methanol—Kinetic Equations. Catalysts. 2022; 12(7):757. https://doi.org/10.3390/catal12070757
Chicago/Turabian StyleHamryszak, Łukasz, Maria Madej-Lachowska, Mirosław Grzesik, and Michał Śliwa. 2022. "Cu/Zn/Zr/Ga Catalyst for Utilisation of Carbon Dioxide to Methanol—Kinetic Equations" Catalysts 12, no. 7: 757. https://doi.org/10.3390/catal12070757
APA StyleHamryszak, Ł., Madej-Lachowska, M., Grzesik, M., & Śliwa, M. (2022). Cu/Zn/Zr/Ga Catalyst for Utilisation of Carbon Dioxide to Methanol—Kinetic Equations. Catalysts, 12(7), 757. https://doi.org/10.3390/catal12070757