
Synthesis and Evaluation of FeSX/TiO2 for the Photocatalytic Degradation of Phenol under Visible-Light Region

 ,
,  ,
,  ,
, 
Abstract
1. Introduction
2. Results
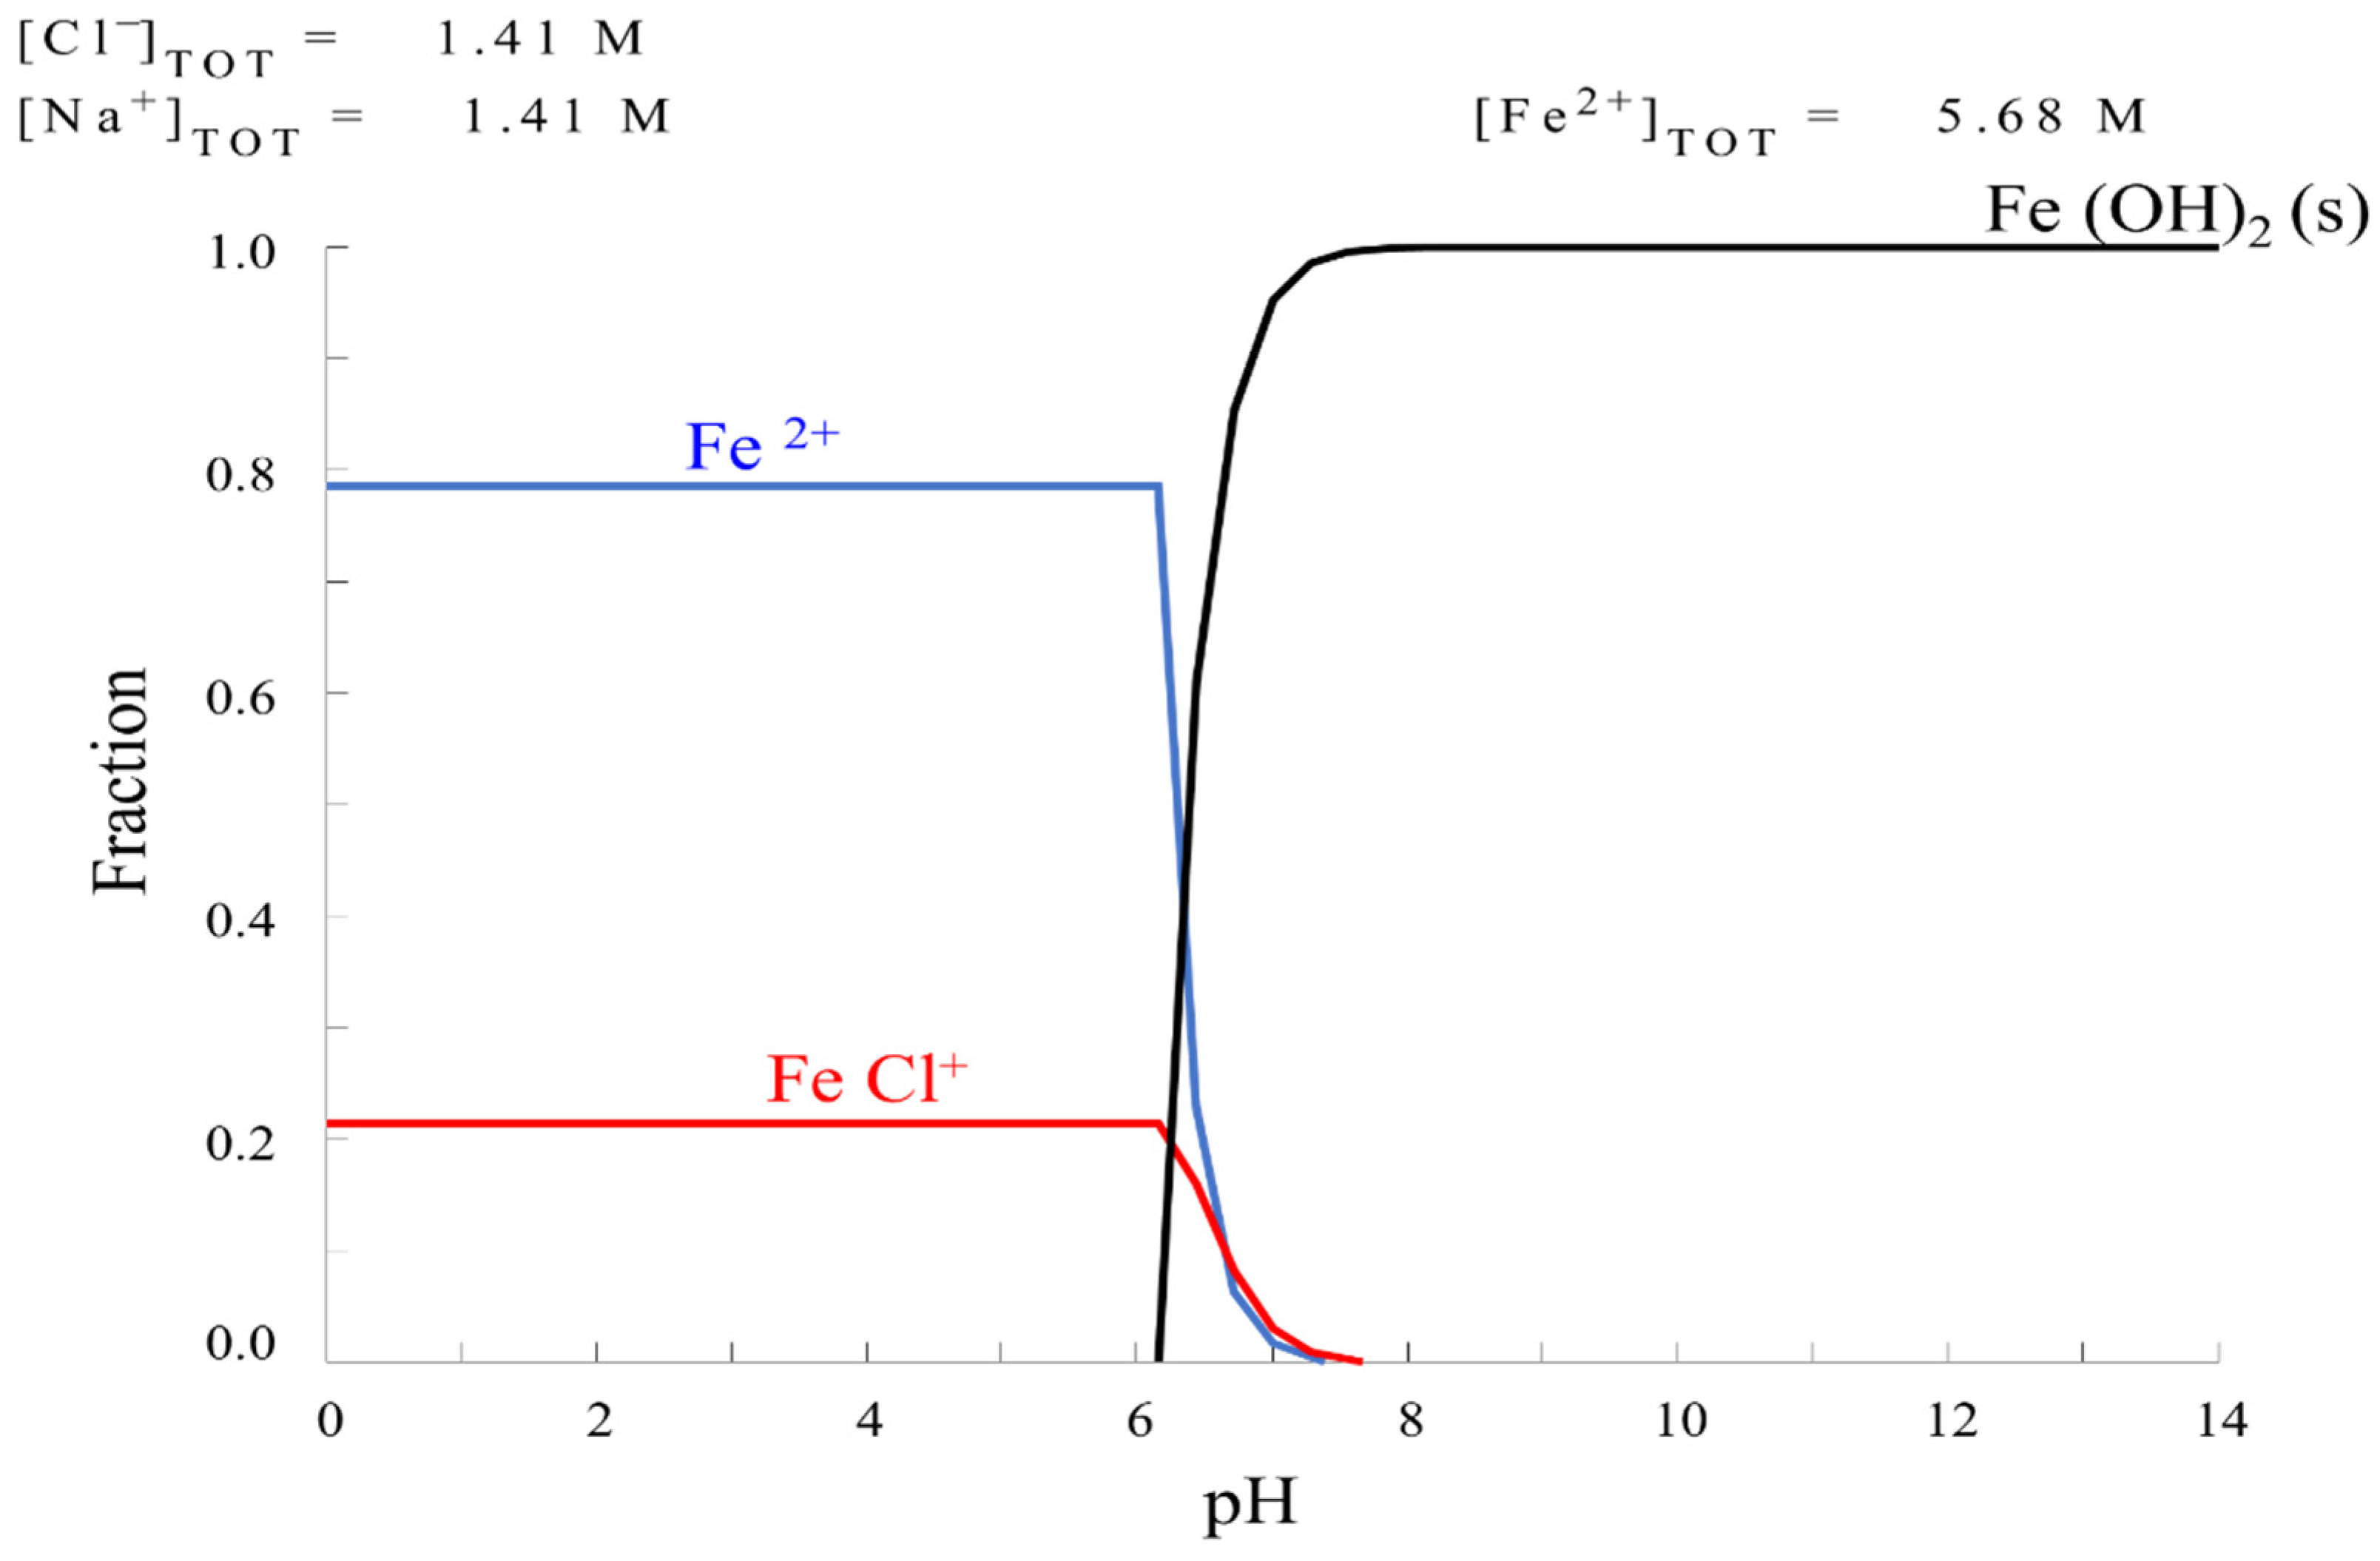
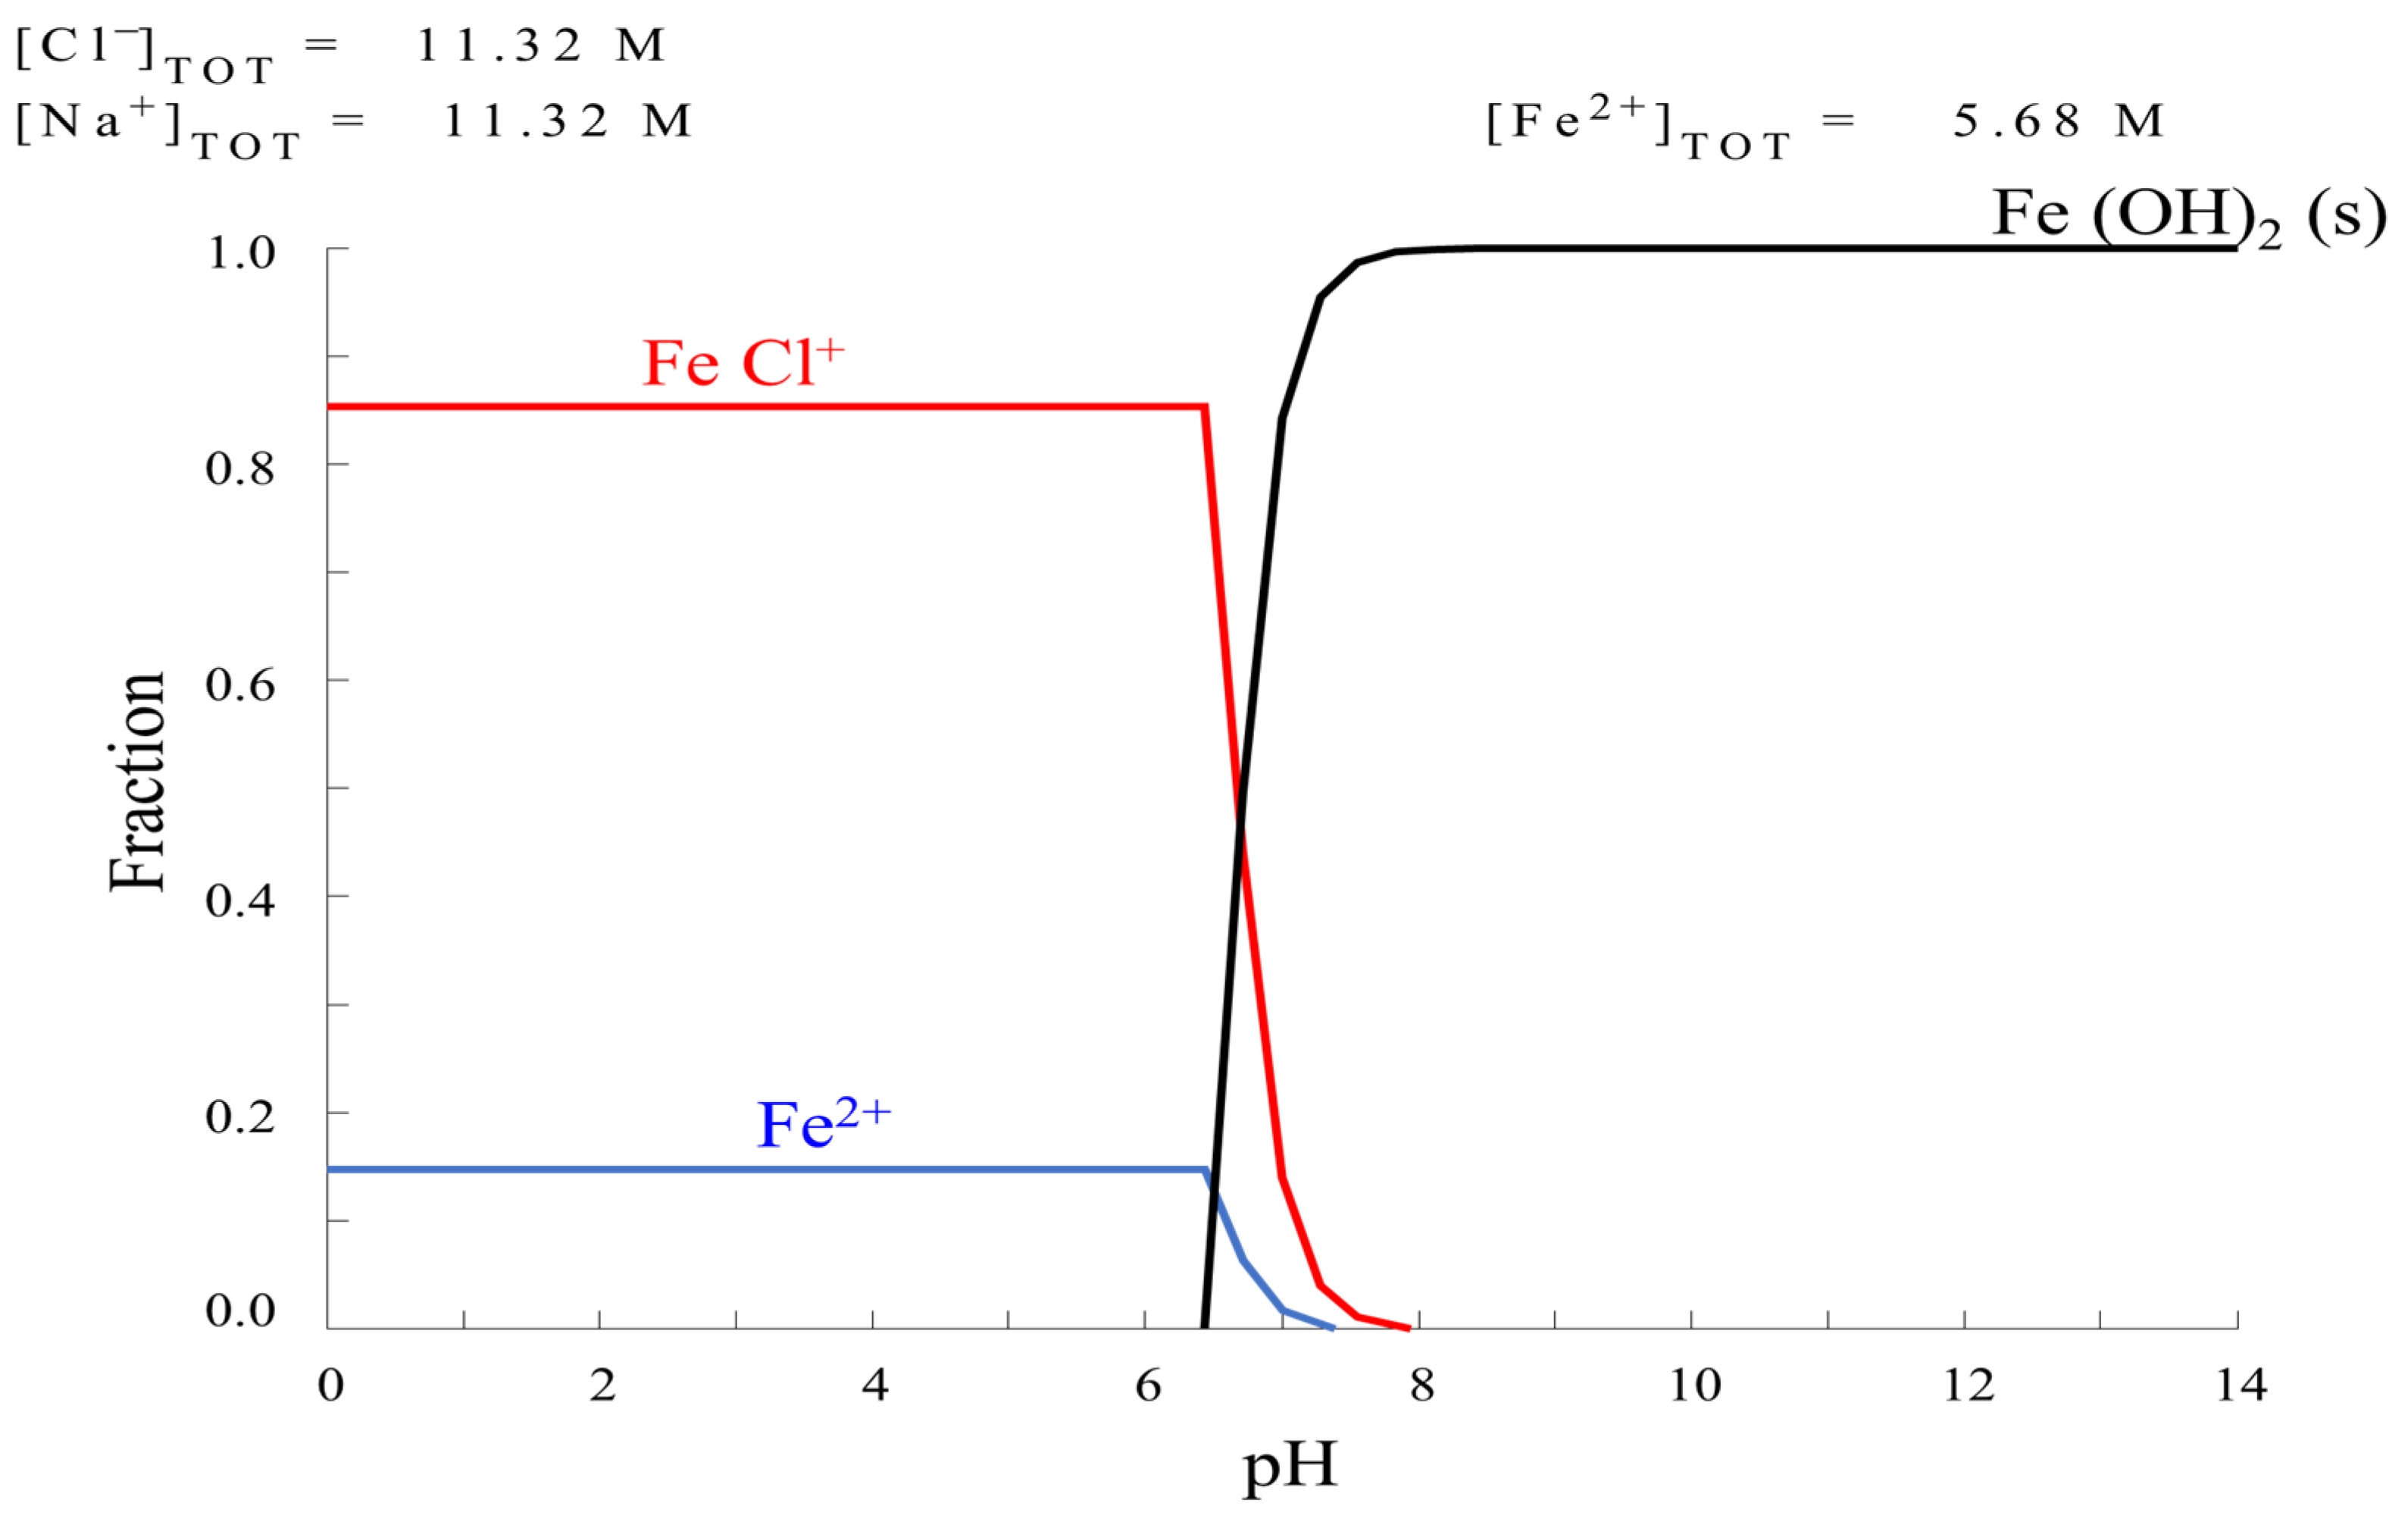
2.1. Solution Analysis
HYDRA Formulation
2.2. Catalyst Characterization
2.2.1. Oxide Catalyst
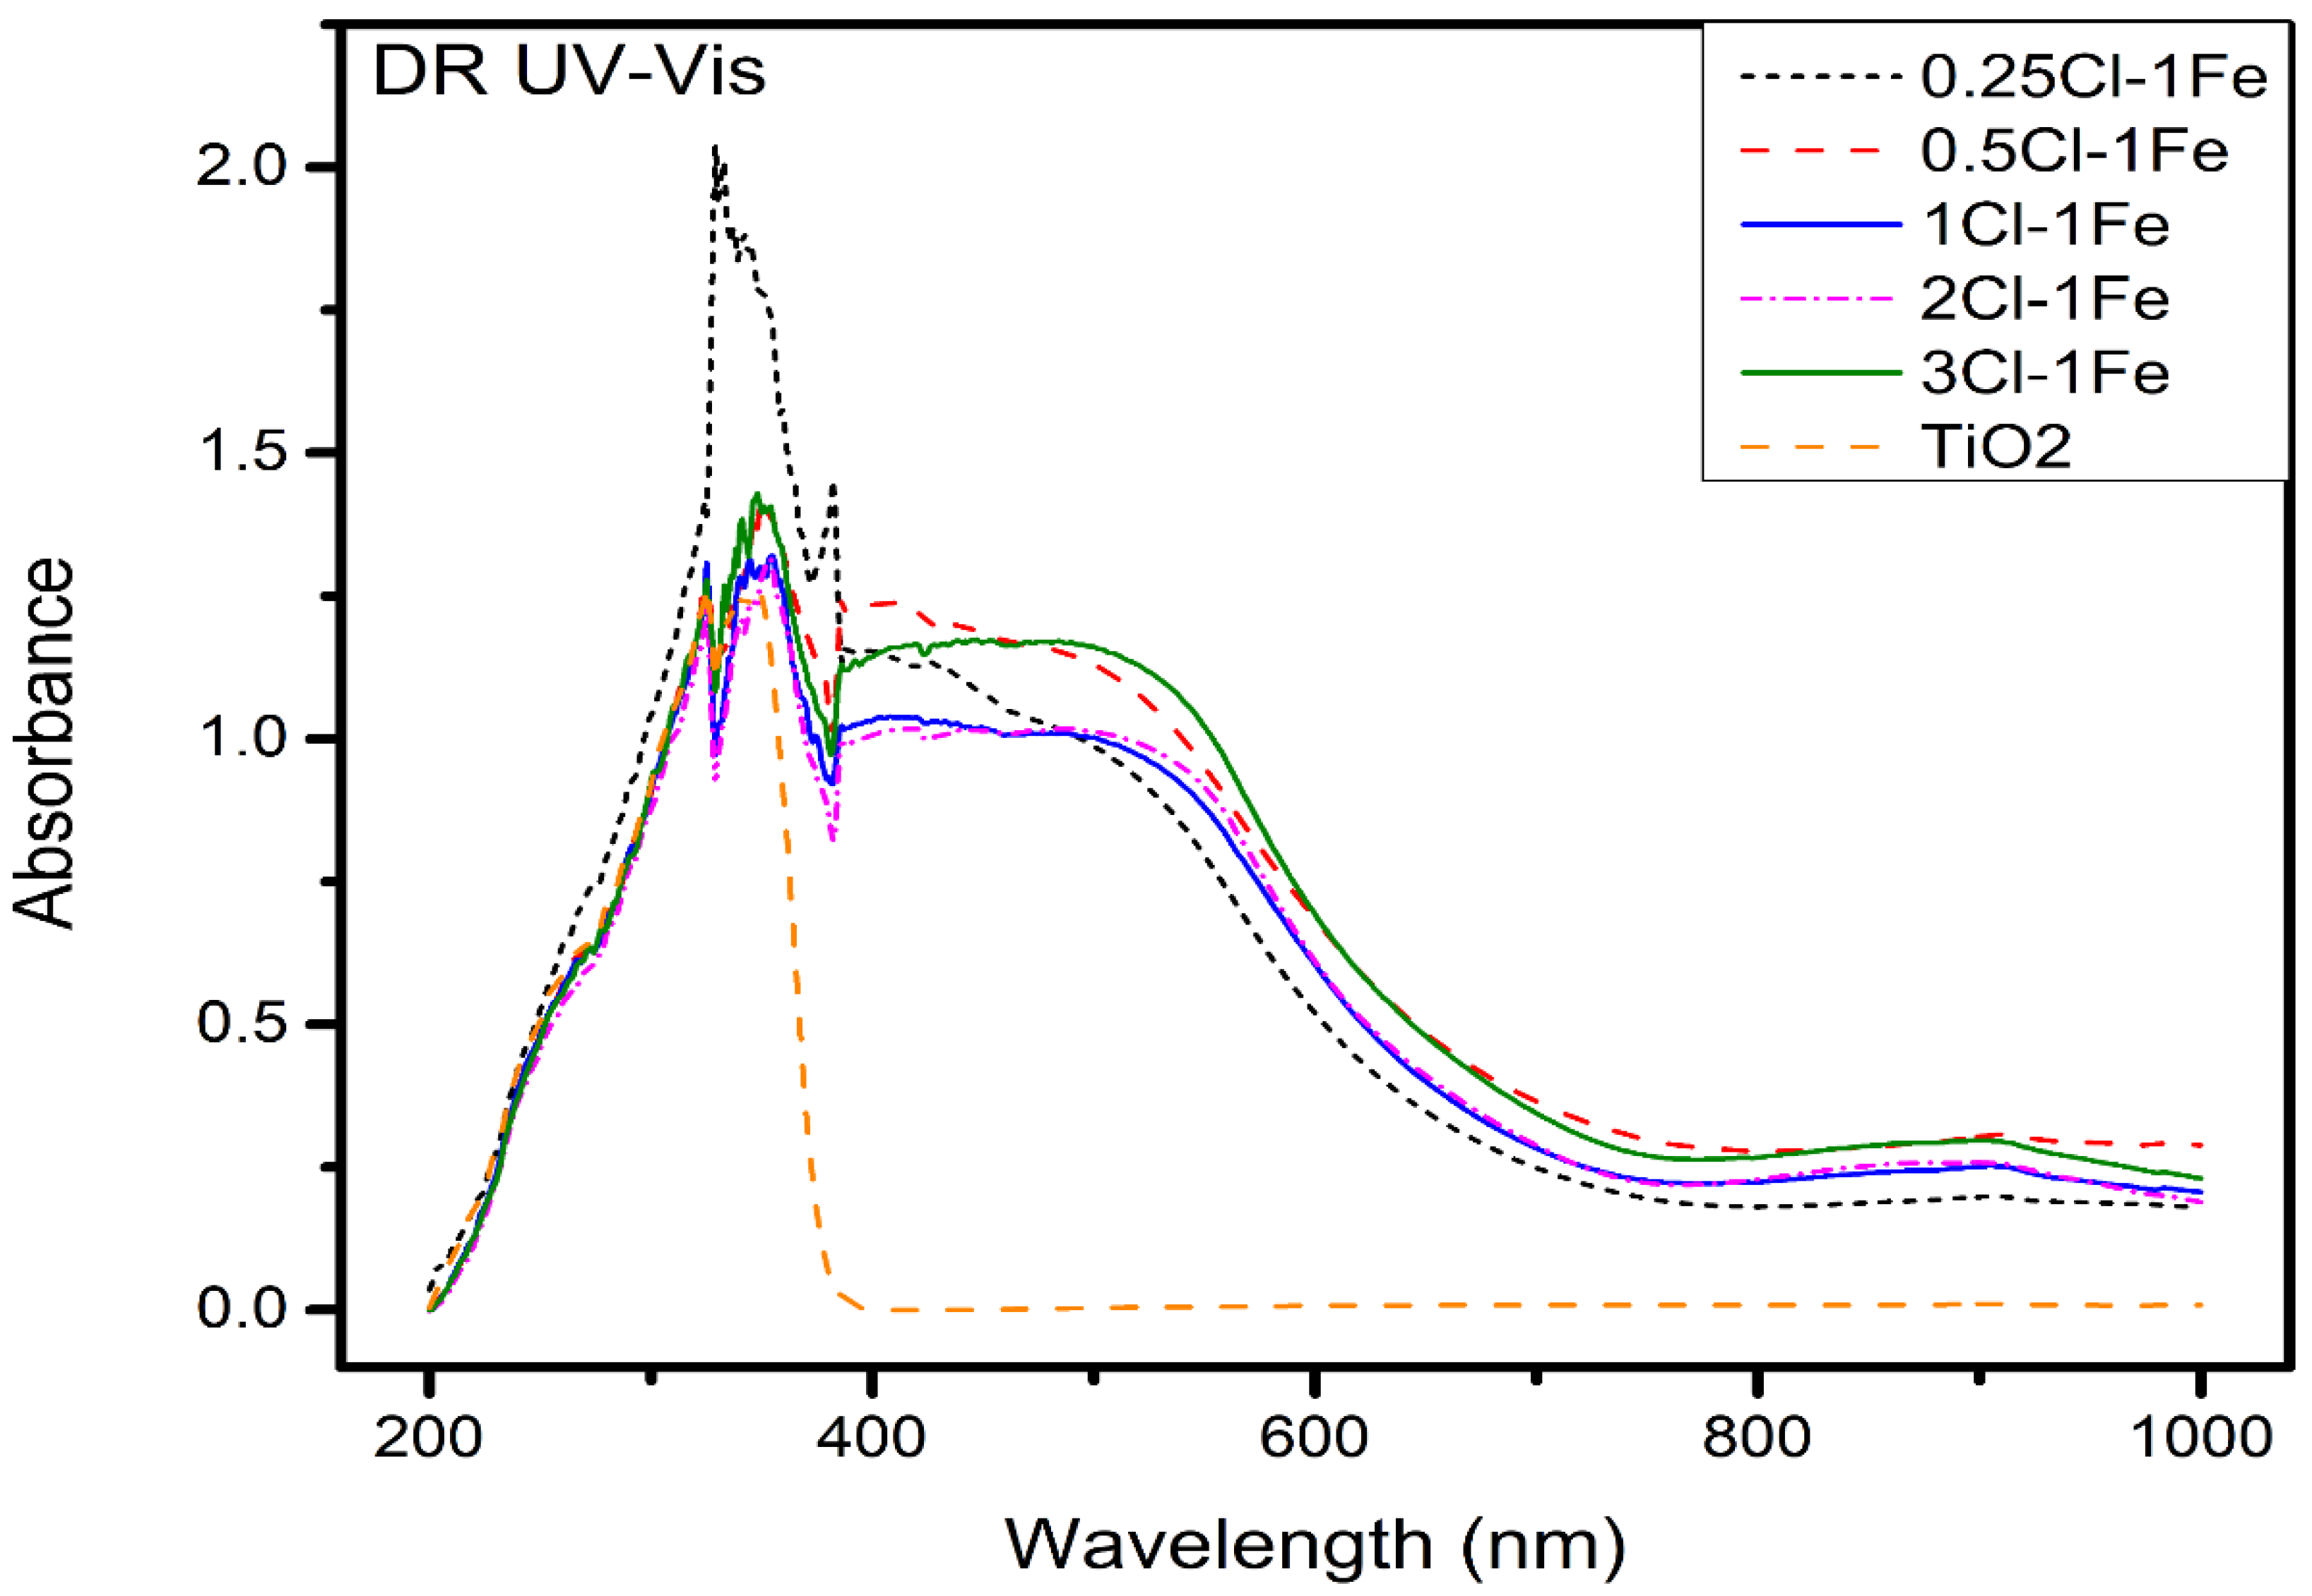
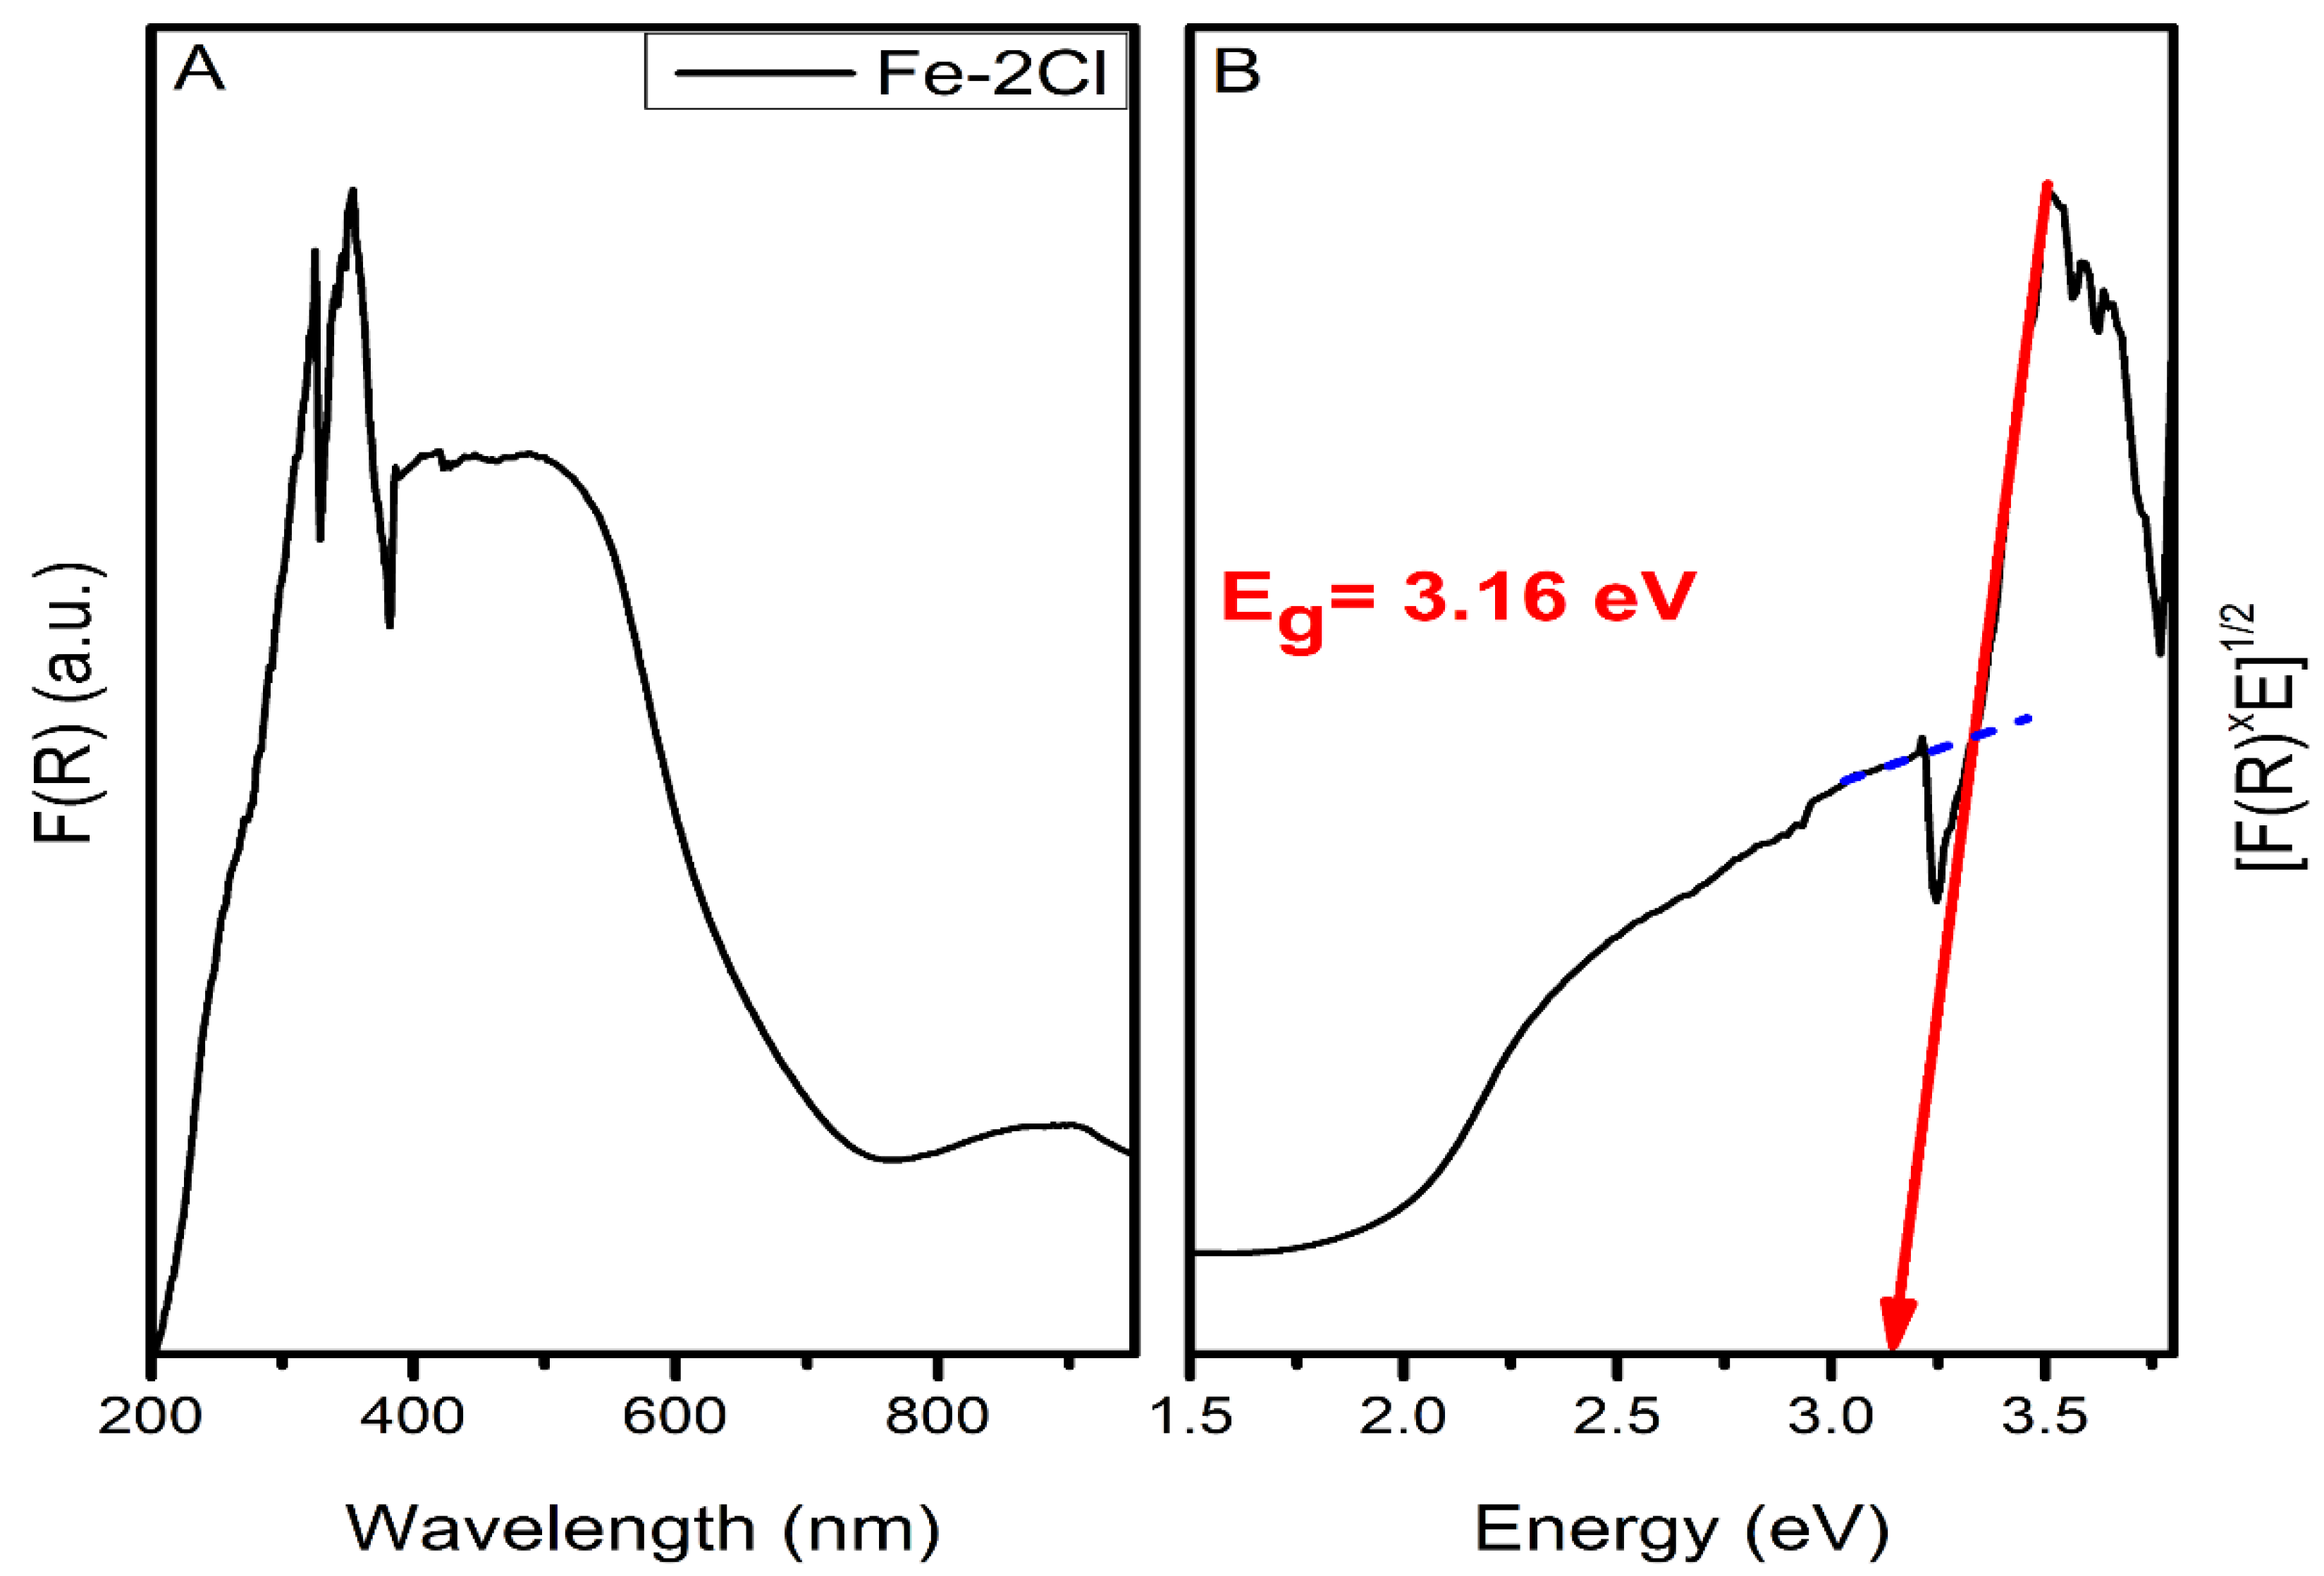
DRS UV–VIS Spectroscopy
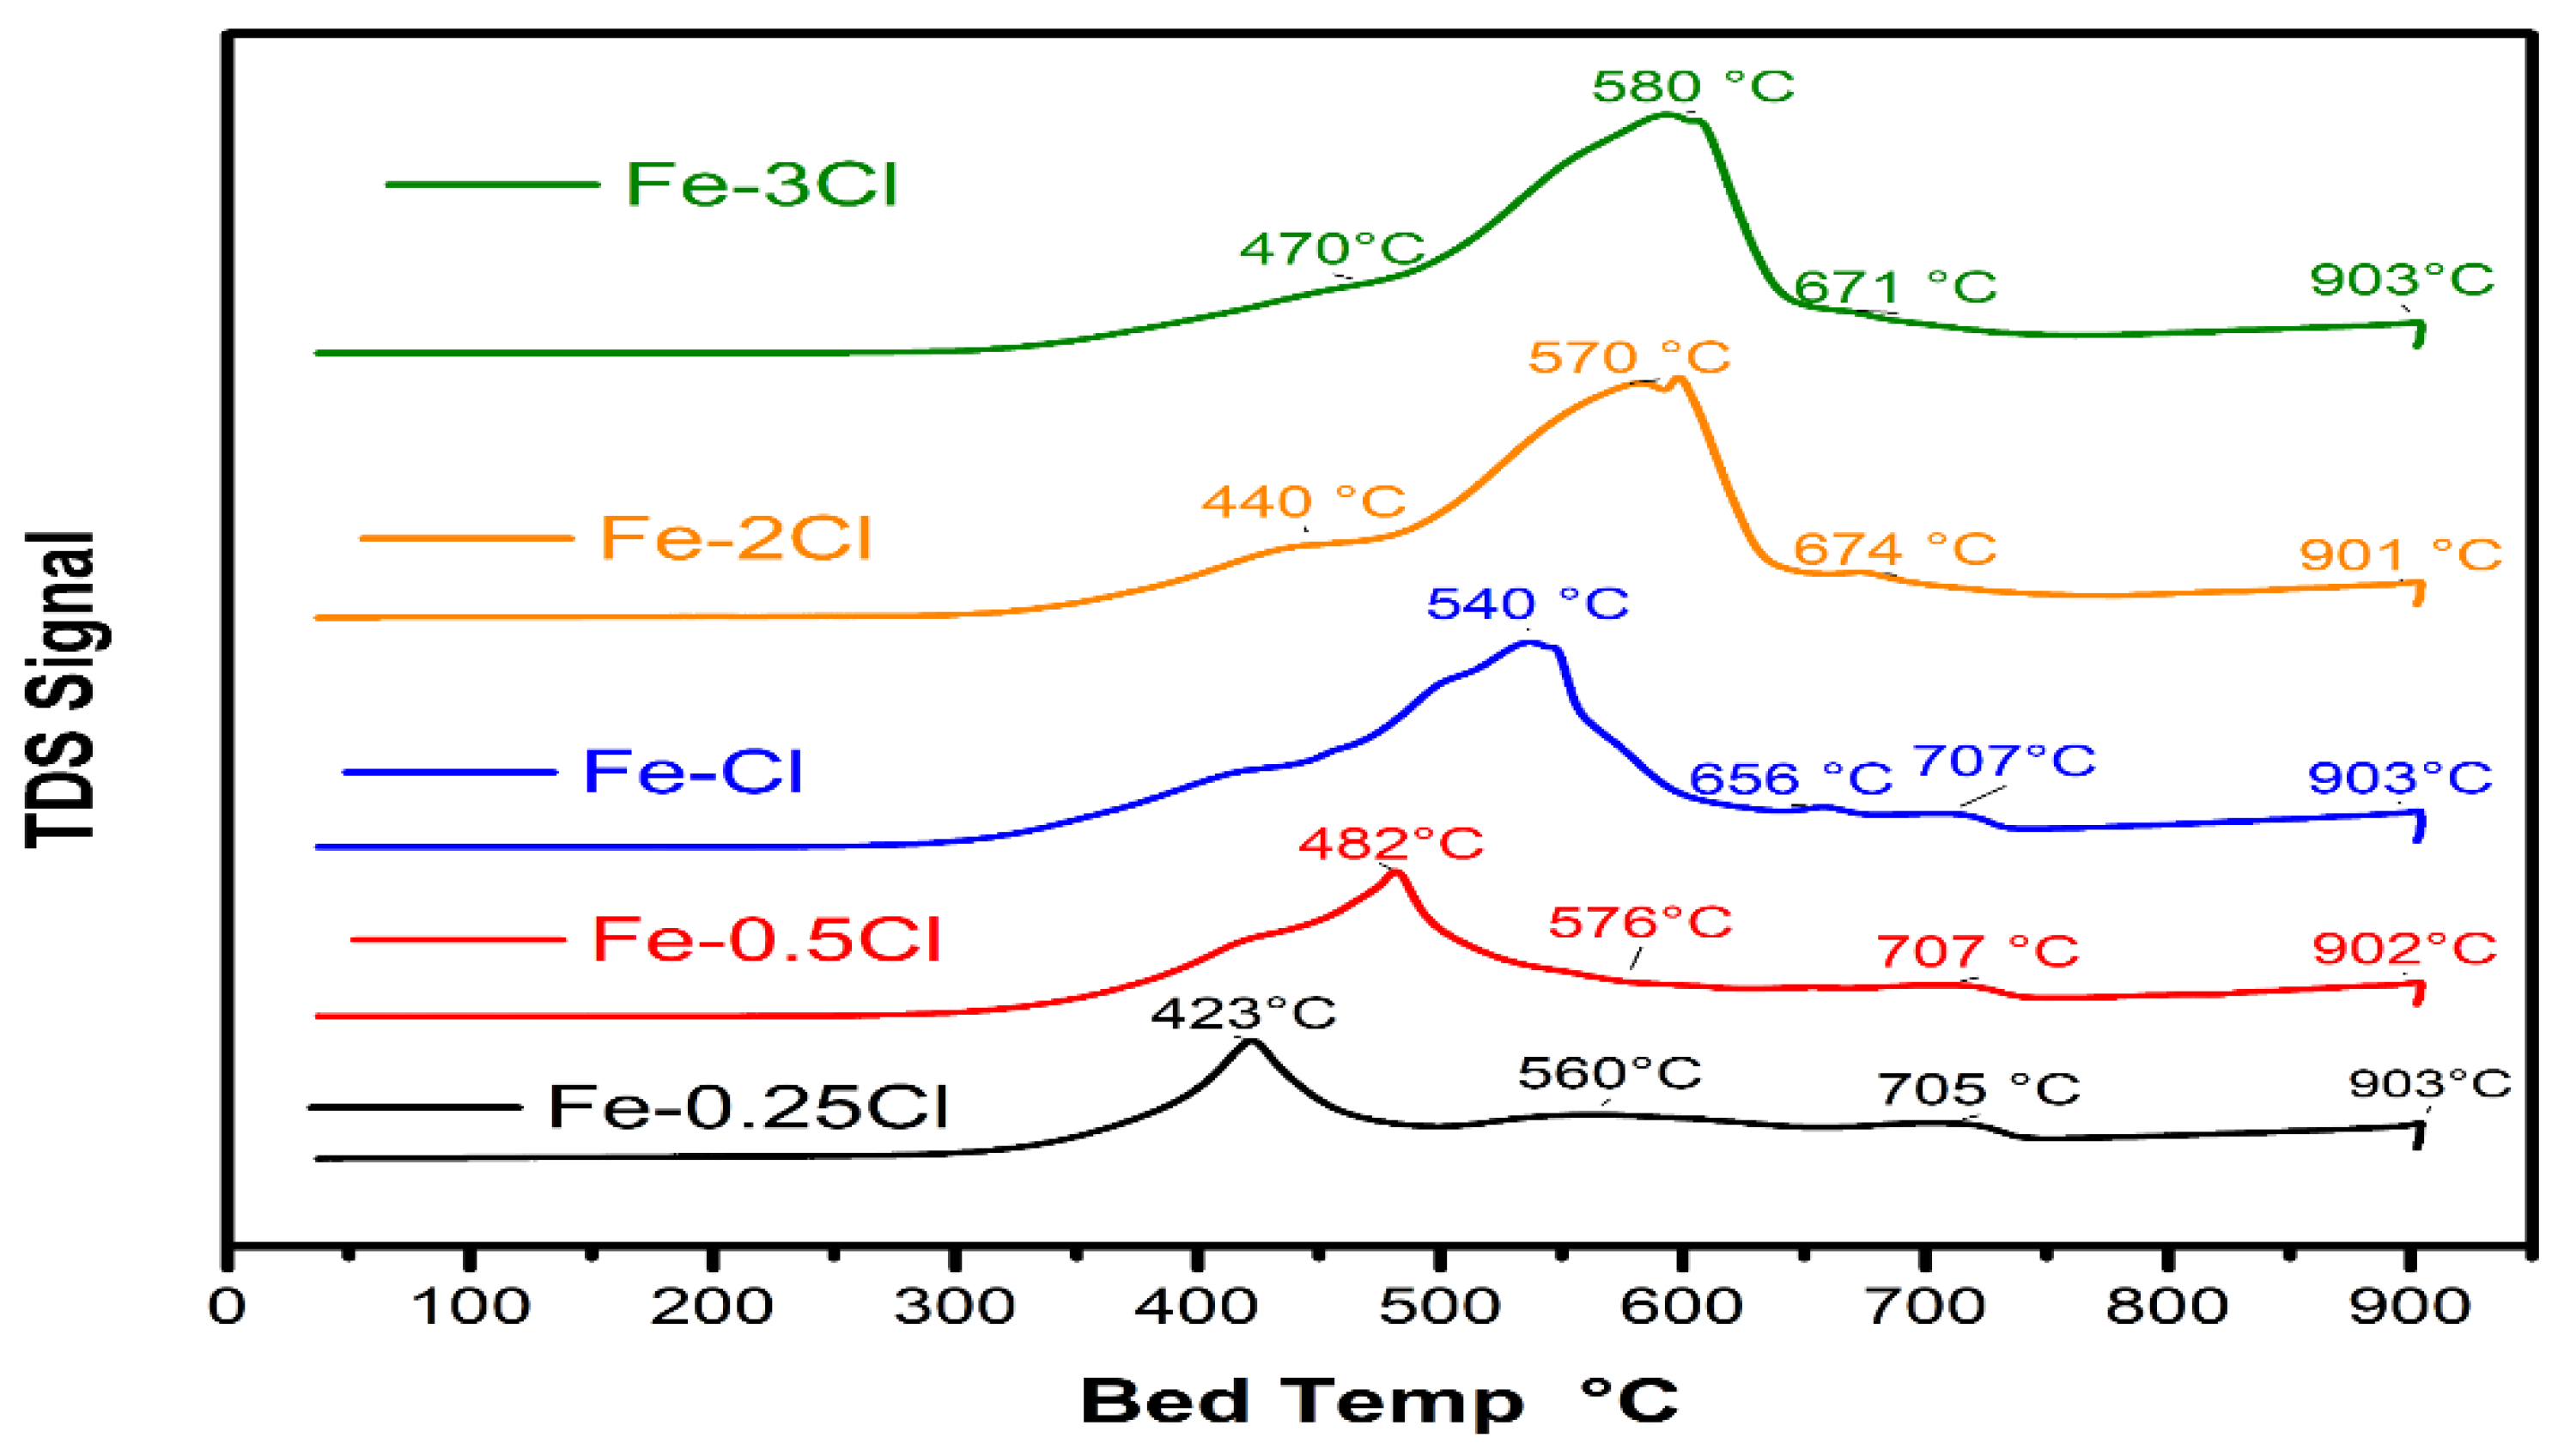
Temperature-Programmed Reduction Analysis
2.2.2. Sulphated Catalyst
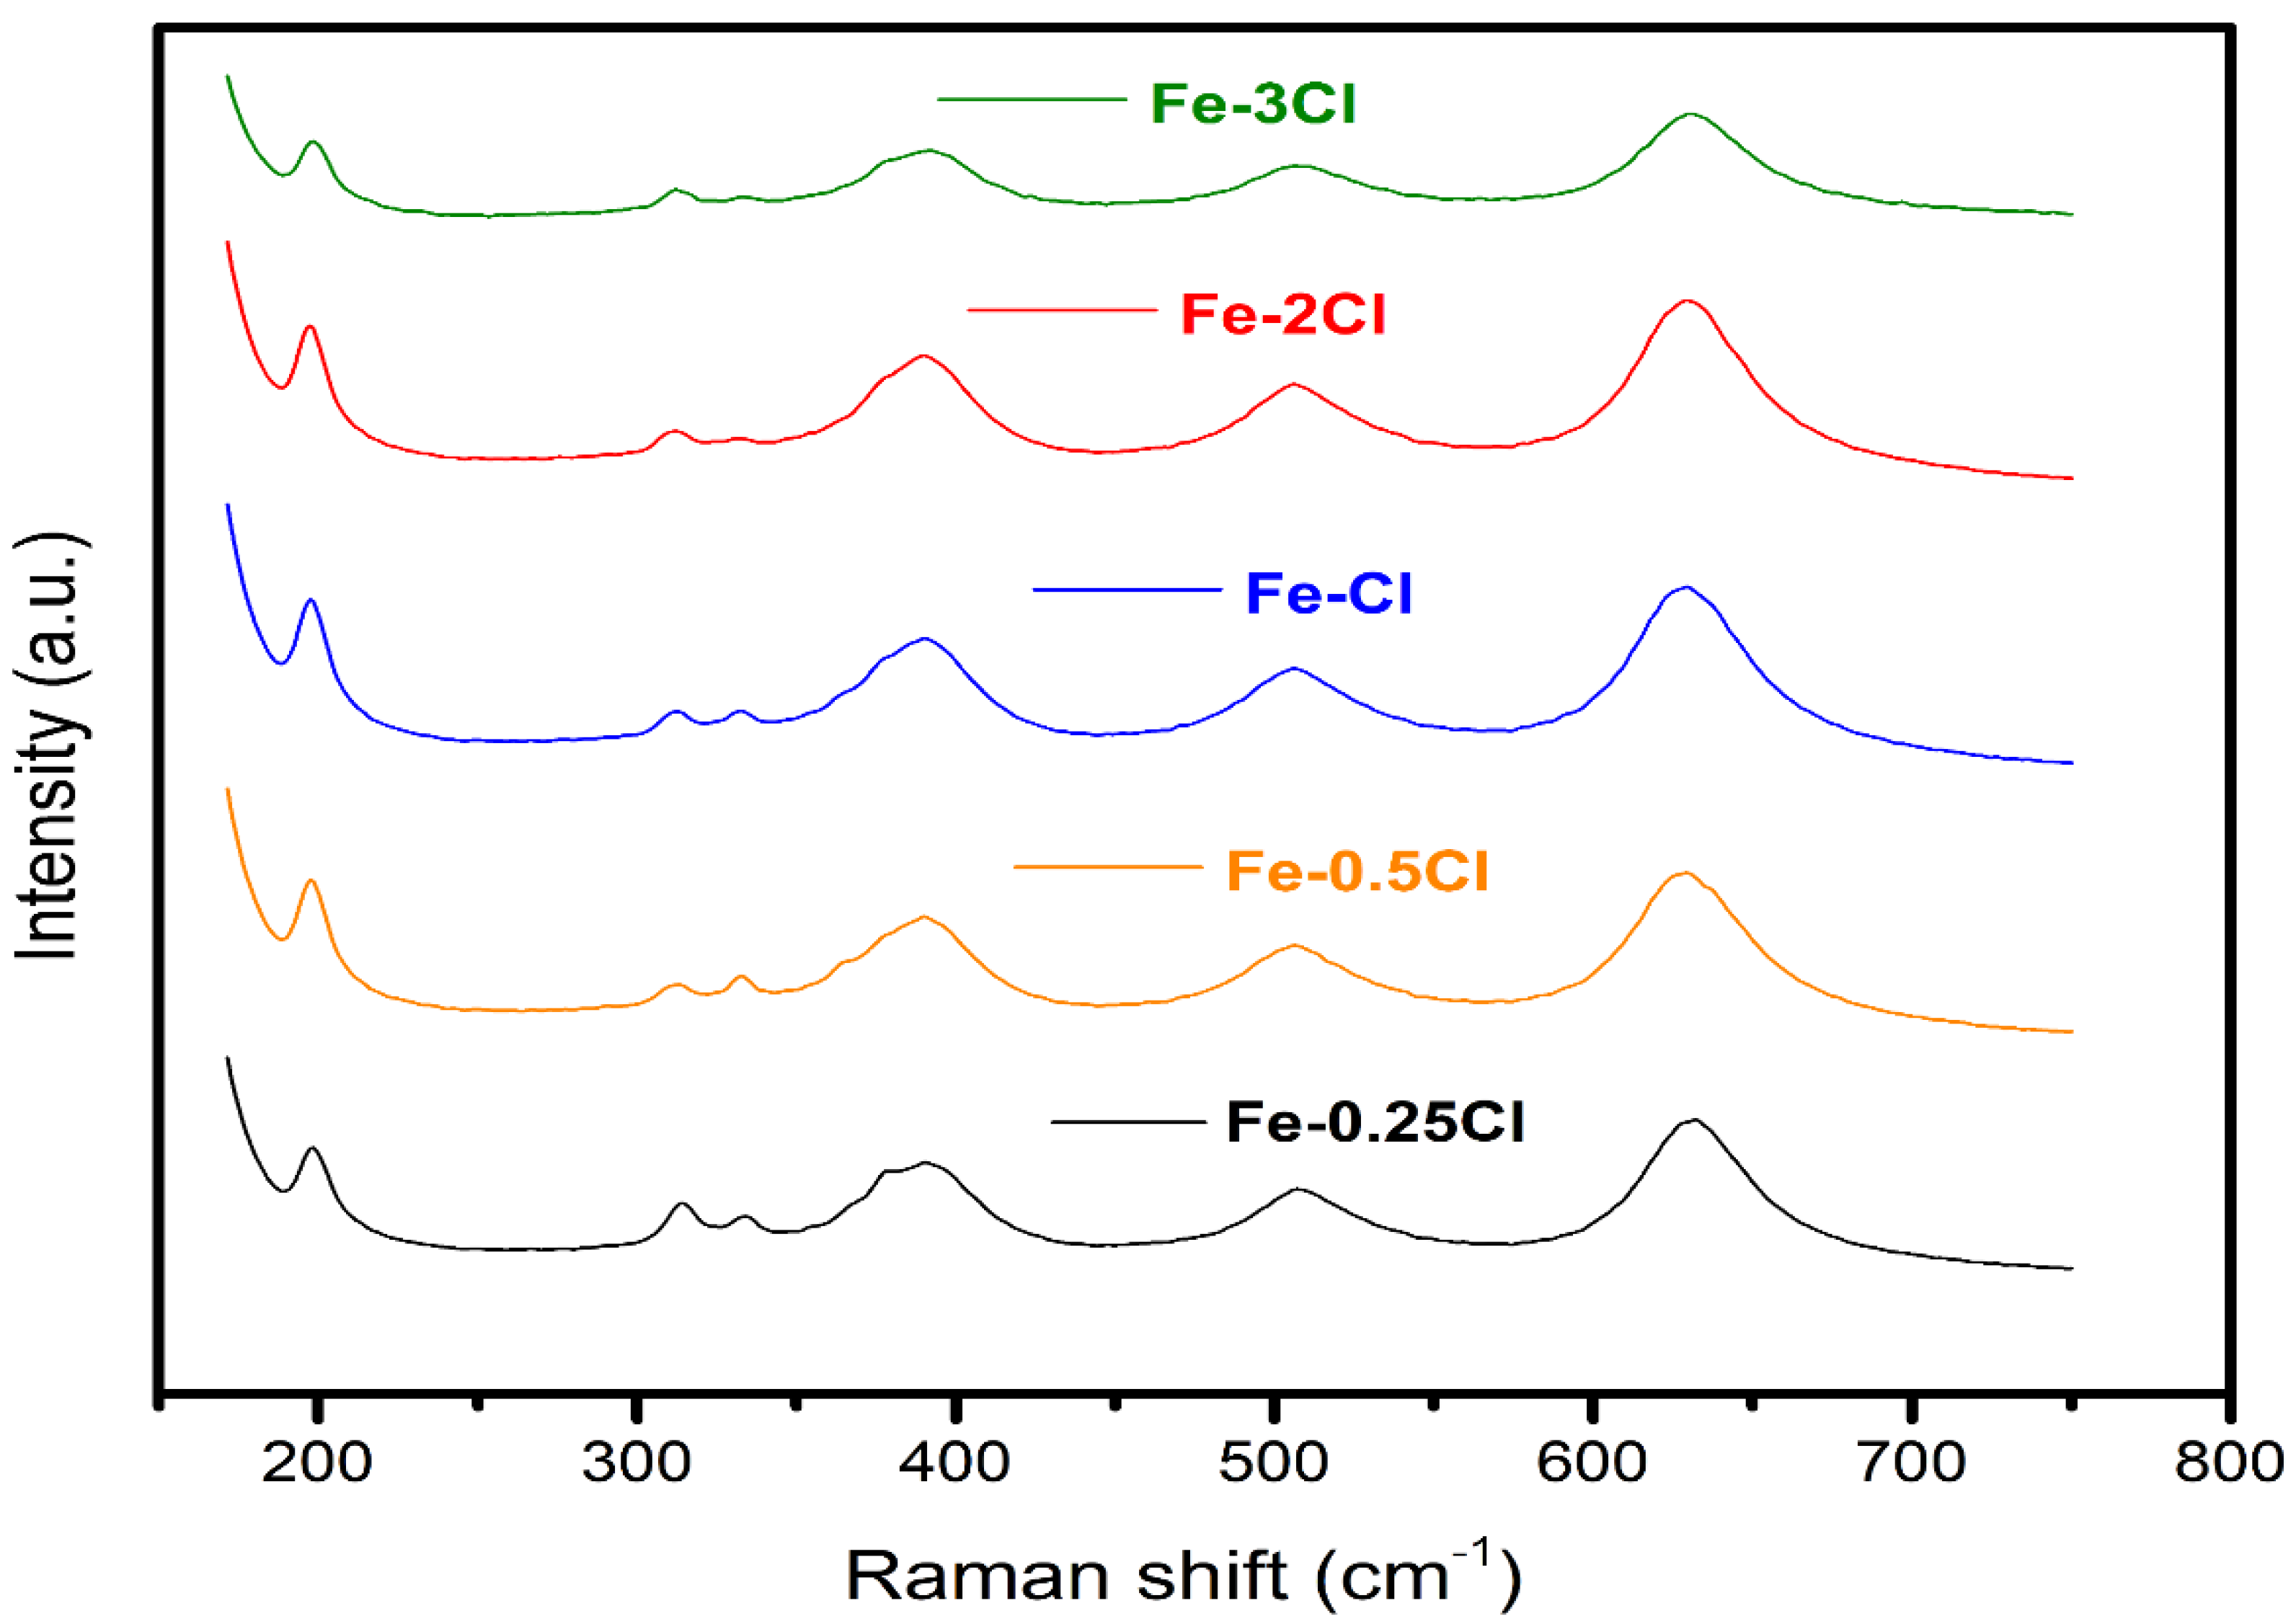
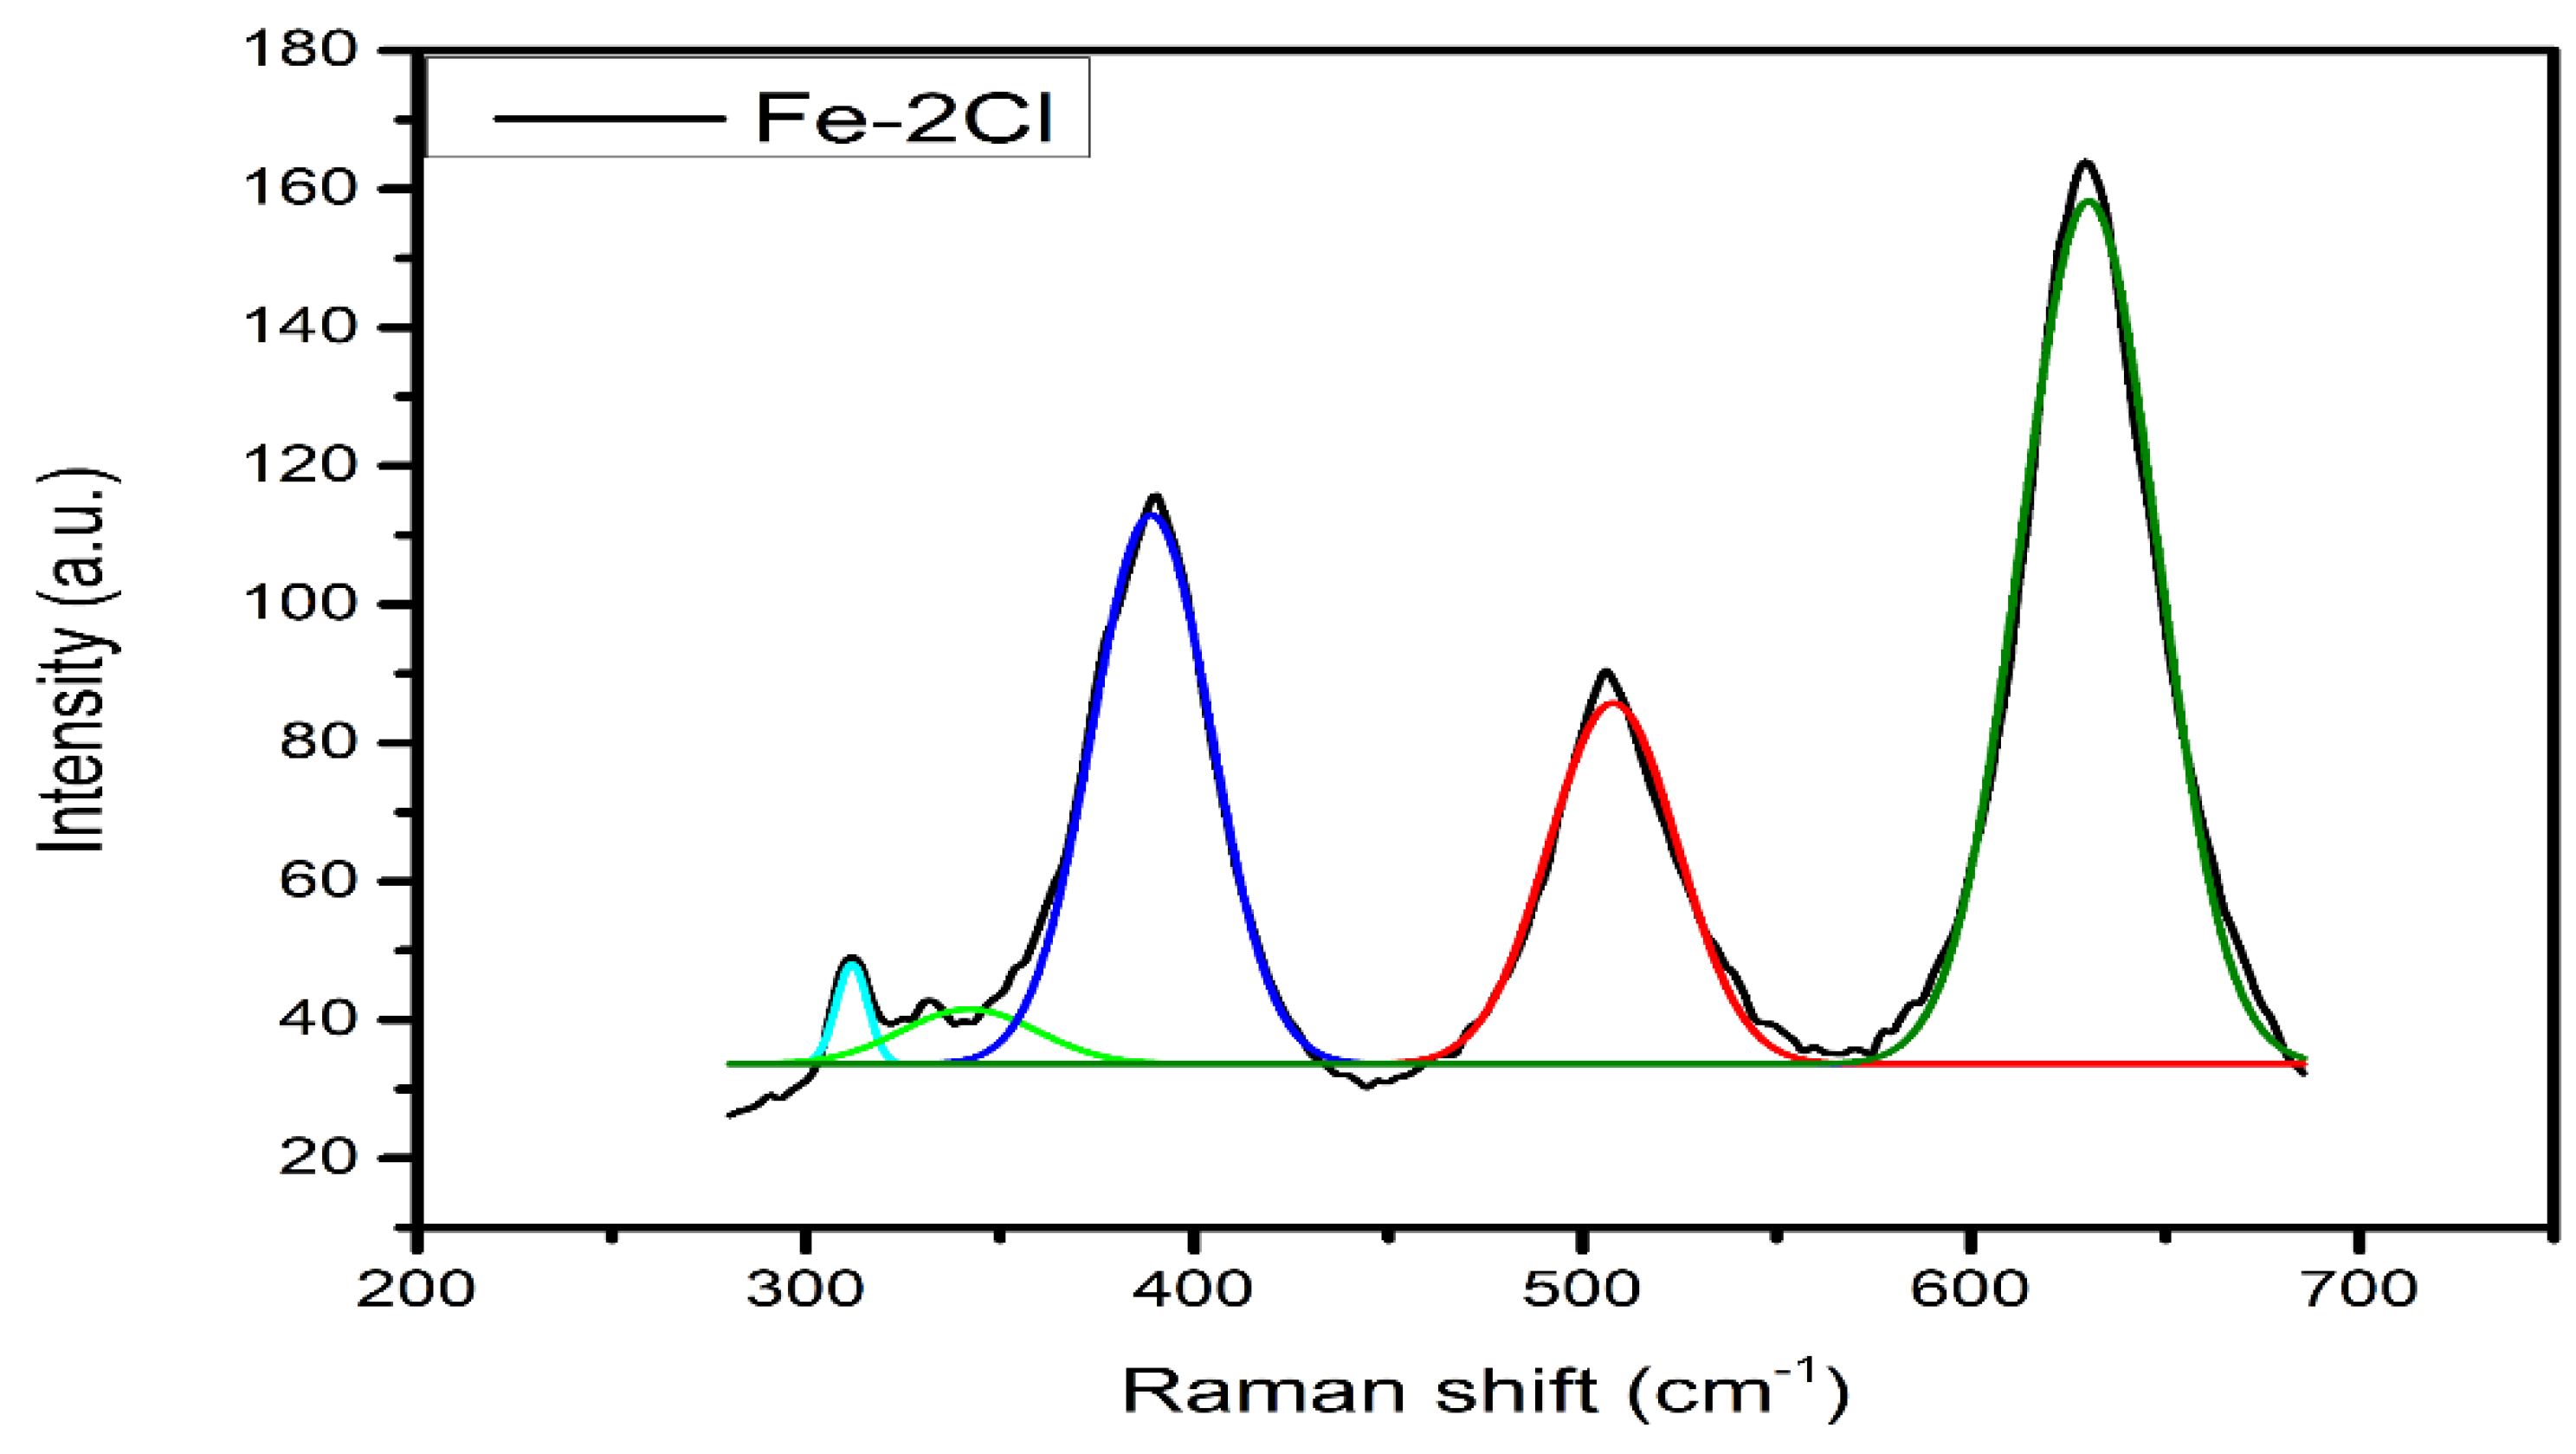
Raman Spectroscopy
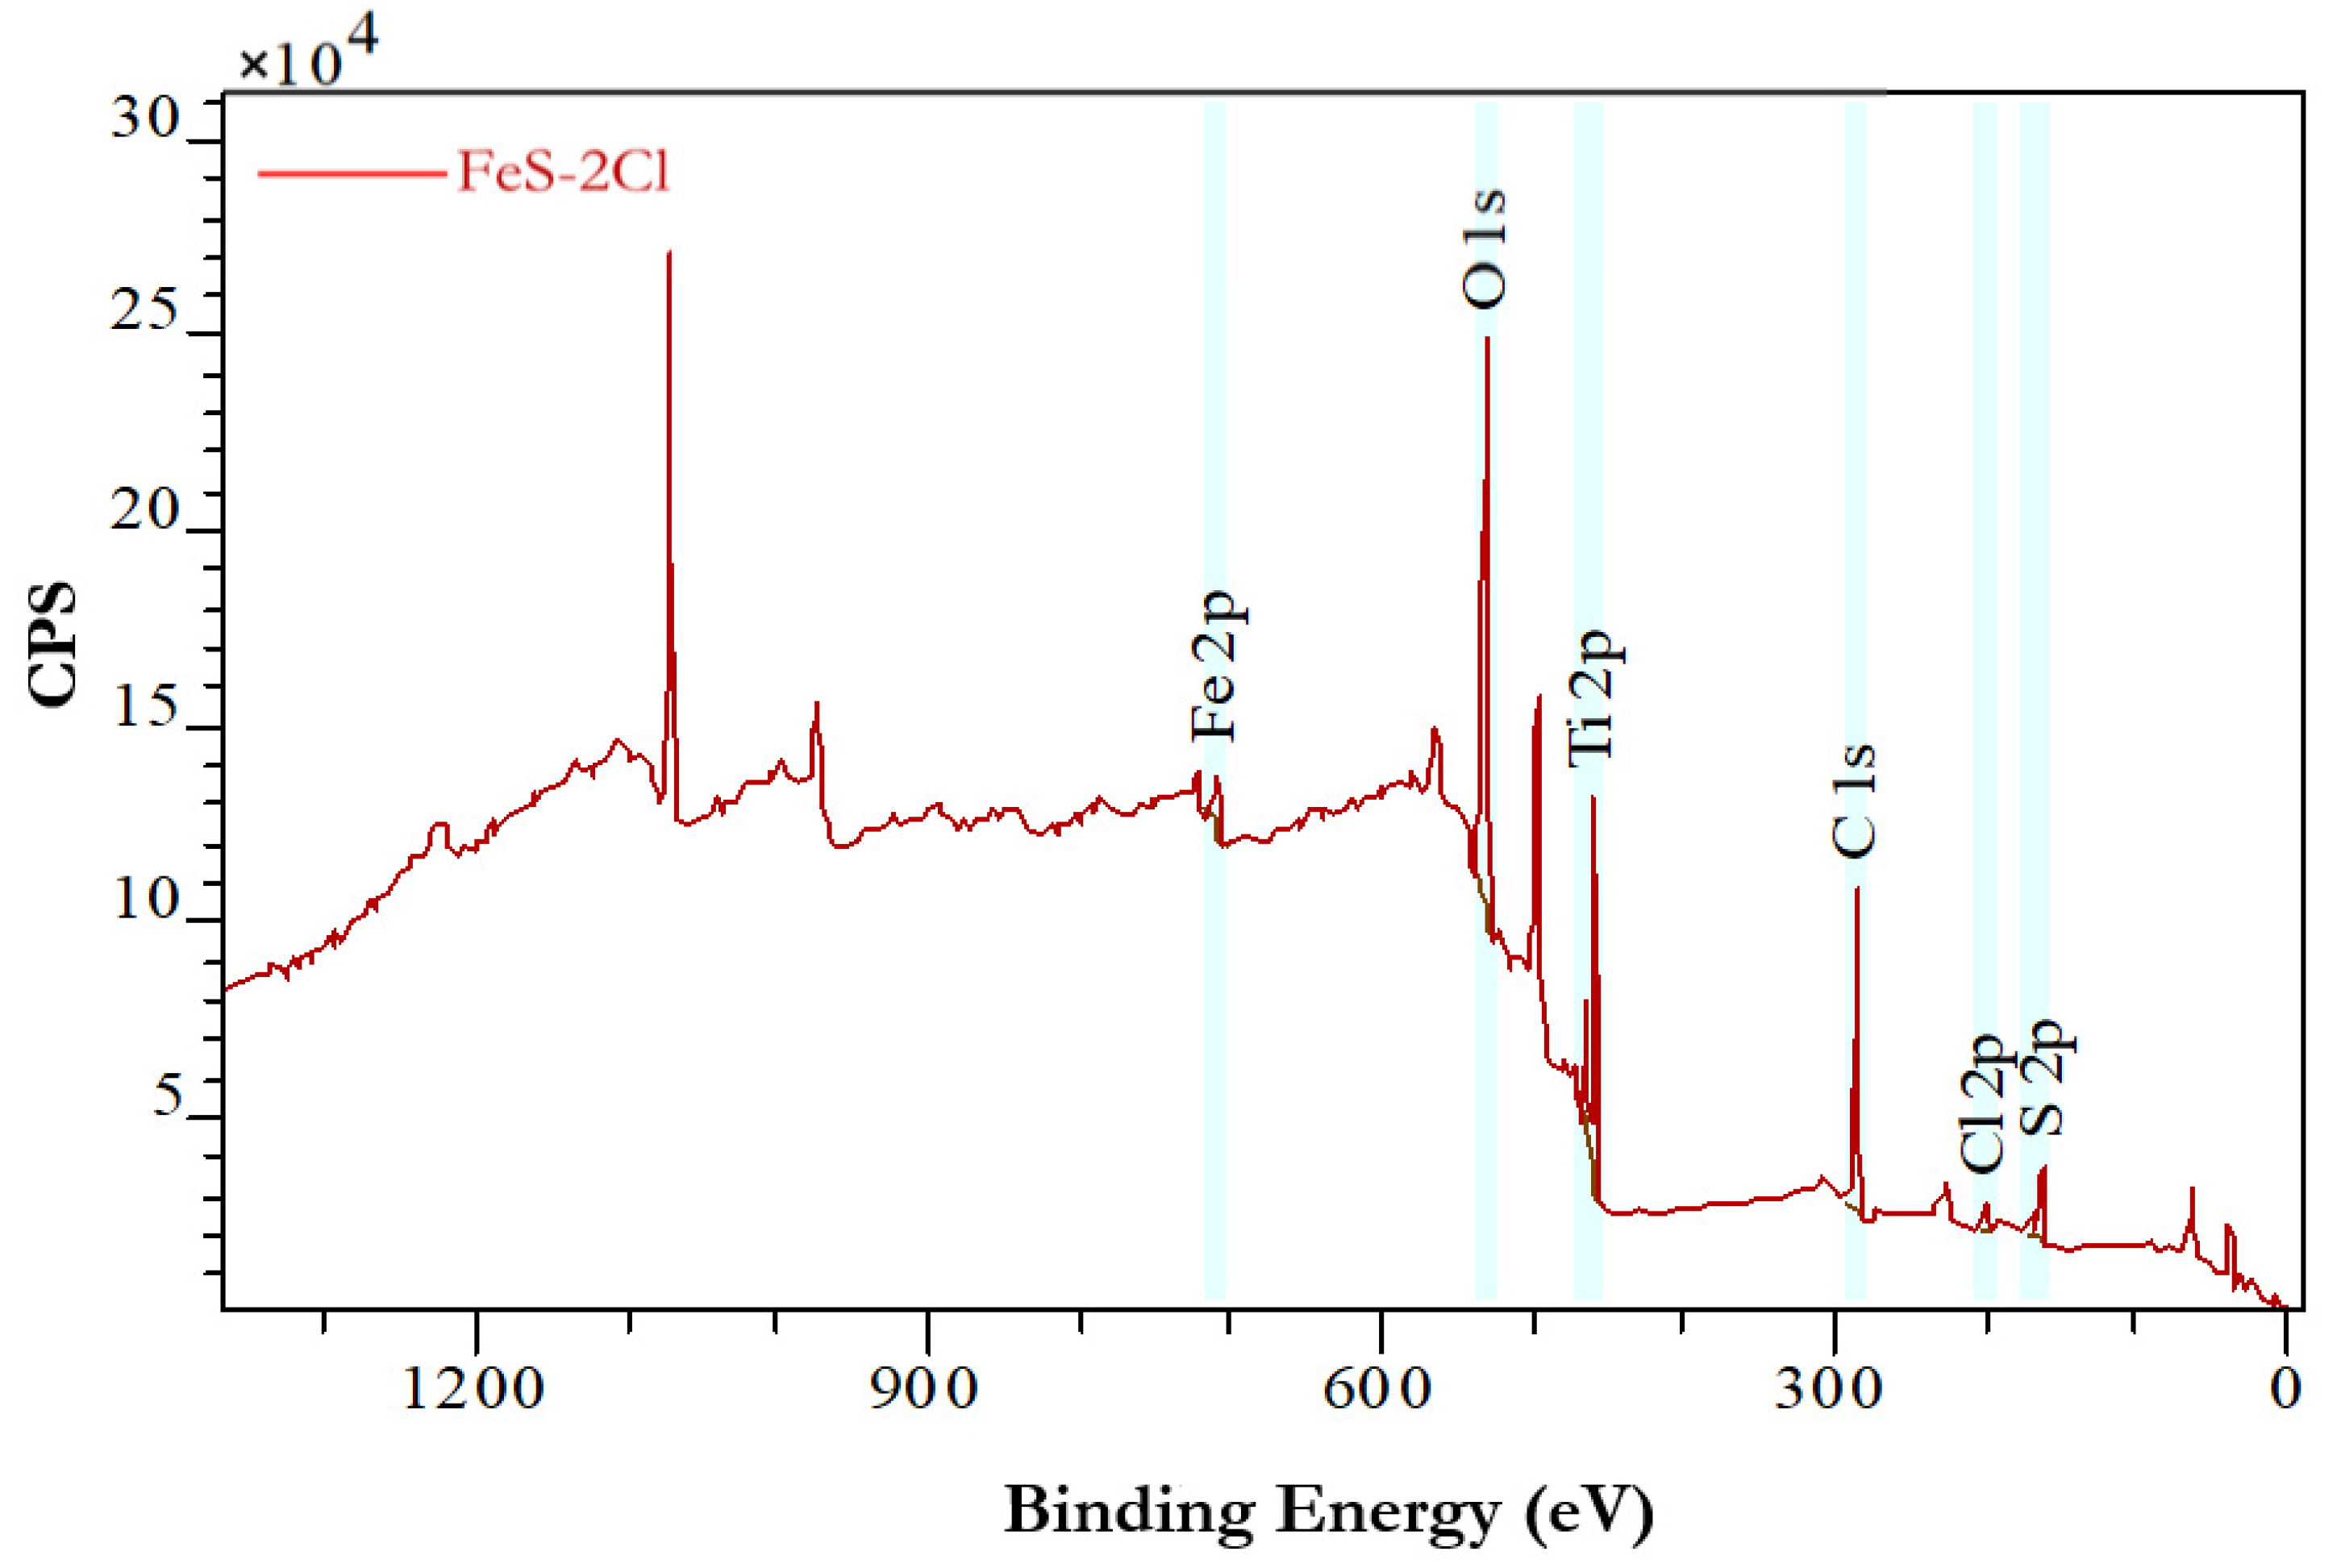
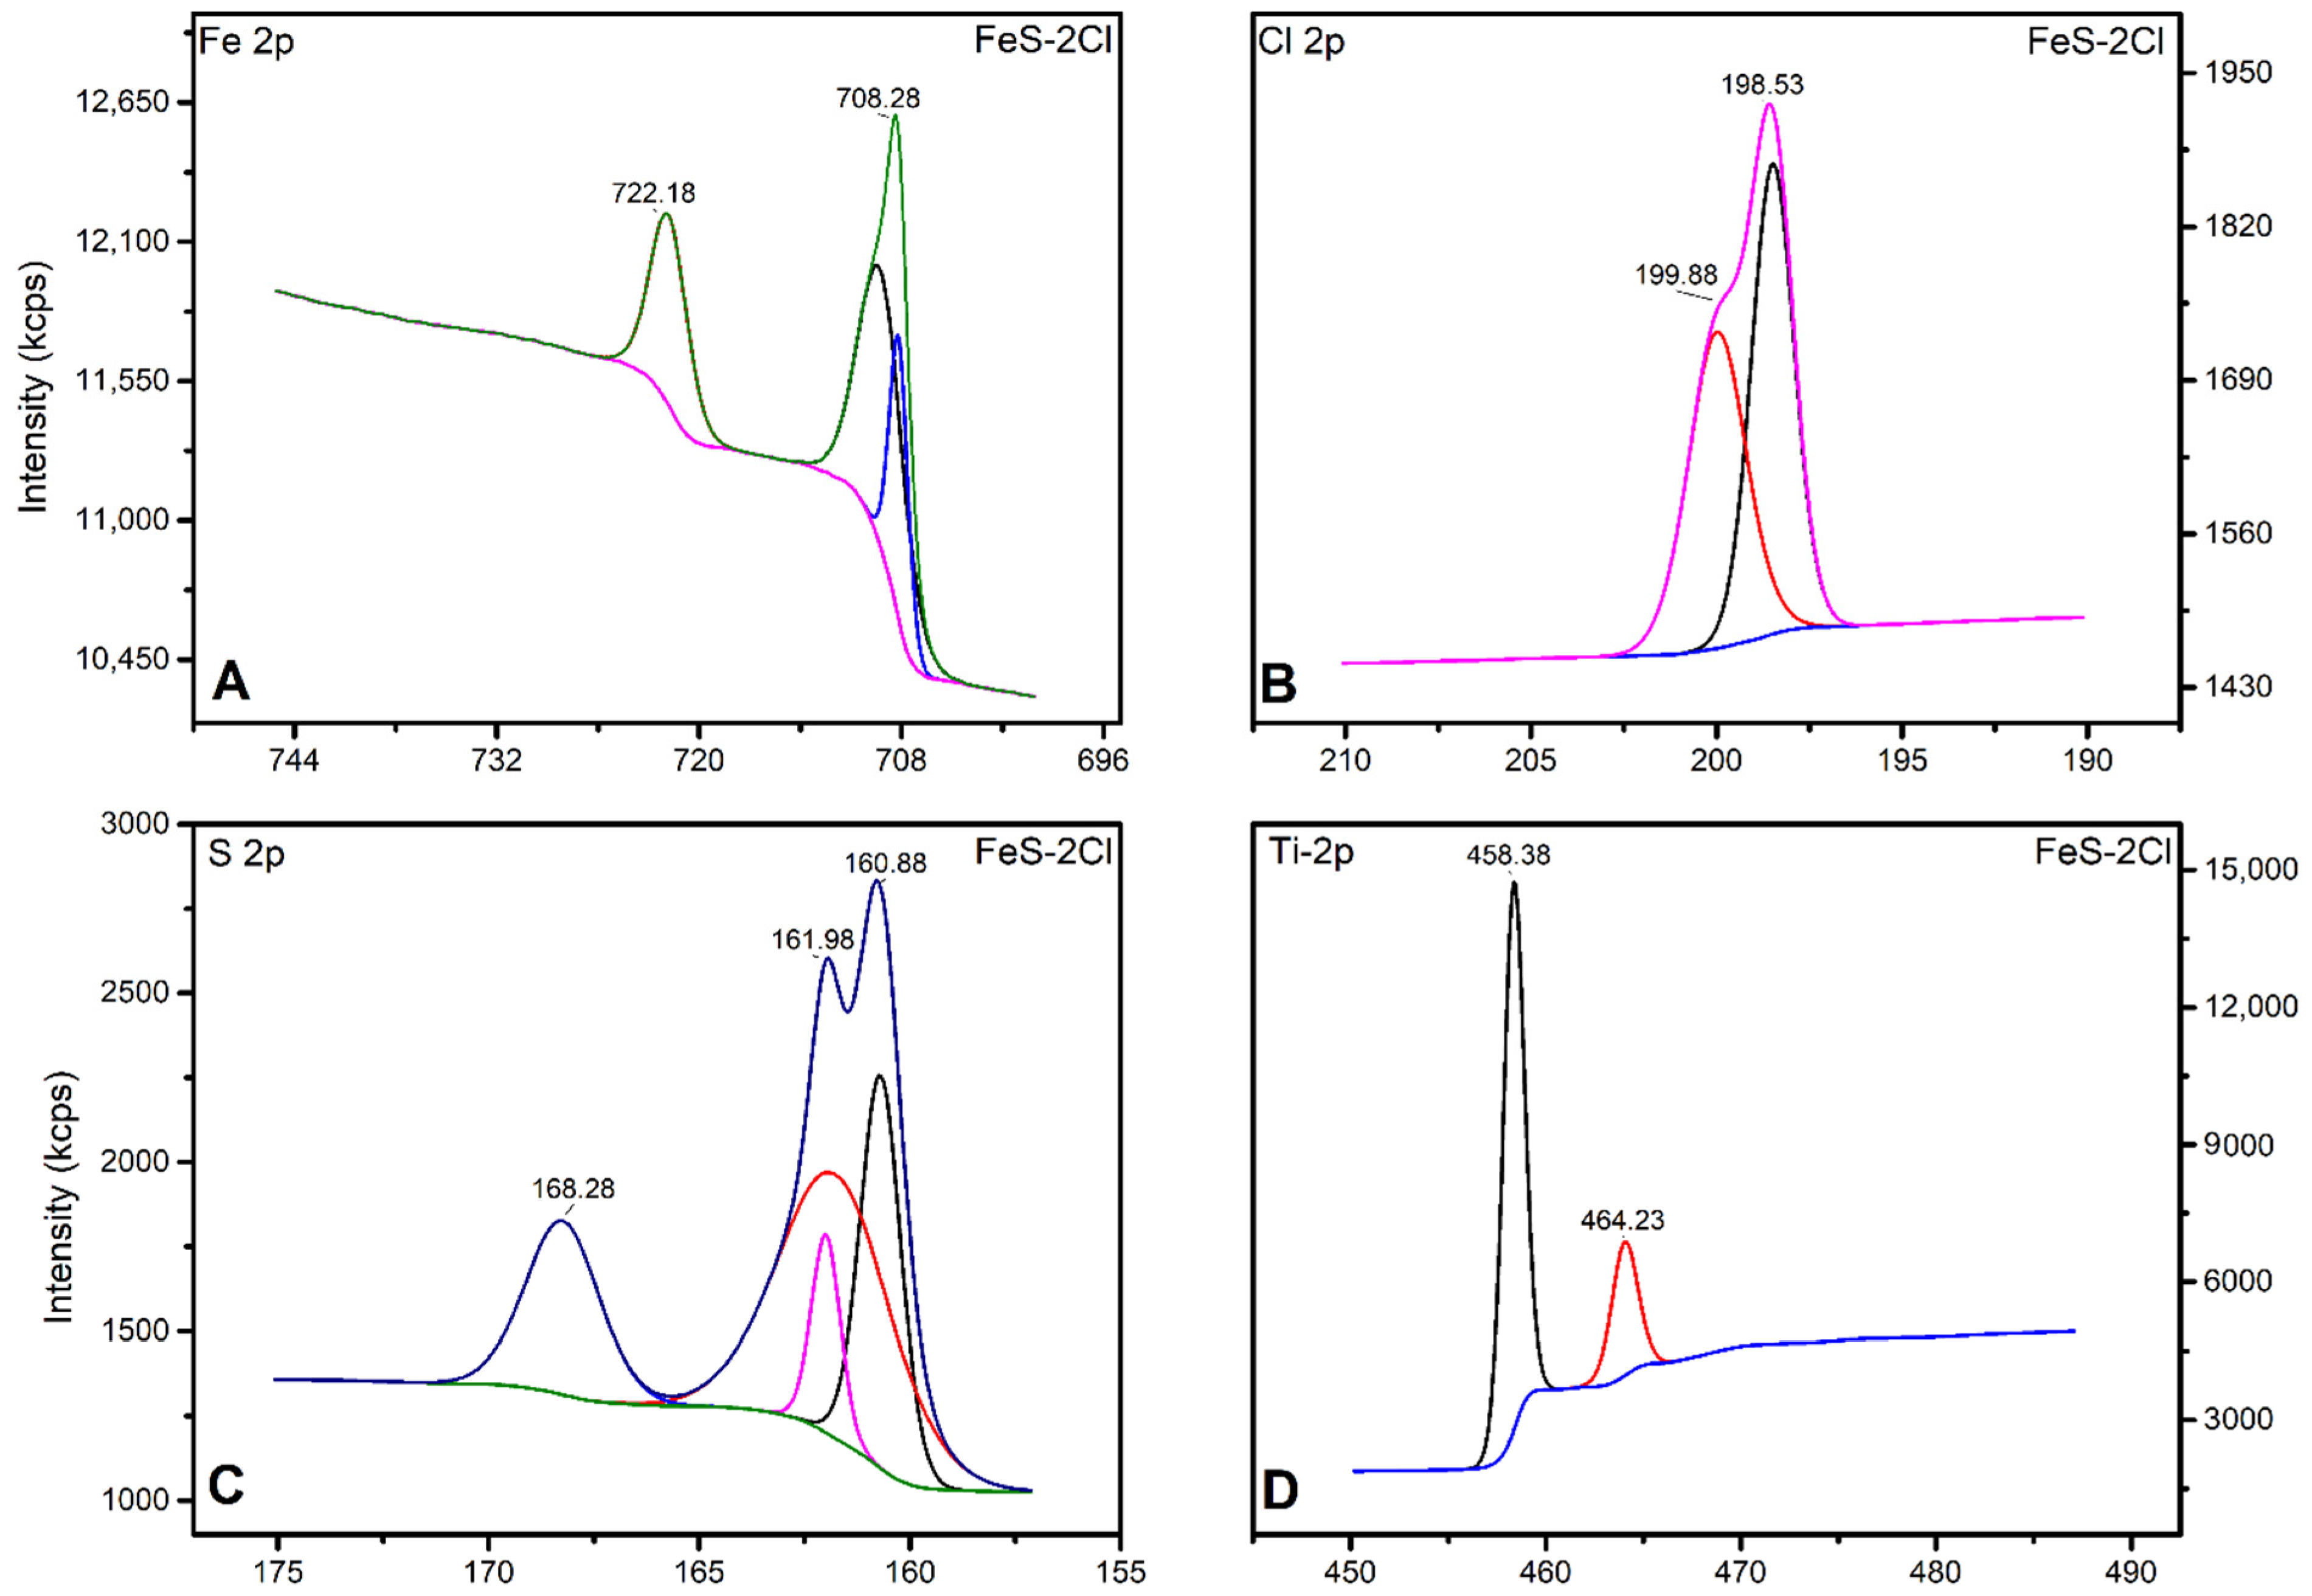
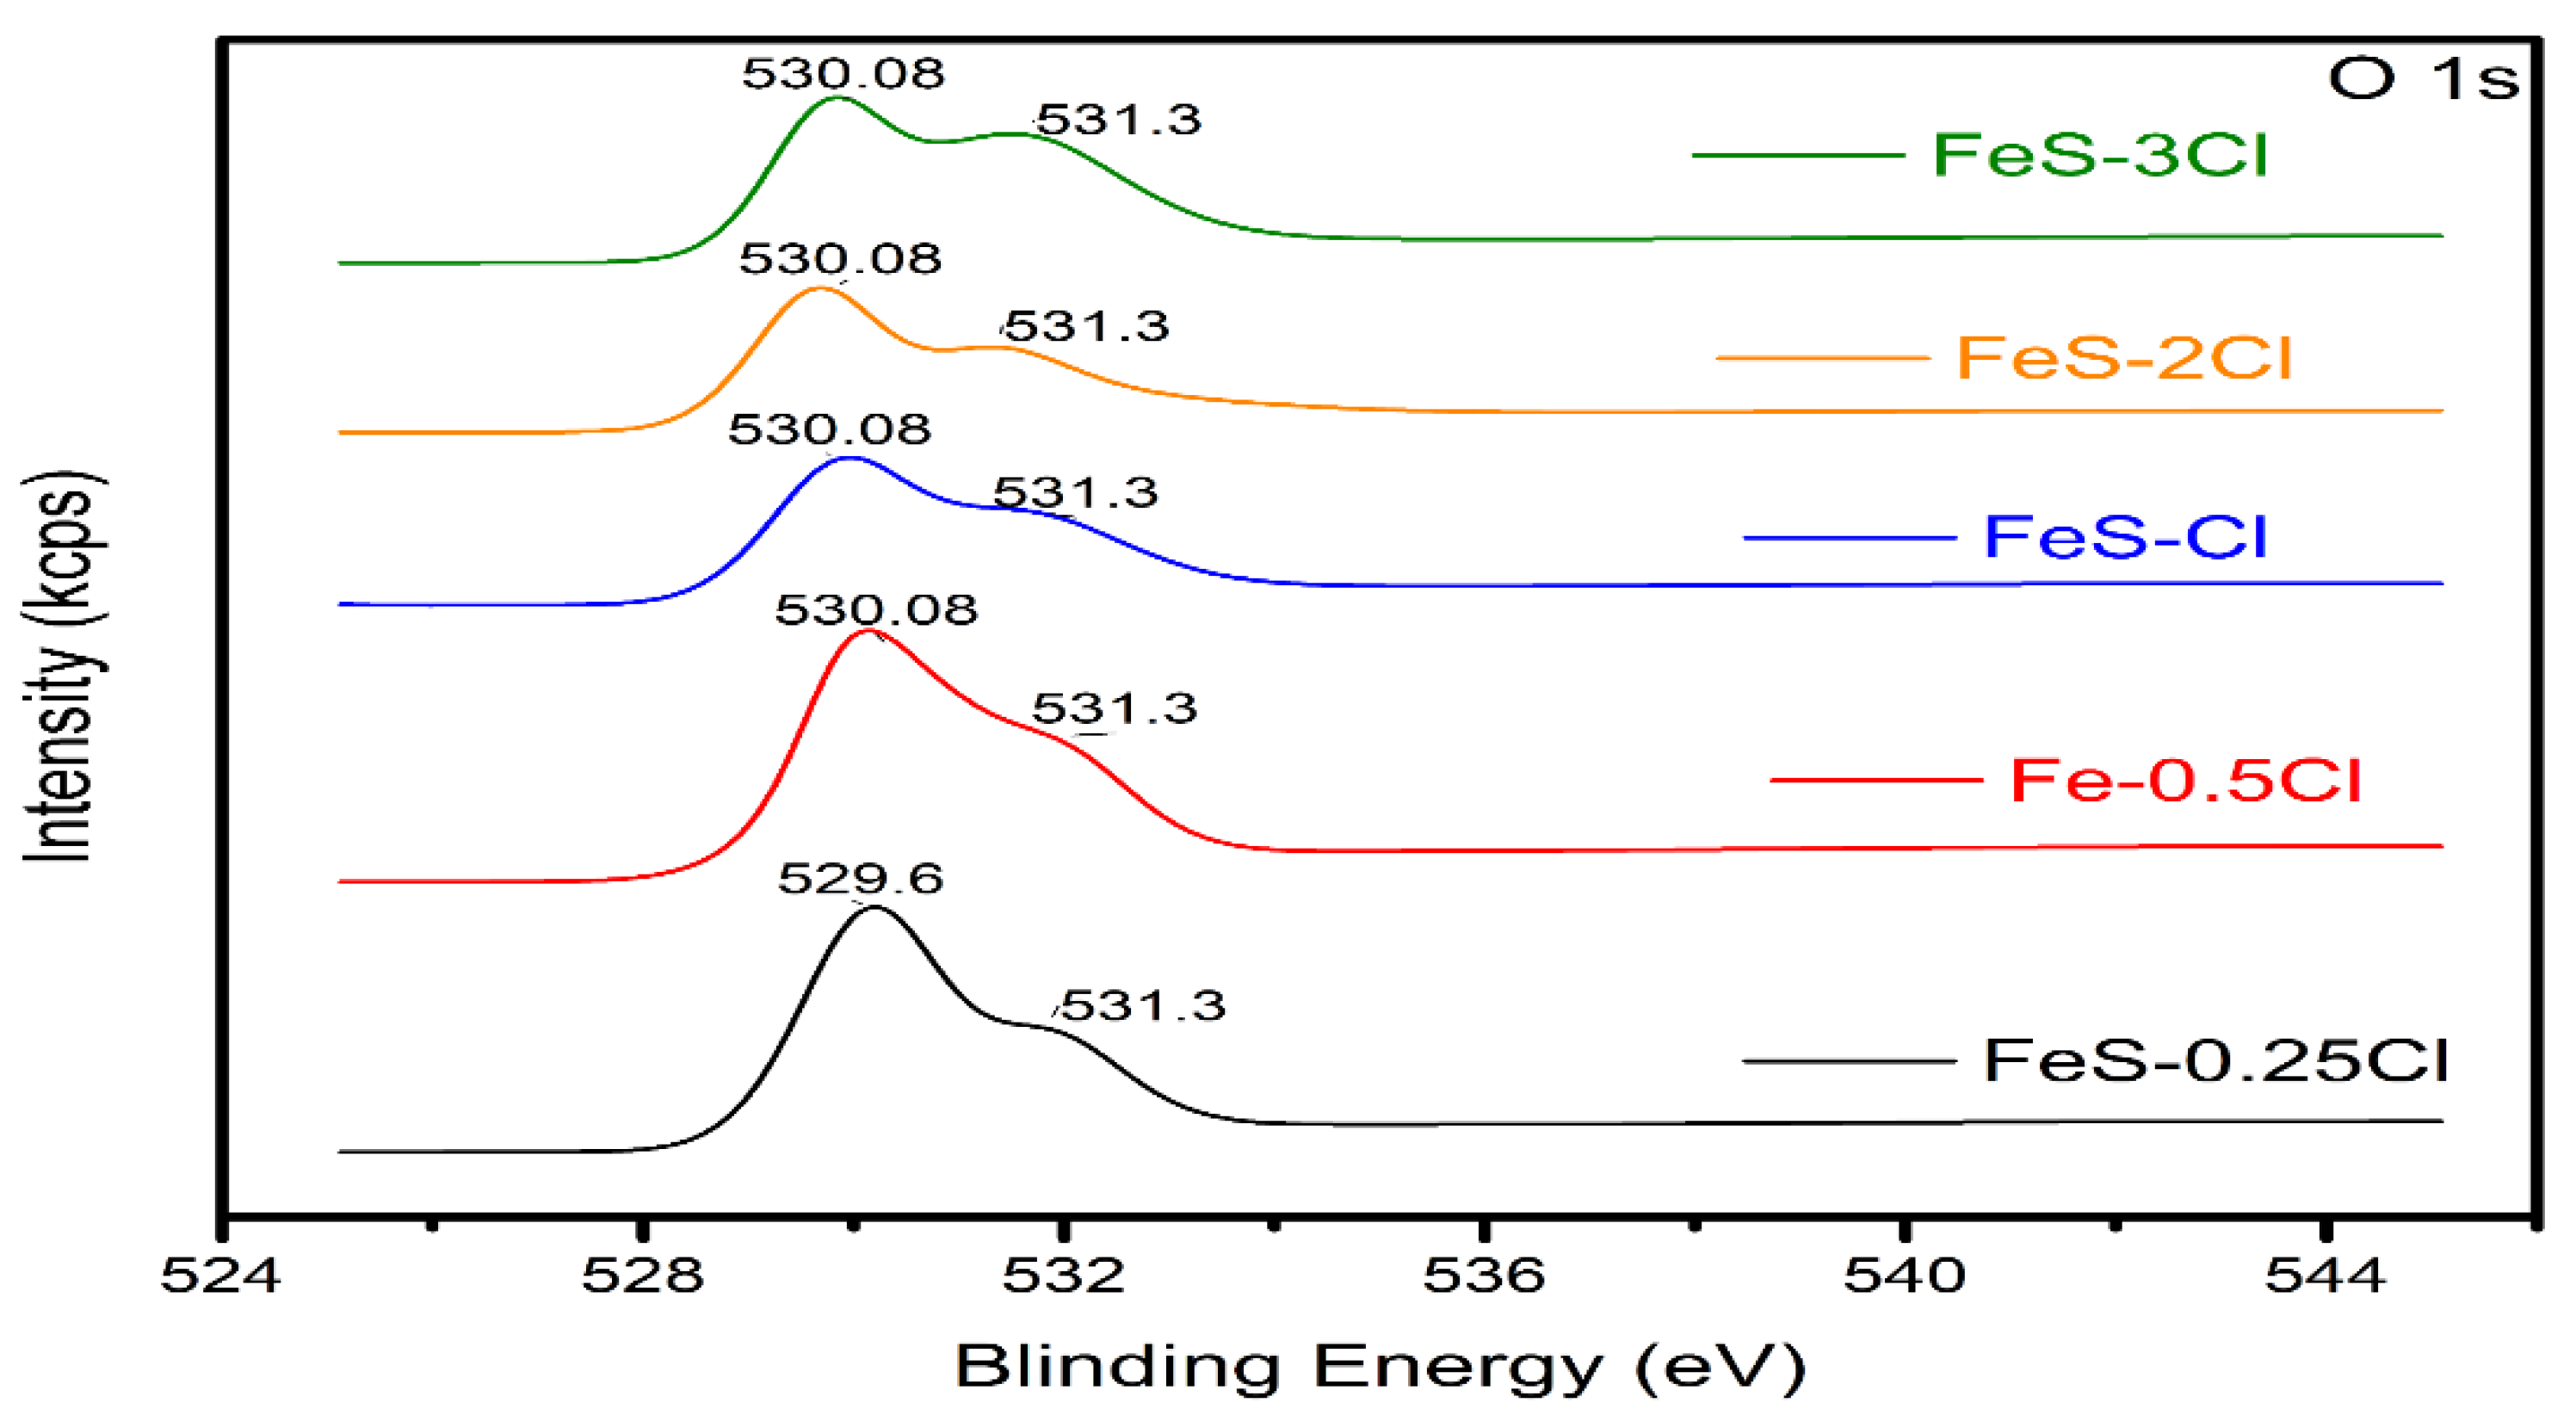
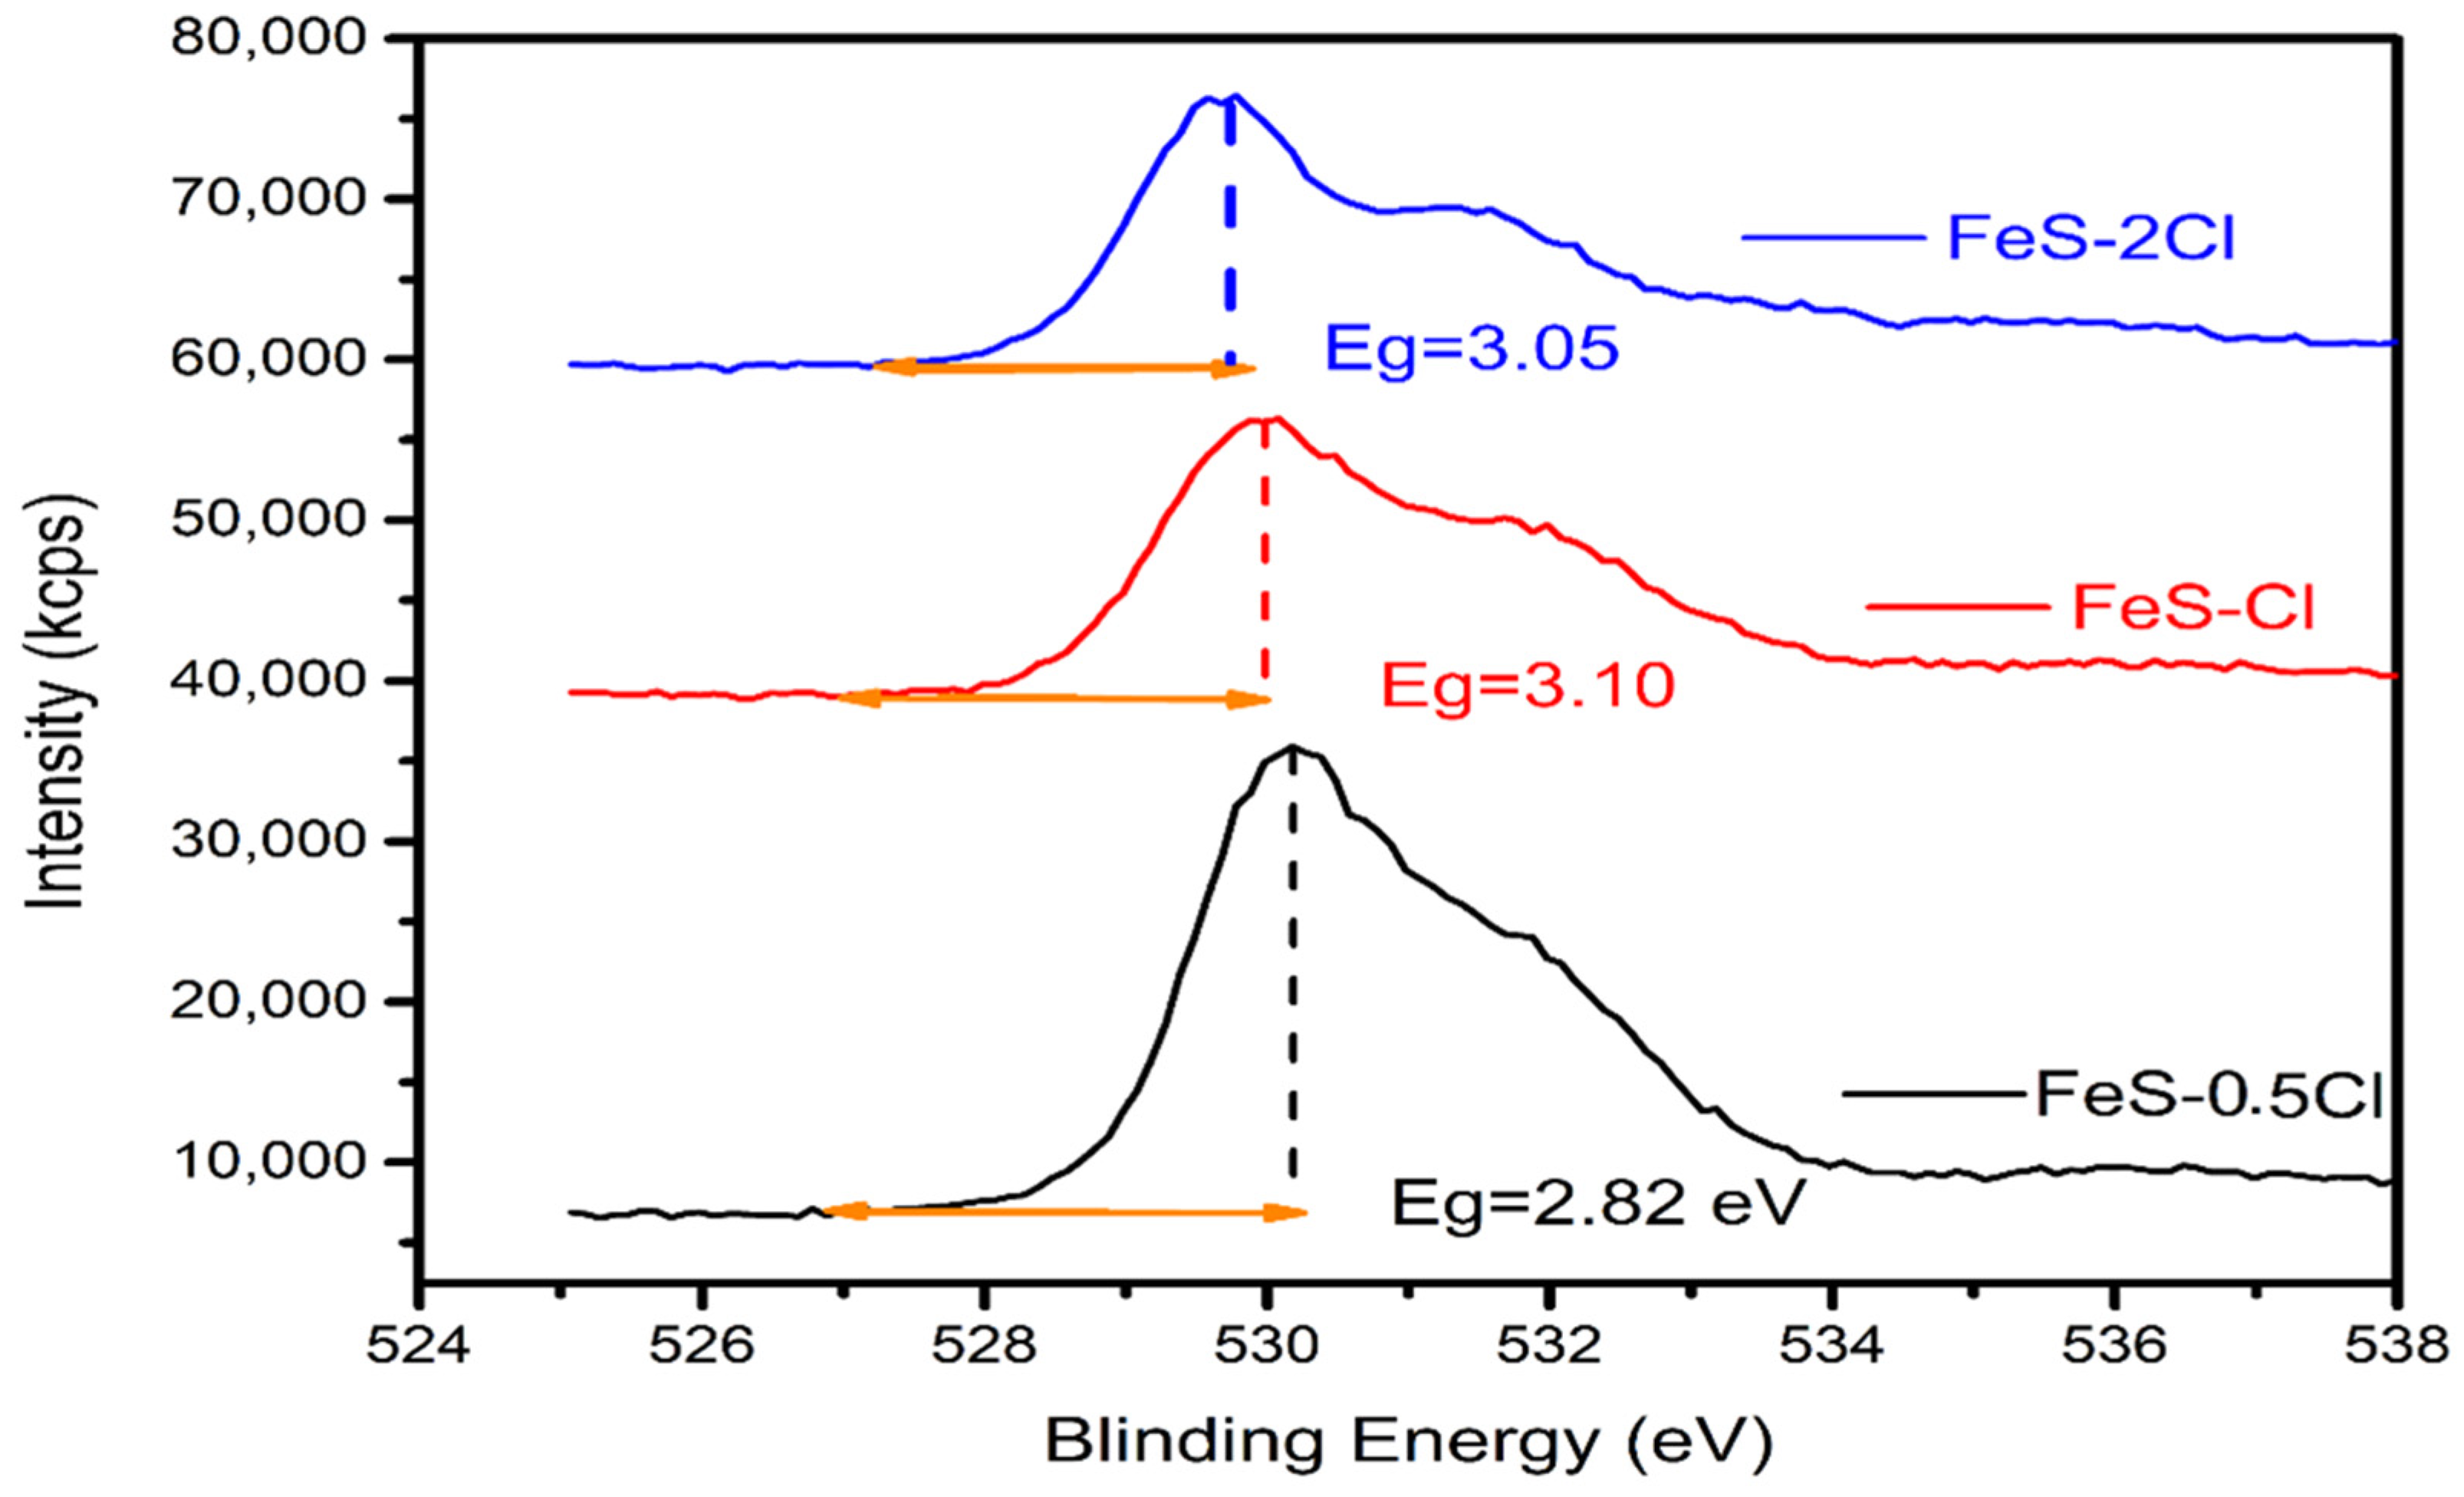
X-ray Photoelectron Spectroscopy (XPS)
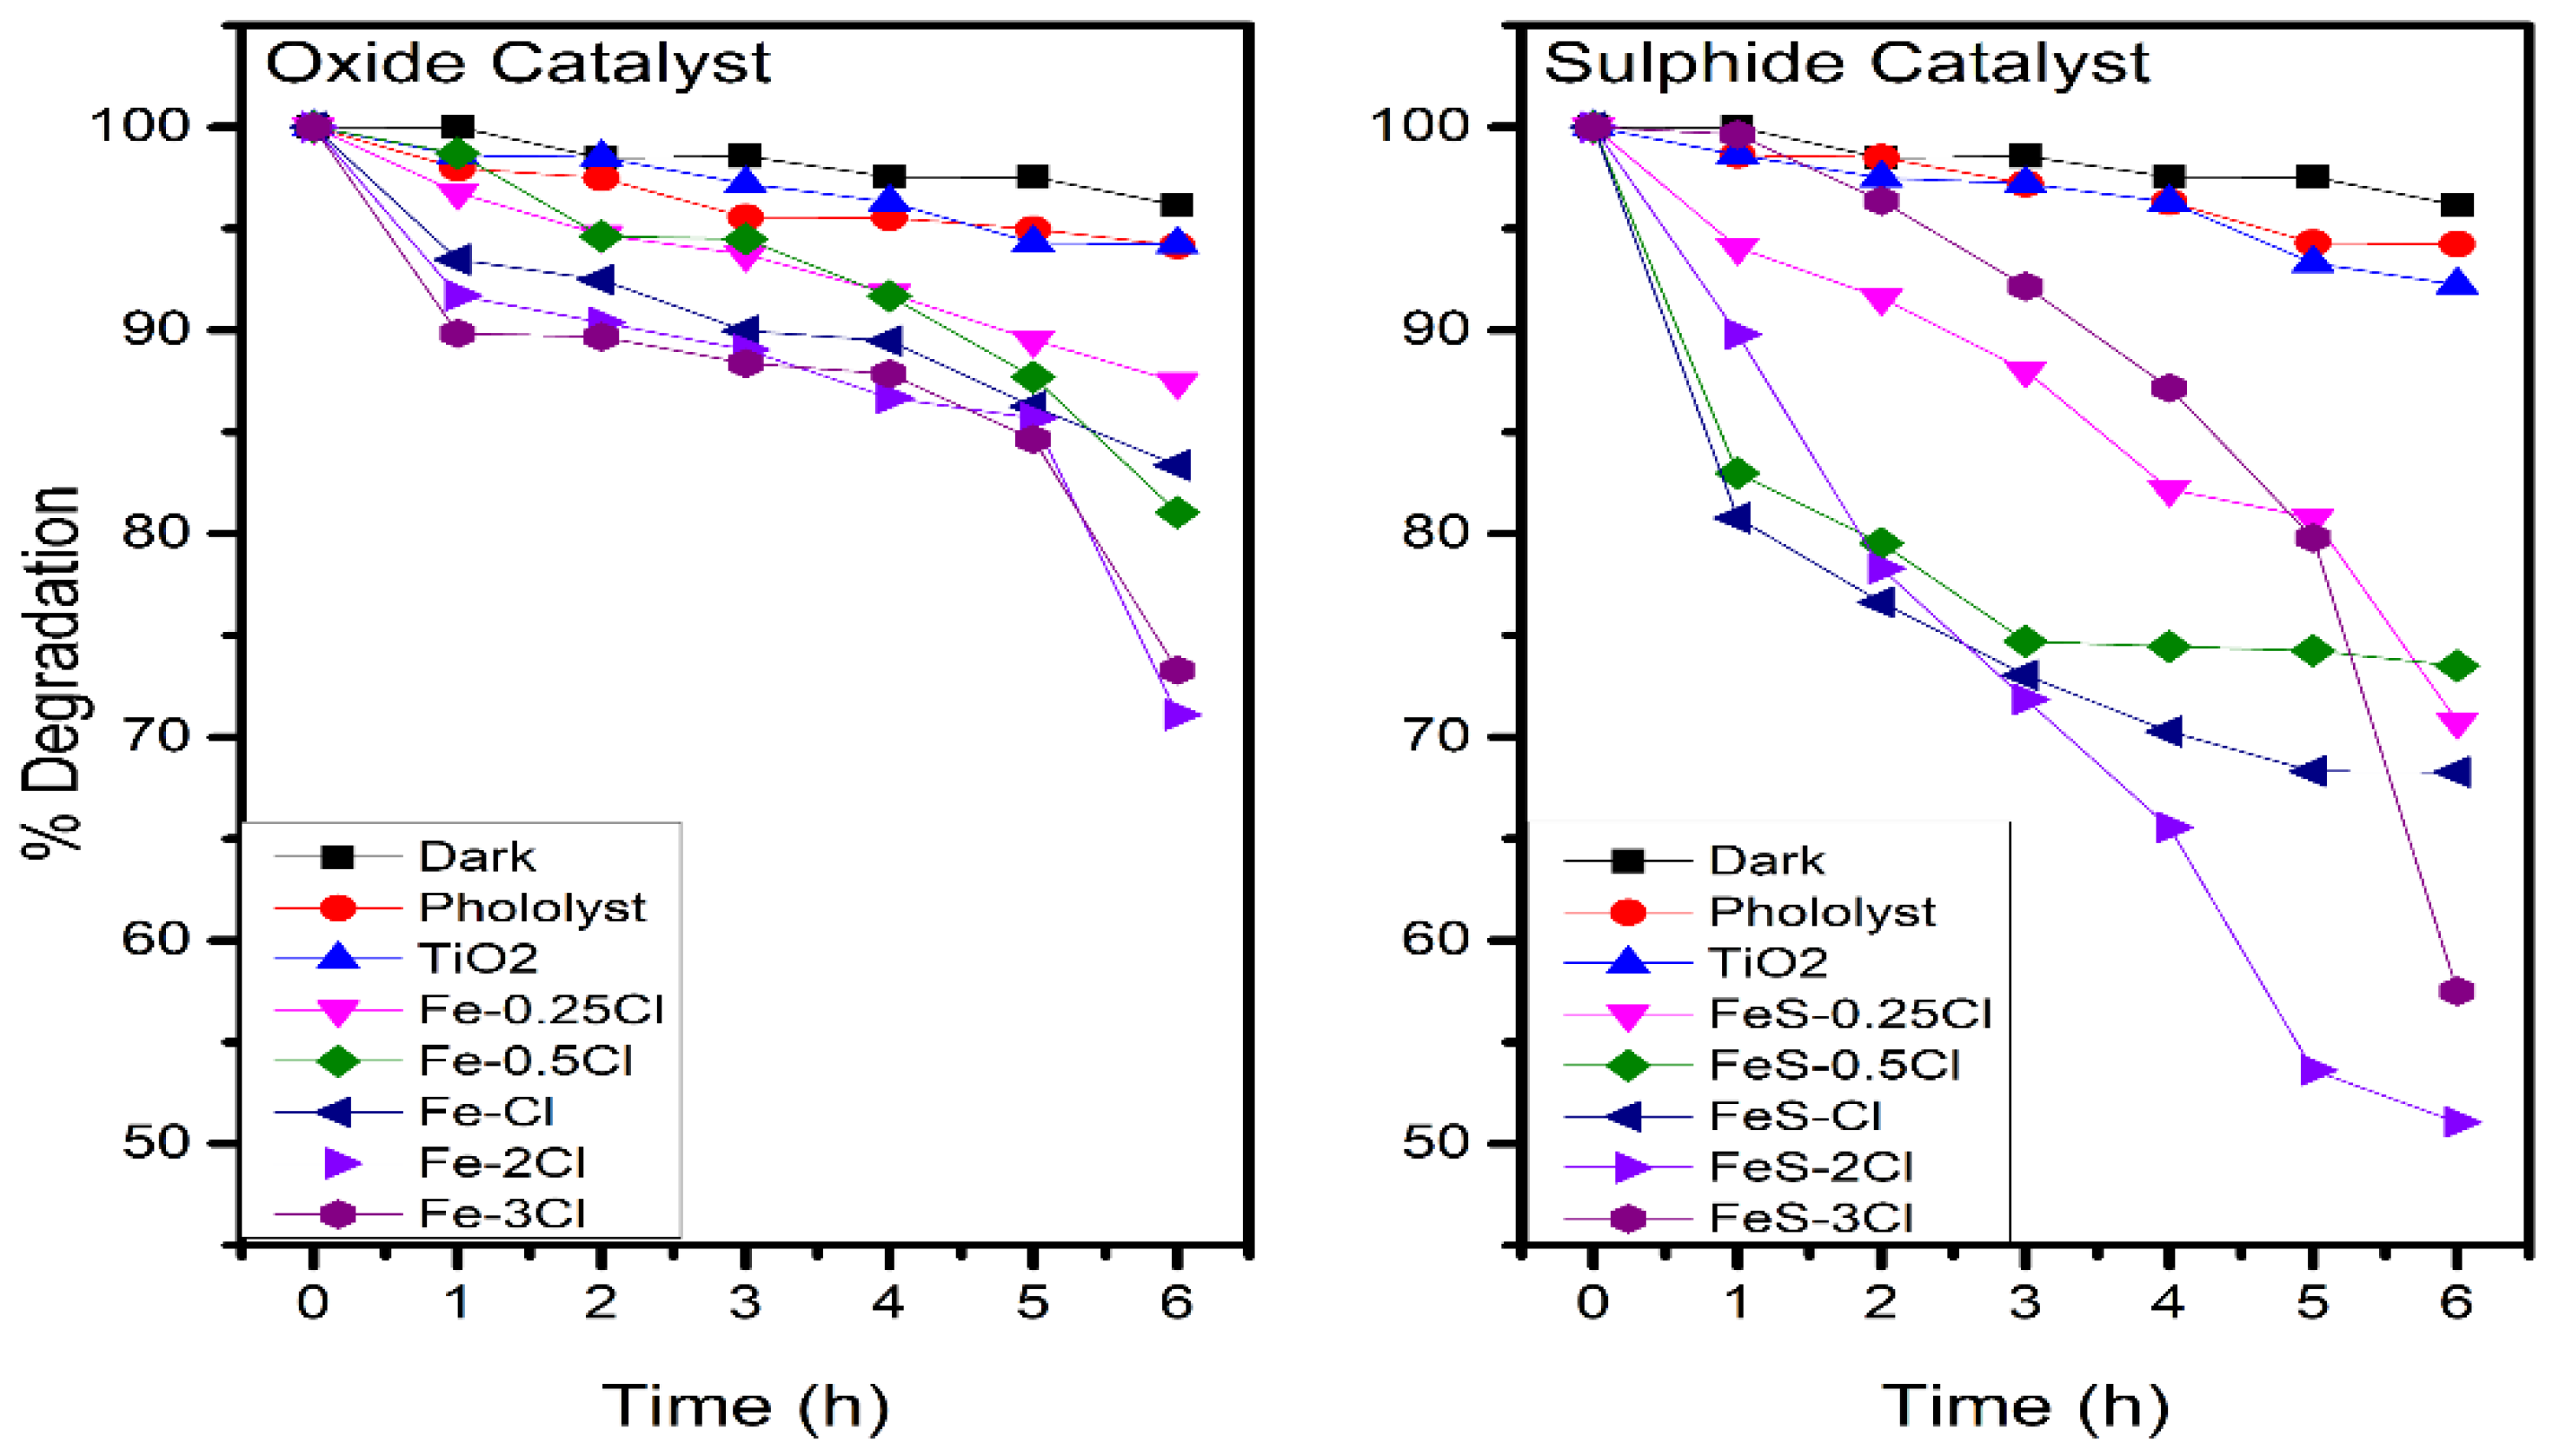
2.3. Photocatalytic Activity
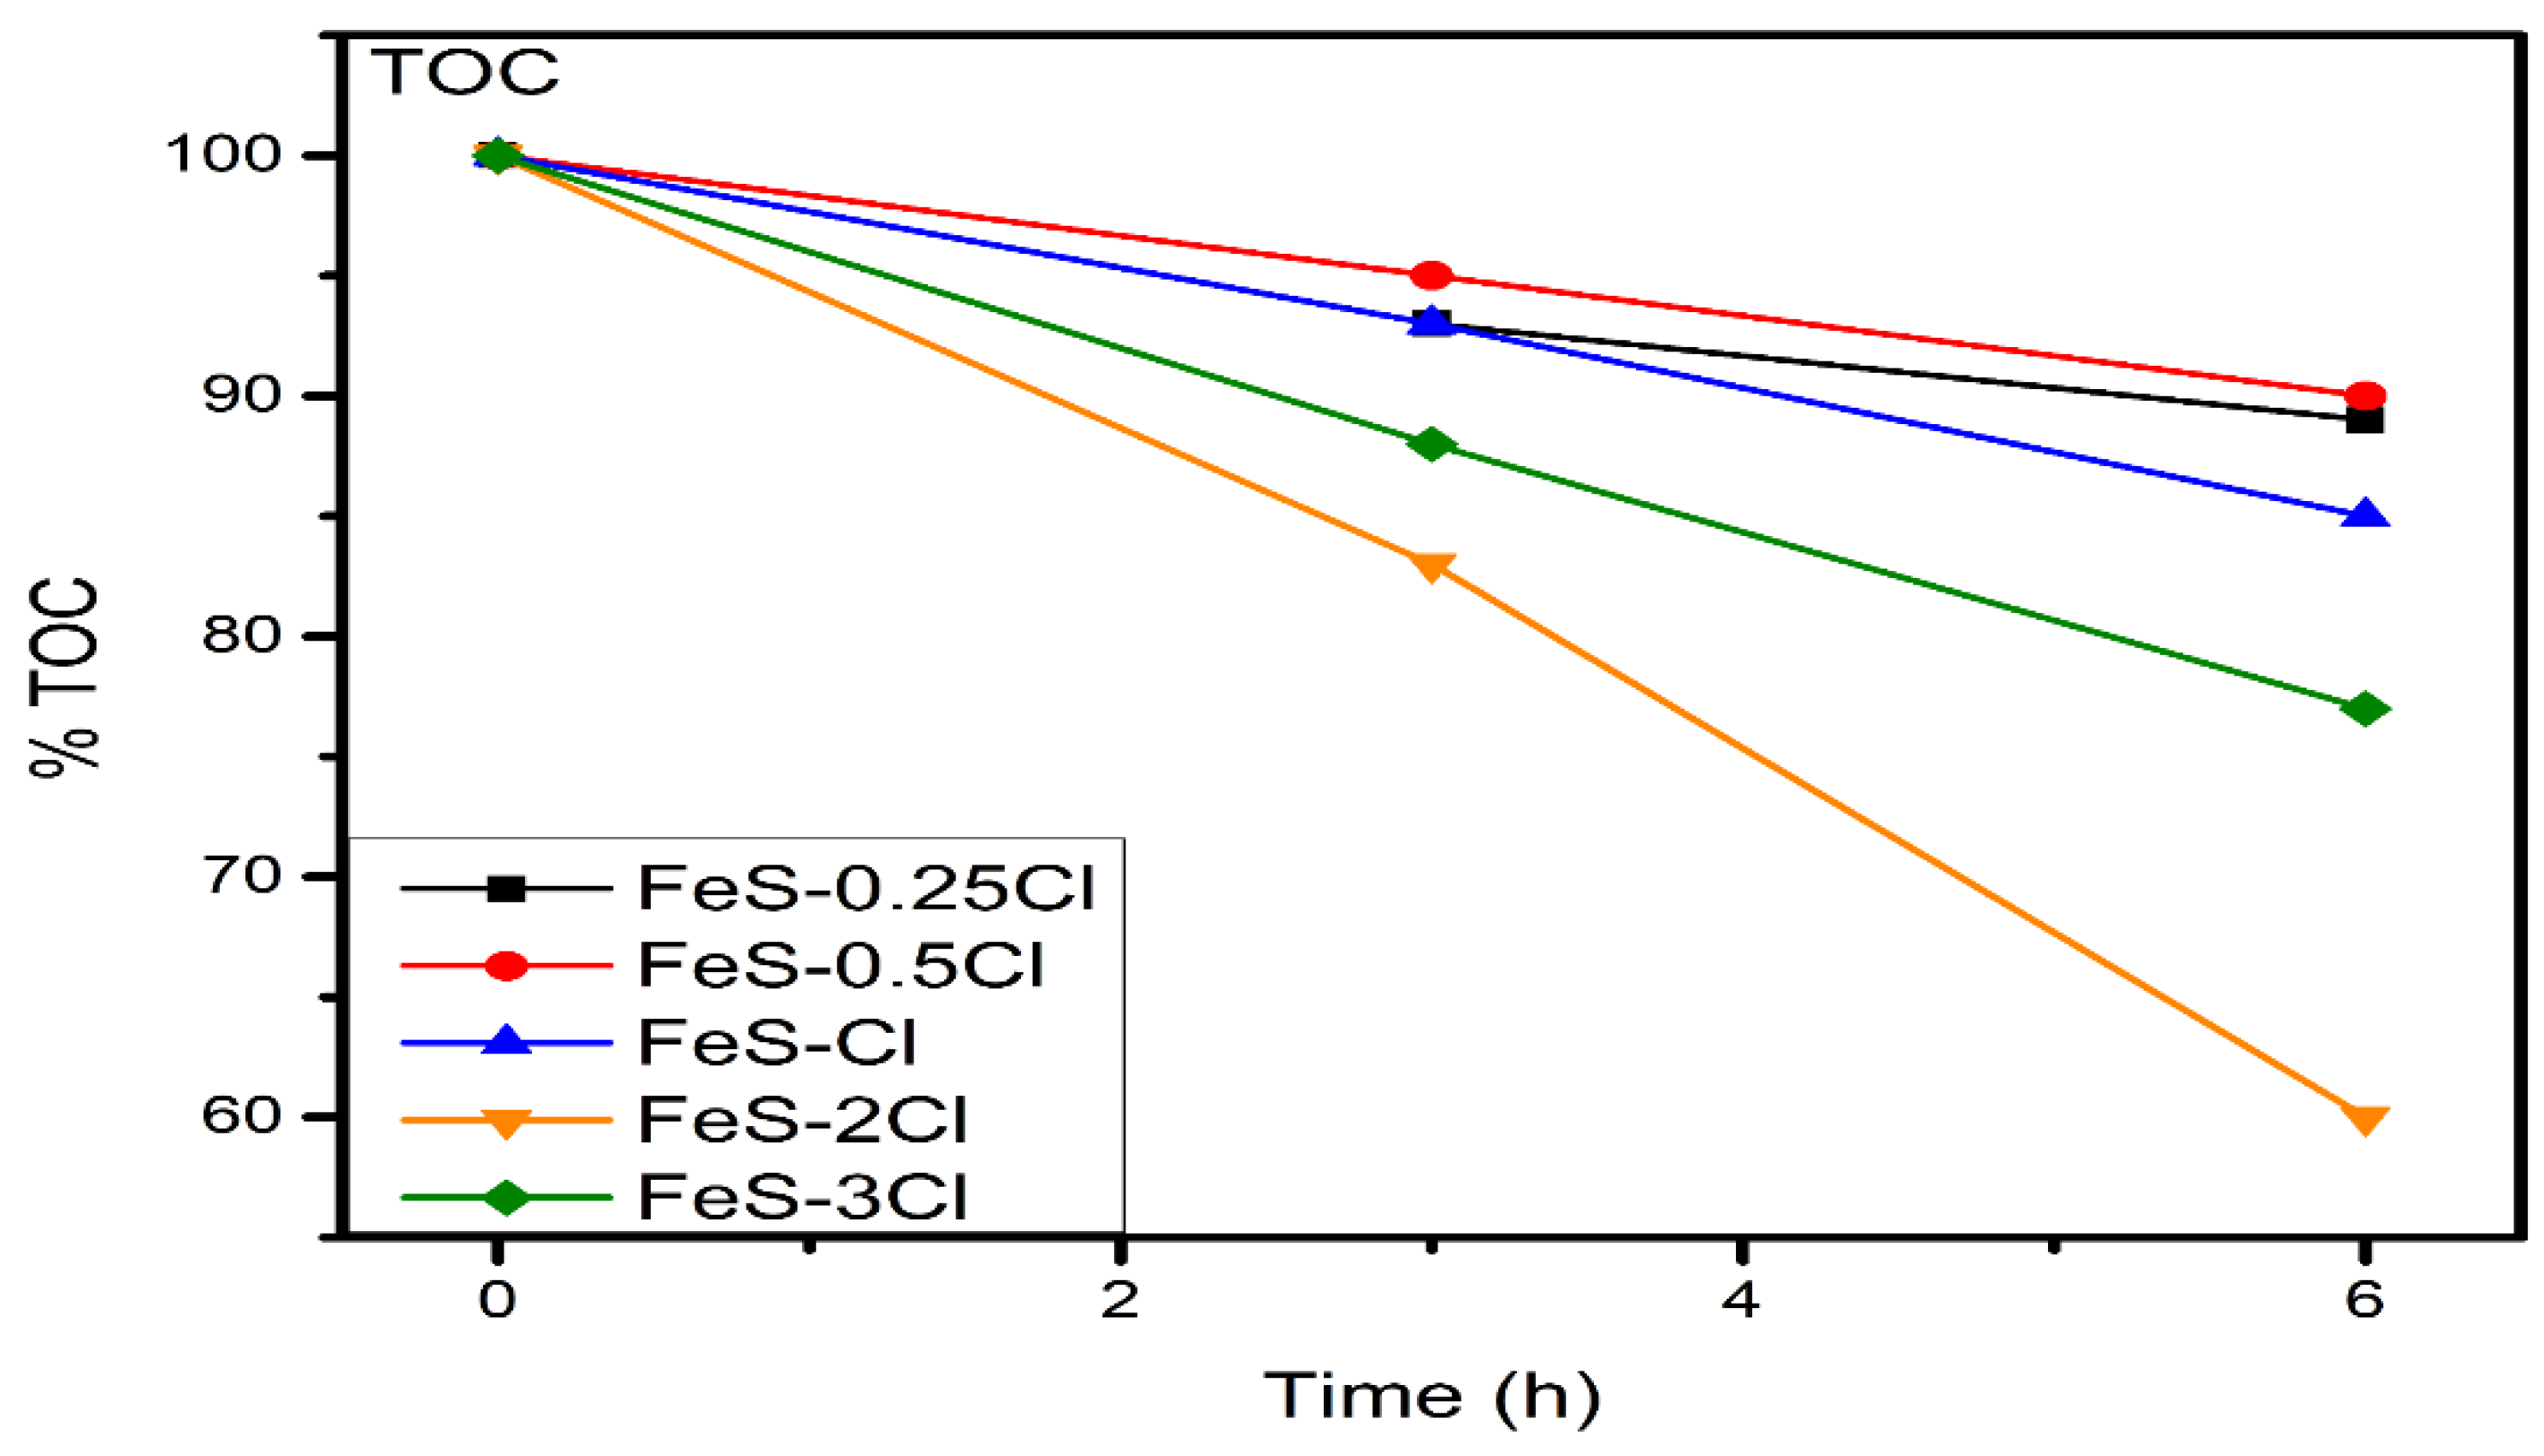
Total Organic Carbon (TOC) Analysis
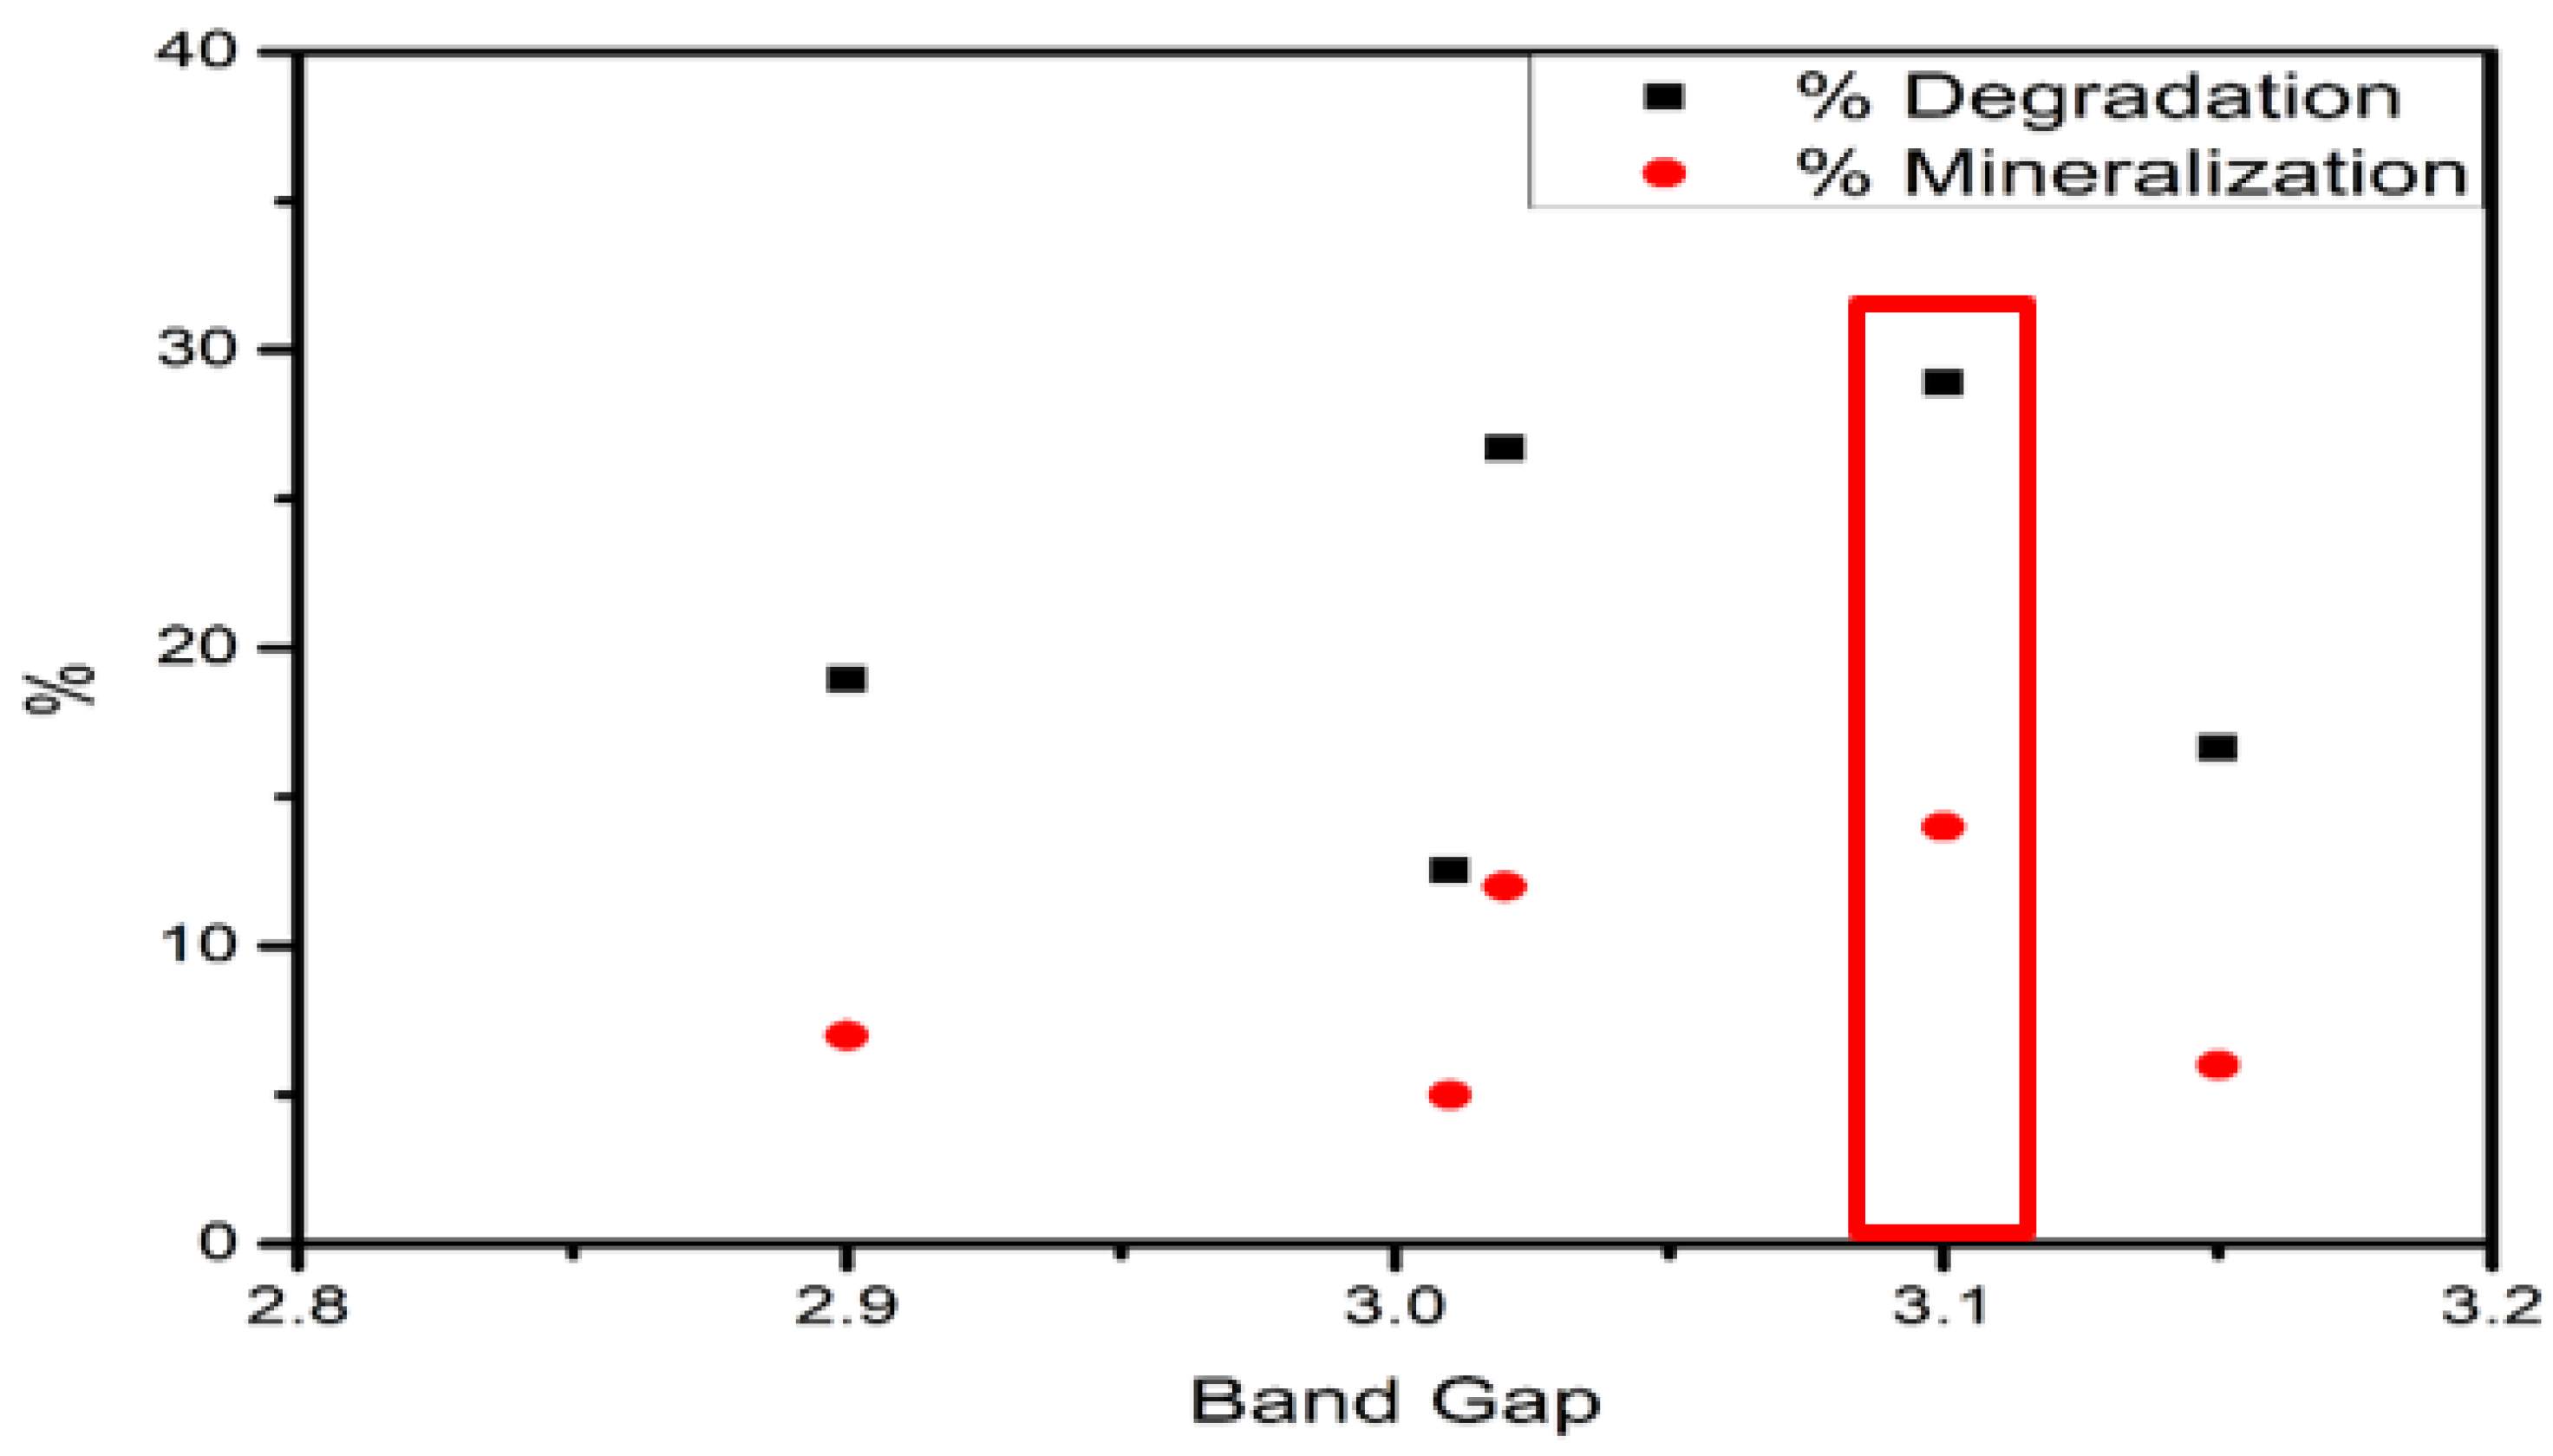
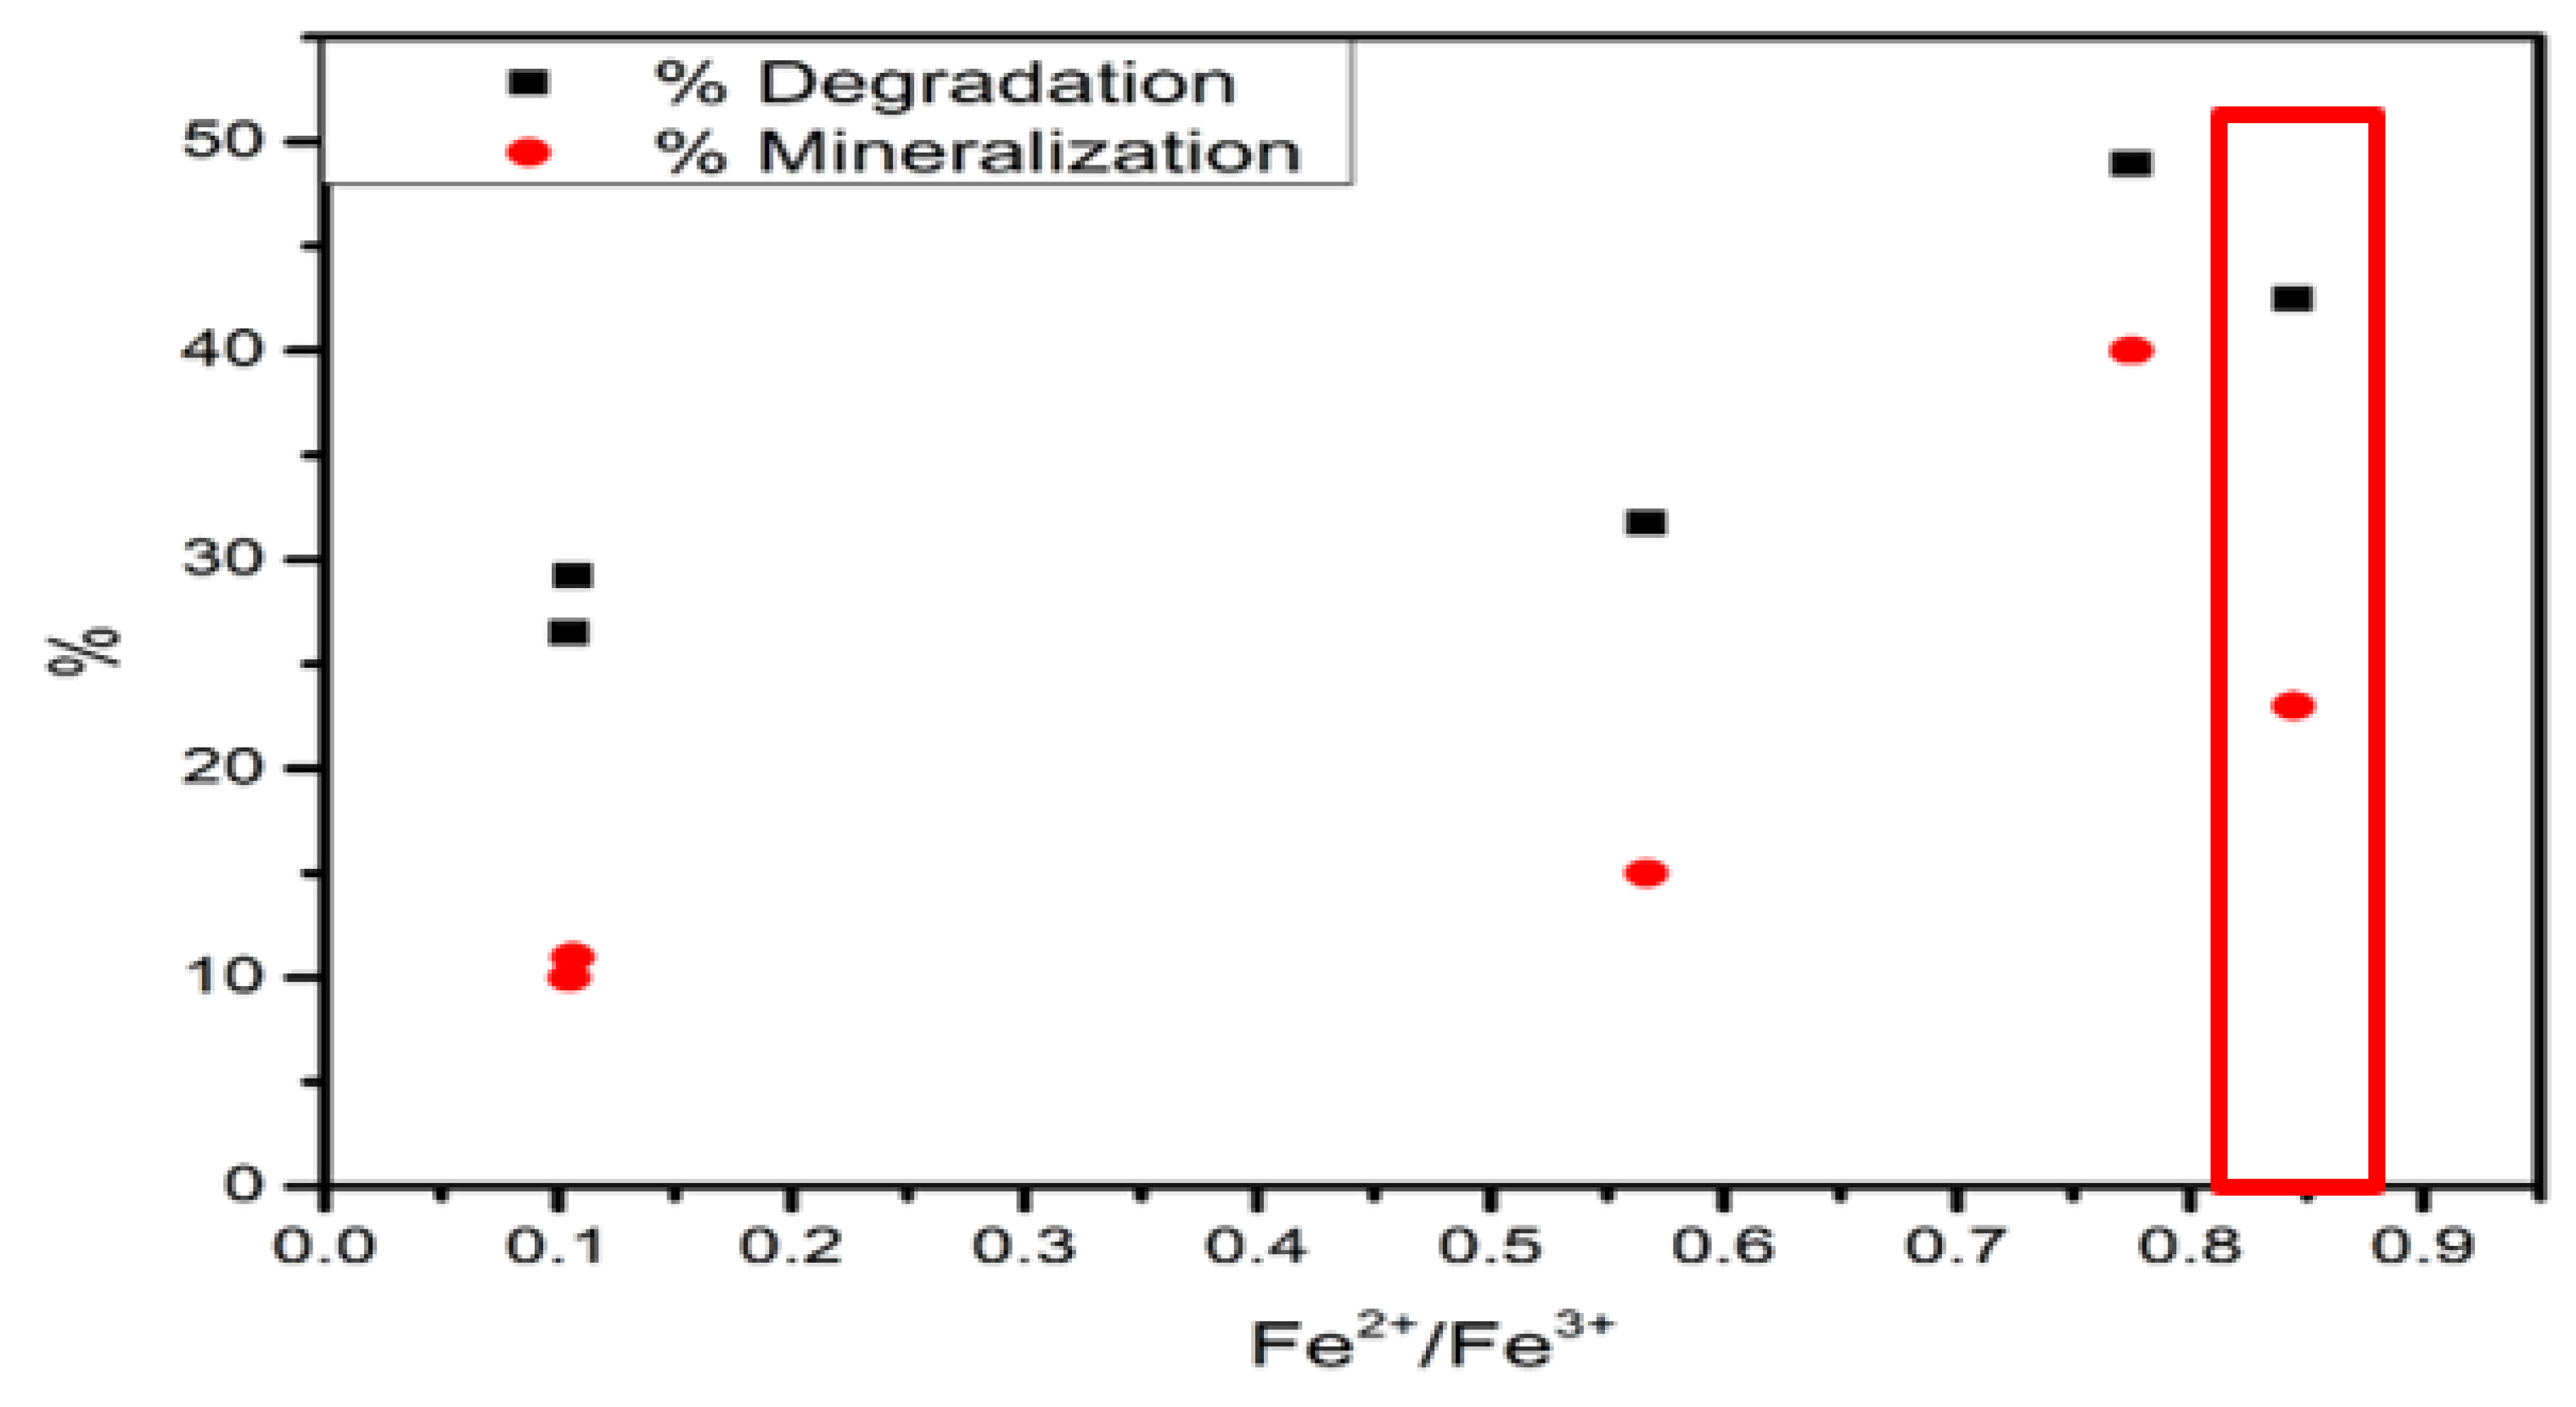
3. Discussion
4. Materials and Methods
- Ramp 1, drying: 5 °C per minute until reaching 120 °C and remained at that temperature for 3 h.
- Ramp 2, calcination: 10 °C per minute until reaching 300 °C and remained at that temperature for 5 h.
- Ramp 3, cooling: 5 °C per minute until reaching 50 °C and remained at that temperature for 3 h.
Characterization of the Synthesized Photocatalysts
5. Conclusions
Author Contributions
Funding
Conflicts of Interest
References
- Humayun, M.; Raziq, F.; Khan, A.; Luo, W. Modification strategies of TiO2 for potential applications in photocatalysis: A critical review. Green Chem. Lett. Rev. 2018, 11, 86–102. [Google Scholar] [CrossRef]
- Stagi, L.; Carbonaro, C.M.; Corpino, R.; Chiriu, D.; Ricci, P.C. Light induced TiO2 phase transformation: Correlation with luminescent surface defects. Phys. Status Solidi (B) 2015, 252, 124–129. [Google Scholar] [CrossRef]
- Moose. Summary of Environmental Law in Mexico. Available online: https://moose.cec.org/moose/lawdatabase/mxdoc.cfm?varlan=english&topic=9 (accessed on 3 June 2003).
- Anku, W.W.; Mamo, M.A.; Govender, P.P. Phenolic Compounds in Water: Sources, Reactivity, Toxicity and Treatment Methods. In Phenolic Compounds—Natural Sources, Importance and Applications; IntechOpen: London, UK, 2017; Available online: https://www.intechopen.com/chapters/53973 (accessed on 10 April 2022).
- Ghime, D.; Ghosh, P. Advanced Oxidation Processes: A Powerful Treatment Option for the Removal of Recalcitrant Organic Compounds. In Advanced Oxidation Processes-Applications, Trends, and Prospects; IntechOpen: London, UK, 2020; pp. 1–12. [Google Scholar]
- Esplugas, S.; Giménez, J.; Contreras, S.; Pascual, E.; Rodríguez, M. Comparison of different advanced oxidation processes for phenol degradation. Water Res. 2002, 36, 1034–1042. [Google Scholar] [CrossRef]
- Herrmann, J.M.; Duchamp, C.; Karkmaz, M.; Hoai, B.T.; Lachheb, H.; Puzenat, E.; Guillard, C. Environmental green chemistry as defined by photocatalysis. J. Hazard. Mater. 2007, 146, 624–629. [Google Scholar] [CrossRef] [PubMed]
- Hoffmann, M.R.; Martin, S.T.; Choi, W.; Bahnemann, D.W. Environmental Applications of Semiconductor Photocatalysis. Chem. Rev. 1995, 95, 69–96. [Google Scholar] [CrossRef]
- Maeda, K. Photocatalytic water splitting using semiconductor particles: History and recent developments. J. Photochem. Photobiol. C Photochem. Rev. 2011, 12, 237–268. [Google Scholar] [CrossRef]
- Dursun, G.; Çiçek, H.; Dursun, A.Y. Adsorption of phenol from aqueous solution by using carbonised beet pulp. J. Hazard. Mater. 2005, 125, 175–182. [Google Scholar] [CrossRef]
- Ugurlu, M.; Gurses, A.; Yalcin, M.; Dogar, C. Removal of phenolic and lignin compounds from bleached kraft mill effluent by fly ash and sepiolite. Adsorption 2005, 11, 87–97. [Google Scholar] [CrossRef]
- Al-Kandari, H.; Abdullah, A.; Mohamed, A.; Al-Kandari, S. Enhanced photocatalytic degrada tion of a phenolic compounds’ mixture using a highly efficient TiO2/reduced graphene oxide nanocomposite. J. Mater. Sci. 2016, 51, 8331–8345. [Google Scholar] [CrossRef]
- Zhu, Y.; Liu, Y.; Ai, Q.; Gao, G.; Yuan, L.; Fang, Q.; Tian, X.; Zhang, X.; Egap, E.; Ajayan, P.M.; et al. In Situ Synthesis of Lead-Free Halide Perovskite–COF Nanocomposites as Photocatalysts for Photoinduced Polymerization in Both Organic and Aqueous Phases. ACS Mater. Lett. 2022, 4, 464–471. [Google Scholar] [CrossRef]
- Abdollahi, Y.; Abdullah, A.H.; Zainal, Z.; Yusof, N.A. Photocatalytic degradation of p-Cresol by zinc oxide under UV irradiation. Int. J. Mol. Sci. 2012, 13, 302–315. [Google Scholar] [CrossRef] [PubMed]
- Zhang, J.; Ma, J.; Zhang, S.; Wang, W.; Chen, Z. A highly sensitive nonenzymatic glucose sensor based on CuO nanoparticles decorated carbon spheres. Sens. Actuators B Chem. 2015, 211, 385–391. [Google Scholar] [CrossRef]
- Feng, Y.-B.; Hong, L.; Liu, A.-L.; Chen, W.-D.; Li, G.-W.; Chen, W.; Xia, X.-H. High-efficiency catalytic degradation of phenol based on the peroxidase-like activity of cupric oxide nanoparticles. Int. J. Environ. Sci. Technol. 2015, 12, 653–660. [Google Scholar] [CrossRef]
- Mirian, Z.-A.; Nezamzadeh-Ejhieh, A. Removal of phenol content of an industrial wastewater via a heterogeneous photodegradation process using supported FeO onto nanoparticles of Iranian clinoptilolite. Desalination Water Treat. 2016, 57, 16483–16494. [Google Scholar] [CrossRef]
- Shahrezaei, F.; Akhbari, A.; Rostami, A. Photodegradation and removal of phenol and phenolic derivatives from petroleum refinery wastewater using nanoparticles of TiO2. Int. J. Energy Environ. 2012, 3, 267–274. [Google Scholar]
- Zeng, G.; Zhang, Q.; Liu, Y.; Zhang, S.; Guo, J. Preparation of TiO2 and Fe-TiO2 with an Impinging Stream-Rotating Packed Bed by the Precipitation Method for the Photodegradation of Gaseous Toluene. Nanomaterials 2019, 9, 1173. [Google Scholar] [CrossRef]
- Cao, Z.; Zhang, T.; Ren, P.; Cao, D.; Lin, Y.; Wang, L.; Zhang, B.; Xiang, X. Doping of Chlorine from a Neoprene Adhesive Enhances Degradation Efficiency of Dyes by Structured TiO2-Coated Photocatalytic Fabrics. Catalysts 2020, 10, 69. [Google Scholar] [CrossRef]
- Niu, Y.; Xing, M.; Zhang, J.; Tian, B. Visible light activated sulfur and iron co-doped TiO2 photocatalyst for the photocatalytic degradation of phenol. Catal. Today 2013, 201, 159–166. [Google Scholar] [CrossRef]
- Royal Institute of Technology. Kungliga Tekniska högskolan Chemical Equilibrium Diagrams 2016. Available online: https://www.kth.se/che/medusa/downloads-1.386254 (accessed on 10 April 2022).
- Oelkers, E.H.; Helgeson, H.C. Triple-ion anions and polynuclear complexing in supercritical electrolyte solutions. Geochim. Cosmochim. Acta 1990, 54, 727–738. [Google Scholar] [CrossRef]
- Suárez-Toriello, V.A.; Santolalla-Vargas, C.E.; de los Reyes, J.A.; Vázquez-Zavala, A.; Vrinat, M.; Geantet, C. Influence of the solution pH in impregnation with citric acid and activity of Ni/W/Al2O3 catalysts. J. Mol. Catal. A Chem. 2015, 404–405, 36–46. [Google Scholar] [CrossRef]
- Bielan, Z.; Dudziak, S.; Sulowska, A.; Pelczarski, D.; Ryl, J.; Zielińska-Jurek, A. Preparation and Characterization of Defective TiO2. The Effect of the Reaction Environment on Titanium Vacancies Formation. Materials 2020, 13, 2763. [Google Scholar] [CrossRef] [PubMed]
- Lerici, L.; Femanelli, C.; Diguilio, E.; Pierella, L.; Saux, C. Síntesis y caracterización de fotocatalizadores de hierro soportado sobre zeolitas microporosas. Matéria 2018, 23, 450. [Google Scholar] [CrossRef]
- Samanta, S.; Giri, S.; Sastry, P.U.; Mal, N.K.; Manna, A.; Bhaumik, A. Synthesis and Characterization of Iron-Rich Highly Ordered Mesoporous Fe-MCM-41. Ind. Eng. Chem. Res. 2003, 42, 3012–3018. [Google Scholar] [CrossRef]
- Wang, J.-C.; Ren, J.; Yao, H.C.; Zhang, L.; Wang, J.S.; Zang, S.Q.; Li, Z.J. Synergistic photocatalysis of Cr(VI) reduction and 4-Chlorophenol degradation over hydroxylated α-Fe2O3 under visible light irradiation. J. Hazard. Mater. 2016, 311, 11–19. [Google Scholar] [CrossRef] [PubMed]
- Abbott, A.P.; Al-Bassam, A.Z.; Goddard, A.; Harris, R.C.; Jenkin, G.R.; Nisbet, F.J.; Wieland, M. Dissolution of pyrite and other Fe–S–As minerals using deep eutectic solvents. Green Chem. 2017, 19, 2225–2233. [Google Scholar] [CrossRef]
- Makuła, P.; Pacia, M.; Macyk, W. How To Correctly Determine the Band Gap Energy of Modified Semiconductor Photocatalysts Based on UV–Vis Spectra. J. Phys. Chem. Lett. 2018, 9, 6814–6817. [Google Scholar] [CrossRef] [PubMed]
- Lv, H.; Zhao, H.; Cao, T.; Qian, L.; Wang, Y.; Zhao, G. Efficient degradation of high concentration azo-dye wastewater by heterogeneous Fenton process with iron-based metal-organic framework. J. Mol. Catal. A Chem. 2015, 400, 81–89. [Google Scholar] [CrossRef]
- Fakeeha, A.H.; Ibrahim, A.A.; Naeem, M.A.; Khan, W.U.; Abasaeed, A.E.; Alotaibi, R.L.; Al-Fatesh, A.S. Methane decomposition over Fe supported catalysts for hydrogen and nano carbon yield. Catal. Sustain. Energy 2015, 2, 71–82. [Google Scholar] [CrossRef]
- El-Deen, S.S.; Hashem, A.M.; Abdel Ghany, A.E.; Indris, S.; Ehrenberg, H.; Mauger, A.; Julien, C.M. Anatase TiO2 nanoparticles for lithium-ion batteries. Ionics 2018, 24, 2925–2934. [Google Scholar] [CrossRef]
- Song, C.; Wang, S.; Dong, W.; Fang, X.; Shao, J.; Zhu, J.; Pan, X. Hydrothermal synthesis of iron pyrite (FeS2) as efficient counter electrodes for dye-sensitized solar cells. Sol. Energy 2016, 133, 429–436. [Google Scholar] [CrossRef]
- Li, Y.-S.; Church, J.S.; Woodhead, A.L. Infrared and Raman spectroscopic studies on iron oxide magnetic nano-particles and their surface modifications. J. Magn. Magn. Mater. 2012, 324, 1543–1550. [Google Scholar] [CrossRef]
- Wang, X.; Xiang, Q.; Liu, B.; Wang, L.; Luo, T.; Chen, D.; Shen, G. TiO2 modified FeS Nanostructures with Enhanced Electrochemical Performance for Lithium-Ion Batteries. Sci. Rep. 2013, 3, 2007. [Google Scholar] [CrossRef] [PubMed]
- Yan, Z.; Zhuxia, Z.; Tianbao, L.; Xuguang, L.; Bingshe, X. XPS and XRD study of FeCl3–graphite intercalation compounds prepared by arc discharge in aqueous solution. Spectrochim. Acta Part A Mol. Biomol. Spectrosc. 2008, 70, 1060–1064. [Google Scholar] [CrossRef] [PubMed]
- Usha, N.; Viswanathan, B.; Murthy, V.R.K.; Sobhanadri, J. X-ray photoelectron spectroscopic study of some pure stages of graphite ferric chloride intercalation compounds. Spectrochim. Acta Part A Mol. Biomol. Spectrosc. 1997, 53, 1761–1765. [Google Scholar] [CrossRef]
- Luo, Y.; Luo, J.; Jiang, J.; Zhou, W.; Yang, H.; Qi, X.; Zhang, H.; Fan, H.J.; Yu, D.Y.W.; Li, C.M.; et al. Seed-assisted synthesis of highly ordered TiO2@α-Fe2O3 core/shell arrays on carbon textiles for lithium-ion battery applications. Energy Environ. Sci. 2012, 5, 6559–6566. [Google Scholar] [CrossRef]
- Ramírez-Salgado, J.; Quintana-Solórzano, R.; Mejía-Centeno, I.; Armendáriz-Herrera, H.; Rodríguez-Hernández, A.; Guzmán-Castillo, M.d.L.; Valente, J.S. On the role of oxidation states in the electronic structure via the formation of oxygen vacancies of a doped MoVTeNbOx in propylene oxidation. Appl. Surf. Sci. 2022, 573, 151428. [Google Scholar] [CrossRef]
- Miyazaki, S.; Nishimura, H.; Fukuda, M.; Ley, L.; Ristein, J. Structure and electronic states of ultrathin SiO2 thermally grown on Si(100) and Si(111) surfaces. Appl. Surf. Sci. 1997, 113–114, 585–589. [Google Scholar] [CrossRef]
- Scanlon, D.O.; Dunnill, C.W.; Buckeridge, J.; Shevlin, S.A.; Logsdail, A.J.; Woodley, S.M.; Catlow, C.R.A.; Powell, M.J.; Palgrave, R.G.; Parkin, I.P.; et al. Band alignment of rutile and anatase TiO2. Nat. Mater. 2013, 12, 798–801. [Google Scholar] [CrossRef]
- Grant, R.W.; Kraut, E.A.; Kowalczyk, S.P.; Waldrop, J.R. Measurement of potential at semiconductor interfaces by electron spectroscopy. J. Vac. Sci. Technol. B Microelectron. Process. Phenom. 1983, 1, 320–327. [Google Scholar] [CrossRef]
- Kraut, E.A.; Grant, R.W.; Waldrop, J.R.; Kowalczyk, S.P. Precise Determination of the Valence-Band Edge in X-ray Photoemission Spectra: Application to Measurement of Semiconductor Interface Potentials. Phys. Rev. Lett. 1980, 44, 1620–1623. [Google Scholar] [CrossRef]
- Bourikas, K.; Kordulis, C.; Lycourghiotis, A. The Role of the Liquid-Solid Interface in the Preparation of Supported Catalysts. Catal. Rev. 2006, 48, 363–444. [Google Scholar] [CrossRef]
- Lindquist, B.A.; Dunning, T.H. The nature of the SO bond of chlorinated sulfur–oxygen compounds. Theor. Chem. Acc. 2014, 133, 1443. [Google Scholar] [CrossRef][Green Version]
- Xia, D.; Li, Y.; Huang, G.; Fong, C.C.; An, T.; Li, G.; Yip, H.Y.; Zhao, H.; Lu, A.; Wong, P.K. Visible-light-driven inactivation of Escherichia coli K-12 over thermal treated natural pyrrhotite. Appl. Catal. B Environ. 2015, 176–177, 749–756. [Google Scholar] [CrossRef]
- Zhou, P.; Yu, J.; Jaroniec, M. All-Solid-State Z-Scheme Photocatalytic Systems. Adv. Mater. 2014, 26, 4920–4935. [Google Scholar] [CrossRef]
- Warschkow, O.; Ellis, D.; Hwang, J.; Mansourian-Hadavi, N.; Mason, T. Defects and Charge Transport near the Hematite (0001) Surface: An Atomistic Study of Oxygen Vacancies. J. Am. Ceram. Soc. 2002, 85, 213–220. [Google Scholar] [CrossRef]
- Birkholz, M.; Fiechter, S.; Hartmann, A.; Tributsch, H. Sulfur deficiency in iron pyrite FeS2−x and its consequences for band-structure models. Phys. Rev. B 1991, 43, 11926–11936. [Google Scholar] [CrossRef]


| Catalyst | Band Gap |
|---|---|
| TiO2 | 3.3 |
| Fe–0.25Cl | 3.06 |
| Fe–0.5Cl | 3.0 |
| Fe–Cl | 3.12 |
| Fe–2Cl | 3.16 |
| Fe–3Cl | 3.08 |
| Catalyst | Redox Temperature | Area | Redox Temperature | Area | Redox Temperature | Area |
|---|---|---|---|---|---|---|
| Fe–0.25Cl | 423 °C | 7099.04 | 560 °C | 754.21 | 903 °C | 9336.55 |
| Fe–0.5Cl | 482 °C | 17,797.61 | 576 °C | 1865.48 | 902 °C | 5043.24 |
| Fe–Cl | 540 °C | 16,684.97 | 656 °C | 9459.16 | 903 °C | 4023.66 |
| Fe–2Cl | 440 °C | 4173.65 | 570 °C | 3233.58 | 901 °C | 8592.72 |
| Fe–3Cl | 470 °C | 16,352.44 | 580 °C | 13,804.88 | 903 °C | 1255.82 |
| Catalyst | Fe∙Sy | Fe∙Ox | |
|---|---|---|---|
| FeS–0.25Cl | 2900.29 | 1745.30 | 0.6243 |
| FeS–0.5Cl | 3175.45 | 1992.05 | 0.6145 |
| FeS–Cl | 3486.89 | 2218.10 | 0.6112 |
| FeS–2Cl | 3390.54 | 2172.28 | 0.6095 |
| FeS–3Cl | 2038.7 | 1366.44 | 0.6050 |
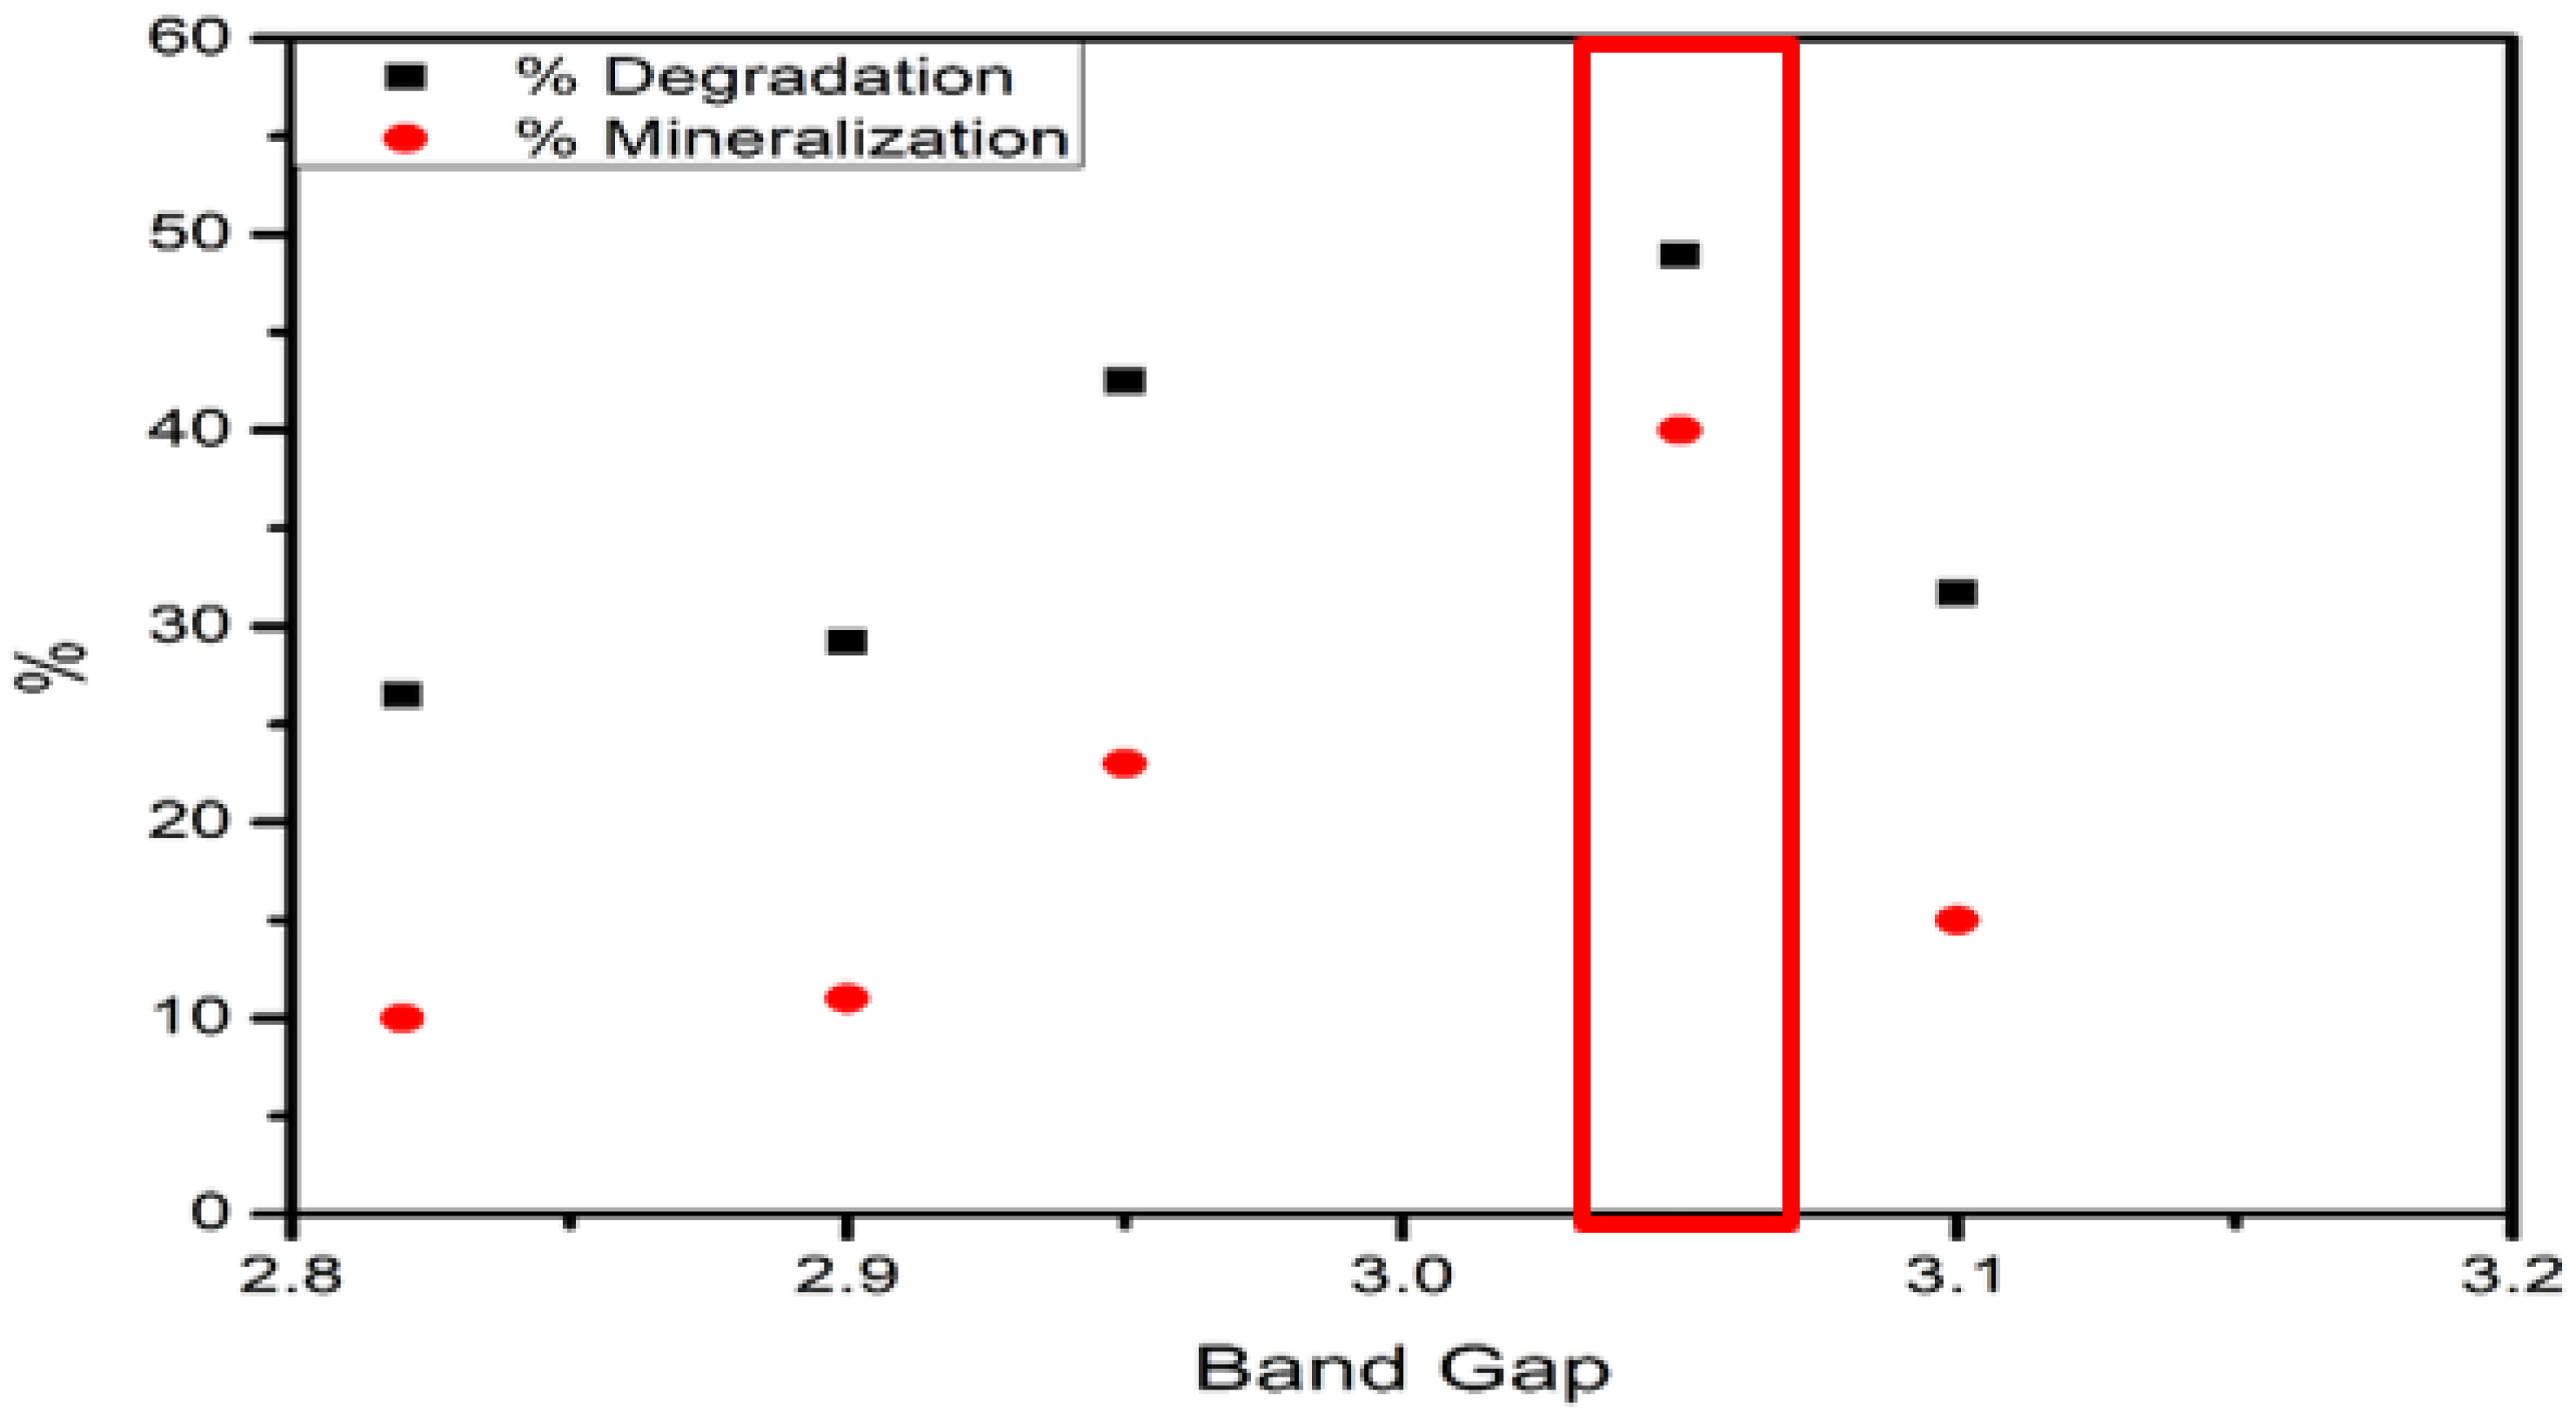
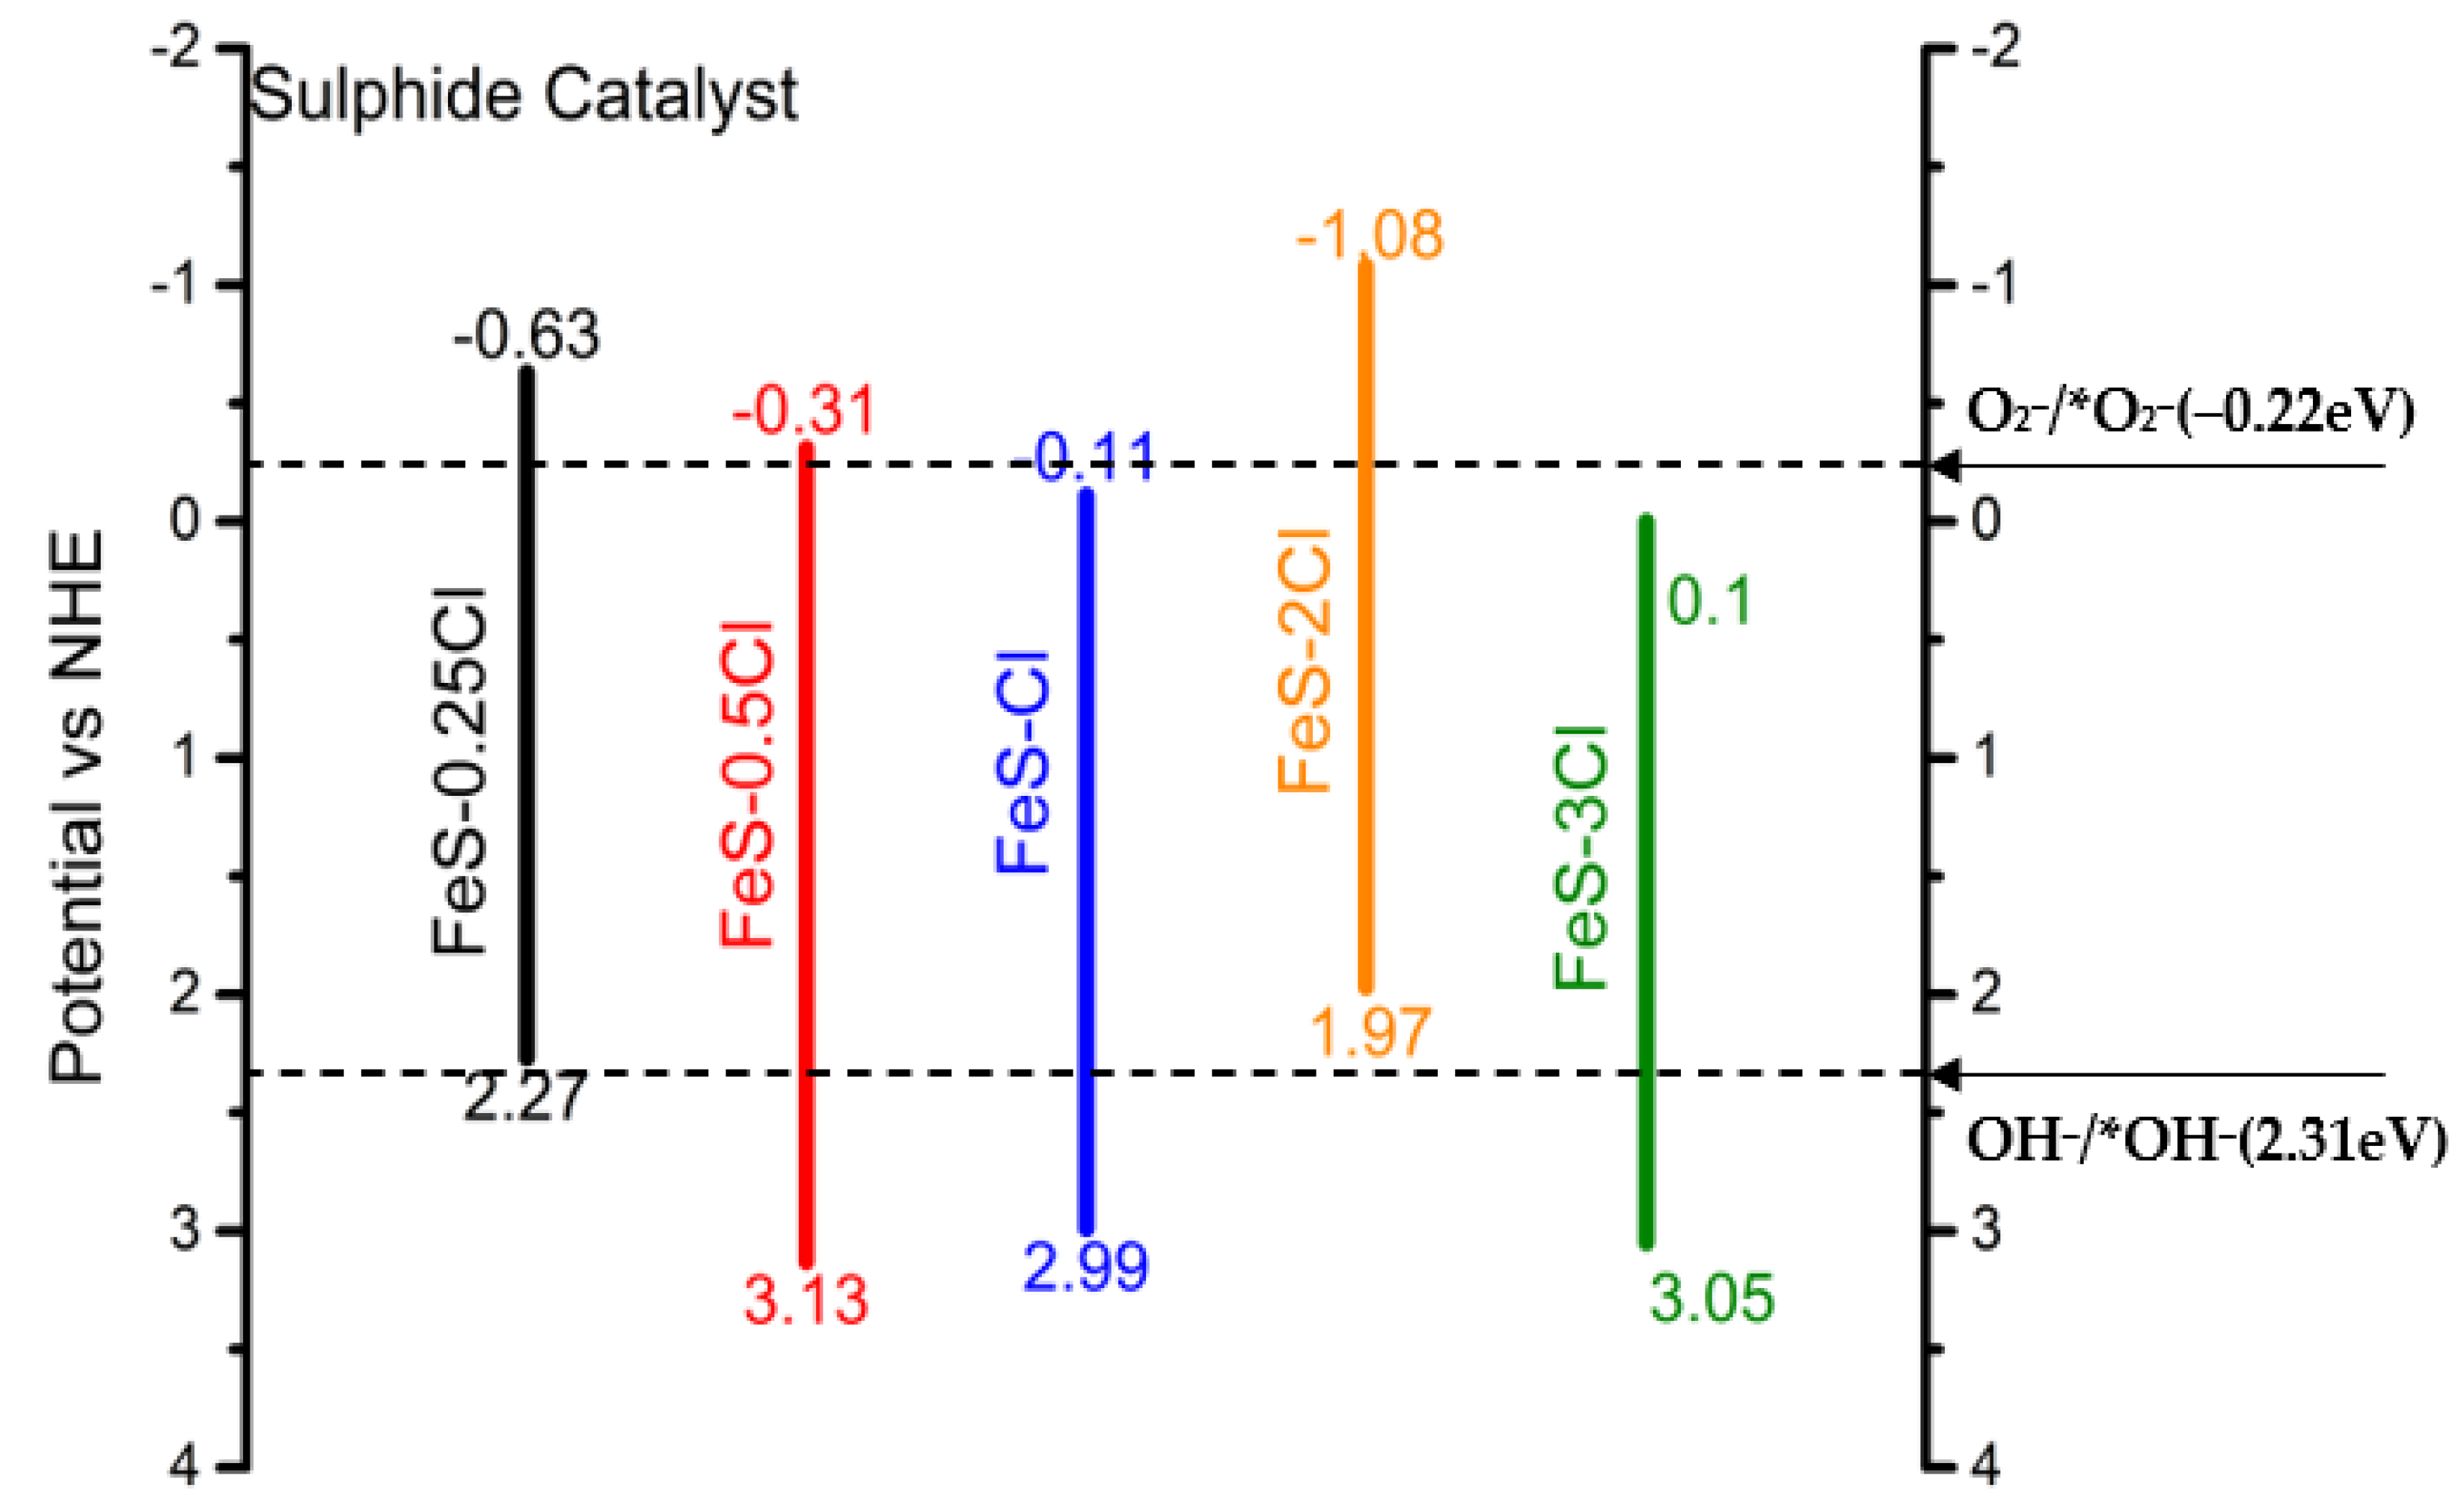
| XPS | Band Gap | Valence Band | Conduction Band |
|---|---|---|---|
| FeS–0.25Cl | 2.90 | 2.27 | −0.63 |
| FeS–0.5Cl | 2.82 | 3.13 | −0.31 |
| FeS–Cl | 3.10 | 2.99 | −0.11 |
| FeS–2Cl | 3.05 | 1.97 | −1.08 |
| FeS–3Cl | 2.95 | 3.05 | 0.10 |
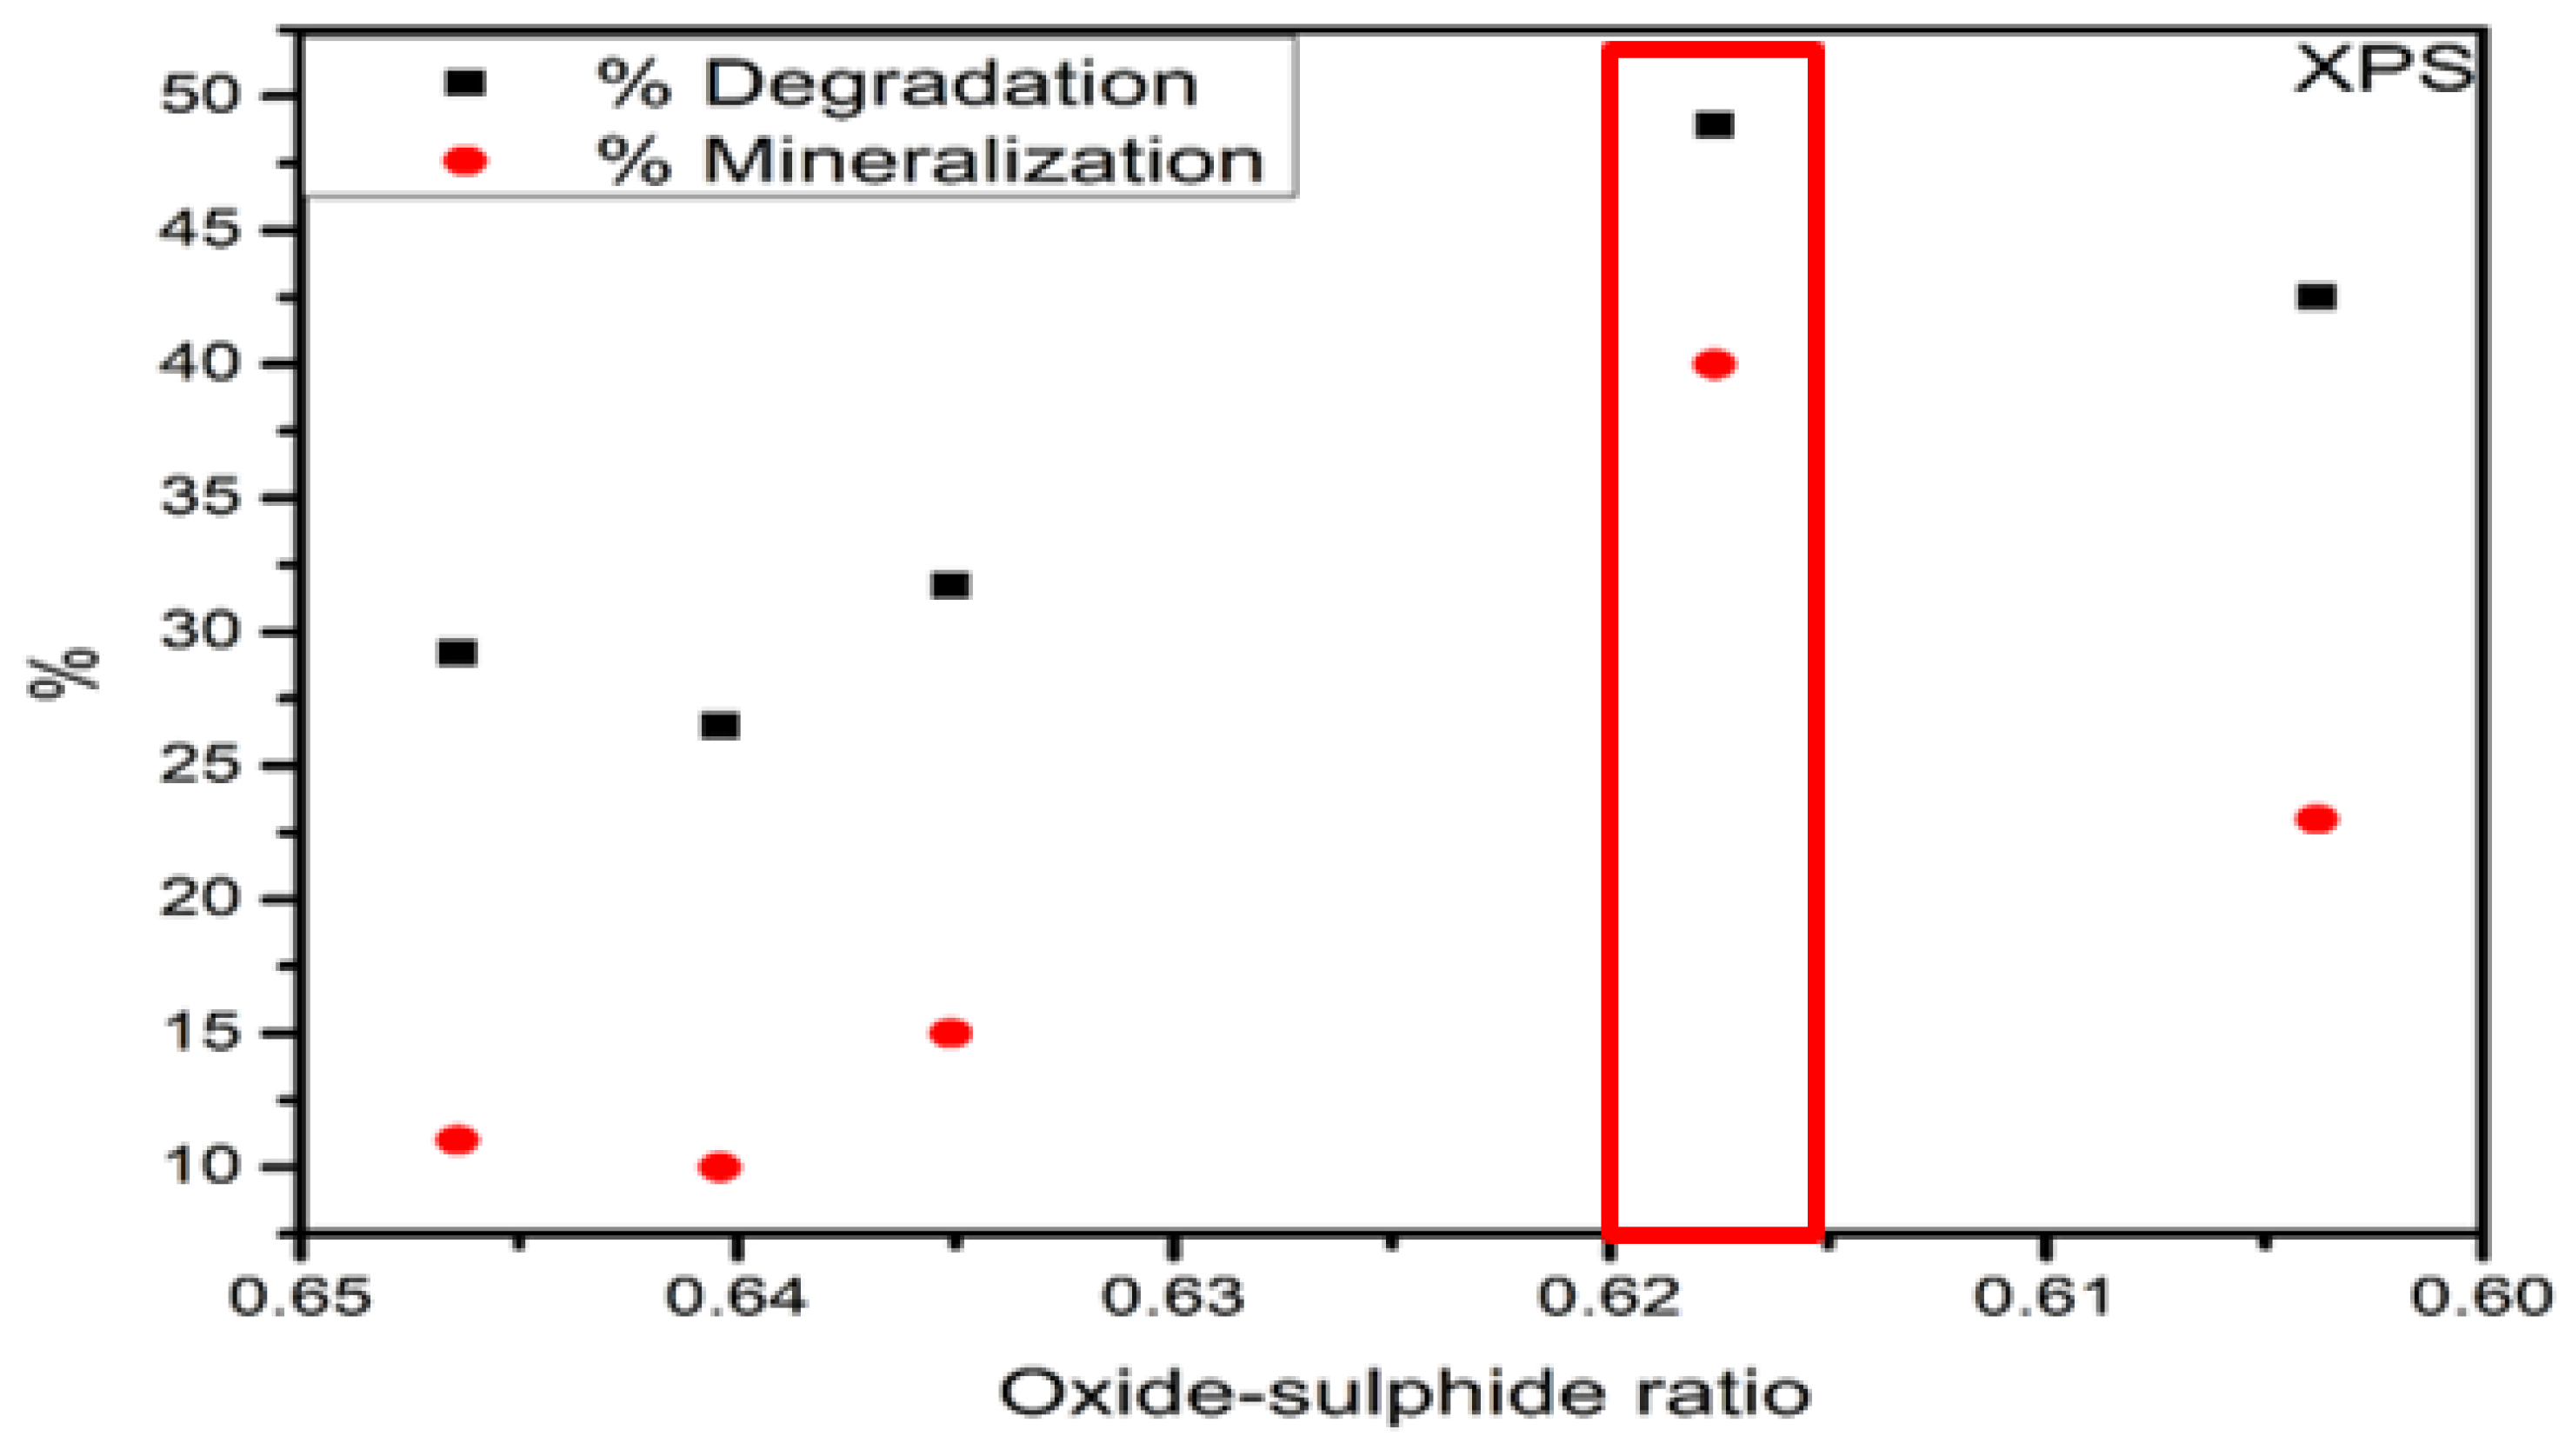
| XPS | Fe3+ (Oxide) | Fe2+ (Sulphide) | |
|---|---|---|---|
| FeS–0.25Cl | 6911.51 | 11,746.8 | 0.6464 |
| FeS–0.5Cl | 13,946.1 | 42,509.4 | 0.6404 |
| FeS–Cl | 6307.06 | 8236.48 | 0.6351 |
| FeS–2Cl | 3246.41 | 5244.27 | 0.6176 |
| FeS–3Cl | 5483.04 | 8358.71 | 0.6038 |
| Oxide | % Degradation | Sulphide | % Degradation |
|---|---|---|---|
| Dark | 3.8 | Dark | 3.8 |
| Photolysis | 5.77 | Photolysis | 5.77 |
| TiO2 | 5.85 | TiO2 | 7.87 |
| Fe–0.25Cl | 12.5 | FeS–0.25Cl | 29.2 |
| Fe–0.5Cl | 18.9 | FeS–0.5Cl | 26.4 |
| Fe–Cl | 16.6 | FeS–Cl | 31.7 |
| Fe–2Cl | 28.9 | FeS–2Cl | 48.5 |
| Fe–3Cl | 26.7 | FeS–3Cl | 42.4 |
| Catalyst | Fe–Cl Fraction | Degradation |
|---|---|---|
| Fe–0.25Cl | 0.21 | 12.53 |
| Fe–0.5Cl | 0.41 | 18.95 |
| Fe–1.0Cl | 0.70 | 16.64 |
| Fe–2.0Cl | 0.85 | 28.90 |
| Fe–3.0Cl | 0.85 | 26.70 |
| Catalyst | Fe3+ Reduction | Area | Fe2+ Reduction | Area | Fe2+/Fe3+ Ratio |
|---|---|---|---|---|---|
| Fe–0.25Cl | 423 °C | 7099.04 | 705 °C | 754.21 | 0.10 |
| Fe–0.5Cl | 482 °C | 17,797.61 | 707 °C | 1865.48 | 0.10 |
| Fe–Cl | 540 °C | 16,684.97 | 711 °C | 9459.16 | 0.56 |
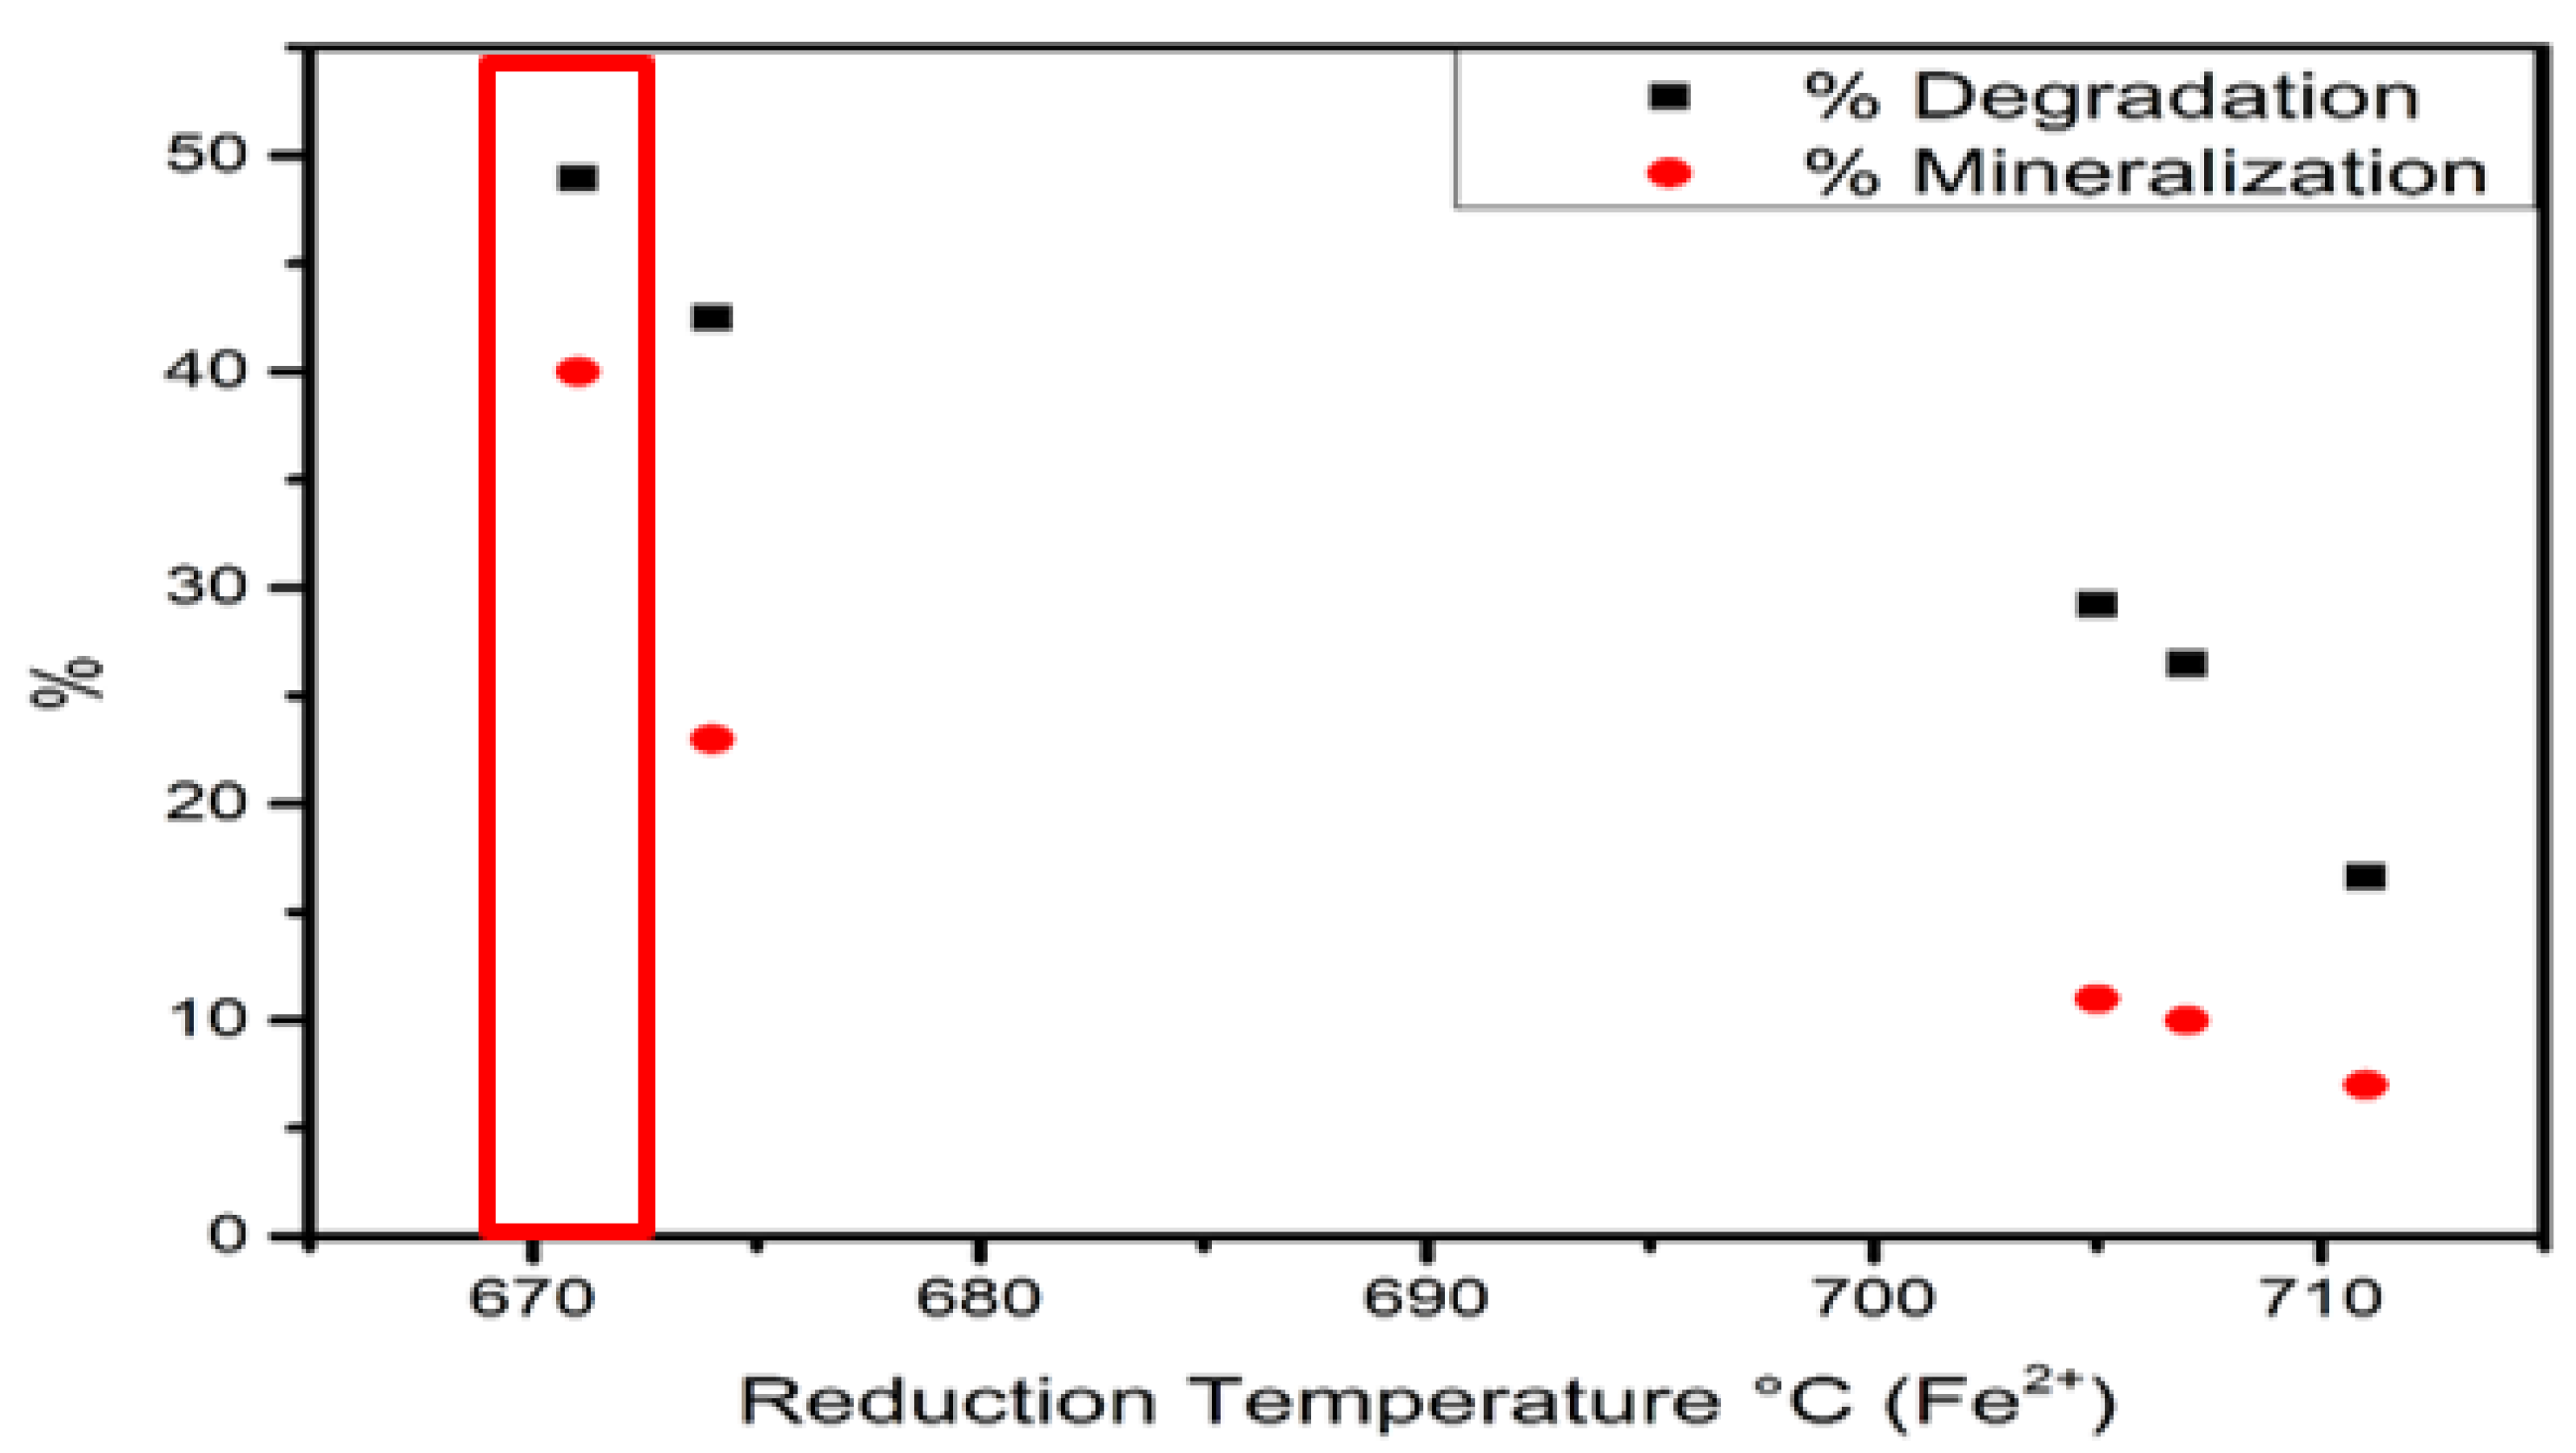
| Fe–2Cl | 600 °C | 4173.65 | 674 °C | 3233.58 | 0.77 |
| Fe–3Cl | 590 °C | 16,352.44 | 671 °C | 13,804.88 | 0.84 |
| Catalyst | Raman | XPS | % Degradation | % Mineralization |
|---|---|---|---|---|
| FeS–0.25Cl | 0.6243 | 0.6464 | 29.23 | 11 |
| FeS–0.5Cl | 0.6145 | 0.6404 | 26.49 | 10 |
| FeS–Cl | 0.6112 | 0.6351 | 31.73 | 15 |
| FeS–2Cl | 0.6095 | 0.6176 | 48.93 | 40 |
| FeS–3Cl | 0.6050 | 0.6038 | 42.49 | 23 |
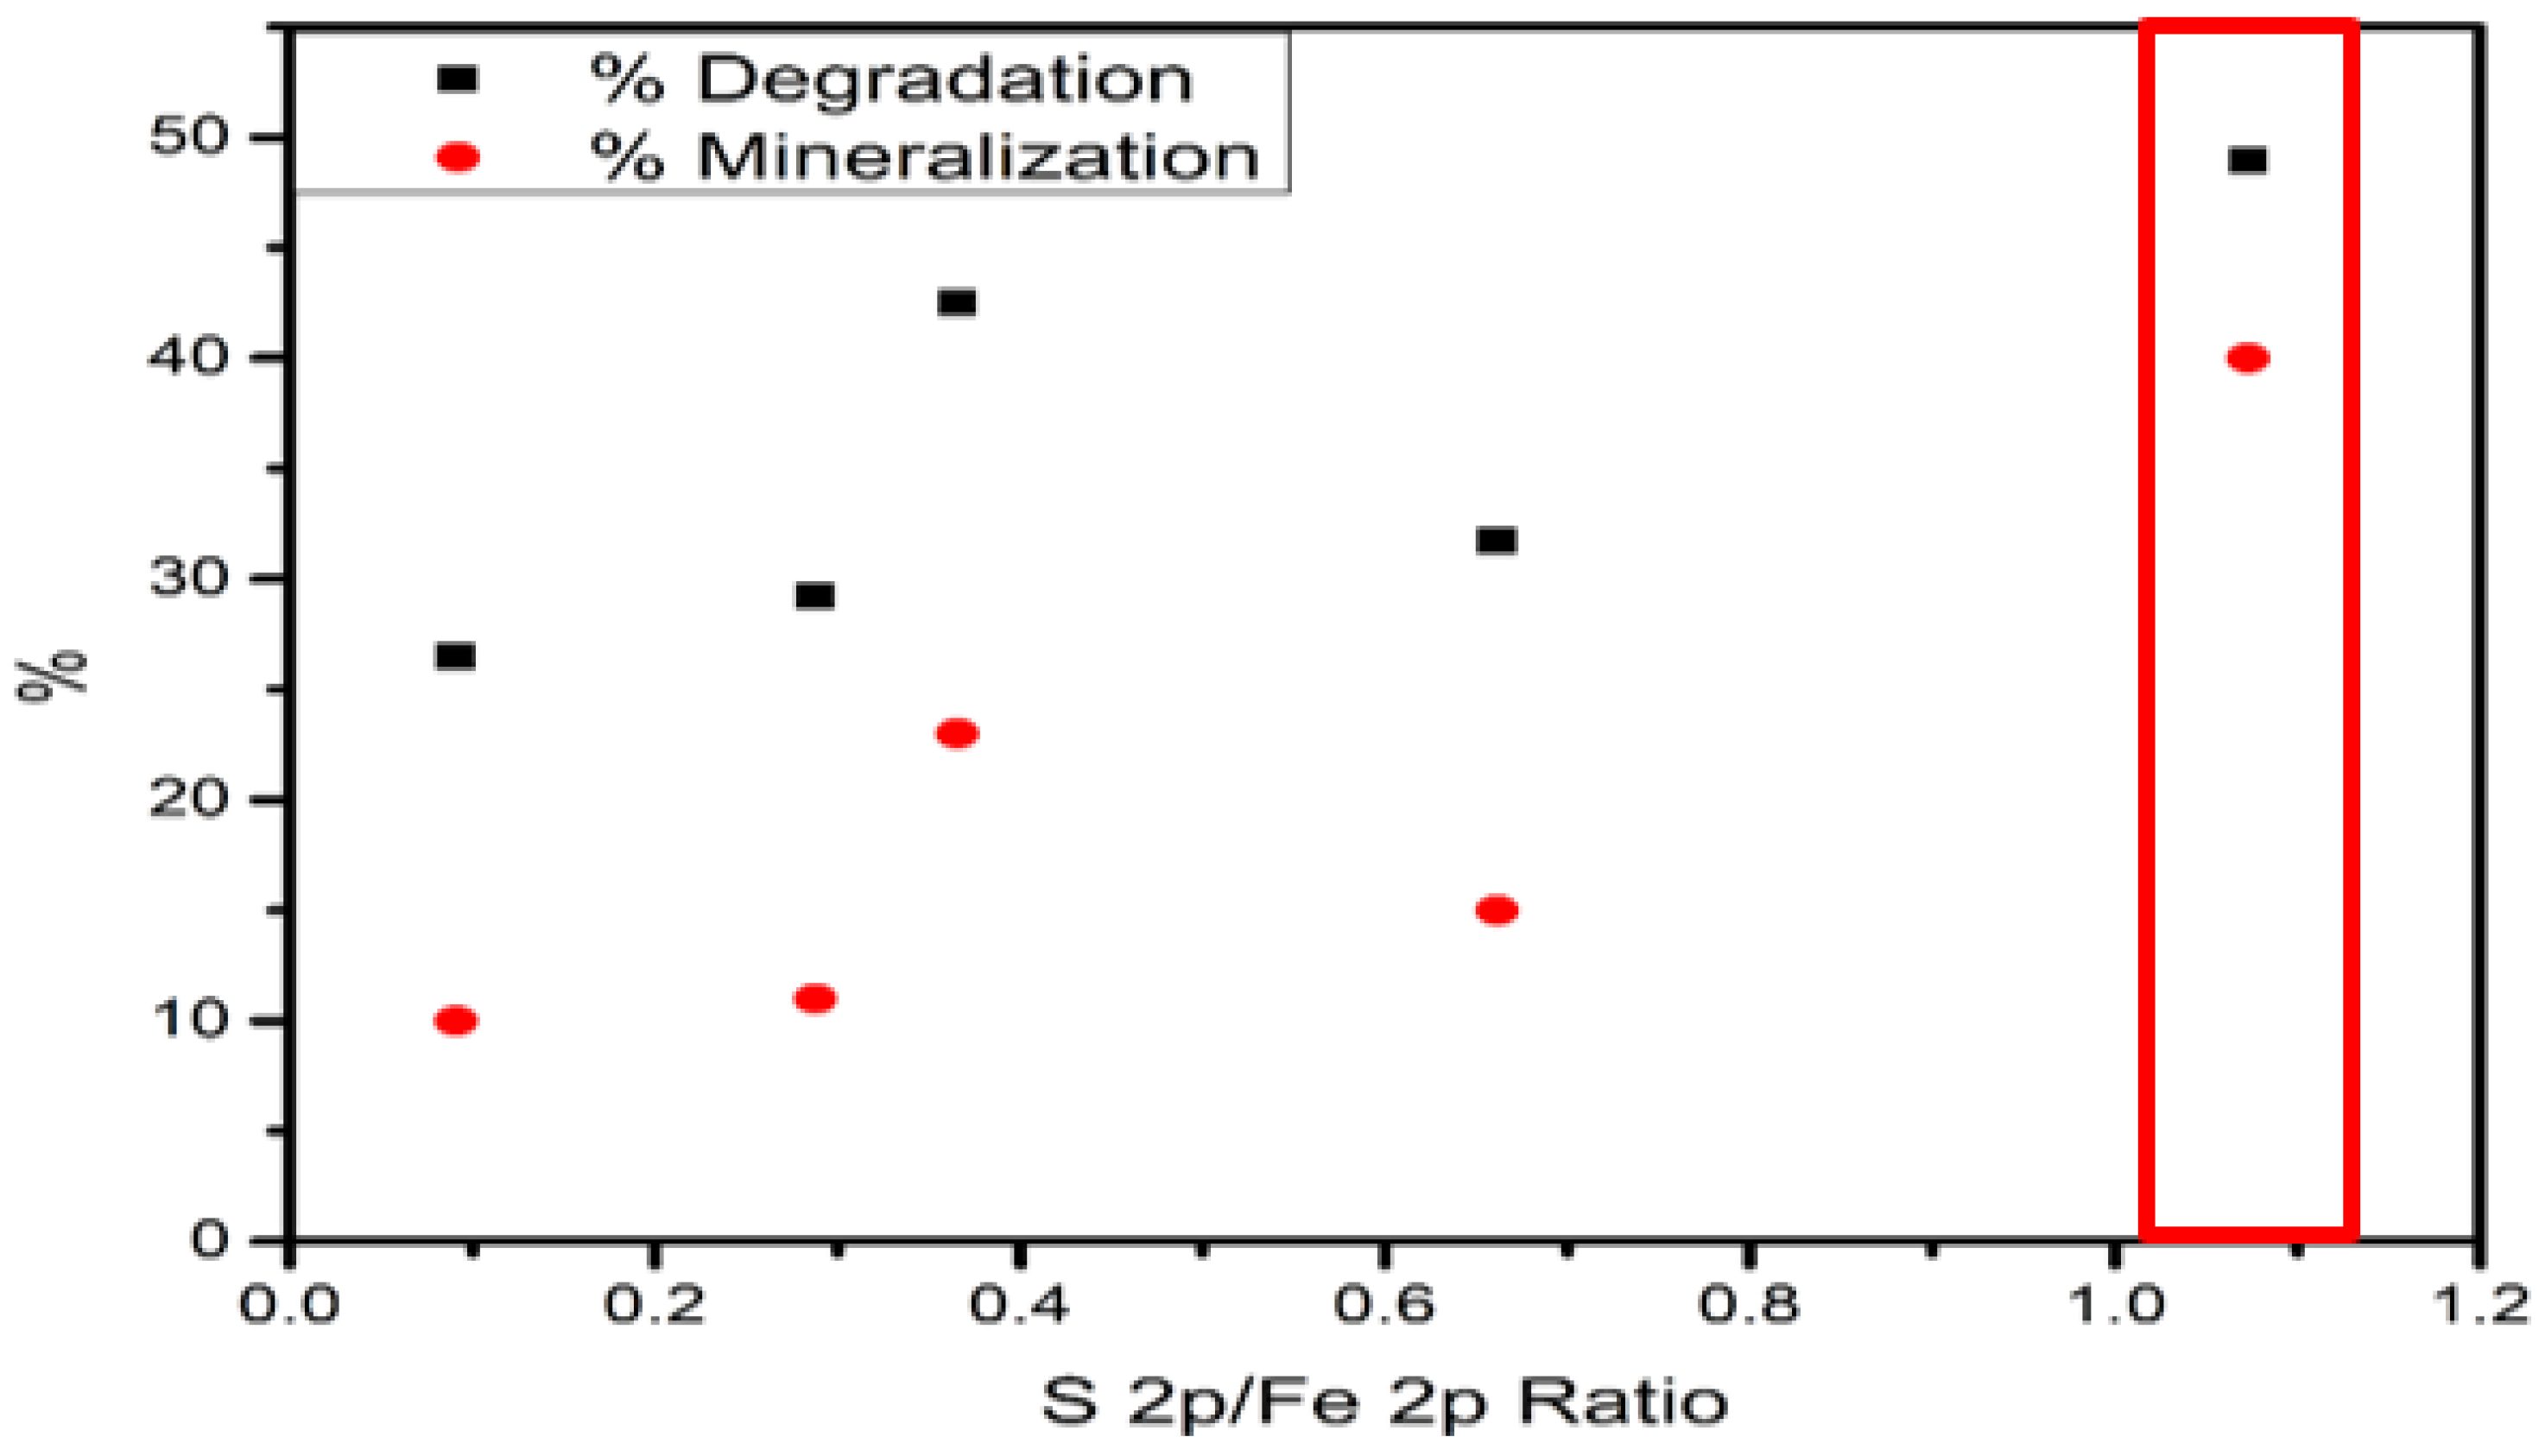
| XPS | FeS–0.25Cl | FeS–0.5Cl | FeS–Cl | FeS–2Cl | FeS–3Cl |
|---|---|---|---|---|---|
| S2p/Fe2p Ratio | 0.2878 | 0.091 | 0.6617 | 1.073 | 0.3658 |
| Catalyst | Catalyst | % Degradation | % Mineralization | |||
|---|---|---|---|---|---|---|
| Fe–0.25Cl | 3.01 | FeS–0.25Cl | 2.90 | 0.96 | 29.23 | 11.0 |
| Fe–0.5Cl | 2.90 | FeS–0.5Cl | 2.82 | 0.97 | 26.49 | 10.0 |
| Fe–Cl | 3.15 | FeS–Cl | 3.10 | 0.98 | 31.73 | 15.0 |
| Fe–2Cl | 3.10 | FeS–2Cl | 3.05 | 0.98 | 48.93 | 40.0 |
| Fe–3Cl | 3.02 | FeS–3Cl | 2.95 | 0.97 | 42.49 | 23.0 |
Publisher’s Note: MDPI stays neutral with regard to jurisdictional claims in published maps and institutional affiliations. |
© 2022 by the authors. Licensee MDPI, Basel, Switzerland. This article is an open access article distributed under the terms and conditions of the Creative Commons Attribution (CC BY) license (https://creativecommons.org/licenses/by/4.0/).
Share and Cite
Alvarez-Bustos, D.; Sanchez-Minero, F.; Santes, V.; Romero-Ibarra, I.C.; de los Reyes Heredia, J.A.; Rios-Escobedo, R.; Tzompantzi-Morales, F.; Santolalla-Vargas, C.E. Synthesis and Evaluation of FeSX/TiO2 for the Photocatalytic Degradation of Phenol under Visible-Light Region. Catalysts 2022, 12, 457. https://doi.org/10.3390/catal12050457
Alvarez-Bustos D, Sanchez-Minero F, Santes V, Romero-Ibarra IC, de los Reyes Heredia JA, Rios-Escobedo R, Tzompantzi-Morales F, Santolalla-Vargas CE. Synthesis and Evaluation of FeSX/TiO2 for the Photocatalytic Degradation of Phenol under Visible-Light Region. Catalysts. 2022; 12(5):457. https://doi.org/10.3390/catal12050457
Chicago/Turabian StyleAlvarez-Bustos, Diego, Felipe Sanchez-Minero, Victor Santes, Issis Claudette Romero-Ibarra, José Antonio de los Reyes Heredia, Reyna Rios-Escobedo, Francisco Tzompantzi-Morales, and Carlos Eduardo Santolalla-Vargas. 2022. "Synthesis and Evaluation of FeSX/TiO2 for the Photocatalytic Degradation of Phenol under Visible-Light Region" Catalysts 12, no. 5: 457. https://doi.org/10.3390/catal12050457
APA StyleAlvarez-Bustos, D., Sanchez-Minero, F., Santes, V., Romero-Ibarra, I. C., de los Reyes Heredia, J. A., Rios-Escobedo, R., Tzompantzi-Morales, F., & Santolalla-Vargas, C. E. (2022). Synthesis and Evaluation of FeSX/TiO2 for the Photocatalytic Degradation of Phenol under Visible-Light Region. Catalysts, 12(5), 457. https://doi.org/10.3390/catal12050457