Article

A Parametric Study of the Crystal Phases on Au/TiO2 Photocatalysts for CO2 Gas-Phase Reduction in the Presence of Water

1
ICPEES—Institute of Chemistry and Processes for Energy, Environment and Health, UMR 7515, CNRS/University of Strasbourg, 25, Rue Becquerel, CEDEX 2, 67087 Strasbourg, France
2
Laboratory of Materials, Catalysis, Environment and Analytical Methods Laboratory (MCEMA), Faculty of Sciences, Lebanese University, Hadath P.O. Box 11-2806, Lebanon
3
Faculty of Science and Engineering, Maastricht University, P.O. Box 616, 6200 MD Maastricht, The Netherlands
4
Department of Chemical and Pharmaceutical Sciences, INSTM and ICCOM-CNR Research Units, University of Trieste, via L. Giorgieri 1, 34127 Trieste, Italy
5
ICP, Institut de Chimie Physique, CNRS UMR 8000, Université Paris-Saclay, Bâtiment 349, CEDEX, 91405 Orsay, France
*
Authors to whom correspondence should be addressed.
Catalysts 2022, 12(12), 1623; https://doi.org/10.3390/catal12121623
Submission received: 29 September 2022 / Revised: 30 November 2022 / Accepted: 8 December 2022 / Published: 10 December 2022
(This article belongs to the Special Issue Solar Chemistry and Photocatalysis: Environmental Applications)

Abstract

:
Au/TiO2 photocatalysts were studied, characterized, and compared for CO2 photocatalytic gas-phase reduction. The impact of the nature of the TiO2 support was studied. It was shown that the surface area/porosity/TiO2 crystal phase/density of specific exposed facets and oxygen vacancies were the key factors determining CH4 productivity under solar-light activation. A 0.84 wt.% Au/TiO2 SG (Sol Gel) calcined at 400 °C exhibited the best performance, leading to a continuous mean CH4 production rate of 50 μmol.h−1.g−1 over 5 h, associated with an electronic selectivity of 85%. This high activity was mainly attributed to the large surface area and accessible microporous volume, high density of exposed TiO2 (101) anatase facets, and oxygen vacancies acting as reactive defects sites for CO2 adsorption/activation/dissociation and charge carrier transport.

1. Introduction

Amongst the huge variety of semiconductors and composite materials investigated for CO2 photocatalytic reduction in gas-phase, TiO2 often prevails due to its chemical stability, moderate cost, and resistance toward corrosion [1,2,3,4]. However, its relatively fast electron-hole pair recombination rate and hindrance of visible light harvesting are considered the main limitations for solar light-driven gas phase CO2 photocatalytic reduction in the presence of water. In the recent years, several strategies have been tested in order to overcome these limitations [5,6], including loading with metal nanoparticles, acting as electron sink, co-catalyst, or inducing surface plasmon phenomena [3,7,8,9,10]; combining TiO2 with other semiconductors [11,12,13] or other elements by means of mono-doping [14,15,16] or co-doping approaches [17,18]; or modifying the morphology [19,20,21,22].
Among the different reaction products that could be obtained from CO2 reduction, and also knowing that the energy content of oxygenated compounds decreases as the oxygen content increases (due to the relative decrease in C-H bond storage energy), CH4 is one of the most interesting, together with methanol. Nonetheless, as methanol’s photo-reactivity is much higher than that of CO2, leading to easy over-oxidation to formaldehyde and formic acid, high selectivity towards methane formation is preferred [3]. It has already been reported that TiO2 anatase crystal facets can impact the performances towards CO2 photoreduction, the {010} and the {001} facets leading to the highest and lowest selectivity toward methane formation, respectively [23]; whereas the exposure of both facets leads to the highest yields [24]. Furthermore, it has been established that, even if amorphous phases can be active, the crystallinity and defects of the semiconductor also play a crucial role, influencing the mobility of electron-hole pairs [15,24]. Theoretical studies have confirmed that the CO2 adsorption, activation, and dissociation steps were highly influenced by oxygen-deficiency/defects disorders in TiO2 anatase, rutile, or brookite crystal phases [25,26,27]. The role of oxygen vacancies as reactive defect sites in TiO2 photocatalysts, even at low concentrations, is a key parameter in air-free photocatalytic properties, impacting the surface adsorption, and charge carrier transport [28,29]. Thus, the presence/introduction of oxygen vacancies may result in favorable charge transport phenomena, thus improving the charge carrier lifetime [30,31], and their role in photocatalysis has been extensively studied [32,33]. The TiO2 particle size, crystallinity, presence of vacancies, density of exposed facets, porosity, and surface area, consequently play crucial roles in CO2 photoreduction [34].
Between the different metal nanoparticles (NPs) used as co-catalysts and exhibiting surface plasmon resonance (SPR) properties in the visible range, Au can be considered one of the most interesting for driving CH4 production from CO2 gas-phase photocatalytic reduction in the presence of water vapor as a reducing agent. Due to interest in their use for catalysis, Au/TiO2 materials have already become a reference as excellent photocatalysts [35,36]. Furthermore, as TiO2 (P25 Evonik) is a commercially available reference, Au/TiO2 P25 is often prepared by the so-called “deposition–precipitation” method [37].
In this paper titania (TiO2 SG) was prepared by a home-made sol-gel method inspired by the literature [38]. Its structure and surface were tuned by varying various synthesis parameters, including the temperature of the calcination step. Au NPs were subsequently loaded using sodium borohydride reduction of chloroauric acid in the presence of titania. The structural, surface, porosity, and optical properties, as well as the presence of oxygen vacancies, are discussed and compared to those of synthesized TiO2 brookite, commercially available (TiO2 P25, TiO2 UV-100)-based materials, and correlated to photocatalytic activity.

2. Results

2.1. Structural Characterization (XRD)

The XRD pattern of the TiO2 SG-X (X stands for the post-synthesis temperature) are presented in Figure 1a and compared to those of bare TiO2 P25, TiO2 brookite, TiO2 UV100, and TiO2 UV100-X (X stands for the calcination temperature, Figure 1b). The corresponding mean crystallite sizes, calculated from the Debye-Scherrer equation, are summarized in Table 1. One can observe that the uncalcined TiO2 SG is relatively well crystallized and exhibits a major peak at 25.36°, assigned to (101) planes in anatase phase, in agreement with JCPDS file 00-021-1272 [39,40]. Traces of brookite and rutile could be observed but are difficult to analyze and quantify. Increasing the calcination temperature to 400 °C did not significantly improve the degree of crystallinity of anatase, but rather increased the relative concentration of the rutile phase (from 500 °C) at 27.42° (JCPDS file 00-004-0551, [39]). Calcining further at 500 °C resulted in further crystallization of the anatase and rutile phases, increase in the rutile phase content, with no significant change to brookite (JCPDS file 00-029-1360, [40]). A complete transformation into rutile, accompanied by better crystallinity (29 nm) of the resulting phase occurred after calcination at 600 °C. We can also mention that calcination of TiO2 UV-100 at 350 °C led to an increased anatase mean crystallite size, which reached a value close to the one determined for TiO2 P25, without formation of rutile.

2.2. Surface Characterizations

2.2.1. BET Surface Area and Porosity Measurements

From the Brunauer, Emmett, and Teller (BET) measurements (Table 1, Figure 2), it can be seen that the TiO2 P25 sample exhibited type-IV adsorption-desorption isotherm profiles with H2 hysteresis, which are characteristic of mesoporous/macroporous solids with a mean pore diameter of ca. 30 nm. TiO2 UV100 approximated type I behavior, which is characteristic of microporous solids with H3 hysteresis, attributed to rather uniform slot-type pores in accordance with its lower pore diameter (Table 1) and distribution (Figure 2d, pore size essentially below 3 nm). Increasing its calcination temperature to 350 and 550 °C yielded a mesoporous type-IV-like behavior, in line with the shift of the mean pore size from <3 nm to 4.5 and 8 nm. As for TiO2 UV-100, brookite revealed a microporous type-I isotherm (Figure 2c) associated with type-H4 hysteresis, related to a non-uniform slot-type porosity, as confirmed by the corresponding broad pore size distribution (Figure 2d). From Figure 2a, one can observe that the TiO2 SG-based materials (except for TiO2 SG-600, whose porosity collapsed) showed a type-I microporous behavior, evidencing micropores with H2-hysteresis and revealing rather cylindrical channeled porosity. Figure 2b underlines that theTiO2 SG-X samples exhibited the sharpest pore size distribution, centered at ca. 2.5–3.0 nm, with exclusive contribution of micropores. The corresponding pore volume increased with calcination at 400 °C, then diminished, to reach a very low value and surface area.

2.2.2. Au NPs Deposition and UV-Vis Absorption Properties

Kubelka–Munk function determination from the different TiO2 supports (Figure 3) showed the expected behavior for the commercial TiO2 P25 and UV-100 samples (Figure 3b). Calcination of TiO2 UV100 seemed not to affect these properties. The synthesized TiO2 brookite revealed the same absorption trend and edge, in accordance with band gap values of 3.20–3.25 eV. The as-synthesized TiO2 SG (Figure 3a) exhibited, in addition to the standard anatase contribution, a visible light absorption contribution, whose origin could be attributed either to precursor residues and/or to oxygen vacancies. These hypotheses were confirmed by the large attenuation of the corresponding contribution tail by calcining at 400 °C. It must, however, be mentioned that calcining TiO2 SG further induced a shift of the absorption edge towards higher wavelengths (as confirmed by the band-gap determination via a Tauc plot, using Kubelka–Munk formula, insert Figure 3a, correlated with the increase in rutile phase proportion (Table 1)).
The targeted Au content was 0.86 wt.% for all Au/TiO2 photocatalysts. ICP-AES analyses showed that the Au deposition yield on some TiO2 supports was high, varying from 92% to 98%, leading to Au/TiO2 materials that all contained 0.82 ± 0.03 wt.% gold (Table 2). From the Au/TiO2 absorbance spectra (Figure 4), two contributions could be distinguished, assigned respectively to TiO2, as discussed previously, and to Au NPs. The second contribution was indeed characteristic of the localized surface plasmon resonance (LSPR) of Au NPs. It was positioned between 541 and 562 nm, in line with Au NPs in interaction with a titania matrix [41]. The variations in terms of position, broadness, and intensity could be linked to variations in Au content, particles size, and morphology, and Au-TiO2 interactions. The same shape of SPR as observed on Au/TiO2 P25 and Au/TiO2 UV100-350 (Figure 4b) confirmed the same Au content as found by ICP-AES and also suggested that both samples exhibited the same gold particle size and interaction with the support. Even if those samples showed almost the same Au content as Au/TiO2 brookite, one could observe a more intense LSPR signal on the last one, which may have been due to the larger Au NP size, thus suggesting that the dominant brookite phase may have provided less nucleation sites for Au NPs, hence the extended growth over the few sites available. Calcining TiO2 UV-100 at 550 °C resulted in a more intense signal, but also in a slight red-shift in the LSPR position, suggesting the presence of a broader size distribution of Au NPs, i.e., the occurrence of sintering and aggregation, and associated LSPR coupling. The slight shift towards higher wavelengths observed in the TiO2 UV100 material may have been correlated with the presence of a larger amount of amorphous phase.
Despite the similar Au contents of Au/TiO2 P25, Au/TiO2 UV 100-350, and Au/TiO2 SG-400, the LSPR of Au/TiO2 SG-400 was more intense and somewhat broader (Figure 4), suggesting the presence of a much broader size distribution of Au NPs. This may have arisen from the particularly low TiO2 anatase mean crystallite size (6 nm), which was the lowest observed among the different TiO2 supports and which was also close to the Au NP size generally produced by the method of deposition used, i.e., 3–5 nm [42,43]. The LSPR intensity was further enhanced after calcination at 500 °C (Figure 4a), as the anatase mean crystal size slightly increased, the surface area diminished, and the rutile phase appeared. Finally, after calcination at 600 °C, the LSPR signal was drastically lowered, in correlation with the huge decrease in surface area and the presence of an exclusively rutile phase.

2.3. Gas-Phase CO2 Photoreduction Activity

Considering both the CH4 productivity and electronic selectivity, Au/TiO2 SG-400 was the best performing photocatalyst, leading to a mean rate of CH4 production of 50 μmol h−1g−1 over 5 h (Figure 5a). This activity was higher than those reported by the Au/TiO2 commercial-based reference materials (Figure 5b). Amongst these latter samples, one could observe that the TiO2 P25 and TiO2 UV-100 supports led to the same CH4 productivity. However, the selectivity was much higher for the former. Applying and increasing the thermal treatment on TiO2 UV-100 resulted in decreasing CH4 productivity. Au/TiO2 brookite revealed a moderate CH4 production and selectivity. From Figure 5a, it can clearly be observed that an optimum calcination temperature of 400 °C was required for TiO2 SG-based supports. Further increasing the calcination temperature is detrimental for both CH4 production and selectivity, as is the absence of calcination. Comparing all the samples from a CH4 productivity criteria point of view, the following order was obtained: Au/TiO2 SG-400 > Au/TiO2 UV100 ≈ Au/TiO2 P25 > Au/TiO2 UV100-350 > Au/TiO2 SG > Au/TiO2 SG-500 > Au/TiO2 brookite > Au/TiO2 UV100-550 > Au/TiO2 SG-600.
As all those photocatalysts exhibit large differences in surface area, normalized reaction rates were calculated (Figure 6), allowing comparison of the intrinsic activities. Considering the normalized CH4 production rates, the following order of activity was observed: Au/TiO2 P25 > Au/TiO2 SG-400 > Au/TiO2 SG-500 > Au/TiO2 UV100-350 >Au/TiO2 UV100> Au/TiO2 brookite > Au/TiO2 SG ≈ Au/TiO2 SG-500 > Au/TiO2 SG-600, suggesting that the surface area parameter is an impacting parameter but not the only one.

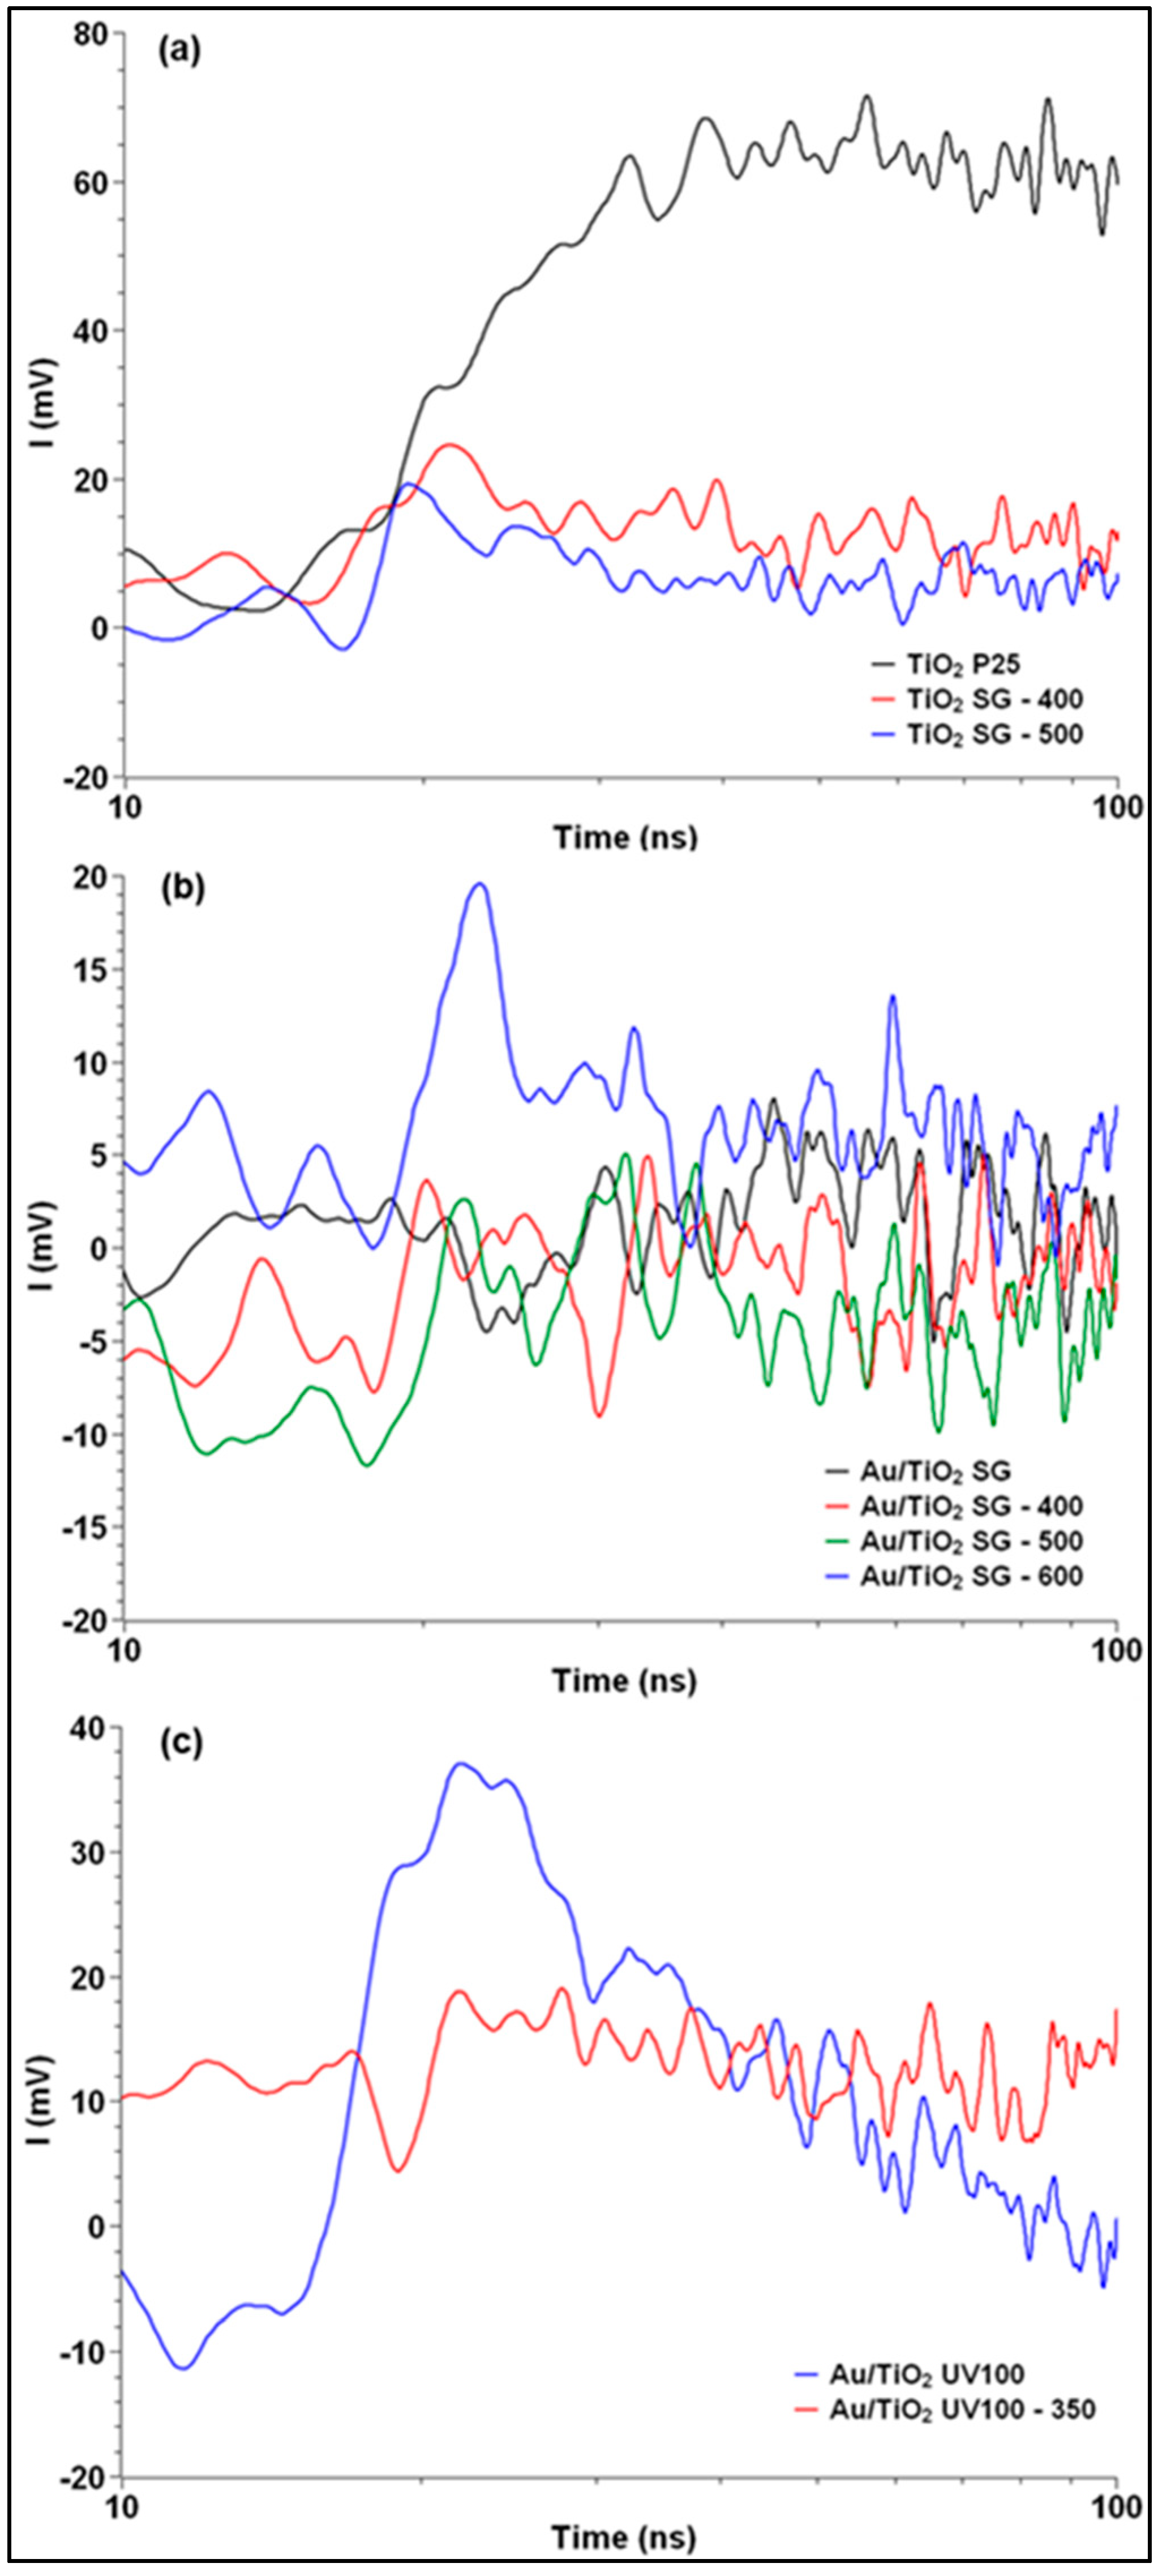
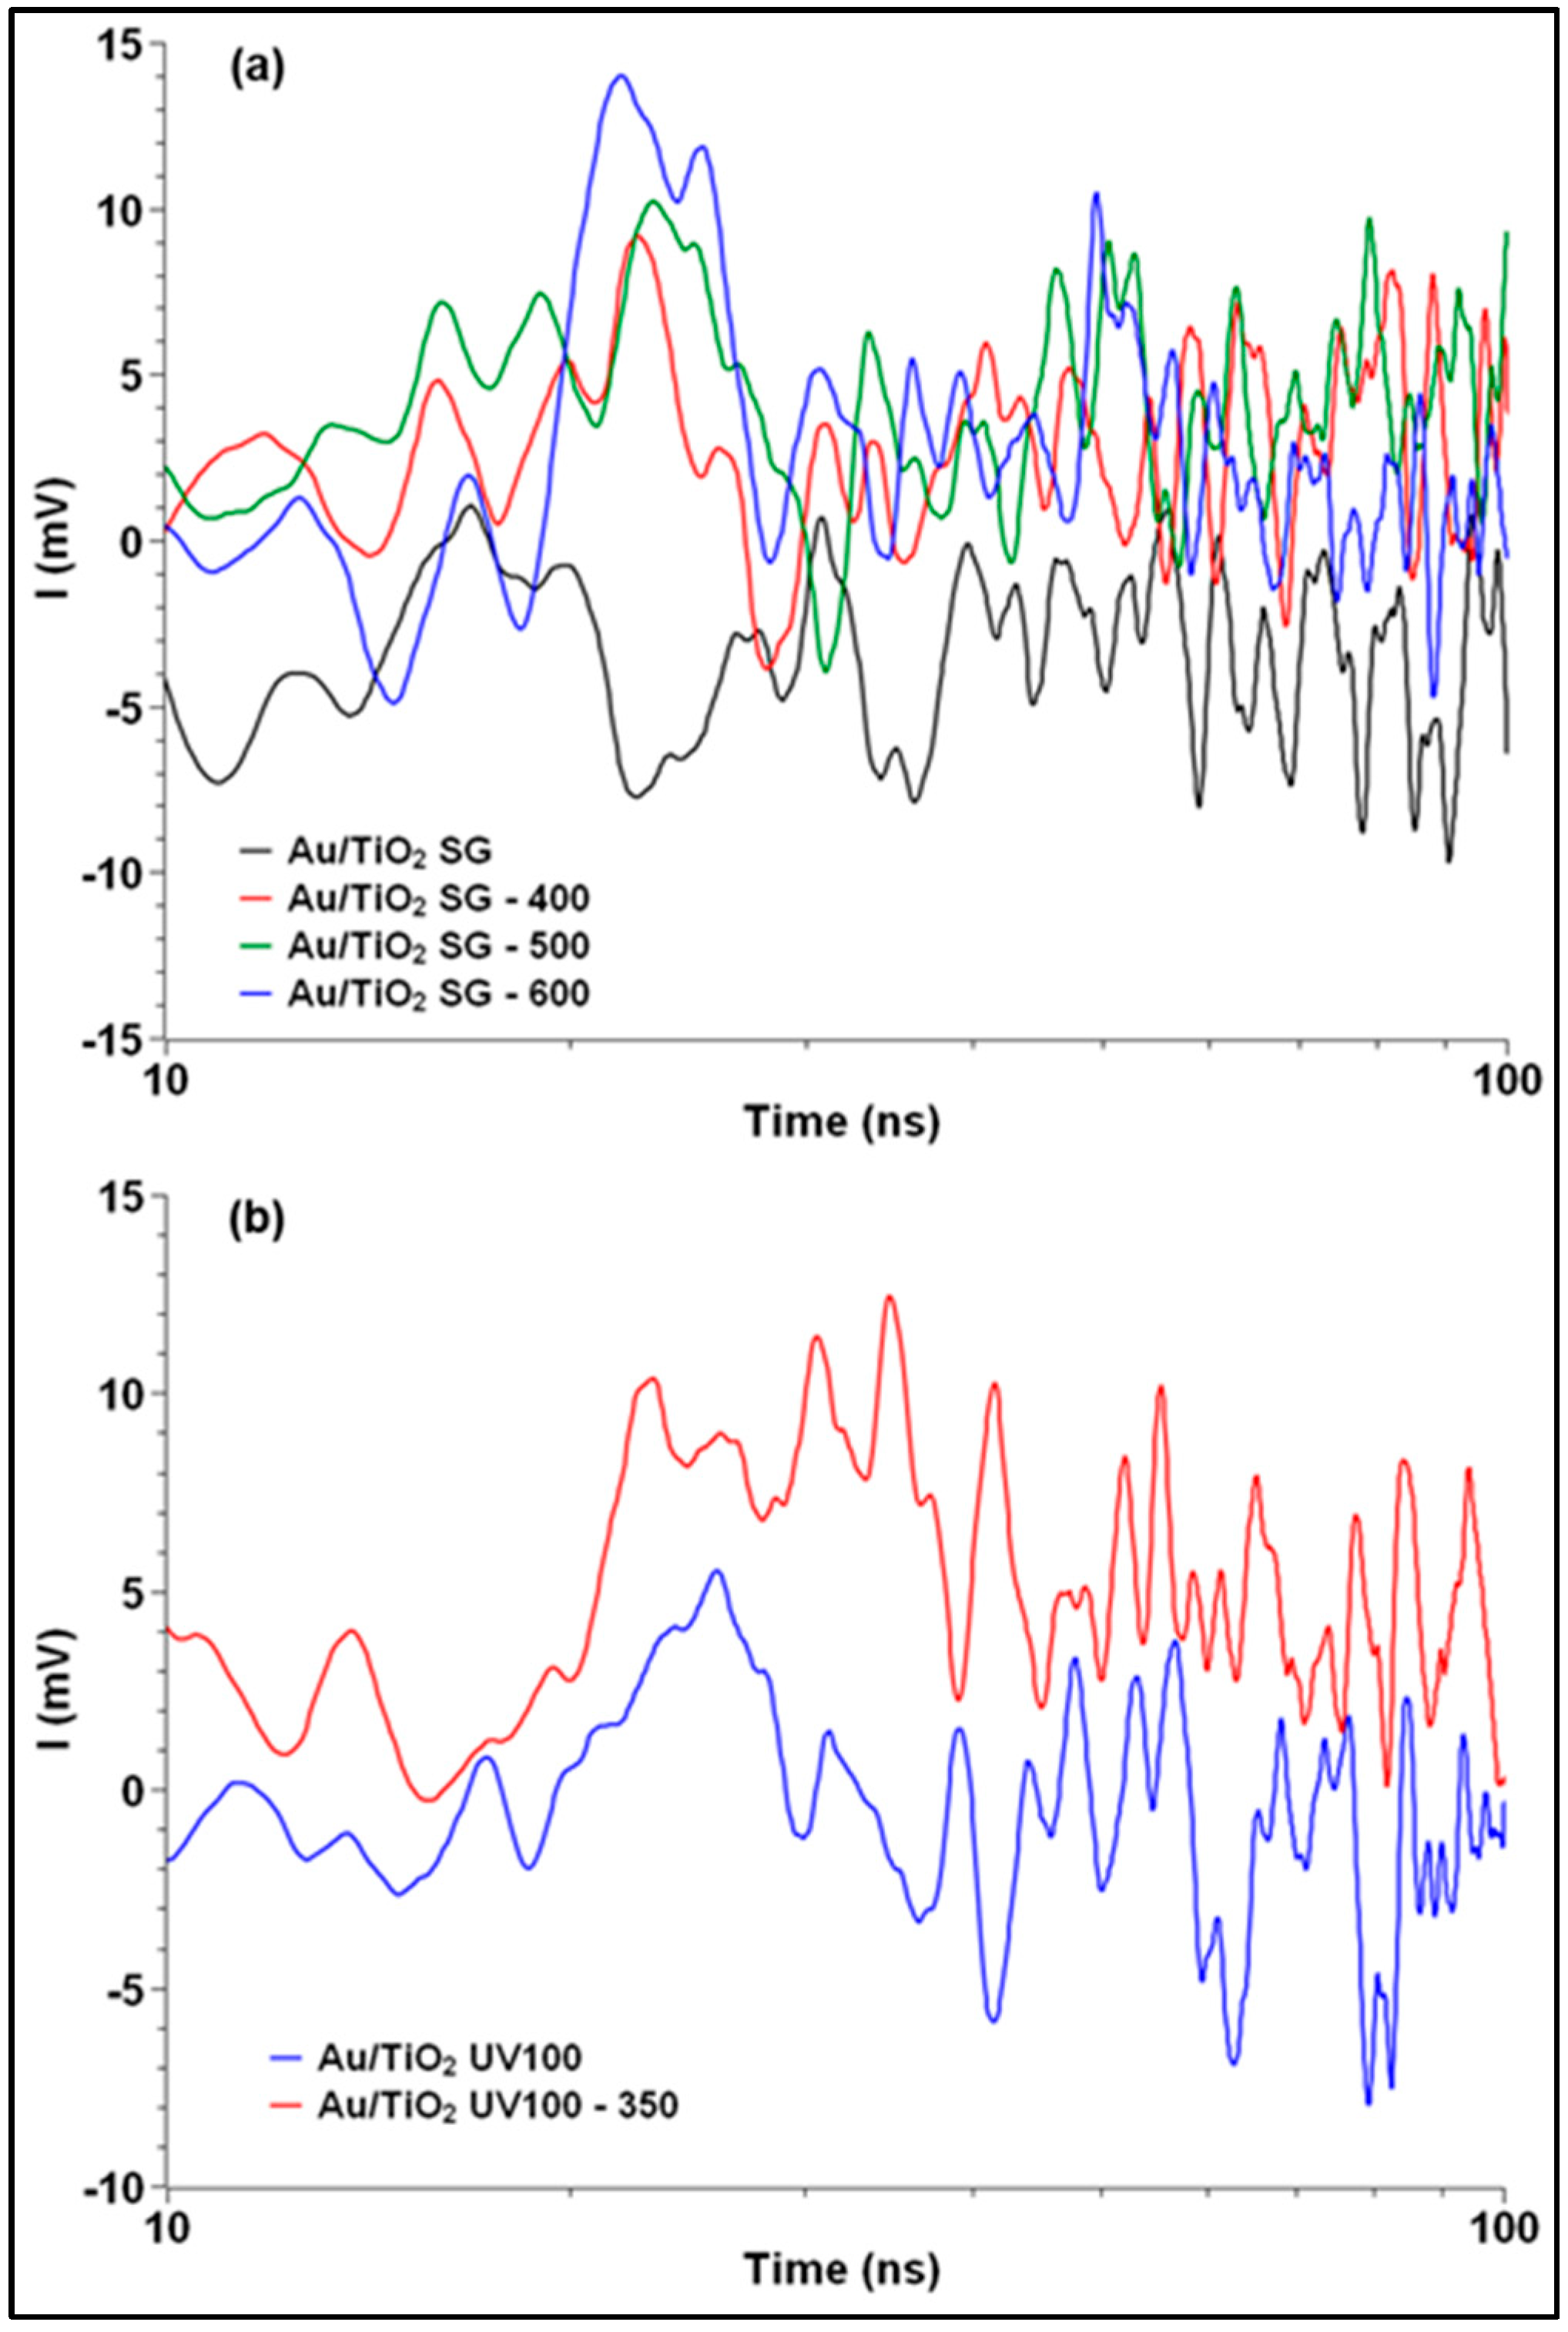
2.4. TRMC Measurements

The lifetime of charge-carriers is completely described by the TRMC decay (I(t)) [44]. This decay is complex and may be due to different mechanisms that govern free electron mobility (considered as the most mobile charge carriers on TiO2-based materials), such as recombination and trapping. At a 360 nm excitation pulse (Figure 7), one could clearly observe that the TiO2 P25 support showed a higher charge carrier generation and free electron lifetime compared to the TiO2 SG-X supports. Furthermore, in this latter series, neither an increase in calcination temperature from 400 to 500 °C nor Au NPs deposition seemed to induce any differences in terms of the charge carrier generation and lifetime (Figure 7b). Nevertheless, concerning Au/TiO2 UV-100-based materials, calcining at 350 °C resulted in limiting both the charge carrier production and free electron lifetime decay, which may be attributed to trapping by Au NPs. Under visible light pulses at 450 nm (Figure 8), only very few charge carriers were generated on the Au/TiO2 SG-X and Au/TiO2 UV100-350 samples.

2.5. EPR Measurements

Electron paramagnetic resonance (EPR) measurements were conducted for the TiO2 SG-400 support, which outperformed all the other studied samples regarding the total CH4 productivity criteria, in order to detect potential active sites/defects in TiO2 (Figure 9). Three types of EPR active centers were identified on TiO2: the signals at 336, 332.5, and 330.0 mT (*) were assigned to the NO species captured at the surface of the porous TiO2 [45,46]. The other visible signal for TiO2 was a combination of (1) unpaired electrons trapped on an oxygen vacancy Vo+, at g = 2.00 (332 mT; Δ), a common defect created in various metal oxides [47,48]; (2) the substitutional N (the weak signal indicated by I); and (3) the paramagnetic N2- nitrogen species in [O-Ti4+-N2--Ti4+] units (signal marked II) [49]. This last signal might have originated from the nitric acid used for the sol gel synthesis and not eliminated due to the mild annealing temperature used for the TiO2 SG-400.

3. Discussion

In order to obtain more insights into the structure/activity correlation, based on the aforementioned characterizations and solar-light photocatalytic CO2 reduction activity, one may assume that the main impacting parameters driving CH4 productivity are linked to the surface area/porosity type and volume/access to porosity, size/density of specific exposed TiO2 facets, and presence/dispersion/size of Au NPs, as well as the presence/density of surface vacancies. Indeed, Au/TiO2 SG-400 was the material exhibiting the highest productivity towards CH4 formation (in terms of production and electronic selectivity). It was observed that its activity was first related to its high surface area and large and exclusive microporosity, presumably leading to larger amounts of adsorbed CO2 molecules. Regarding charge carrier generation, it was seen from the TRMC measurements that TiO2 P25 was the semiconductor generating the largest amount of long-life time charge carriers from UV-A activation, although some other TiO2 supports also exhibited minor charge carrier generation at 450 nm. Among the other influencing factors, anatase crystallite size and orientation may play a determining role. Indeed, TiO2 SG-400 and TiO2 SG showed the smallest crystallite size (6 nm) and the largest surface area, even if the latter exhibited lower pore volumes, probably resulting from obstruction of part of the microporosity (hindering CO2 adsorption) by the residues of precursors, which could be removed by applying a thermal treatment. Consequently, knowing that anatase (101) facets are the most stable [50], it can be assumed that these two TiO2 SG-materials exposed a high density of anatase (101) facets. In addition, it may be assumed, comparing TiO2 SG and TiO2 SG-400, that the former was characterized by a larger contribution of amorphous phase, which was detrimental to the charge carrier mobility and thus the separation. One can also mention that oxygen vacancies, and more precisely the density of oxygen vacancies, confirmed for the TiO2 SG-400 material, also played a determining role in both the CO2 adsorption and activation step and in the charge carrier transport, as previously reported in the literature [27,28,29,30]. In addition, the deposited Au NPs likely acted as supplementary electron traps, as well as co-catalysts. It seems that the intensity of the corresponding TiO2 SG-based SPR signal increased with the temperature of the post-treatment, up to 500 °C, leading to a modification of the Au-TiO2 interaction, which obviously depended of the surface area, crystallinity, and exposed phases of TiO2.

4. Materials and Methods

Titanium dioxide (TiO2) Aeroxide® P25 was purchased from Evonik Industries (Essen, Germany) and TiO2 Hombikat UV-100 was purchased from Sachtleben Chemie GmbH (Duisburg, Germany). Both were used without further purification. TiO2 Brookite was grown hydrothermally, following a previously reported procedure [51]. Briefly, 3.75 mL of titanium(IV) bis (ammonium lactate) dihydroxide (50 wt.%, Sigma-Aldrich, St. Louis, MO, USA) was mixed with 33.75 mL of 6.0 M urea aqueous solution in a 100 ml-hydrothermal reactor Teflon cup. Hydrothermal synthesis was carried out at 160 °C for 24 h. After cooling, solid product was washed with bi-distilled water several times and finally dried in a lyophilizer overnight. Titanium(IV) butoxide (Ti(OBu)4) [Bu = CH2CH2CH2CH3], purum, ≥97%, Sigma Aldrich), nitric acid (HNO3, ACS reagent 70%, Sigma Aldrich), ethanol (EtOH, CH3CH2OH, ≥98%, Sigma Aldrich), chloroauric acid (HAuiiiCl4.3H2O, ≥99.9% trace metal basic, Alfa Aesar, Haverhill, MA, USA), and sodium borohydride (≥98%, Sigma Aldrich) were used without any further purification.

4.1. TiO2 Sol Gel (SG) Synthesis and Hombikat UV-100 Treatment

TiO2 SG was obtained via a sol-gel process, following the protocol below. In a first beaker, 5 mL of Ti(OBu)4 was mixed with 20 mL EtOH and heated at 40 °C in an oil bath. In a second beaker, 5 mL of H2O and 5 mL of EtOH were mixed with 0.9 mL of HNO3. After 1 h under magnetic stirring, the solution containing HNO3 was added drop by drop into the solution containing the Ti precursor. The whole solution was kept at 40 °C (oil bath) under magnetic stirring for 2 h. Then, the gel was dried in an oven under static air at 80 °C for 48 h. After that, the sample was crushed into a fine powder and calcined in a tubular furnace at 400 °C for 2 h, with a heating ramp of 5 °C/min under air flow (100 cm3/min). A parametric study was carried out regarding the temperature of calcination (400, 500, and 600 °C).
The TiO2 UV-100 was used as purchased but also thermally treated at 350 °C or 550 °C in static air for 4 h, with a heating rate of 10 °C/min, in order to remove the amorphous phase.
The resulting samples were labelled TiO2 SG-X and TiO2 UV100-X (X stands for the calcination temperature).

4.2. Au Nanoparticles (NPs) Deposition

Gold metal nanoparticles (Au NPs) (Au: 0.86 wt.% theoretical value) were loaded onto TiO2 via an impregnation–reduction method [52] using HAuIIICl4 as the precursor of gold and NaBH4 as the reducing agent. In a 100 mL flask, 400 mg of TiO2 was mixed with 40 mL of H2O for 5 min. Then, 80 µL of an aqueous solution of HAuIIICl4.3H2O (2.2 × 10⁻¹ M) was added and the mixture was left under magnetic stirring (1000 rpm) for 45 min while the precursor is impregnated. Then, 1 mL of a fresh solution of NaBH4 was added to the mixture. The NaBH4 concentration solution was adjusted, in order to have a ratio NaBH4/Mpr. = 5. After the reduction, the mixture was stirred for 15 min (1000 rpm) and then the obtained material was filtered and washed with 1 L of distilled water. To finish, the resulting Au/TiO2 was dried in an oven at 100 °C overnight (air). The same deposition method was applied to all the different TiO2 supports.

4.3. Characterization Methods

The X-ray diffraction apparatus used was a Bruker D8 Advance (Billerica, MA, USA) diffractometer equipped with a Lynxeye XE detector operating at 40 kV and 40 mA in θ/θ mode. The source of the X-Rays was a copper anticathode using the Kα line at 1.5418 Å. In order to obtain normalized diffractograms, a fixed amount of 50 mg of the sample was placed on a plastic holder. The acquisition of diffractograms was performed in scanning mode in steps of 2θ = 10° to 2 θ = 90° with a step of 0.05 and a counting time of 5 s per step. The mean crystal thickness was calculated using the Debye–Scherrer equation based on the width at half maximum and the position of the most intense peak.
The nitrogen adsorption–desorption isotherms were obtained using a Micromeritics Asap 2420 porosimeter (Norcross, GA, USA). The analysis was carried out at the nitrogen liquefaction temperature (77 K). The materials were degassed at 150 °C under primary vacuum for 5 h with a temperature rise of 10 °C/min, in order to desorb water and adsorbed molecules from their surfaces. The specific surfaces of the materials were calculated from the adsorption isotherm using the BET method. The pore size distribution could be calculated from the desorption data, using the BJH method specifically for mesoporous solids.
UV-vis absorption spectra were recorded on a Perkin Elmer 950 spectrophotometer (Waltham, MA, USA) fitted with a Labsphere 100 nm integrating sphere. The spectra were acquired in reflection mode (diffuse reflectance). The diffuse reflectance spectra were converted to Kubelka–Munk units via the equation: F(R) = ( 1 - R ) 2 2 R . To obtain the band gap (Eg) of the semiconductor (SC), the Tauc equation (F(R)∗hν)S = (hν − Eg) was used, where h is the Planck constant, v is the frequency, and S is a coefficient, which is ½ in the case of an indirect gap SC and 2 in the case of a direct band gap SC (½ for TiO2).
The charge-carrier lifetimes under illumination were determined through microwave absorption experiments using the time resolved microwave conductivity method (TRMC) [42]. The incident microwaves were generated by a Gunn diode of the Kα band at 30 GHz. The pulsed light source was an OPO laser (EKSPLA, NT342B, Vilnius, Lithuania) tunable from 225 to 2000 nm. It delivered 8 ns fwmh pulses with a frequency of 10 Hz.
Elemental analyzes of the samples were performed using inductively coupled plasma atomic emission spectrometry (ICP-AES, Varian 720 ES, Palo Alto, CA, USA) with a detection sensitivity for gold of 0.1 mg/mL.
EPR measurements were performed on a Bruker ESP300 (Billerica, MA, USA) apparatus using the X band (10 GHz) at 100 K, and 40 mg of sample was inserted in a quartz tube of 4 mm diameter.

4.4. Photocatalytic Tests

Photocatalytic setup has previously been described elsewhere [37]. During the test, a continuous flowing reaction mixture (CO2 + H2O) flow (0.3 mL.min−1) passes through a light-transparent photoreactor (6 mL) equipped with a Hg lamp, simulating artificial solar light (150 W Ceramic-Metal-Halide Lamp, total photon flux for the whole lamp spectrum: 0.028 mol.s−1.m−2). The irradiated surface was 19.6 cm2. For the photocatalytic tests, 50 mg of the materials are mixed in ethanol and deposited on a 50 mm diameter glass disk by evaporation at 100 °C. The surface concentration of photocatalyst on the glass disc was ≈ 25 g.m−2. The glass disk was then put in the reactor and the pilot was purged for 5 min with CO2 flow (>100 mL.min−1), to remove air and other gas impurities. Before starting the test, the pilot was run with a CO2 gas flow (0.3 mL.min−1) without illumination, to control the absence of products and the quantity of CO2. Finally, products from the reactor were analyzed using an online micro-GC (Agilent 3000A SRA instrument, Santa Clara, CA, USA). Finally, the lamp is switched on and the duration of the test was 5 h. Production rates were calculated according to the following equation:
  r X ( mol . h 1 . g 1 ) = [ X ] × 10 6 × ( flow   rate ) × 60 V m × m photocat
where [X]: Concentration in ppm, mphotocat: mass of photocatalyst (g), the flow rate was 0.0003 L.min−1, and Vm = 24.79 L.mol−1 (STP conditions).
Electronic selectivity was calculated using the following equations:
CH 4   Selectivity   = 8 [ CH 4 ] 8   [ CH 4 ] + 2   [ H 2 ]
H 2   Selectivity   = 1 CH 4   Selectivity

5. Conclusions

To conclude, in the present paper, Au/TiO2 photocatalysts were studied, characterized, and compared for CO2 photocatalytic gas-phase reduction, with regards to the nature of the TiO2 semi-conductor support. It was shown that the surface area, porosity TiO2 crystallographic phase, density of specific exposed facets, and oxygen vacancies were the key factors driving CH4 productivity under solar-light activation. Understanding the main impacting factors made it possible to design, via simple sol-gel synthesis, an optimal TiO2-based photocatalyst, exhibiting the best compromise between these impacting factors. In this work, 0.84 wt.% Au/TiO2 SG calcined at 400 °C exhibited the best performance, leading to a continuous mean CH4 production rate of 50 μmol.h−1.g−1 over 5 h and an electronic selectivity of 85%, mainly due to UV-driven activity. This highest activity was attributed to the high surface area and accessible microporous volume, high density of exposed TiO2 (101) facets, and oxygen vacancies acting as reactive defects sites for CO2 adsorption/activation/dissociation and charge carrier transport.

Author Contributions

Conceptualization, V.K., T.C., C.M. (Clément Marchal); methodology, T.C., Q.X., L.H., C.M. (Caroline Mary), C.M. (Clément Marchal), P.F., C.C.-J.; formal analysis, C.M. (Clément Marchal), C.M. (Caroline Mary), L.H., Q.X., L.S., C.C.-J., V.C., T.C., L.S.; investigation, T.C., V.K., C.M. (Clément Marchal); supervision, V.K., V.C., T.C., J.T., T.H., P.F.; data curation, T.C., C.M. (Clément Marchal), C.M. (Caroline Mary), L.H., V.K., L.S., P.F.; writing-original draft preparation, V.K., C.M. (Clément Marchal); writing-review and editing, V.K., T.C., V.C., C.M. (Clément Marchal). All authors have read and agreed to the published version of the manuscript.

Funding

This research was funded by the European Community, (projects H2020–LC–SC3-2019-NZE-RES-CC), grant agreement number 884444. Leila Hammoud wants to thank the « Centre Islamique d’Orientation et de l’Enseignement supérieur » (CIOES) for her PhD. fellowship. Qingyang Xi wants to thank the “China Scholarship Council” (CSC) for his PhD. fellowship (File N°: 201908410202).

Data Availability Statement

Data can be available on request from the corresponding authors.

Acknowledgments

The authors are very grateful to Nolwenn Le Breton and Bertrand Vileno from the “Institut de Chimie” of Strasbourg for the EPR measurements.

Conflicts of Interest

The authors declare no conflict of interest.

References

  1. Inoue, T.; Fujishima, A.; Konishi, S.; Honda, K. Photoelectrocatalytic Reduction of Carbon Dioxide in aqueous Suspensions of Semiconductor Powders. Nature 1979, 277, 637. [Google Scholar] [CrossRef]
  2. Kubacka, A.; Fernandez-Garcia, M.; Colon, G. Advanced Nanoarchitectures for Solar Photocatalytic Applications. Chem. Rev. 2012, 112, 1555–1614. [Google Scholar]
  3. Neatu, S.; Macia-Agullo, J.A.; Garcia, H. Solar Light Photocatalytic CO2 Reduction: General Considerations and Selected Bench-Mark Photocatalysts. Int. J. Mol. Sci. 2014, 15, 5246–5262. [Google Scholar] [CrossRef] [Green Version]
  4. LianJun, L.; Ying, L. Understanding the Reaction Mechanism of Photocatalytic Reduction of CO2 with H2O on TiO2-Based Photocatalysts: A Review. Aerosol Air Qual. Res. 2014, 14, 453–469. [Google Scholar]
  5. Nguyen, T.P.; Nguyen, D.L.T.; Nguyen, V.-H.; Le, T.-H.; Vo, D.N.; Trinh, Q.T.; Bae, S.-R.; Chae, S.Y.; Kim, S.Y.; Le, Q.V. Recent Advances in TiO2-Based Photocatalysts for Reduction of CO2 to Fuels. Nanomaterials 2020, 10, 337. [Google Scholar] [CrossRef] [PubMed] [Green Version]
  6. Shehzad, N.; Tahir, M.; Johari, K.; Murugesan, T.; Hussain, M. A critical review on TiO2 based photocatalytic CO2 reduction system: Strategies to improve efficiency. J. CO2 Util. 2018, 26, 98–122. [Google Scholar] [CrossRef]
  7. Li, X.; Zhuang, Z.; Li, W.; Pan, H. Photocatalytic reduction of CO2 over noble metal-loaded and nitrogen-doped mesoporous TiO2. Appl. Catal. A. 2012, 429–430, 31–38. [Google Scholar] [CrossRef]
  8. Linic, S.; Aslam, U.; Boerigter, C.; Morabito, M. Photochemical transformations on plasmonic metal nanoparticles. Nat. Mater. 2015, 14, 567–576. [Google Scholar]
  9. Jia, J.; Wang, H.; Lu, Z.; O’Brien, P.G.; Ghoussoub, M.; Duchesne, P.; Zheng, Z.; Li, P.; Qiao, Q.; Wang, L.; et al. Photothermal Catalyst Engineering: Hydrogenation of Gaseous CO2 with High Activity and Tailored Selectivity. Adv. Sci. 2017, 4, 1700252. [Google Scholar] [CrossRef] [Green Version]
  10. Lee, D.-E.; Kim, D.J.; Devthade, V.; Jo, W.-K.; Tonda, S. Size-dependent selectivity and activity of highly dispersed sub-nanometer Pt clusters integrated with P25 for CO2 photoreduction into methane fuel. Appl. Surf. Sci. 2022, 584, 152532. [Google Scholar] [CrossRef]
  11. Barrocas, B.T.; Ambrozova, N.; Koci, K. Photocatalytic Reduction of Carbon Dioxide on TiO2 Heterojunction Photocataysts—A review. Materials 2022, 15, 967. [Google Scholar] [CrossRef] [PubMed]
  12. Low, J.; Yu, J.; Jaroniec, M.; Wageh, S.; Al-Ghamdi, A.A. Heterojunction Photocatalysts. Adv. Mater. 2017, 29, 1601694. [Google Scholar]
  13. Wang, L.; Zhang, Z.; Han, Q.; Liu, Y.; Zhong, J.; Chen, J.; Huang, J.; She, H.; Wang, Q. Preparation of CdS-P25/ZIF-67 composite material and its photocatalytic CO2 reduction performance. Appl. Surf. Sci. 2022, 584, 152645. [Google Scholar] [CrossRef]
  14. Indrakanti, V.P.; Kubicki, J.D.; Schobert, H.H. Photoinduced activation of CO2 on Ti-based heterogeneous catalysts: Current state, chemical physics-based insights and outlook. Energy Environ. Sci. 2009, 2, 745–758. [Google Scholar] [CrossRef]
  15. Ghuman, K.K.; Singh, C.C. Effect of doping on electronic structure and photocatalytic behavior of amorphous TiO2. J. Phys. Condens. Matter 2013, 25, 475501. [Google Scholar] [CrossRef] [Green Version]
  16. Naik, B.; Kim, S.M.; Jung, C.H.; Moon, S.Y.; Kim, S.H.; Park, J.Y. Enhanced H2 Generation of Au-Loaded, Nitrogen-Doped TiO2 Hierarchical Nanostructures under Visible Light. Adv. Mater. Interfaces 2014, 1, 1300018. [Google Scholar] [CrossRef]
  17. Cottineau, T.; Béalu, N.; Gross, P.-A.; Pronkin, S.N.; Keller, N.; Savinova, E.R.; Keller, V. One step synthesis of niobium doped titania nanotube arrays to form (N,Nb) co-doped TiO2 with high visible light photoelectrochemical activity. J. Mater. Chem. 2013, 1, 2151. [Google Scholar] [CrossRef]
  18. Ma, X.; Wu, Y.; Lu, Y.; Xu, J.; Wang, Y.; Zhu, Y. Effect of Compensated Codoping on the Photoelectrochemical Properties of Anatase TiO2 Photocatalyst. J. Phys. Chem. C. 2011, 115, 16963–16969. [Google Scholar] [CrossRef]
  19. Almaev, A.V.; Yakovlev, N.N.; Kushnarev, B.O.; Kopyev, V.V.; Novikov, V.A.; Zinoviev, M.M.; Yudin, N.N.; Podzivalov, S.N.; Erzakova, N.N.; Chikiryaka, A.V.; et al. Gas Sensitivity of IBSD Deposited TiO2 Thin Films. Coatings 2022, 12, 1565. [Google Scholar] [CrossRef]
  20. Serga, V.; Burve, R.; Krumina, A.; Romanova, M.; Kotomin, E.A.; Popov, A.I. Extraction-Pyrolytic Method for TiO2 polymorphs Production. Crystals 2021, 11, 431. [Google Scholar] [CrossRef]
  21. Devi, A.D.; Pushpavanam, S.; Singh, N.; Verma, J.; Kaur, M.P.; Roy, S.C. Enhanced methane yield by photoreduction of CO2 at moderate temperature and pressure using Pt coated, graphene oxide wrapped TiO2 nanotubes. Results Eng. 2022, 14, 100441. [Google Scholar] [CrossRef]
  22. Goto, H.; Masegi, H.; Sadale, S.B.; Noda, K. Intricate behaviors of gas phase CO2 photoreduction in high vacuum using Cu2O loaded TiO2 nanotube arrays. J. CO2 Util. 2022, 59, 101964. [Google Scholar] [CrossRef]
  23. Butburee, T.; Kotchasarn, P.; Hirunsit, P.; Sun, Z.; Tang, Q.; Khemthong, P.; Sangkhun, W.; Thongsuwan, W.; Kumnorkaew, P.; Wang, H.; et al. New understanding of crystal control and facet selectivity of titanium dioxide ruling photocatalytic performance. J. Mater. Chem. A 2019, 7, 8156–8166. [Google Scholar] [CrossRef]
  24. Liu, L.; Jiang, Y.; Zhao, H.; Chen, J.; Cheng, J.; Yang, K.; Li, Y. Engineering Coexposed {001} and {101} Facets in Oxygen-Deficient TiO2 Nanocrystals for Enhanced CO2 Photoreduction under Visible Light. ACS Catal. 2016, 6, 1097–1108. [Google Scholar] [CrossRef]
  25. Scholes, D.T.; Yee, P.Y.; Lindemuth, J.R.; Kang, H.; Onorato, J.; Ghosh, R.; Luscombe, C.K.; Spano, F.C.; Tolbert, S.H.; Schwartz, B.J. The Effects of Crystallinity on Charge Transport and the Structure of Sequentially Processed F4TCNQ-Doped Conjugated Polymer Films. Adv. Funct. Mater. 2017, 27, 1702654. [Google Scholar] [CrossRef]
  26. Rodriguez, M.M.; Peng, X.H.; Liu, L.J.; Li, Y.; Andino, J.M. A Density Functional Theory and Experimental Study of CO2 Interaction with Brookite TiO2. J. Phys. Chem. C. 2012, 116, 19755–19764. [Google Scholar] [CrossRef]
  27. Liu, L.J.; Zhao, H.L.; Andino, J.M.; Li, Y. Photocatalytic CO2 Reduction with H2O on TiO2 Nanocrystals: Comparison of Anatase, Rutile, and Brookite Polymorphs and Exploration of Surface Chemistry. ACS Catal. 2012, 2, 1817–1828. [Google Scholar] [CrossRef]
  28. Pan, H.; Gu, B.H.; Zhang, Z.Y. Phase-Dependent Photocatalytic Ability of TiO2: A First-Principles Study. J. Chem. Theory Comput. 2009, 5, 3074–3078. [Google Scholar] [CrossRef]
  29. Pan, X.; Yang, M.-Q.; Fu, X.; Zhang, N.; Xu, Y.-J. Defective TiO2 with Oxygen Vacancies: Synthesis, Properties and Photocatalytic Applications. Nanoscale 2013, 5, 3601. [Google Scholar] [CrossRef]
  30. Zhou, Z.; Li, J.; You, Z. A facile TiO2 containing oxygen vacancies and hydroxyl as a Ru-loaded underlay for CO2 hydrogenation to CH4. Appl. Surf. Sci. 2022, 587, 152856. [Google Scholar] [CrossRef]
  31. Elbana, O.; Fujitsuka, M.; Kim, S.; Majima, T. Charge Carrier Dynamics in TiO2 Mesocrystals with Oxygen Vacancies for Photocatalytic Hydrogen Generation under Solar Light Irradiation. J. Phys. Chem. C. 2018, 122, 15163–15170. [Google Scholar] [CrossRef]
  32. Chen, R.; Fan, F.; Dittrich, T.; Li, C. Imaging photogenerated charge carriers on surfaces and interfaces of photocatalysts with surface photovoltage microscopy. Chem. Soc. Rev. 2018, 47, 8238–8262. [Google Scholar] [CrossRef] [PubMed]
  33. Glass, D.; Quesada-Cabrera, R.; Bardey, S.; Promdet, P.; Sapienza, R.; Keller, V.; Meier, S.A.; Caps, V.; Parkin, I.P.; Cortés, E. Probing the Role of Atomic Defects in Photocatalytic Systems through Photoinduced Enhanced Raman Scattering. ACS Energy Lett. 2021, 6, 4273–4281. [Google Scholar] [CrossRef]
  34. Schweke, D.; Mordehovitz, Y.; Halabi, M.; Shelly, L.; Hayrun, S. Defect Chemistry of Oxides for Energy Applications. Adv. Mater. 2018, 30, 1706300. [Google Scholar]
  35. Kovacic, Z.; Likozar, B.; Hus, M. Photocatalytic CO2 Reduction: A Review of Ab Initio Mechanism, Kinetics, and Multiscale Modeling Simulations. ACS Catal. 2020, 10, 14984–15007. [Google Scholar] [CrossRef]
  36. Marchal, C.; Piquet, A.; Behr, M.; Cottineau, T.; Papaefthimiou, V.; Keller, V.; Caps, V. Activation of solid grinding-derived Au/TiO2 photocatalysts for solar H2 production from water-methanol mixtures with low alcohol content. J. Catal. 2017, 352, 22–34. [Google Scholar] [CrossRef]
  37. Bardey, S.; Bonduelle-Skrzypczak, A.; Fécant, A.; Zhznpznq, C.; Colbeau-Justin, C.; Caps, V.; Keller, V. Plasmonic photocatalysis applied to solar fuels. Faraday Discuss. 2019, 214, 417–439. [Google Scholar] [CrossRef] [Green Version]
  38. Haruta, M.; Bobayashi, T.; Sano, H.; Yamada, N. Novel Gold Catalysts for the Oxidation of Carbon Monoxide at a Temperature far Below 0°C. Chem. Lett. 1987, 16, 405–408. [Google Scholar]
  39. Mohamed, I.M.A.; Dao, V.-D.; Yasin, A.S.; Barakat, N.A.M.; Choi, H.-S. Design of ultrafine nickel oxide nanostructured material for enhanced electrocatalytic oxidation of urea: Physicochemical and electrochemical analyses. Appl. Surf. Sci. 2017, 400, 355–364. [Google Scholar] [CrossRef]
  40. Zhao, H.; Liu, L.; Andino, J.M.; Li, Y. Bicrystalline TiO2 with controllable anatase-brookite phase content for enhanced CO2 photoreduction to fuels. J. Mater. Chem. A 2013, 1, 8209–8216. [Google Scholar] [CrossRef] [Green Version]
  41. Cheng, X.; Yu, X.; Li, B.; Yan, L.; Xing, Z.; Li, J. Enhanced visible light activity and mechanism of TiO2 codoped with molybdenum and nitrogen. Mater. Sci. Eng. B 2013, 178, 425–430. [Google Scholar] [CrossRef]
  42. Lignier, P.; Comotti, M.; Schüth, F.; Rousset, J.-L.; Caps, V. Effect of the titania morphology on the Au/TiO2 catalyzed aerobic epoxidation of stilbene. Catal. Today 2009, 141, 355–360. [Google Scholar] [CrossRef]
  43. Hammoud, L.; Streibel, C.; Toufaily, J.; Hamieh, T.; Keller, V.; Caps, V. The role of the gold-platinum interface in AuPt/TiO2-catalyzed plasmon-induced reduction of CO2 with water. Faraday Discuss. 2022. [Google Scholar] [CrossRef]
  44. Colbeau-Justin, C.; Kunst, M.; Huguenin, D. Structural influence on charge-carrier lifetimes in TiO2 powders studied by microwave absorption. J. Mater. Sci. 2003, 38, 24. [Google Scholar]
  45. Livraghi, S.; Chierotti, M.R.; Giamello, E.; Magnacca, G.; Paganini, M.C.; Cappelletti, G.; Bianchi, C.L. Nitrogen-Doped Titanium Dioxide Active in Photocatalytic Reactions with Visible Light: A Multi-Technique Characterization on Differently Prepared Materials. J. Phys. Chem. C 2008, 112, 17244–17252. [Google Scholar] [CrossRef]
  46. Hensling, F.V.E.; Xu, C.; Gunkel, F.; Dittmann, R. UV radiation enhanced oxygen vacancy formation caused by the PLD plasma plume. Sci. Rep. 2017, 7, 39953. [Google Scholar]
  47. Deml, A.M.; Holder, A.M.; O’Hayre, R.P.; Musgrave, C.B.; Stevanović, V. Intrinsic Material Properties Dictating Oxygen Vacancy Formation Energetics in Metal Oxides. J. Phys. Chem. Lett. 2015, 6, 1948–1953. [Google Scholar] [CrossRef]
  48. Zhang, Z.; Long, J.; Xie, X.; Lin, H.; Zhou, Y.; Yuan, R.; Dai, W.; Ding, Z.; Wang, X.; Fu, X. ChemPhysChem, 2012; 13, 1542–1550.
  49. Martsinovich, N.; Troisi, A. How TiO2 crystallographic surfaces influence charge injection rates from a chemisorbed dye sensitiser. Phys. Chem. Chem. Phys. 2012, 38, 13392–13401. [Google Scholar] [CrossRef]
  50. Guillois, K.; Burel, L.; Tuel, A.; Caps, V. Gold-catalyzed aerobic epoxidation of trans-stilbene in methylcyclohexane. Part I: Design of a reference catalyst. Appl. Catal. A 2012, 415–416, 1–9. [Google Scholar]
  51. Beltram, A.; Romero-Ocana, I.; Delgado-Jaen, J.J.; Montini, T.; Fornasiero, P. Photocatalytic valorization of ethanol and glycerol over TiO2 polymorphs for sustainable hydrogen production. Appl. Catal. Gen. 2016, 518, 167–175. [Google Scholar] [CrossRef]
  52. Vigneron, F.; Piquet, A.; Baaziz, W.; Ronot, P.; Boos, A.; Janowska, I.; Pham-Huu, C.; Petit, C.; Caps, V. Hydrophobic gold catalysts: From synthesis on passivated silica to synthesis on few-layer graphene. Catal. Today 2014, 235, 90–97. [Google Scholar] [CrossRef]
Figure 1. XRD pattern of (a) TiO2 SG-X and (b) TiO2 brookite and TiO2 P25, and TiO2 UV100-X commercial-based samples.
Catalysts 12 01623 g001
Figure 2. N2 adsorption/desorption isotherms (a,c) and pore size distribution (b,d) of TiO2 SG-X, and TiO2 P25, TiO2 Brookite, and TiO2 UV100-X commercial-based samples, respectively.
Catalysts 12 01623 g002
Figure 3. Kubelka–Munk function F(R) of (a) TiO2 SG – X and (b) TiO2 P25, TiO2 Brookite, and TiO2 UV-100 – X commercial-based samples, (Insert) Tauc plots.
Catalysts 12 01623 g003
Figure 4. UV-Visible spectra of (a) Au/TiO2 SG – X and (b) Au/TiO2 P25, Au/TiO2 Brookite and Au/TiO2 UV-100 – X commercial-based samples.
Catalysts 12 01623 g004
Figure 5. Specific H2 and CH4 production rate and electronic selectivity (CO2/H2O = 96/4 mol. ratio), after 5 h at 0.3 mL/min continuous flow under solar light irradiation of (a) Au/TiO2 SG-X and (b) Au/TiO2 P25, Au/TiO2 brookite and Au/TiO2 UV100-X commercial-based samples.
Catalysts 12 01623 g005
Figure 6. Specific normalized H2 and CH4 production rates (CO2/H2O = 96/4 mol. ratio) at 0.3 mL/min continuous flow under solar light irradiation of (a) Au/TiO2 SG – X and (b) Au/TiO2 P25, Au/TiO2 Brookite and Au/TiO2 UV100 – X commercial-based samples.
Catalysts 12 01623 g006
Figure 7. TRMC signals at 360 nm obtained on (a) TiO2 P25, TiO2 SG-400 and TiO2 SG-500 supports (b) Au/TiO2 SG-X and (c) and Au/TiO2 UV100-350 commercial-based samples.
Catalysts 12 01623 g007
Figure 8. TRMC signals at 450 nm obtained on (a) Au/TiO2 SG-X and (b) Au/TiO2 UV100-350 commercial-based samples.
Catalysts 12 01623 g008
Figure 9. EPR signal for TiO2 SG-400 recorded at 100 K.
Catalysts 12 01623 g009
Table 1. TiO2 mean crystallite size, surface area, porosity measurements, band-gap value. Experimental error of a 10%, b 8%, and c 5%.
Mean Crystallite Size
(nm) a
SBET
(m2/g) b
Vpore
(cm3/g) b
Mean Pore Diameter (nm) bEg
(eV) c
AnataseBrookiteRutile
TiO2 P2517/2355 0.20≈303.20
TiO2 brookite/19/150 0.183–53.20
TiO2 UV10011//315 0.33˂33.25
TiO2 UV100-35017//1350.244.53.25
TiO2 UV100-55019//770.288.03.25
TiO2SG67n.d2950.19<42.85
TiO2SG-400610n.d2000.22<42.96
TiO2SG-50010111975 0.11<42.95
TiO2SG-600//29n.dn.dn.d.2.90
Table 2. Au content and deposition yield determined from ICP. Experimental error of 6%.
SupportAu(Th.)
(wt.%)
Au(Real)
(wt.%)
Au Deposition Yield
(%)
λSPR
(nm)
TiO2 P250.860.7992548
TiO2 Brookite0.860.8295550
TiO2 UV100 556
TiO2 UV100-3500.860.8194548
TiO2 UV100-550 562
TiO2 SG 561
TiO2 SG-4000.860.8498556
TiO2 SG-500 559
TiO2 SG-600 541
Publisher’s Note: MDPI stays neutral with regard to jurisdictional claims in published maps and institutional affiliations.

