Article

Annealing and Plasma Effects on the Structural and Photocatalytic Properties of TiO2 Fibers Produced by Electrospinning

School of Mechanical Engineering, Yangzhou University, Yangzhou 225009, China
*
Authors to whom correspondence should be addressed.
Catalysts 2022, 12(11), 1441; https://doi.org/10.3390/catal12111441
Submission received: 21 October 2022 / Revised: 7 November 2022 / Accepted: 10 November 2022 / Published: 15 November 2022
(This article belongs to the Section Photocatalysis)

Abstract

:
In this study, a combined method of heat treatment and plasma surface modification was used to improve the nanostructures and photocatalytic activity of electrospun TiO2 fibers. Based on the tuning effect of the annealing temperature from 500 to 800 °C, further improvements via the generation of H2 radiofrequency plasma reactions on the fiber’s surface were investigated. It was found that the anatase–rutile phase transition starts to occur at around 700 °C, which is higher than the common temperature for TiO2. The interfacial effect is generated by the symbiosis relationship between these two phases in the fibers, which can enhance photocatalytic activity since the anatase–rutile heterojunction in mixed-phase TiO2 is formed. The dramatic rise in oxygen vacancies on the fiber’s surface is created by the H2 plasma; this leads to the number of trapped electrons increasing and results in an accelerated separation between the photogenerated electrons and holes. Therefore, the photocatalytic mechanism, including the anatase–rutile heterojunction and the TiO2 fiber band structure containing oxygen vacancies, is predicted. The degradation rate was significantly enhanced (1.5 times) by increasing the annealing temperature up to 700 °C, which can be further improved upon after treatment with surface H2 plasma.

1. Introduction

The per capita water quantity of China is lower than that of the rest of the world because of the huge population base, even though the total water resource is abundant. The domestic development of industry and urbanization further aggravated the shortage of water resources. Water resource shortages and pollution gradually limit the development of a society. In the context of nature’s inability to provide stronger sewage degradation and water recycling, sewage control projects are also trying to promote the treatment and recycling of sewage to alleviate the problem of water shortage in China. At present, the available methods for wastewater treatment are physical [1], chemical [2], and biological [3] techniques. However, these methods have many limitations, such as high cost, long cycles, low efficiency, and difficulties in dealing with biodegradable toxic and harmful substances [4], so they cannot completely solve the pollution problem. In contrast, photocatalytic oxidation technology has had more attention paid to it by researchers in recent years because it directly uses sunlight and reacts mildly; this method is simple, economical, practical, and free from secondary pollution [5].
Among the various photocatalysts, TiO2, as a kind of n-type semiconductor, attracts the most attention because of its nontoxic, harmlessness, low cost, stable chemical properties, sterilization capacity, and high photocatalytic activity, especially a relatively high sensitivity to ultraviolet light [6,7]. Common TiO2 has three crystal structures [8]: anatase, rutile, and brookite. As a photocatalyst, anatase has a narrow band gap and is usually used as the main crystalline phase structure in this field, while rutile is rarely used because of its wide band gap, and brookite has not been found to have photocatalytic properties. However, some studies have shown that the mixture of TiO2-phase structures can further improve its photocatalytic activity.
For applications in photodegradation, people have to face the problem of recycling. TiO2 fiber is a kind of photocatalytic material that is more conducive to recycling, while the study on how to improve its photocatalytic activity will promote its practical application. Electrospinning is a common technique for preparing photocatalytic fibers [9]. In the process of preparing TiO2 fiber by electrospinning, it is necessary to heat the generated fiber precursor mixture. In this process, once the temperature is not properly controlled, the TiO2 fiber phase is likely to be unfavorable to the improvement of photocatalytic performance. According to the existing research, the transition temperature limit of anatase to rutile is 500–600 °C. However, due to the unique structure and nonpowder morphology of TiO2 fiber, the transition temperature limit may change. Therefore, the heat treatment crystallization process of electrospun TiO2 fiber is studied to ensure that the TiO2 fiber produced has high anatase or its composite crystallinity. At the same time, it is particularly important to ensure that the obtained TiO2 fiber has certain activity and strength.
In view of the advantages and disadvantages of TiO2, some scholars have researched the further improvement of its photocatalytic performance. It has been found that the formation of heterojunction structures on the surface can accelerate the separation of photogenerated electrons and holes, thus improving photocatalytic efficiency [10,11]. Abraham et al. [12] prepared W6+/TiO2 heterojunctions by a sol-gel method; the produced sample is spherical in shape, with uniform particle distribution. The degradation effect of Congo red was up to 86%. The doping of metals (Bi, Mg, etc.) can also be used to create a positive effect on the improvement of photocatalytic efficiency [13,14,15,16]. Jung et al. [17] doped europium in TiO2 by liquid plasma. It can be observed that the treated TiO2 is composed of many irregular nanoparticles stacked together. The degradation rate of acetyl salicylic acid reached 0.00148 min−1. In the literature, it is known that plasma technology can produce defects such as oxygen vacancies and accelerate the separation of photogenerated electrons from holes. It also contributes to the improvement of photocatalytic efficiency [18,19]. Irala et al. [20] used nitrogen plasma to treat the TiO2 film grown on a carbon steel substrate, which improved photocatalytic performance. After treatment, TiO2 was attached in granular form. The degradation rate of methyl blue reached 0.009 min−1, 1.3 times that before treatment.
However, people also have to face a problem in practical applications since the powder recovery is difficult and easily causes secondary pollution. Therefore, it is of great significance to fix the semiconductor photocatalyst on the carrier. Carriers such as fibers, porous nickel foam, stainless steel mesh, and porous sponge are highly valued because of their large comparative area and skeleton-like three-dimensional network structure. Fiber is widely used because of its large specific surface area and convenient recycling. Calisir et al. [21] prepared nitrogen-doped TiO2 fibers through centrifugal spinning and calcination processes. The treated fibers showed a hollow shape and an increased specific surface area, while there was little change in grain size, and the band gap was reduced to 3.01 eV. The degradation efficiency of methylene blue was still 94.66% after three cycles of experiments. Zhang et al. [22] prepared a kind of glass hollow TiO2 fiber film via dip coating and calcination. As the heating rate decreases, more holes appear, and the specific surface area increases. After treatment, the degradation rate of methylene blue reached 93%. It was 2.9 times higher than that before treatment. Li et al. [23] prepared Fe-doped TiO2 fibers by a hydrothermal method. Microscopic observation showed that the treated fibers exhibited needle-like morphologies. Lattice distortion occurs when Fe ions are doped. The separation speed of electron and hole is accelerated, which has a positive effect on the improvement of photocatalytic efficiency. After doping, the degradation ability of methylene blue reached 99.9%.
In recent years, the increasing requirements for material properties have greatly promoted the development of material surface modification technology. Plasma technology as a green, cheap, and simple method has attracted extensive attention [24]. The plasma process is different from the general treatment method. The treatment system is dominated by charged particles and affected by external electric, magnetic, and electromagnetic fields [25]. The treatment method has the characteristics of no influence on matrix performance, high efficiency, energy saving, environmental protection, a simple process, and so on [26]. Therefore, plasma modification can effectively improve the physicochemical properties of semiconductor photocatalysts.
In this study, the TiO2 fiber prepared by electrospinning technology was modified by heat treatment combined with plasma regulation [27] so that its crystal phase and interfacial structures could maximize the improvement of the photocatalytic performance. The effects of different heat treatment temperatures and plasma modification on the micro/nanostructure and optical and photocatalytic activity of the TiO2 fibers are analyzed, and the mechanism of photocatalytic degradation of the organic compounds is predicted.

2. Results and Discussion

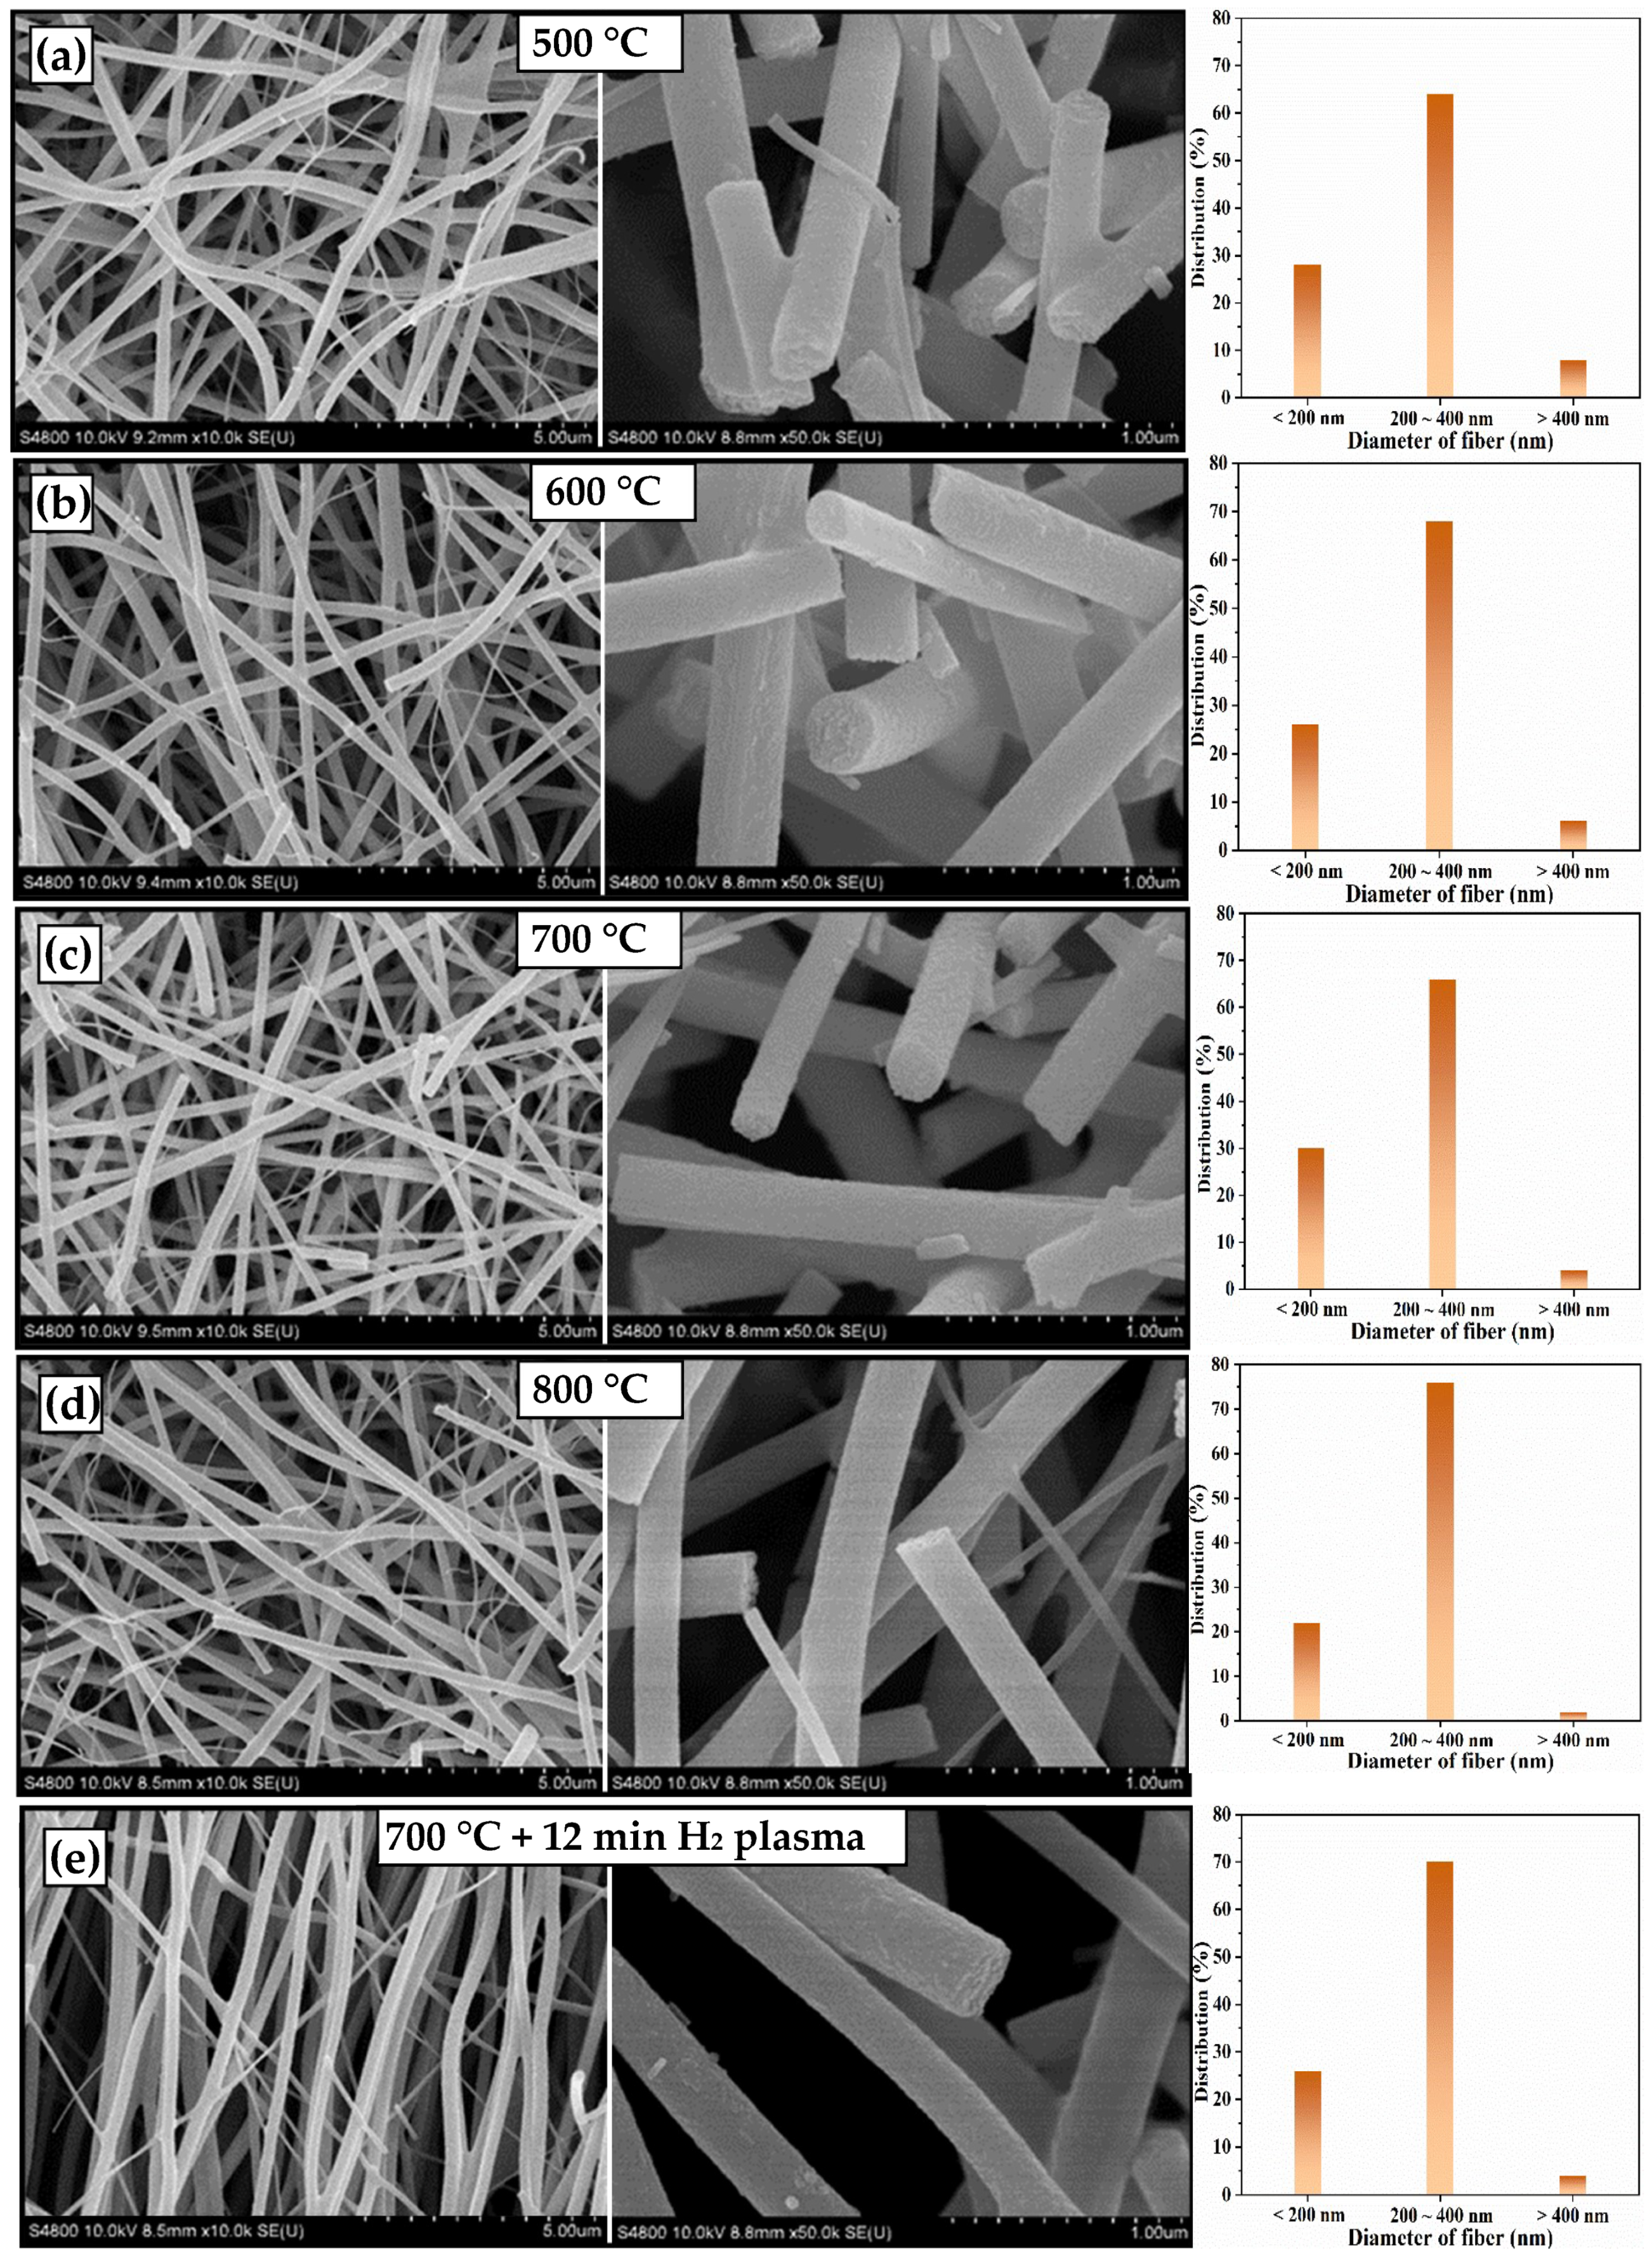
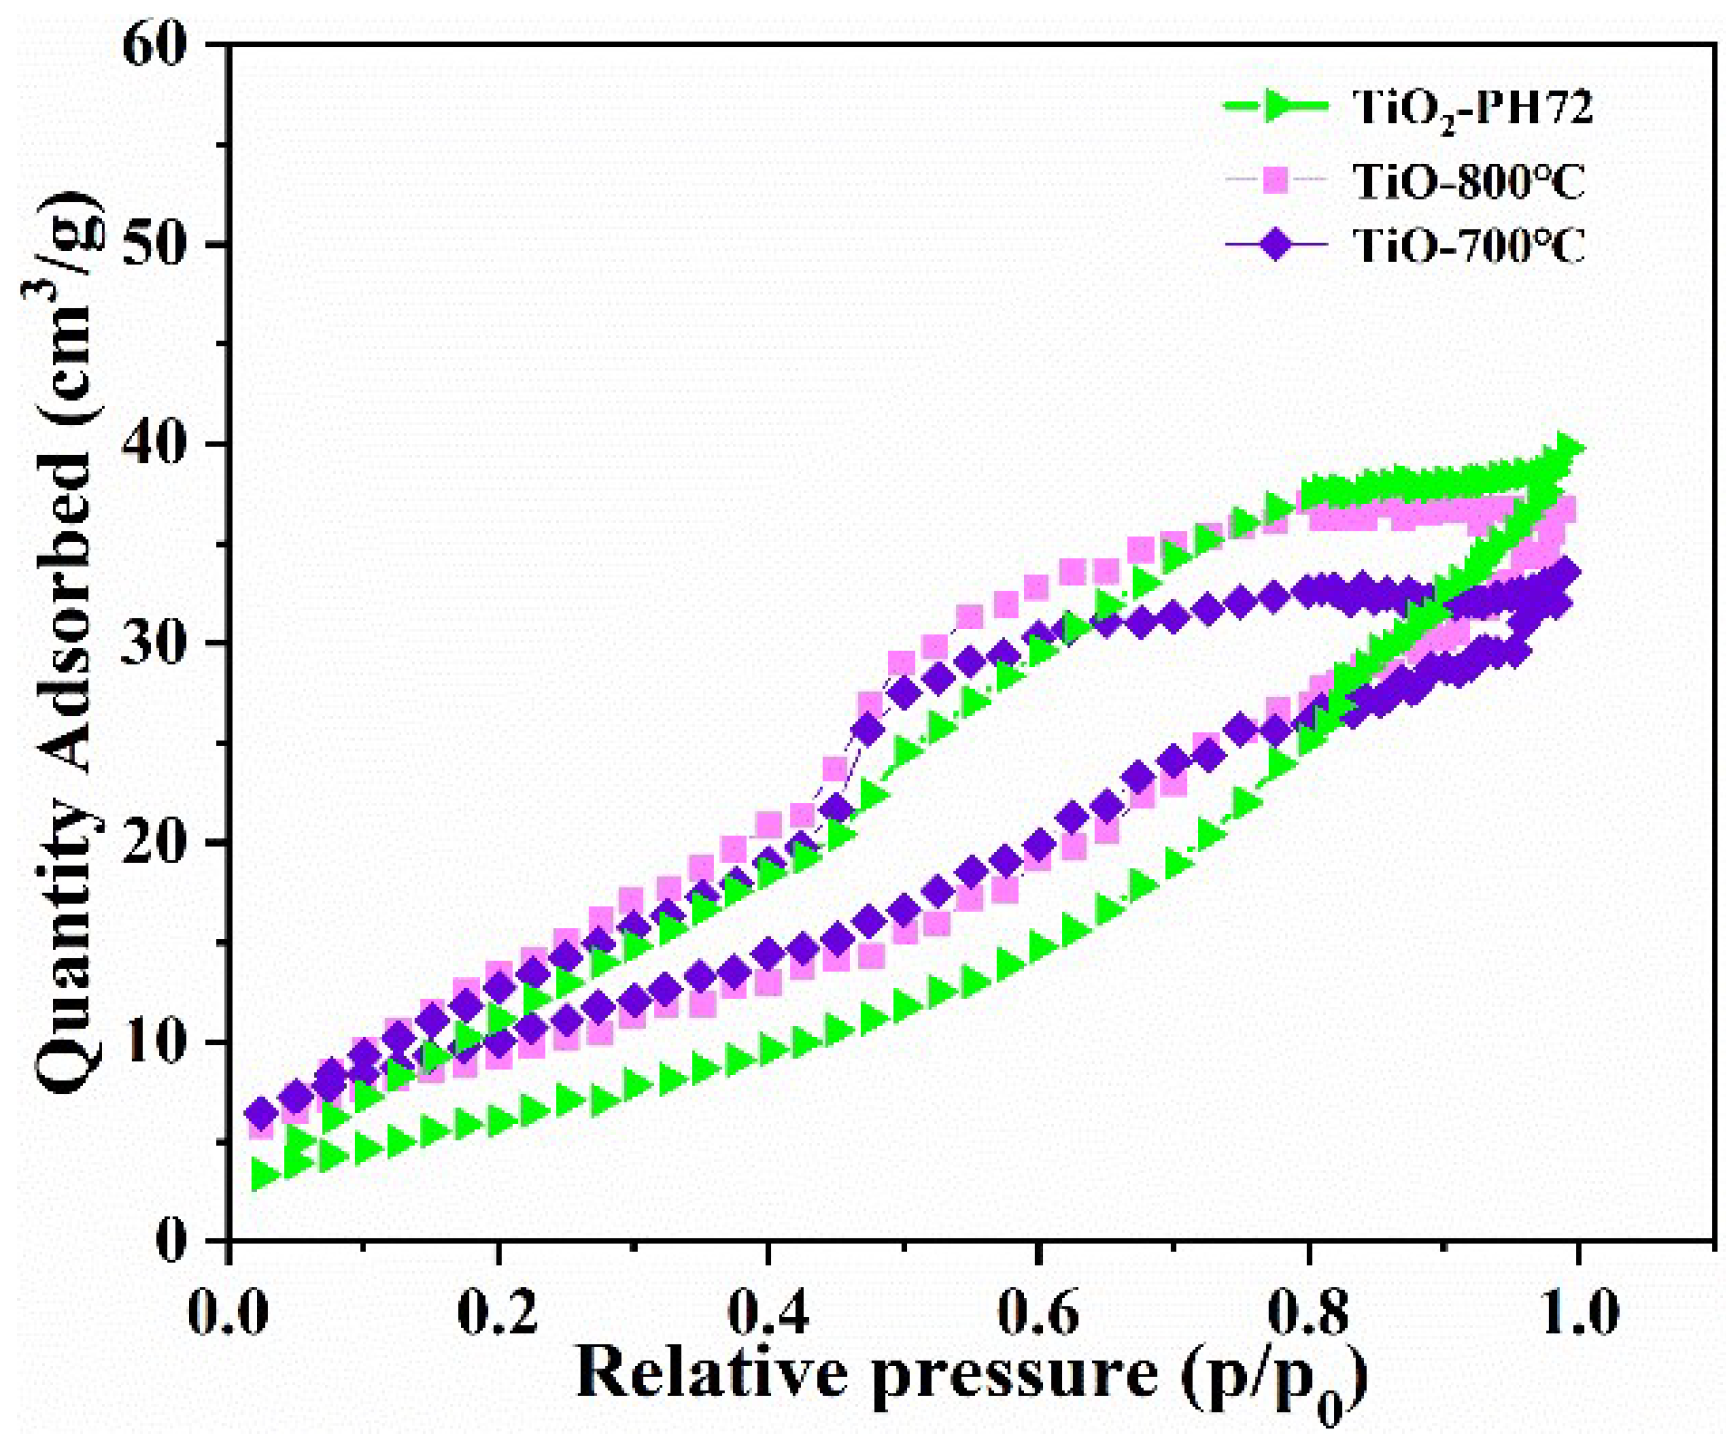
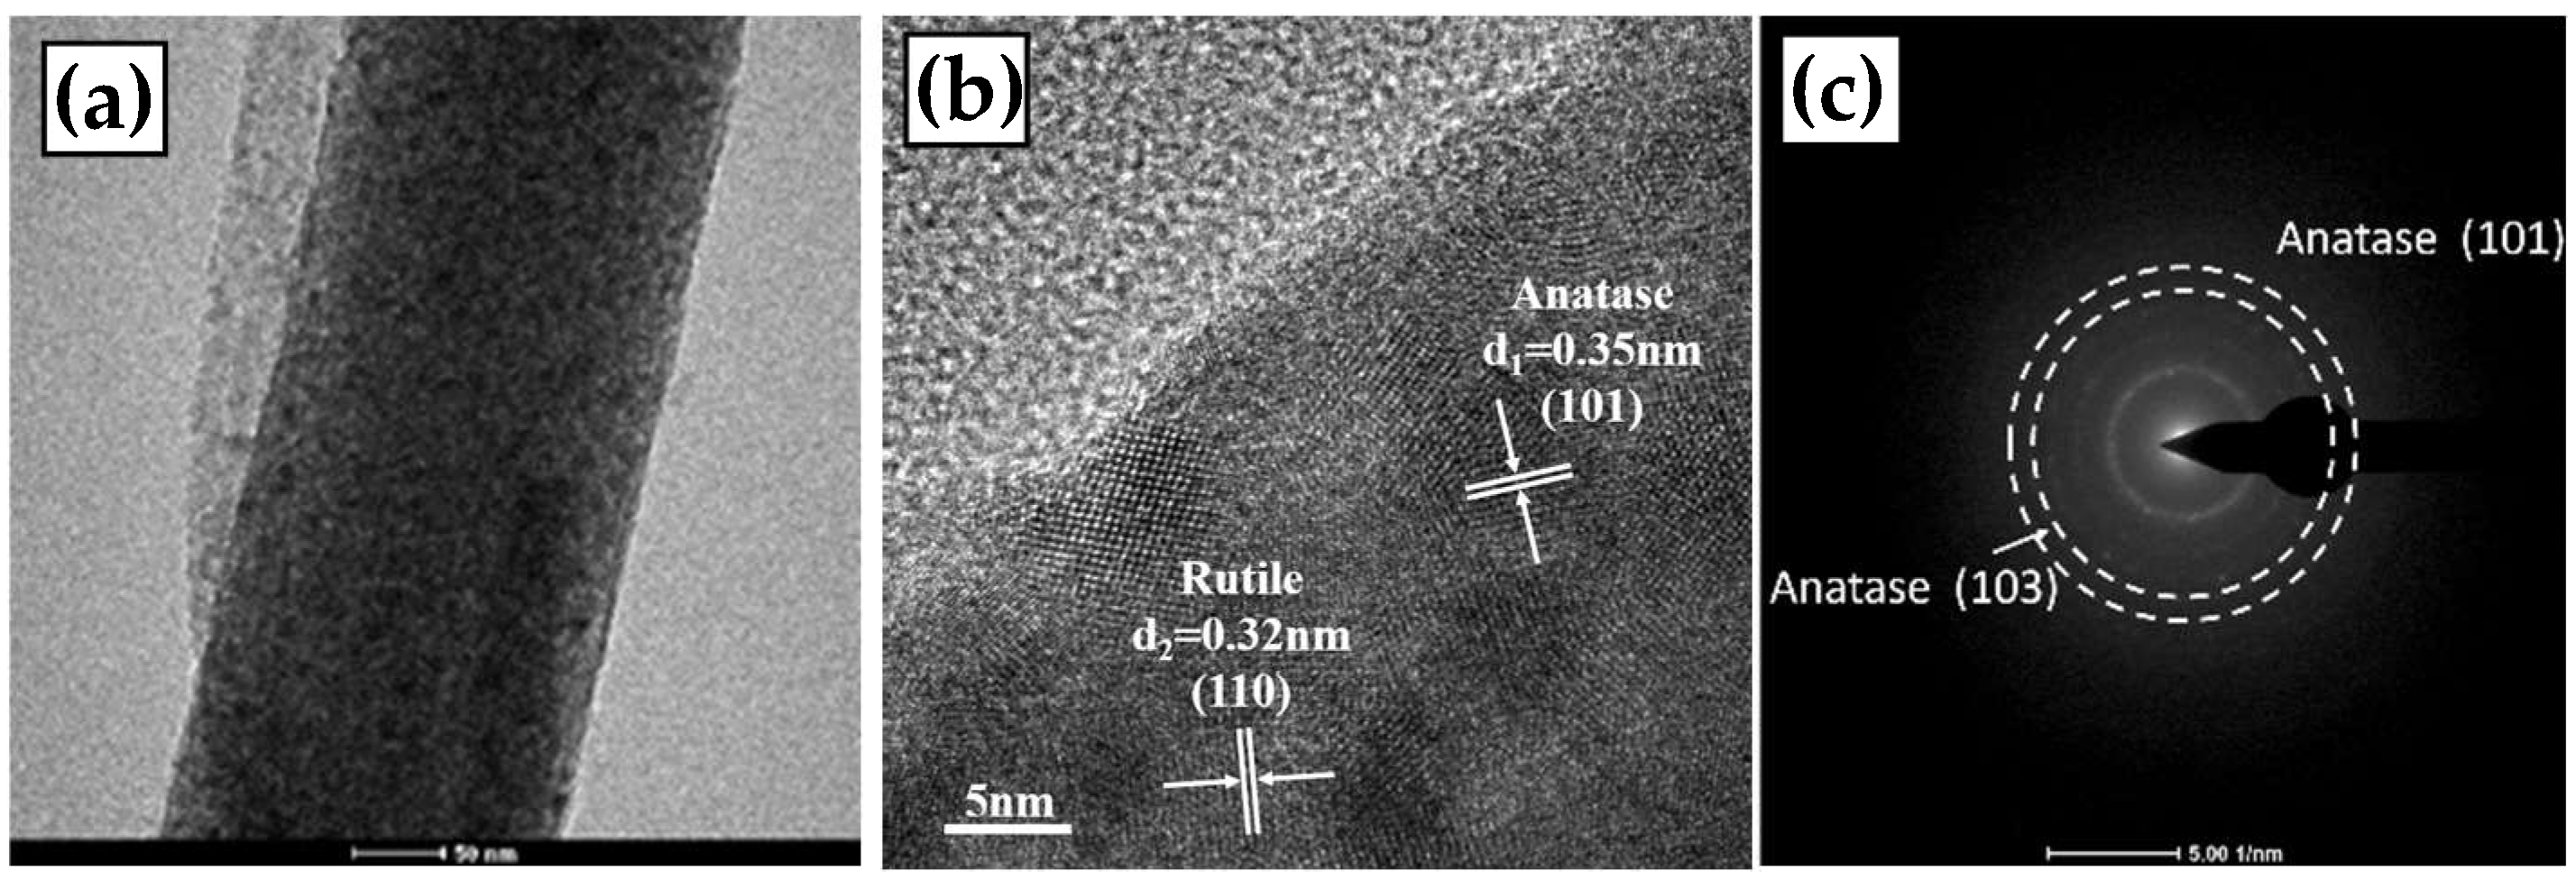
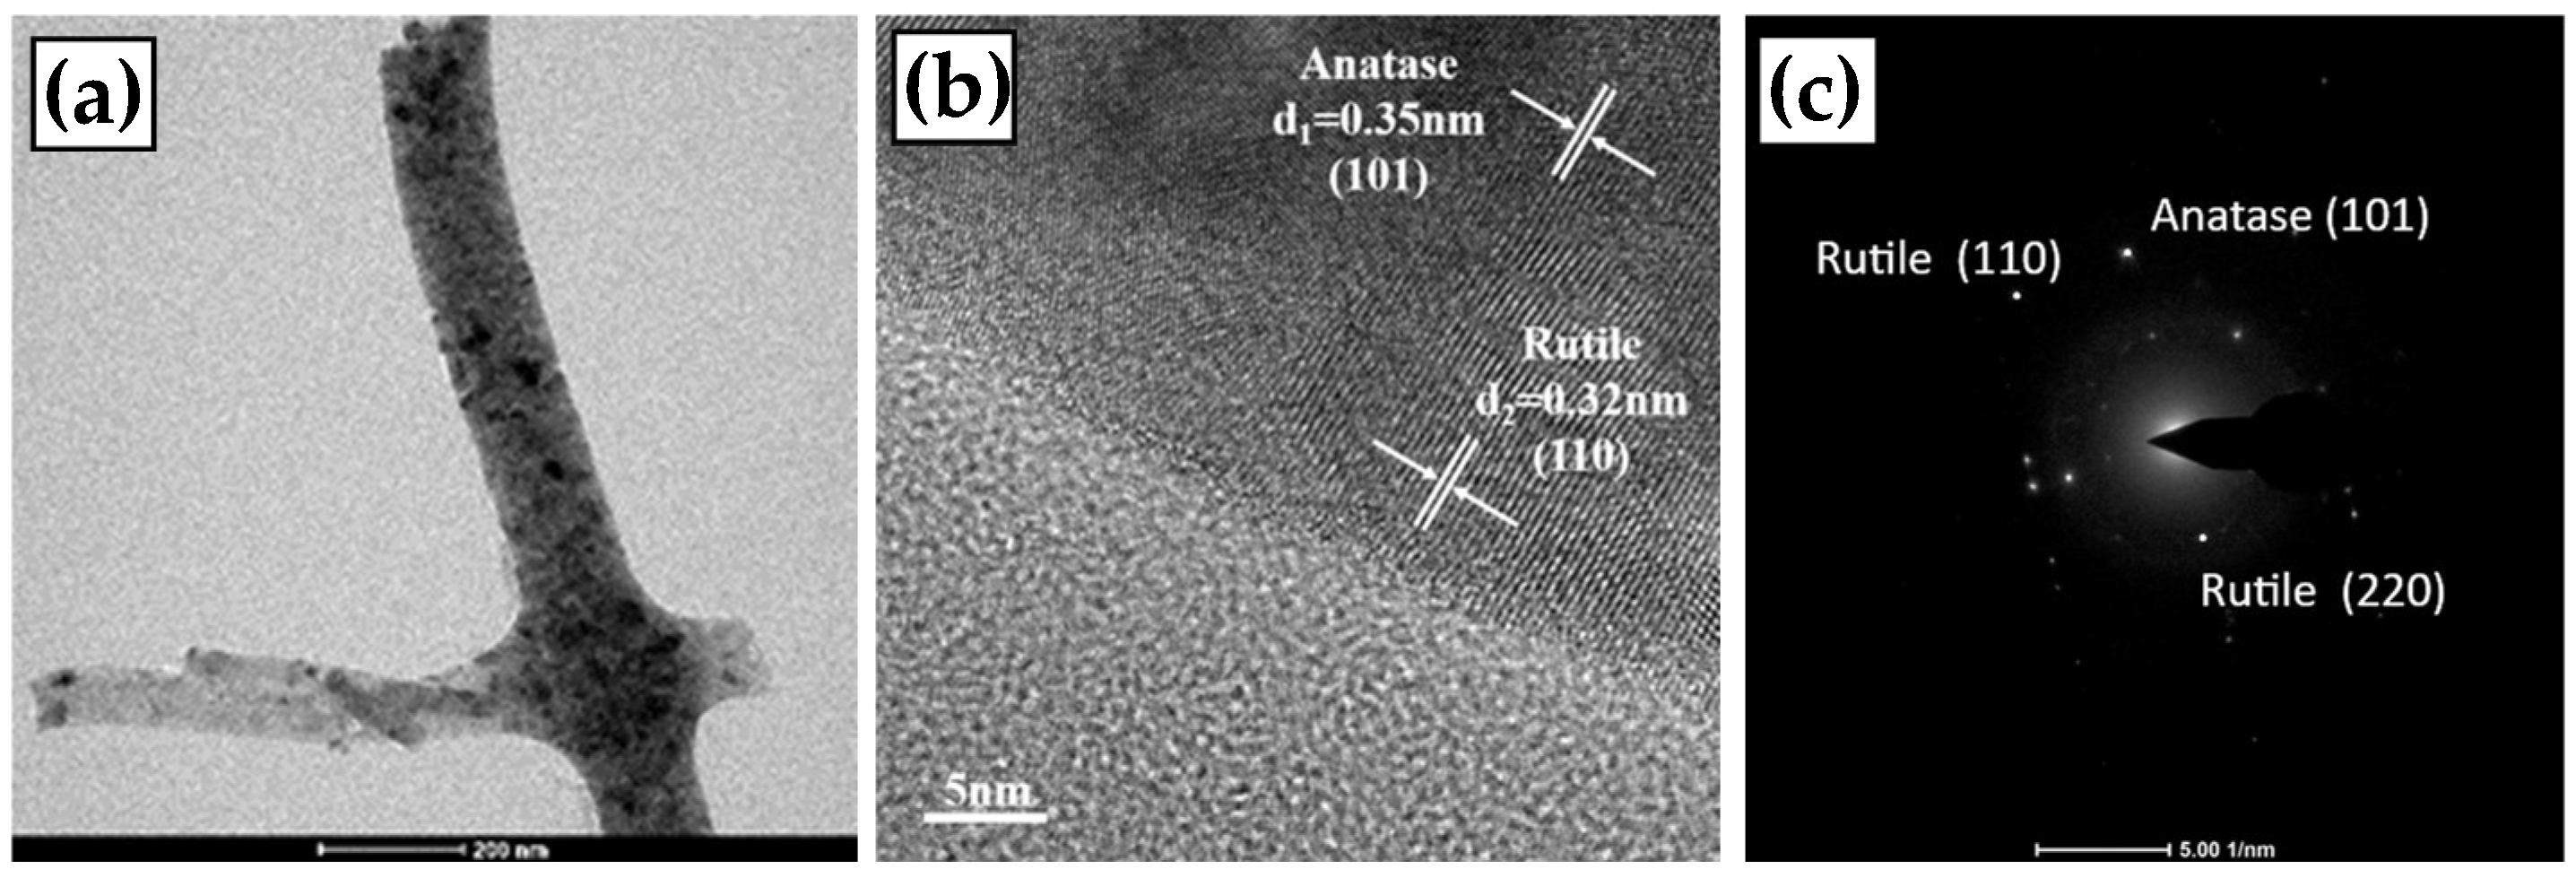
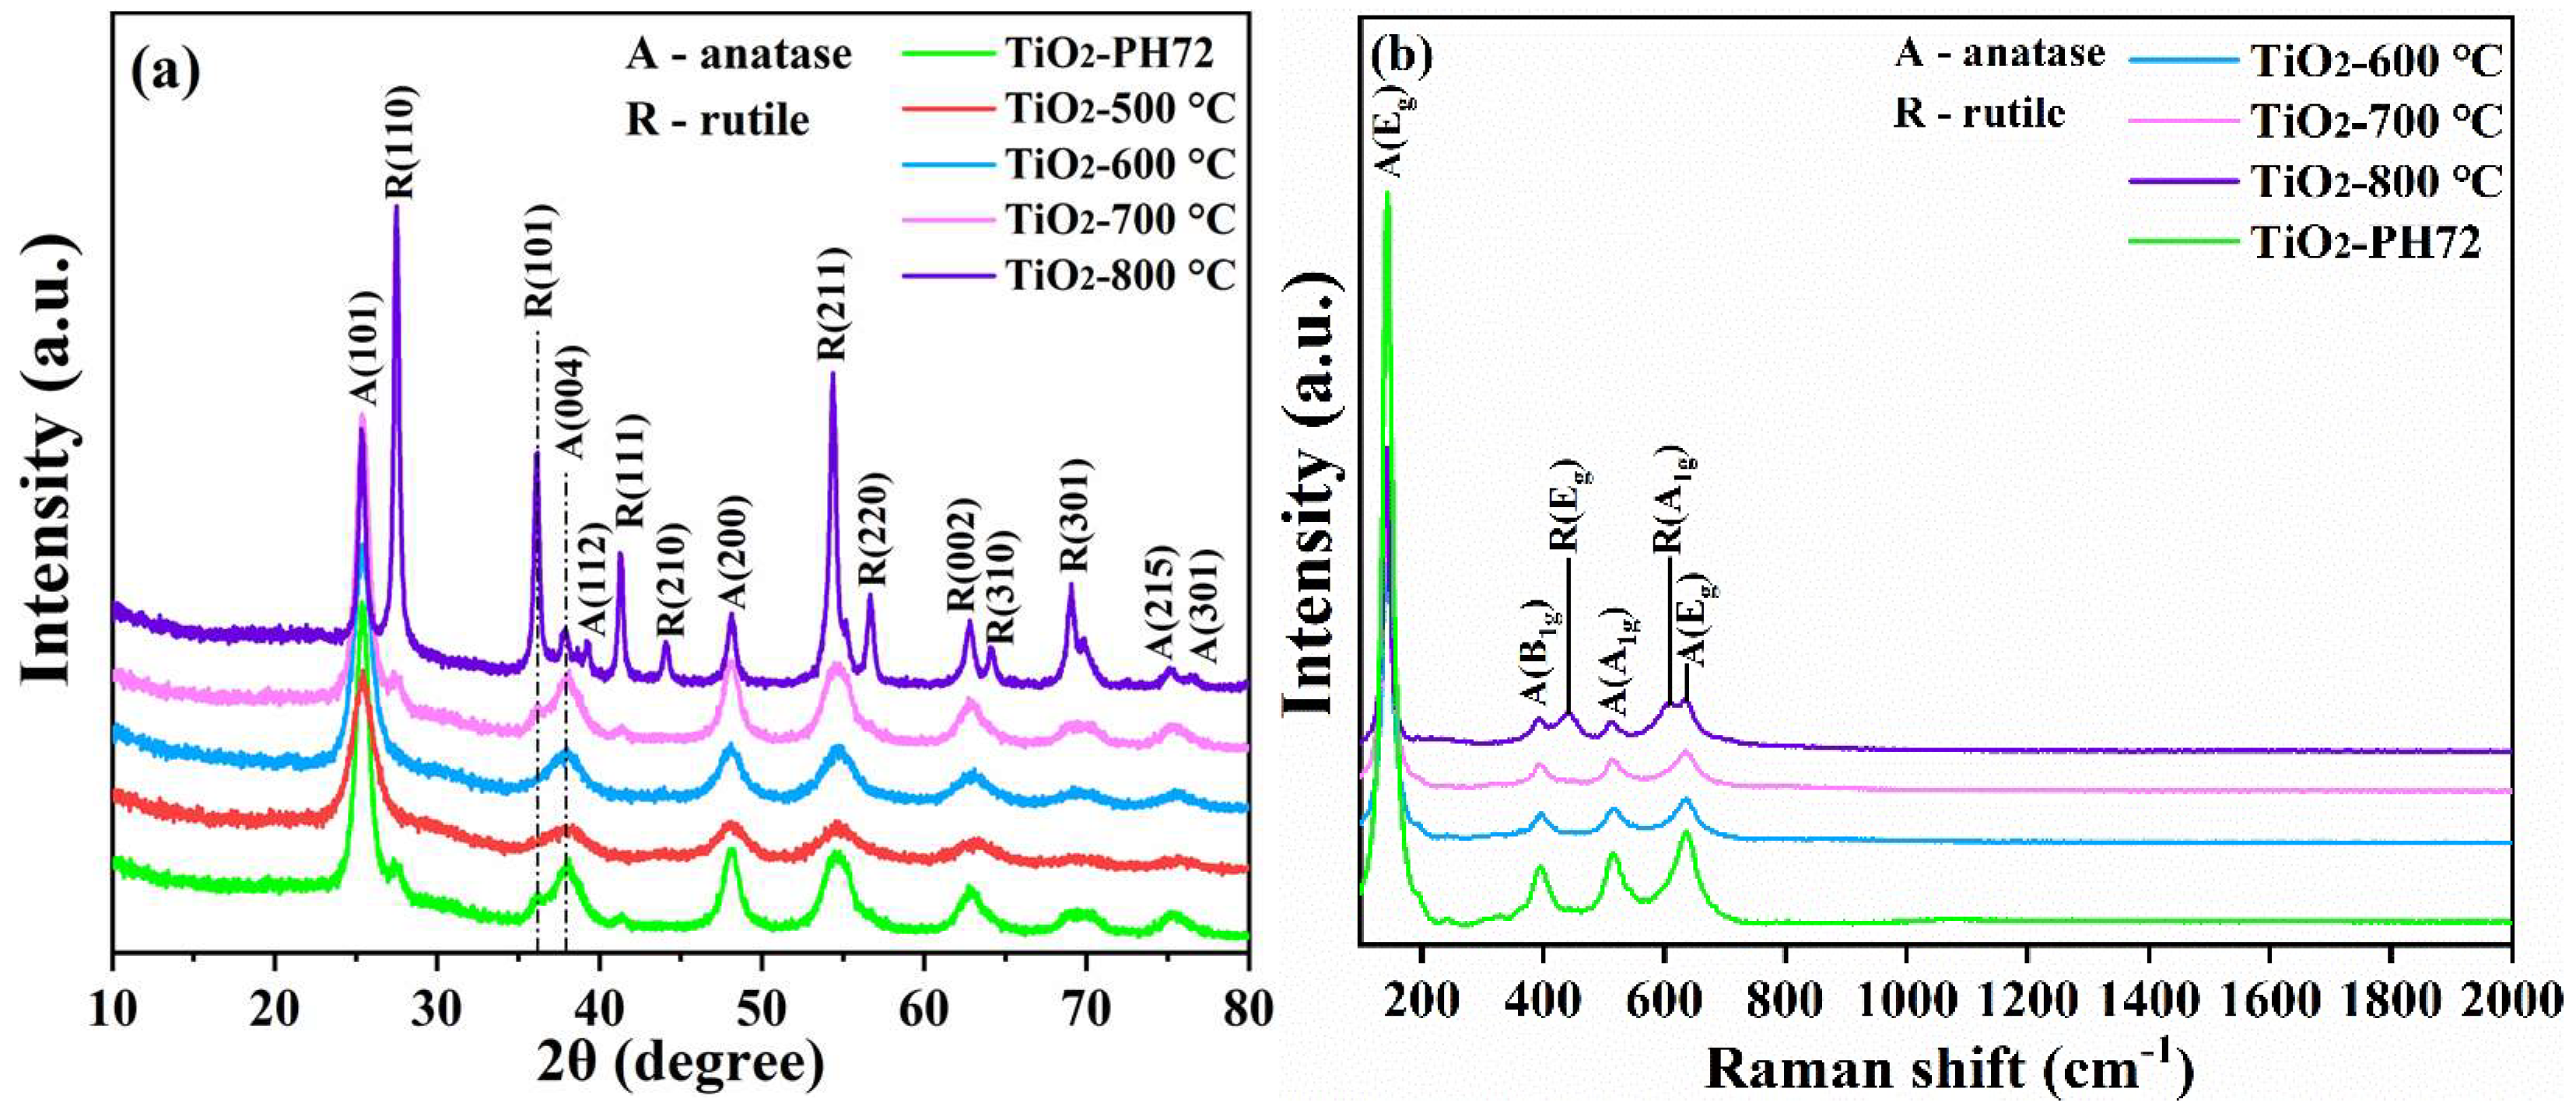
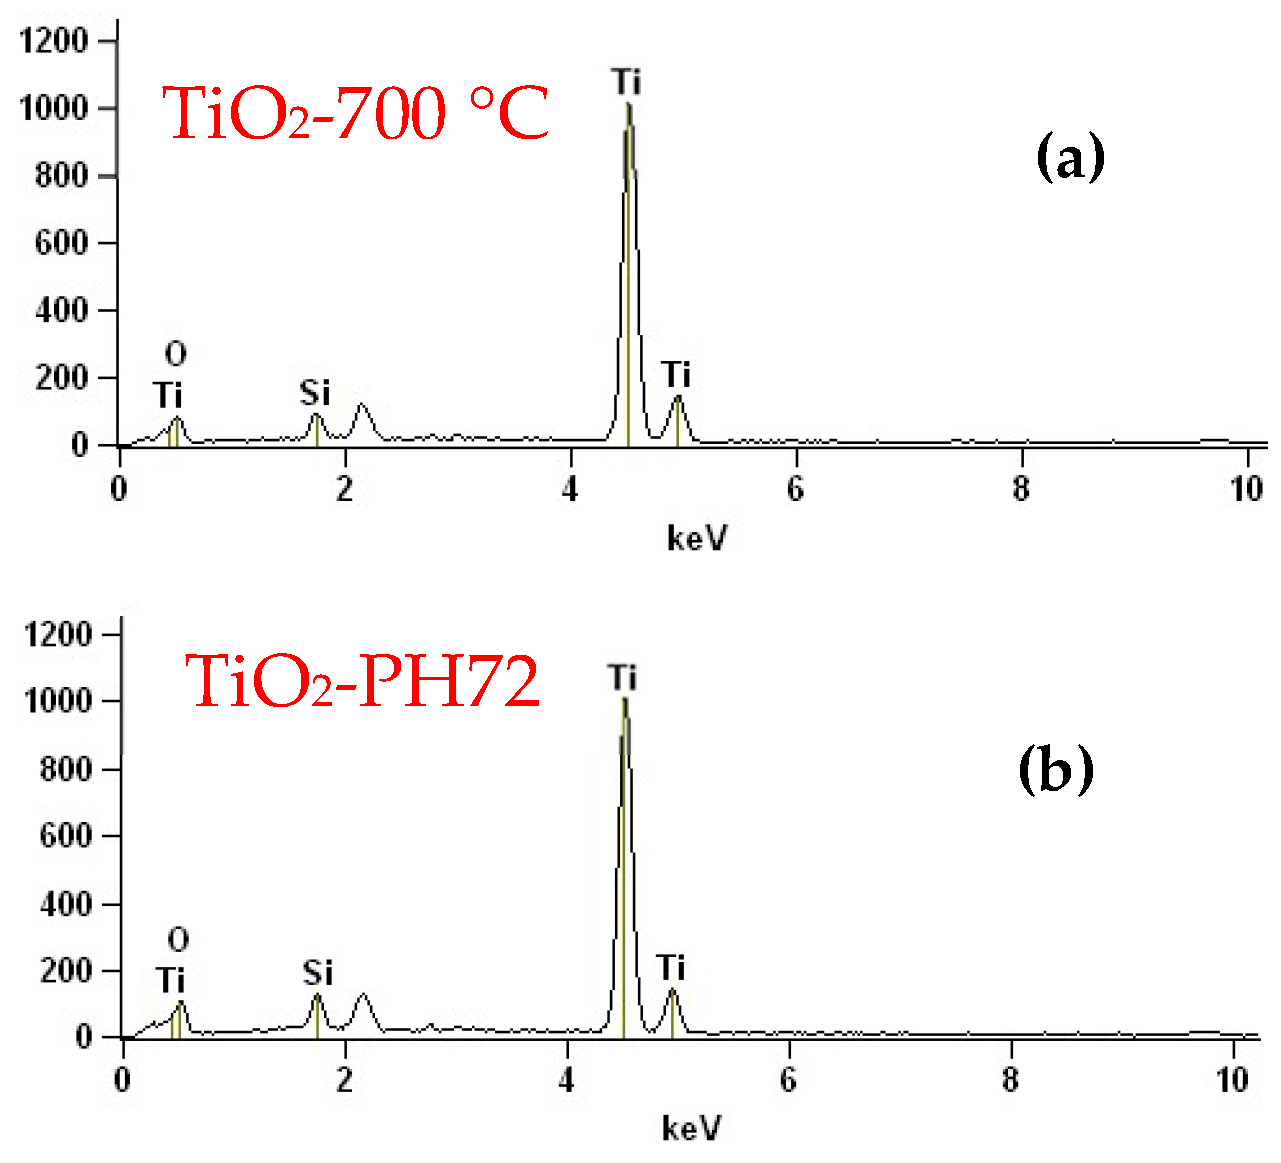
2.1. Fiber Morphology and Crystal Structure

The SEM morphologies of the TiO2 fibers obtained after calcination at different temperatures and plasma treatments are shown in Figure 1. The morphologies of the fibers obtained at 500~800 °C are similar, with dense fiber cross-sections. The main fiber diameters are all between 200 nm and 400 nm, and there are a small number of microfibers (diameter d < 100 nm); this is caused by the instability of the Taylor cones during electrospinning, which is basically consistent with the relevant literature [28]. The fibers calcined at 500 °C and 600 °C (Figure 1a,b) were bent and disorderly, with rough surfaces and cross-sections. However, the fiber surface treated at 700 and 800 °C (Figure 1c,d) is more smooth and more compact. Figure 1e is the SEM image of the TiO2-PH72 sample; it was found that, after calcination at 700 °C and plasma treatment, the fibers are straight and orderly. The plasma treatment is rather complex due to the different types of neutral and charged particles involved in the generation process, but it is very well suited to widely controlling the material properties. In this study, during the plasma treatment process, the activated species of the neutral and ionized particles impinging on the fiber surface is the key parameter, which can be used to modify the surface state, which is mainly due to the plasma–chemical reactions and plasma–surface interactions. The phenomenon of “straight and orderly” is interesting; it should be due to the excitation, electrolysis, and ionization of more and more hydrogen molecules during 720 s of plasma treatment, which causes a high concentration of hydrogen ions to accumulate, leading to the phenomenon that occurs [29].
At the same time, BET testing was performed on the TiO2-700 °C, TiO2-800 °C, and TiO2-PH72 samples (in Figure 2). It was found that the specific surface area of the three samples is not different. From SEM images, it can also be observed that the TiO2-700 °C, TiO2-800 °C, and TiO2-PH72 samples are compact, with relatively smooth surfaces and no pores [30]. Therefore, the specific surface area is not the main factor influencing the photocatalytic performance in this study.
The TEM characterizations of the TiO2-700 °C and TiO2-800 °C fibers are shown in Figure 3 and Figure 4, respectively. It can be observed that the TiO2 fiber surface presents a smooth and dense structure (in Figure 3a and Figure 4a), which is consistent with the observation results of the SEM. Anatase (101) crystal faces with a lattice spacing of 0.35 nm and rutile (110) crystal faces with a lattice spacing of 0.32 nm can be identified on the fiber surface [31]. In many of the TEM images of TiO2-700 °C, only one lattice stripe from rutile is found, which indicates that anatase is the main component of the TiO2-700 °C fiber. However, for the TiO2-800 °C sample, the lattice stripes of rutile are easy to find, which means that a considerable part of anatase has been converted to rutile in the TiO2-800 °C fiber. By calibrating the diffraction pattern of TiO2, it can be proved that the crystal phase at 700 °C (Figure 3) mainly comes from the anatase phase, and a small amount of the rutile phase also exists. However, when the diffraction pattern at 800 °C (Figure 4) was calibrated, a large amount of the rutile phase was found.
From the above SEM and TEM analysis, it is concluded that TiO2 fibers of 200~400 nm with dense morphologies have been produced by the combined method of electrospinning and heat treatment from 500 to 800 °C. Both the anatase and rutile phases have been identified via fiber crystallization, and the phase transformation from anatase to rutile seems to occur at a temperature of 700 °C, with the amount enhanced at 800 °C. Moreover, these two phases are in close contact with each other; the interfacial effect should be helpful in forming the anatase-rutile heterojunction in the photocatalysis of mixed-phase TiO2.
Figure 5a shows the XRD characteristics of those TiO2 fibers obtained after calcination at different temperatures and plasma treatments. The XRD pattern shows that all characteristic peaks belong to the anatase or rutile phase of TiO2, and no peaks of the other phases appear. This indicates that the purity of the TiO2 fiber obtained by this process is relatively high. The characteristic peaks of the calcined fibers were all narrow and high, which means that the fibers crystallized well. The fibers calcined at 500–600 °C are pure anatase phase, and the crystallinity gradually becomes higher with the increase in temperature, which is consistent with the theory [32,33]. The rutile phase begins to appear in the TiO2 fiber after calcination at 700 °C, and most of the anatase changes to rutile when it is held at 800 °C. This implies that the anatase-to-rutile transition temperature of the TiO2 fiber with this morphology is between 700–800 °C. This transition temperature is higher than the 400–600 °C commonly found in other studies. After plasma treatment, only the peaks of the anatase phase and rutile phase were observed, and no peaks of other new phases were produced. Therefore, a short time of plasma modification will not change the phase of the TiO2 fiber.
The formula D = 0.9λ/βcosθ [34] is used to calculate the grain diameter of each sample, where β is the full width at half of the peak maximum (FWHM), λ is the wavelength of the incident X-ray, and θ is the diffraction Angle. The calculated values are shown in Table 1. It can be found that the grain size tends to increase with the increase in calcination temperature, while the gradual transition of the anatase phase to the rutile phase occurs [35]. There is little change in grain size after H2 plasma treatment. At 800 °C, the grain size changes obviously due to the high calcination temperature, where the phase is almost the rutile phase. At the same time, the formula d–2 = (h2+k2)/a2+l2/c2 [36] was used to calculate the lattice constants (a and c) of each sample; the results are also shown in Table 1. It can be found that there were no crystal lattice changes from the different calcination temperatures [37].
Figure 5b shows the Raman spectra of those fibers treated with different calcination temperatures [38]. The Raman characteristic spectra of the TiO2 anatase phase are composed of Eg, B1g, and A1g peaks [39]. The characteristic peak at 142.6 cm−1 is attributed to the Eg peak of anatase, and the characteristic peak at 394.2 cm−1 is attributed to the B1g peak of anatase. The anatase A1g peak is located at 513.4 cm−1, and the second Eg peak is located at 635.6 cm−1. There are two unique characteristic peaks at 444.3 cm−1 and 609.1cm−1, which are attributed to the Eg peak and A1g peak of the rutile phase, respectively. This shows that anatase–rutile transition does occur in the TiO2 fiber between 700 °C and 800 °C. There is an obvious characteristic peak of the rutile phase when the sample was calcined at 800 °C, which is not detected at 700 °C due to the low content of the rutile phase, which is consistent with the results of the XRD and TEM characterization.

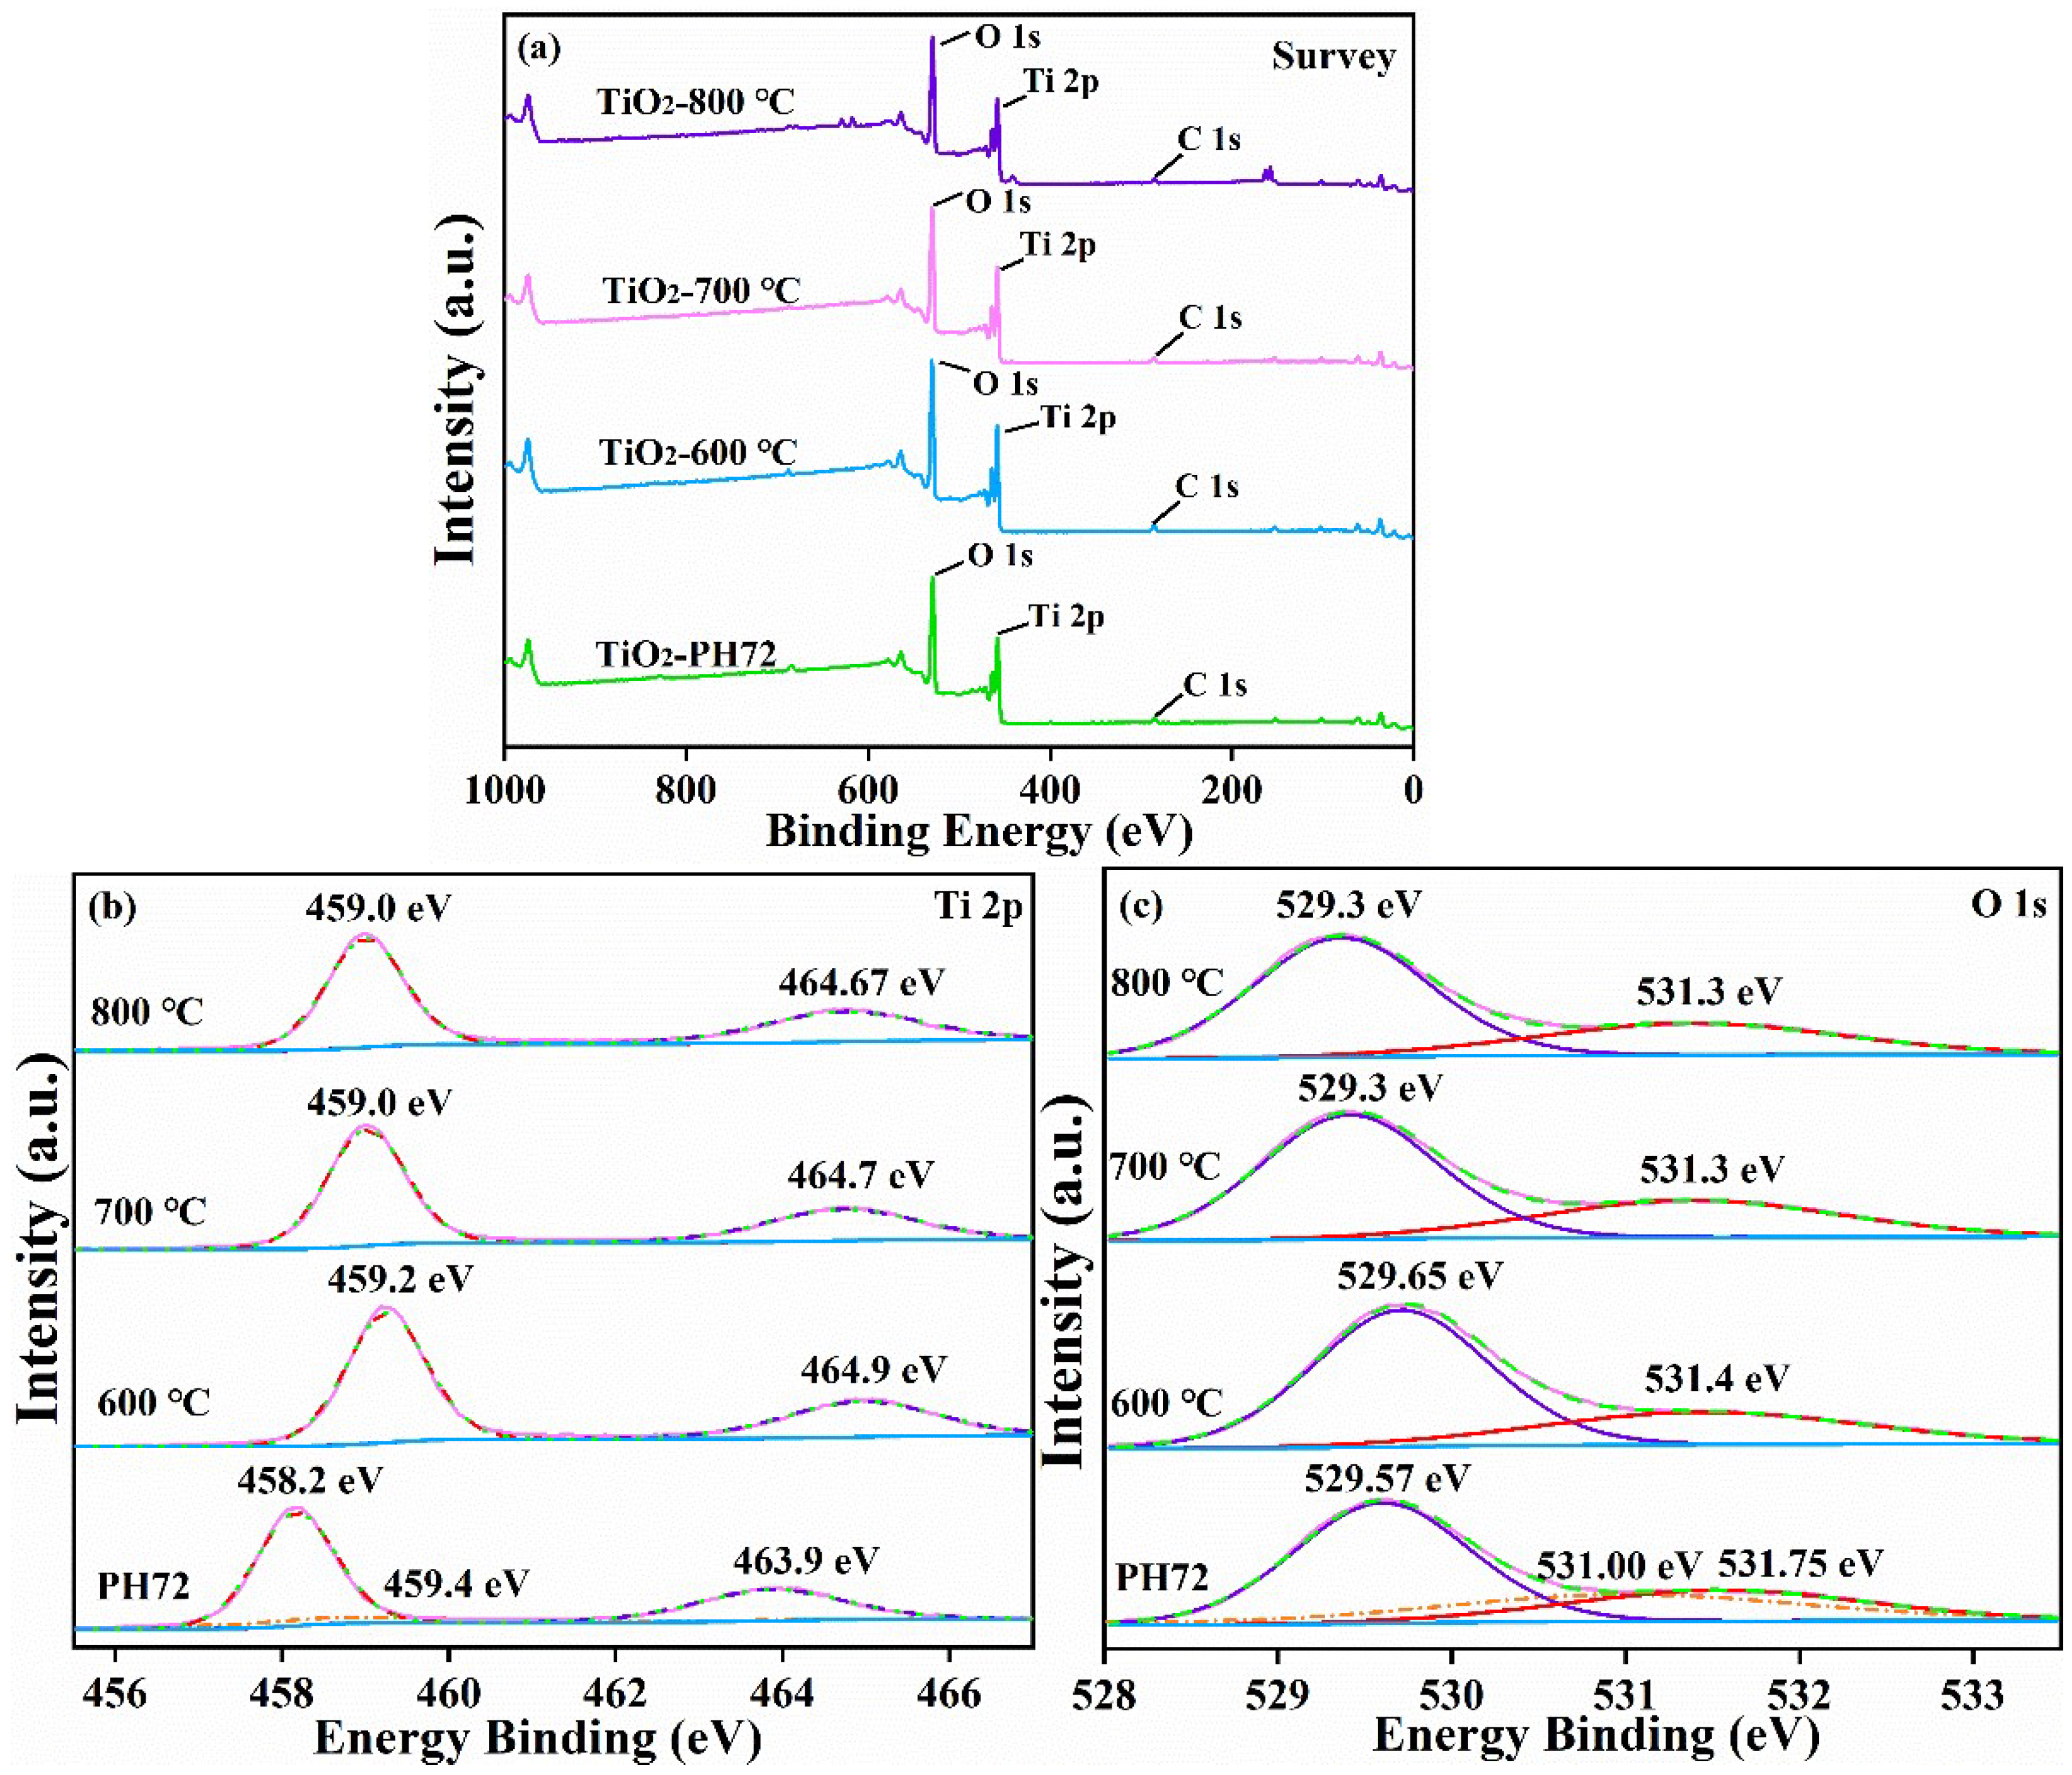
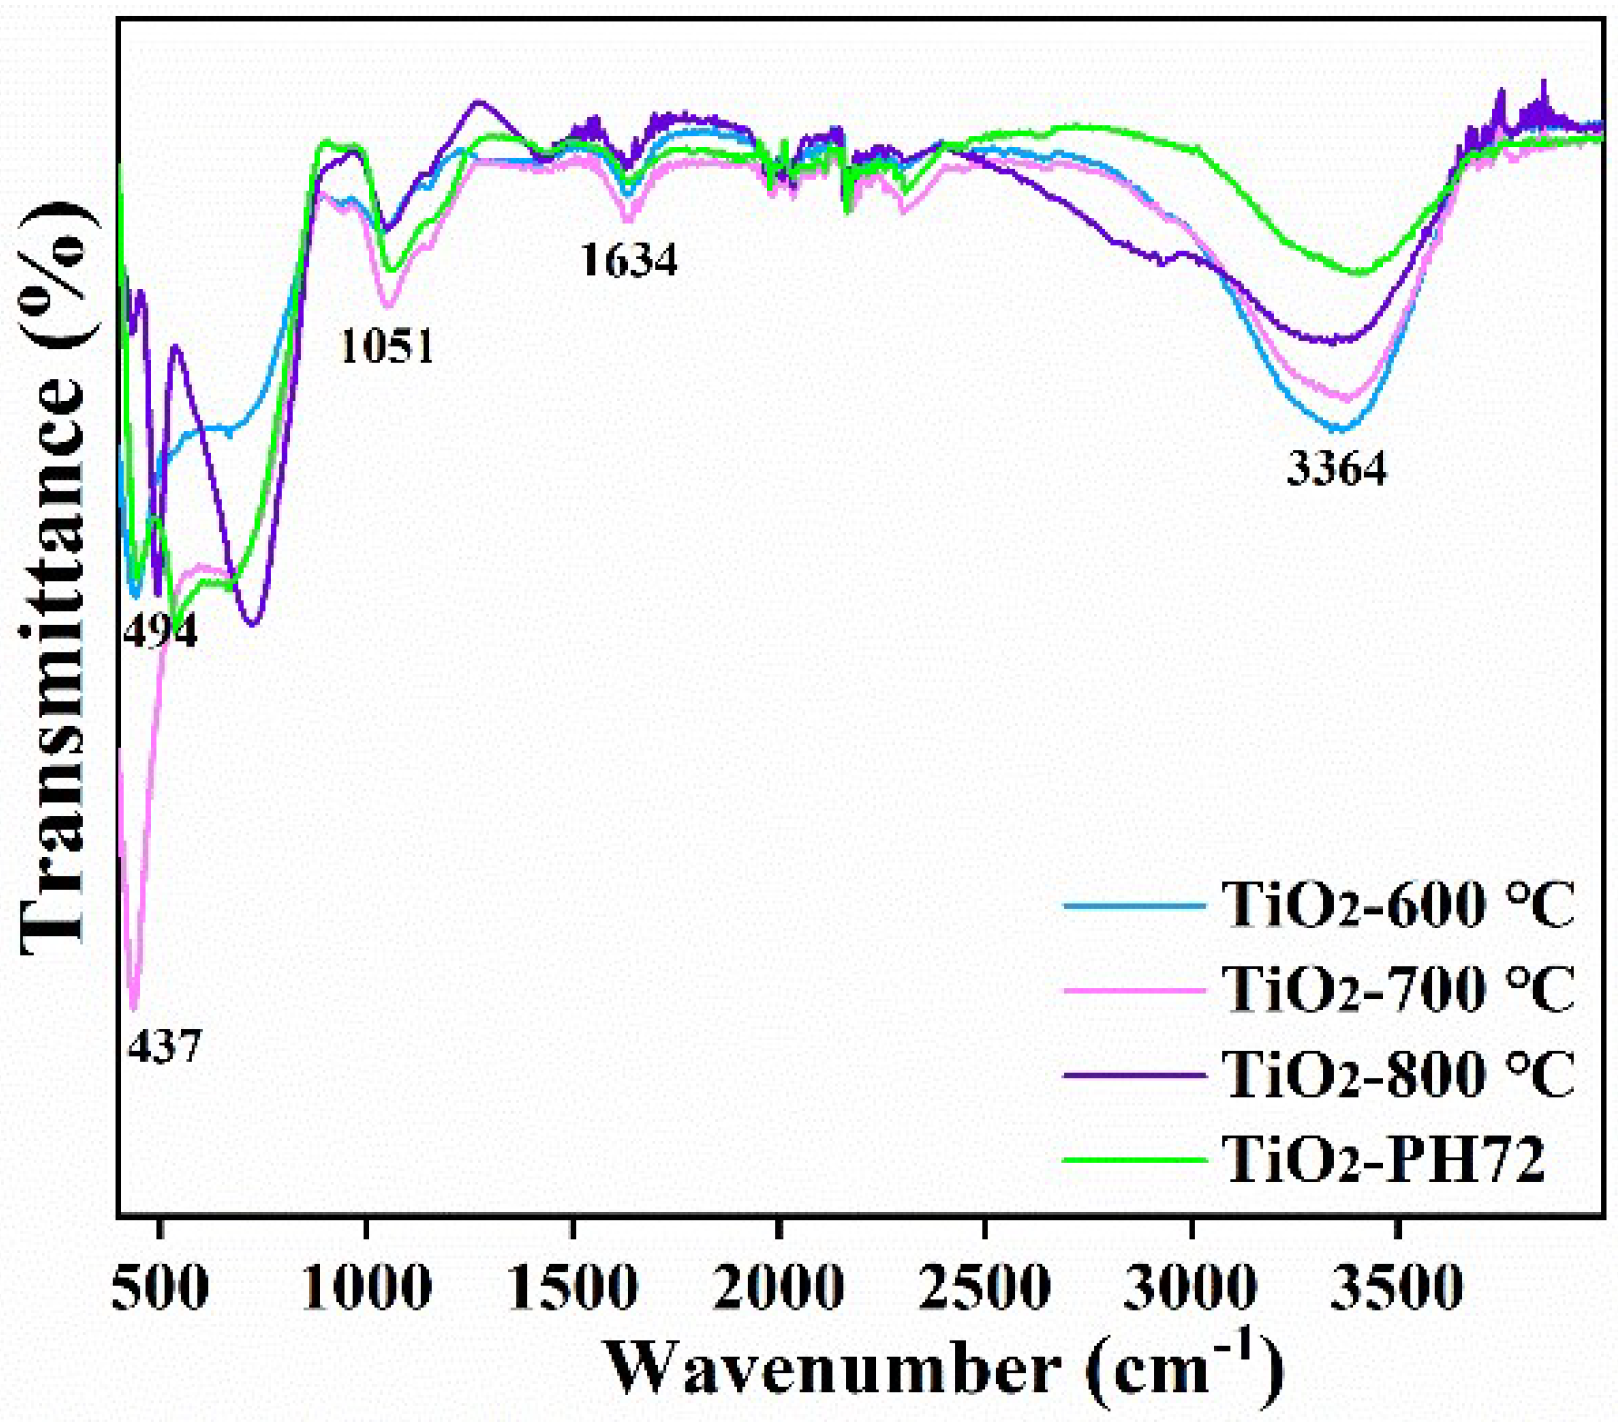
2.2. Chemical Structure

The fiber XPS test results for TiO2-600 °C, TiO2-700 °C, TiO2-800 °C, and TiO2-PH72 are shown in Figure 6. The XRD results, after calcination, show that the crystal structure of the TiO2 fiber is undergoing a phase transition. However, the binding energy of Ti does not change much in the XPS test results. This is attributed to the error in the charge correction process, and the Ti atom is located in the center of the TiO2 lattice, which is not greatly affected by the phase transition process. The O atom near 532 eV is allocated to the H2O in the sample, so the binding energy hardly changes [40]. However, the O 1s peak at 529 eV is due to the junction of the TiO2 lattice, and the peak position shows a trend of gradually decreasing; this should be attributed to the difference between rutile and anatase, mainly for the lattice arrangement and connection mode, which are different. Moreover, for the TiO2-PH72 sample, the XPS map of Ti 2p (in Figure 6b) shows that the binding energy of the Ti atoms was significantly reduced. This is due to the O defect, which reduces the O coordination number of some of the Ti atoms. Moreover, a peak appeared at 495.4 eV after plasma treatment; this is due to the reduction of Ti4+ to Ti3+. In general, Ti3+ and oxygen vacancies exist at the same time, so this is another example of the formation of oxygen vacancies [41]. Similarly, O 1s (Figure 6c) also shows a new peak located at 531.75 eV, which is also due to oxygen defects after plasma treatment. This small peak is attributed to the absence of oxygen atoms to form hydroxyl groups on the surface. The peak binding energy, which was originally located at 531.00 eV, and the related position decreased slightly due to the loss of the oxygen atom [42].
Figure 7 shows the EDX results of those fibers calcined at 700 °C and treated with H2 plasma for 720 s. It was found that the main elements in the samples were Ti and O, which is consistent with the XPS results. The small amount of Si in the samples may be caused by contamination during the measurement process. The element concentrations were further analyzed by using the XPS measurement. Table 2 shows the elemental content of each sample, which is fitted from the XPS spectra. The main elements in the sample are Ti and O, but the sum of the content of the two elements is less than 100%, which was caused by the introduction of C and other elements during the test. The content of the oxygen atoms was observed to decrease after plasma treatment. This also proves the previous hypothesis of oxygen vacancy formation [43].
We also carried out an auxiliary analysis and determined the chemical structure of the TiO2 fibers via FTIR [44,45]. Figure 8 shows the FTIR spectra of the four samples (TiO2-600 °C, TiO2-700 °C, TiO2-800 °C, and TiO2-PH72). The characteristic peaks at 437 cm−1 and 494 cm−1 are attributed to the anatase phase [46] and the rutile phase, respectively. Due to the low rutile content in TiO2-700 °C, the characteristic peak at 494 cm−1 is very low. The anatase peak strength in the TiO2-PH72 fiber is significantly reduced, which indicates that its Ti-O bond was damaged after plasma treatment. The characteristic peak at 3364 cm−1 is attributed to the H2O contained in the sample. With an increase in calcination temperature, the characteristic peak of H2O attached to the sample gradually decreased [47]. The wide peak centered on the characteristic peak at 1051 cm−1 is due to the vibration of the anatase Ti-OH bond [48], and the peak located at 1634 cm−1 is attributed to the vibration of polar hydroxy-OH [49]. Table 3 shows the wavelengths in the FT-IR spectrum and the vibrational bonds corresponding to them.
Therefore, from the chemical analysis via XPS and FTIR, it can be found that the chemical state of the TiO2 fiber surface has been modified by calcination and plasma treatment. The increase in calcination temperature from 600 to 800 °C has led to a decrease in the absorption of H2O on the fiber surface due to the improvement of the density. Only Ti, O, and a small amount of C can be identified in the XPS survey spectra, so no impurity was introduced during the fabrication process. The O defect has been generated by the H2 plasma treatment; this may also have good effects on photocatalytic performance in addition to the building of anatase–rutile heterojunction.

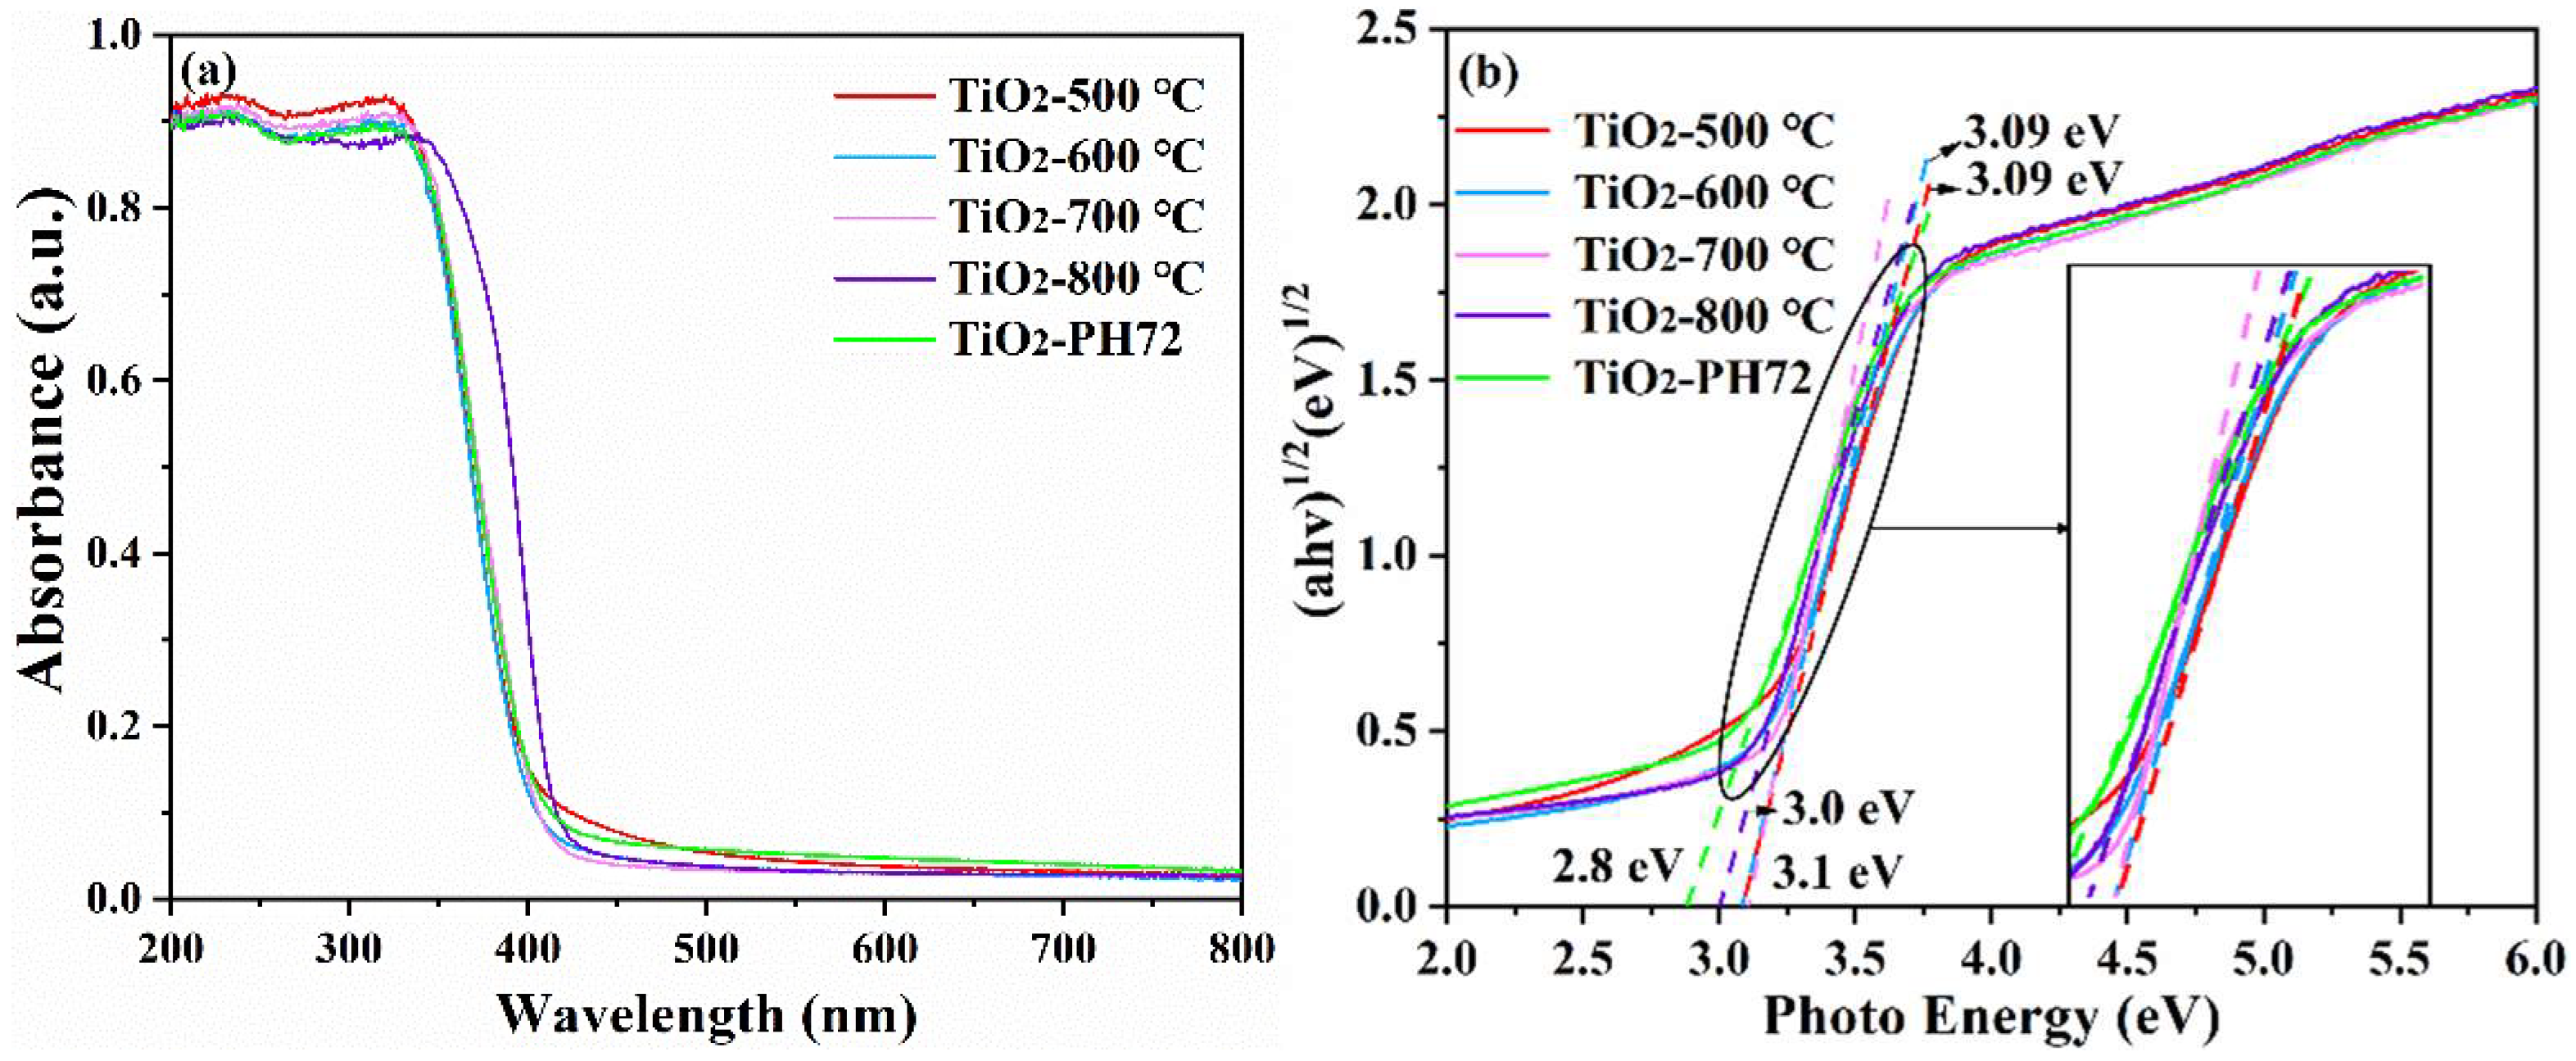
2.3. Calculation of UV-Vis Spectra and Bandgaps

The absorption capacity of the TiO2-500 °C, TiO2-600 °C, TiO2-700 °C, TiO2-800 °C, and TiO2-PH72 fibers under ultraviolet and visible light was tested by UV-vis diffuse reflectance spectroscopy (in Figure 9). Compared with the TiO2-600 °C fiber, the absorption wavelength of the TiO2-500 °C fiber has an obvious red shift; this because the organic material in it has not completely decomposed, affecting the absorption of the visible light wavelength. The optical wavelength absorption curves of the TiO2-600 °C and TiO2-700 °C fibers are almost consistent, which is basically consistent with the optical wavelength absorption curves of common anatase.
The TiO2-800 °C fiber has the advantage of light absorption at 350–430 nm, which is attributed to the heterojunction formed between the anatase phase and the rutile phase. Oxygen vacancies are generated after plasma modification, which makes the TiO2-PH72 fiber advantageous over other fibers within an absorption light above 430 nm [50]. The surface structure of the fiber changed, and the optical absorption capacity of the fiber improved to some extent.
The following reference formula is often used to calculate the optical bandgap of photocatalysts:(ahν)1/n = C(hν − Eg); TiO2 is an indirect bandgap semiconductor with the index n = 2. The calculated band gap value is shown in Figure 9b [51,52]. For the TiO2-500 °C, TiO2-600 °C, and TiO2-700 °C samples, the band gap value is roughly the same, which is around 3.1 eV since they are basically within the anatase phase. However, when the calcination temperature is higher than 700 °C, a large amount of the anatase phase will change to the rutile phase, which leads to a slight decrease in the band gap [53]. Furthermore, the fiber band gap value of TiO2-PH72 was lower (~2.8 eV); this may be caused by the O defect formed during the plasma treatment process.

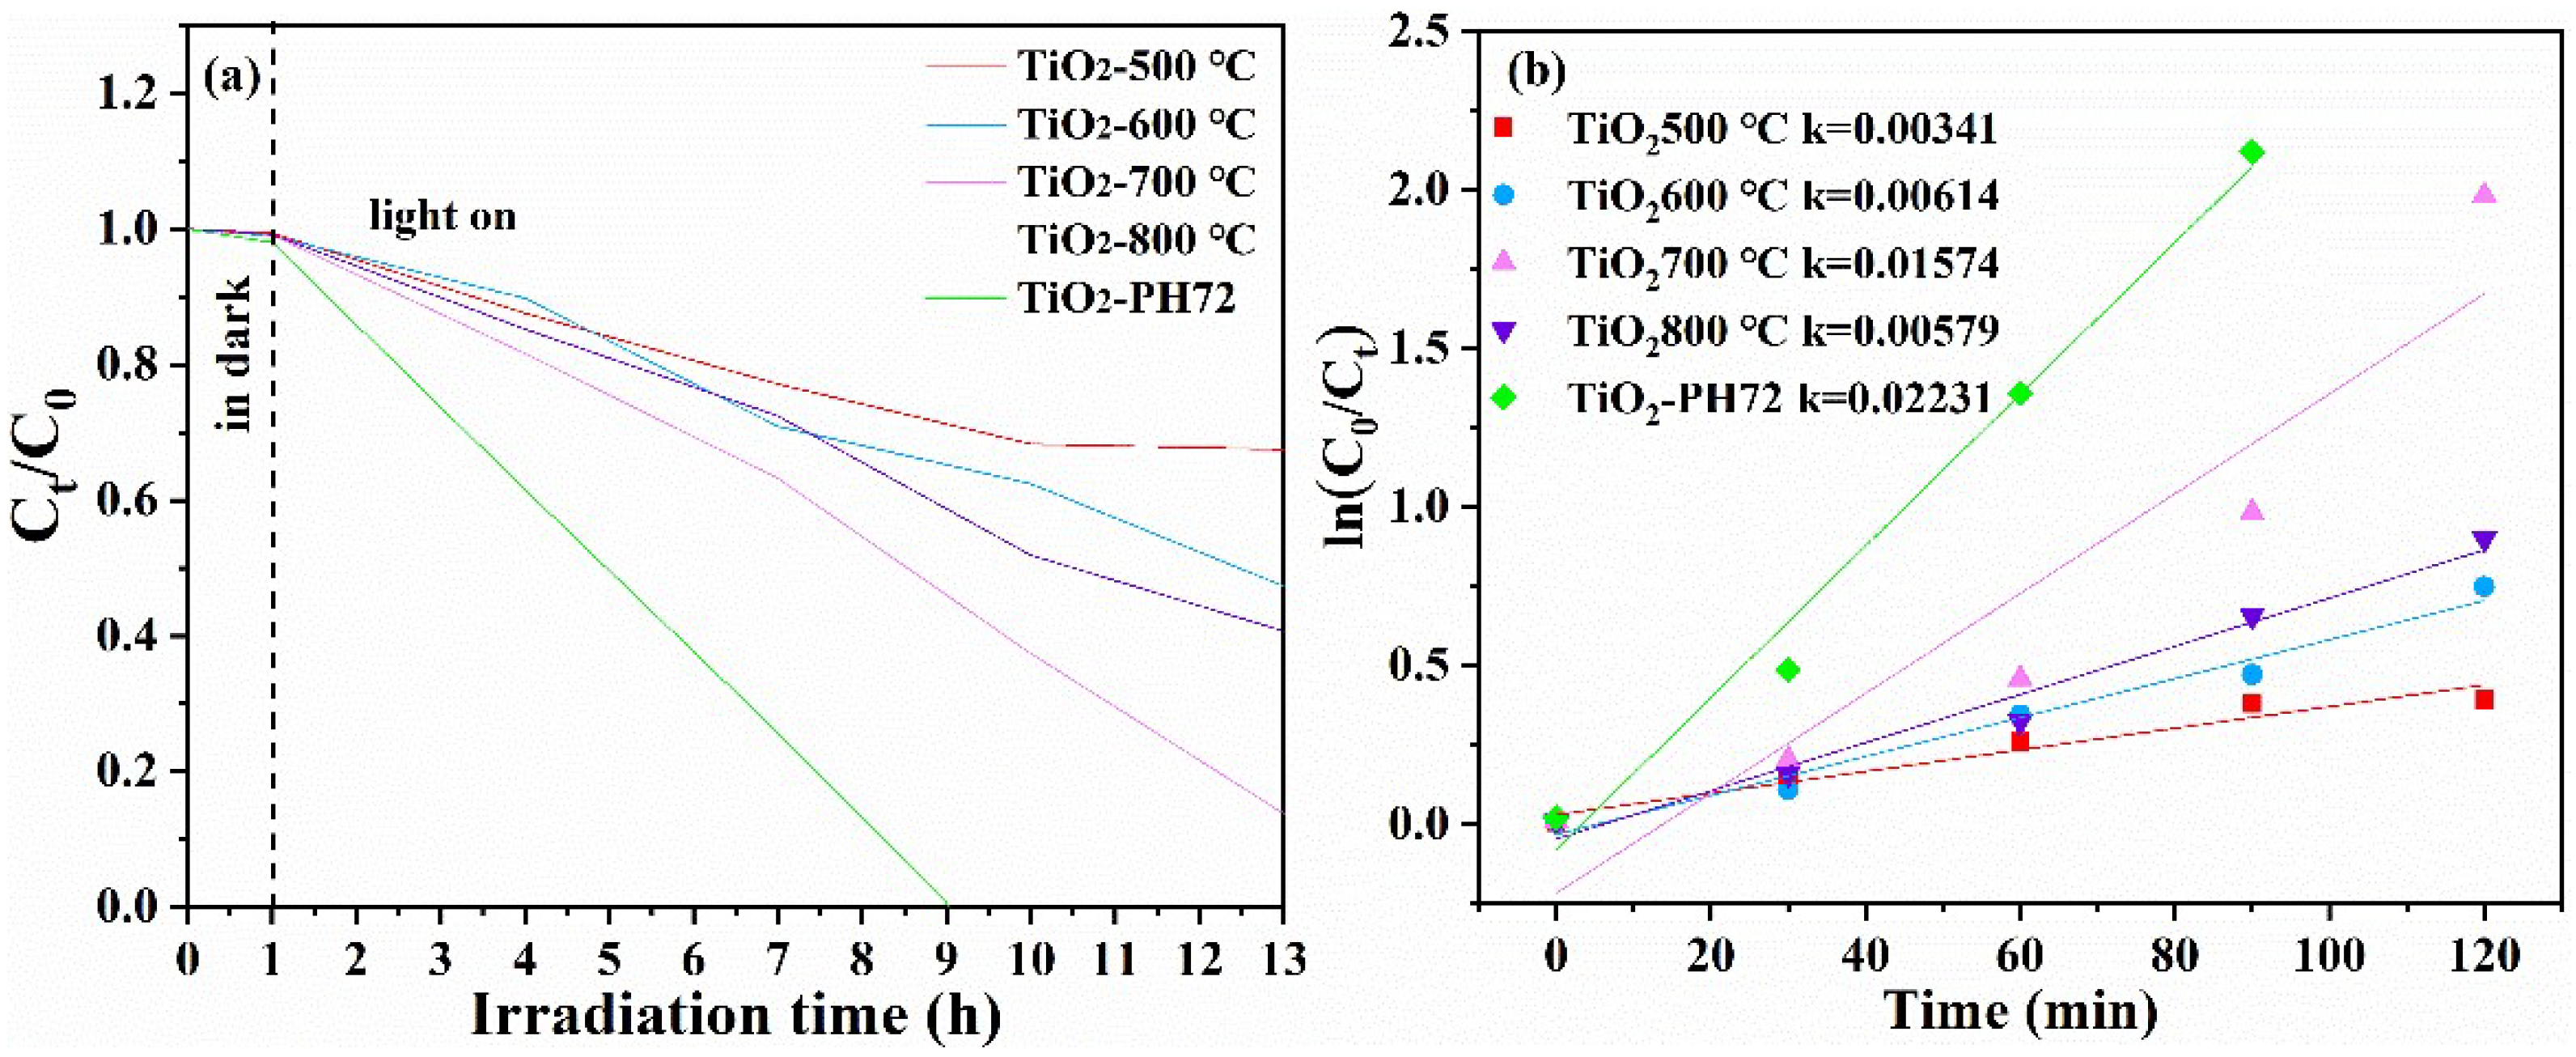
2.4. Photocatalytic Properties

The degradation of the methyl orange solution by the fiber obtained after different calcination temperature and H2 plasma treatment was measured via a photocatalytic reaction instrument so as to simulate the degradation ability of organic sewage. The degradation ability of the TiO2 fiber photocatalyst was characterized by the residual rate of methyl orange. A special UV lamp (wavelength λ < 500 nm) was used in the experiment. The residual rate of methyl orange after photocatalytic degradation is shown in Figure 10a [54]. The degradation rate constant (k) was determined using the equation ln(C0/Ct) = kt (Figure 10b) [55], with C0 and Ct representing the concentration of the methyl orange solution before and after illumination, respectively. It is obvious that the degradation rate of the calcined TiO2 fiber reaches the highest activity at 700 °C; then, the degradation rate can be further improved after surface plasma treatment, which leads to the degradation rate of the TiO2-PH72 fiber being about 30% higher than that of the TiO2-700 °C fiber. It can be found that the photocatalytic performance of the TiO2 fiber modified by the H2 plasma process has obvious advantages. The presence of oxygen vacancy was confirmed by EPR testing (in Figure 11). The results show that, compared with the TiO2-700 °C fiber, oxygen vacancies in the plasma-treated fiber increased significantly. As the oxygen vacancies are created, the number of trapped electrons increases. This results in an accelerated separation of photogenerated electrons and holes. At the same time, oxygen vacancy as an active site can absorb O2 into O2, which is the direct reason for the increase in photocatalytic efficiency [56]. The photocatalytic performance of the prepared fibers in this work is compared with the different forms of other authors, as shown in Table 4. It can be seen that the prepared fibers have a better degradation efficiency relative to the recent literature review on TiO2 photocatalysts.
Based on the above tests and characterizations, the mechanism of photocatalysis was predicted (in Figure 12). Figure 12a is the prediction diagram of the mechanism of heterojunction sewage treatment before plasma treatment after both anatase and rutile are excited under UV light. Due to the different bands between anatase and rutile, e- migrates from the CB of the anatase phase to the CB of the rutile phase, as does h+ from the rutile phase of VB to the anatase VB [63]. The generation of the heterojunction structure accelerates the separation efficiency of the photogenerated electrons and holes and reduces the binding ability of photogenerated electrons and holes. This also improves the performance of photocatalysis [64]. Oxygen vacancies were created after treatment with the H2 plasma. According to the test results and some references [65], a TiO2 band structure containing oxygen vacancies was predicted (Figure 12b). It can be seen that there is a vacancy between the valence band and the conduction band. In the photocatalytic test, the new vacancy level is also involved in the light excitation process. This also explains the reason for the improvement in photocatalytic efficiency after plasma treatment.

3. Experimental

3.1. Materials

Anhydrous ethanol (C2H6O), acetic acid (CH3COOH), cetyl trimethyl ammonium bromide (C16H33(CH3)3NBr) (CTAB), polyvinylpyrrolidone (PVP), tetrabyltyl titanate (C16H36O4Ti) (TBOT), methyl orange (C14H14N3NaO3S) were purchased from CNPC Stock Reagent Chemical Group Co. LTD (Beijing, China). The reagents can be used directly without handling. Deionized water was prepared via an economic pure-water mechanism and was used for cleaning the samples in the experiment.

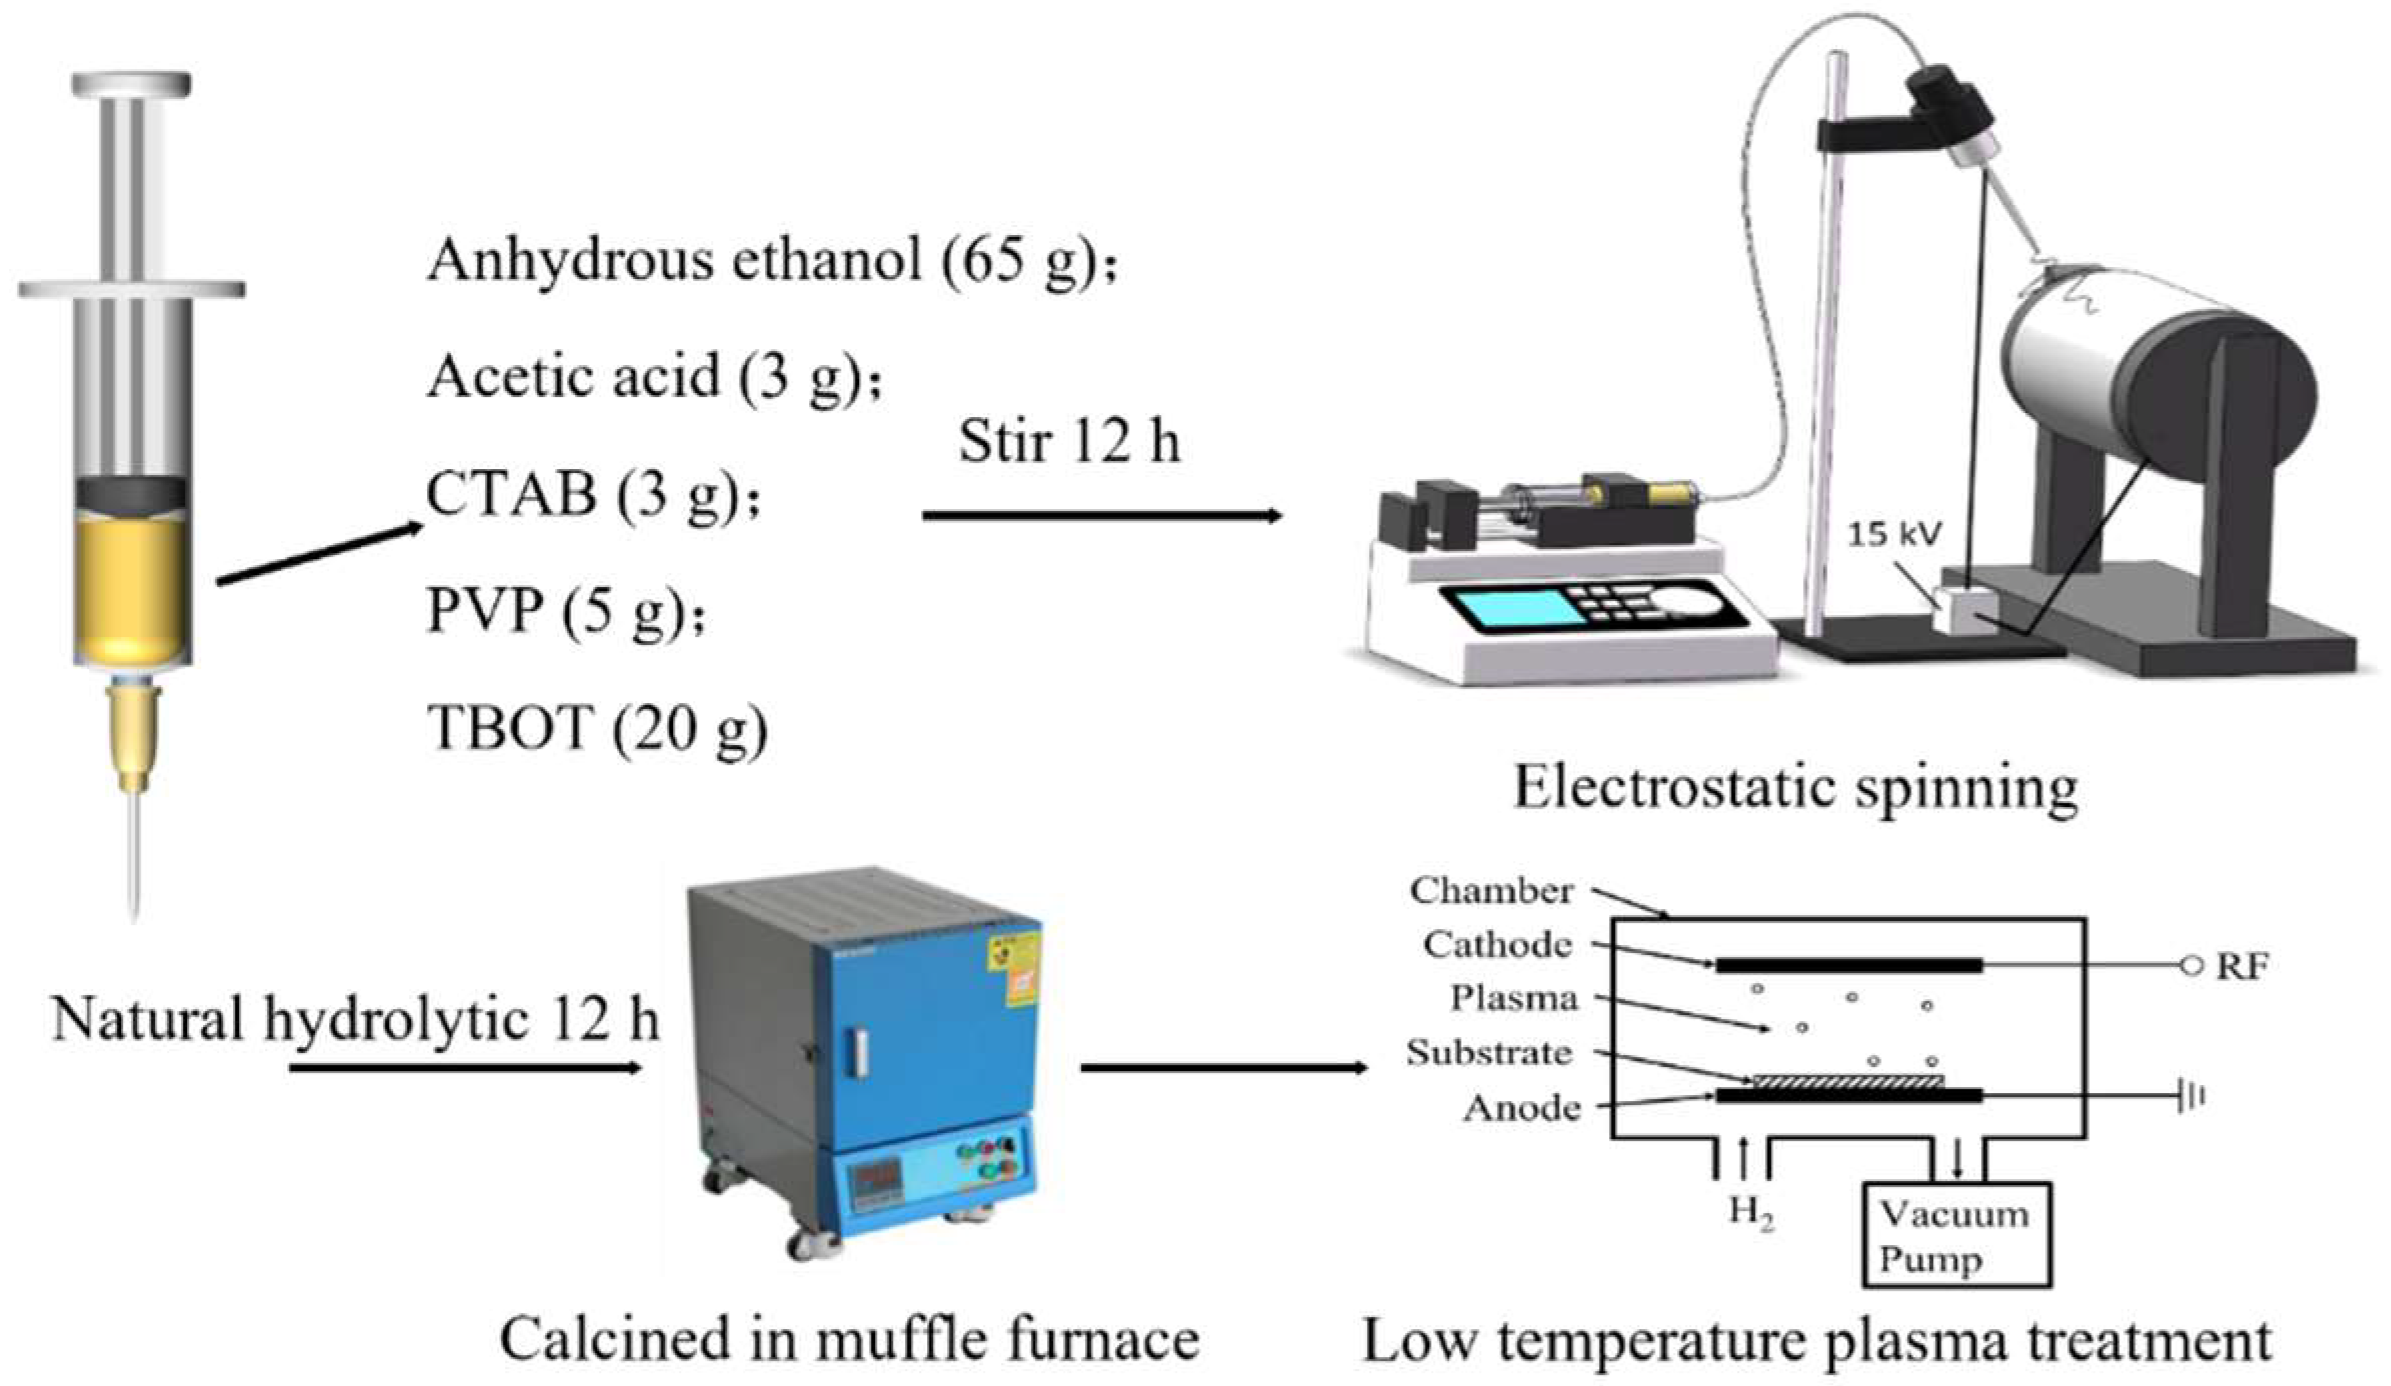
3.2. Electrospinning and Heat Treatment of TiO2 Fibers

In this research, electrospinning technology was used to prepare the Ti containing the precursor fiber, and then the crystal structure of the fiber was regulated by heat treatment processes. The first step was the preparation of the spinning solution by adding 3 g acetic acid and 3 g CTAB to a conical flask containing 65 g absolute ethanol and stirring for 10 min. Then, PVP was put in the solution, which was stirred vigorously to prevent PVP clumping, for about 30 min until PVP was completely dissolved, and finally, 20 g of TBOT was added and stirred for 12 h to thoroughly mix the solute. The second step was spinning and forming the fiber; the spinning solution was injected into the extrusion pump of the electrospinning machine for extrusion at a rate of 1 mL/h. An 18# spinning needle (with an outer diameter of 1.2 mm) was used, and a high voltage direct current of 15 KV was applied between the needle and the receiving plate. A continuous distance of 15 cm was maintained between the needle and the receiving plate to ensure uniform electric field intensity. The needle was mounted on a numerical control device and spun continuously for 9 h by reciprocating transverse motion at a rate of 5 cm/s. A mixed fiber mat consisting of PVP and Ti(OH)3 was obtained. The third step was the heat treatment of the fiber; the precursor fibers from electrospinning were transferred to the Muffle furnace and heated to 500 °C, 600 °C, 700 °C, and 800 °C at the rate of 5 °C/min, respectively. The fibers were held for 2 h and then air-cooled to room temperature with the furnace. The obtained TiO2 fibers were labeled as TiO2-500 °C, TiO2-600 °C, TiO2-700 °C, and TiO2-800 °C, respectively. The specific process is shown in Figure 13.

3.3. Low Temperature Plasma Processing Technology

In order to further improve the photocatalytic degradation efficiency of the TiO2 fiber photocatalyst, RF discharge plasma was used to modify the TiO2-700 °C fiber. The 1.2 mmol TiO2-700 °C fiber was placed in the treatment chamber of the RF plasma equipment, which was pumped to a vacuum environment (<0.1 Pa) and then fed H2 to stabilize the pressure in the treatment chamber at 25 Pa. An RF power of 80 W was used to excite the plasma for 720 s. After finishing the treatment, we turned off the RF power quickly, interrupting the vacuum, opening the air valve, and removing the sample. The sample was labeled as TiO2-PH72.

3.4. Characterization Methods

The surface morphologies of the fiber samples were observed by S-4800 type II field emission scanning electron microscope (SEM) (Hitachi Ltd., Tokyo, Japan). Advanced polycrystalline X-ray diffraction (Bruker AXS, Germany) was used to inspect the crystal structure of the fiber at 800 °C. A copper target (λ = 0.154056 nm) was used for detection, with a voltage of 40 KV and a current of 40 mA. The scanning range was θ = 5°~40°, that is, (2θ = 10°~80°), and the scanning speed was 5°/min. A Cary 5000 UV-visible-near-infrared absorption spectrometer (Varian, USA) was used. The optical absorption capacity of the prepared photocatalyst was tested in the light wavelength range of 200–800 nm, where the background absorption curve was obtained by BaSO4 test. Fourier transform infrared spectroscopy (FTIR) was performed using a Cary 610/670 microscopic infrared spectrometer (Varian, USA) with an Attenuated Total Reflection (ATR) test assembly. The prepared photocatalyst was tested in the wavelength range of 450–4000 cm−1. Raman spectroscopy was performed using an In Via laser confocal Raman spectrometer (Renishaw, UK). The photocatalyst was tested and analyzed in the wavelength range of 100–2000 cm−1. TecnaiG2F30 S-TWIN field emission transmission electron microscope HRTEM was used to observe and analyze the detailed structure. After the photocatalyst fiber was broken and ultrasonically dispersed with absolute ethanol, it was searched for with copper mesh and observed at 200 KV. Changes in oxygen vacancies were characterized using an A300-10/12 paramagnetic resonance spectrometer (EPR) (Bruker, Germany).

3.5. Photocatalytic Performance Test

In this study, a 25 ppm methyl orange indicator was used as the simulated pollutant in dye wastewater. The residual amount of methyl orange was determined by measuring the absorption ability of residual methyl orange at 464 nm wavelength light. In the photocatalytic performance test, 0.02 g of the photocatalyst was added to the photocatalytic reactor, and 100 mL of the MO solution at a concentration of 25 ppm was added to obtain the mixed suspension. The suspension was placed in the dark, and the magnetic force of the device was turned on for 0.5 h. Then the suspension was irradiated with a 250 W xenon lamp to simulate the visible light irradiation environment. In the simulation of the visible light environment, the temperature of the suspension was maintained at about 25 °C through an external cooling water pipe. The residual concentration of methyl orange was estimated by measuring the absorbance of the methyl orange solution at the maximum absorption wavelength (464 nm) using a UV-vis spectrophotometer. The formula Ct/C0 was used to calculate the residual concentration of the methyl orange. Where Ct represents the absorbance of methyl orange at the measurement time, and C0 represents the original absorbance of methyl orange before irradiation. Ct/C0 was used to represent the degradation efficiency of the photocatalyst and to quantify its photocatalytic performance.

4. Conclusions

In this research, the calcination and plasma treatment effect on the nanostructures and photocatalytic efficiency of electrospun TiO2 fibers were studied. All the fibers with a diameter of 200~400 nm exhibited a smooth surface and dense morphologies, which were generated by the combined method of electrospinning and heat treatment from 500 to 800 °C. The phase transformation from anatase to rutile starts to occur at the temperature of 700 °C, and an anatase–rutile heterojunction was formed due to the interfacial effect of mixed-phase TiO2. Plasma treatment has no influence over whole-fiber crystallization but generates some chemical state changes on the TiO2 fiber’s surface, where the oxygen vacancies are produced; this leads to an improved optical absorption capacity and lower bandgap value. For the photocatalytic performance, the degradation rate can be obviously enhanced by increasing the calcination temperature up to 700 °C, which is about 2.5–4.5 times that of the other heat-treated fibers. Moreover, photocatalytic efficiency can be further improved after surface plasma treatment since oxygen vacancies are created as the active sites. Finally, the photocatalytic mechanism, which combines the anatase-rutile heterojunction and the effect of oxygen vacancies, was built. This method has wide application prospects in the field of material modification and provides another direction for photocatalytic materials with better degradation abilities.

Author Contributions

Writing—original draft preparation, D.L., K.X., and Z.N.; funding acquisition, D.L.; writing—review and editing, D.L. and C.Z.; supervision, D.L. All authors have read and agreed to the published version of the manuscript.

Funding

This research was funded by the National Natural Science Foundation of China [51602279 and 32072785], Qinglan Project of Jiangsu Province of China [2020], JiangSu Province Scientific and Technological Project [BZ2022043].

Data Availability Statement

Not applicable.

Conflicts of Interest

The authors declare no conflict of interest.

References

  1. Feng, J.; Zhang, T.; Sun, J.; Zhu, J.; Yan, W.; Tian, S.; Xiong, Y. Improvement of sewage sludge dewatering by piezoelectric effect driven directly with pressure from pressure filtration: Towards understanding piezo-dewatering mechanism. Water Res. 2022, 209, 117922. [Google Scholar] [CrossRef] [PubMed]
  2. Coronel, S.; Endara, D.; Lozada, A.B.; Perugachi, L.E.M.; Torre, E. Photocatalytic Study of Cyanide Oxidation Using Titanium Dioxide (TiO2)-Activated Carbon Composites in a Continuous Flow Photo-Reactor. Catalysts 2021, 11, 924. [Google Scholar] [CrossRef]
  3. Nguela, C.B.D.; Manga, N.H.; Marchal, C.; Abega, A.V.; Nsami, N.J.; Robert, D. Effect of Biogenic Silica Behavior in the Incorporation of Mesoporous Anatase TiO2 for Excellent Photocatalytic Mineralization of Sodium Diclofenac. Catalysts 2022, 12, 1001. [Google Scholar] [CrossRef]
  4. Nachimuthu, S.; Thangavel, S.; Kannan, K.; Selvakumar, V.; Muthusamy, K.; Siddiqui, M.R.; Wabaidur, S.M.; Parvathiraja, C. Lawsonia inermis mediated synthesis of ZnO/Fe2O3 nanorods for photocatalysis–Biological treatment for the enhanced effluent treatment, antibacterial and antioxidant activities. Chem. Phys. Lett. 2022, 804, 139907. [Google Scholar] [CrossRef]
  5. Liu, K.; Chen, J.; Sun, F.; Liu, Y.; Tang, M.; Yang, Y. Historical development and prospect of intimately coupling photocatalysis and biological technology for pollutant treatment in sewage: A review. Sci. Total Environ. 2022, 835, 155482. [Google Scholar] [CrossRef]
  6. Alhaddad, M.; Ismail, A.A.; Alghamdi, Y.G.; Khathami, N.D.A.; Mohamed, R.M. Co3O4 Nanoparticles Accommodated Mesoporous TiO2 framework as an Excellent Photocatalyst with Enhanced Photocatalytic Properties. Opt. Mater. 2022, 131, 112643. [Google Scholar] [CrossRef]
  7. Koley, S. Engineering Si doping in anatase and rutile TiO2 with oxygen vacancy for efficient optical application. Phys. B 2021, 602, 412502. [Google Scholar] [CrossRef]
  8. Fan, H.; Wang, R.; Xu, Z.; Duan, H.; Chen, D. Structural and transport properties of FeO-TiO2-SiO2 systems: Insights from molecular dynamics simulations. J. Non-Cryst. Solids 2021, 571, 121049. [Google Scholar] [CrossRef]
  9. Istirohah, T.; Himmah, S.W.; Diantoro, M. Fabrication of Aligned PAN/TiO2 Fiber using Electric Electrospinning (EES). Mater. Today Proc. 2019, 13, 211–216. [Google Scholar] [CrossRef]
  10. Kim, S.; Zhao, S.; Jung, D.; Cha, B.; Saqlain, S.; Choe, H.; Hwang, C.; Kim, Y. Visible light responsive rutile TiO2 photocatalysts mixed with cement: Enhancement effect driven by TiO2/cement interfaces. Appl. Surf. Sci. 2021, 570, 151136. [Google Scholar] [CrossRef]
  11. Carraro, G.; Gasparotto, A.; Maccato, C.; Bontempi, E.; Barreca, D. Fe2O3-TiO2 nanocomposites on activated carbon fifibers by a plasma-assisted approach. Surf. Coat. Tech. 2016, 307, 352–358. [Google Scholar] [CrossRef]
  12. Abraham, C.; Devi, L. The crucial role of W6+, P5+ and N3− dopant ions in the anatase TiO2 crystal lattice for enhanced photocatalytic activity under the irradiation of UV/solar light: Structure-reactivity correlation. Mater. Chem. Phys. 2019, 229, 334–347. [Google Scholar] [CrossRef]
  13. Sun, Q.; Wen, T.; Jin, E.; Yu, J.; Liu, T. A combined phase evolution, mechanical and electrical analysis of Mg-PSZ with TiO2 addition. Mater. Chem. Phys. 2022, 276, 125316. [Google Scholar] [CrossRef]
  14. Stojadinović, S.; Tadić, N.; Radić, N.; Grbić, B.; Vasilić, R. CdS particles modified TiO2 coating formed by plasma electrolytic oxidation with enhanced photocatalytic activity. Surf. Coat. Tech. 2018, 344, 528–533. [Google Scholar] [CrossRef]
  15. Park, Y.; Kim, B.; Jeong, S.; Jeon, K.; Chung, K.; Jung, S. Characteristics of hydrogen production by photocatalytic water splitting using liquid phase plasma over Ag-doped TiO2 photocatalysts. Environ. Res. 2020, 188, 109630. [Google Scholar] [CrossRef] [PubMed]
  16. Absalan, Y.; Razavi, M.; Gholizadeh, M.; Ahmadpour, A.; Poursabagh, S.; Kovalchukova, O. Enhance the photocatalytic performance of TiO2 nano-semiconductor by simultaneously doping of transition and lanthanide elements for the C-C homocoupling reaction under sunlight irradiation. Nano-Struct. Nano-Objects 2022, 30, 100858. [Google Scholar] [CrossRef]
  17. Jung, S.; Bang, H.; Lee, H.; Ha, H.; Yu, Y.; Kim, S.; Park, Y. Assessing the photocatalytic activity of europium doped TiO2 using liquid phase plasma process on acetylsalicylic acid. Catal. Today 2022, 388–389, 365–371. [Google Scholar] [CrossRef]
  18. Xiao, Y.; Wang, K.; Yang, Z.; Xing, Z.; Li, Z.; Pan, K.; Zhou, W. Plasma Cu-decorated TiO2- x/CoP particle-level hierarchical heterojunctions with enhanced photocatalytic-photothermal performance. J. Hazard. Mater. 2021, 414, 125487. [Google Scholar] [CrossRef]
  19. Pasini, S.; Valério, A.; Souza, S.; Hotza, D.; Yin, G.; Wang, J.; Souza, A. Plasma-modified TiO2/polyetherimide nanocomposite fibers for photocatalytic degradation of organic compounds. J. Environ. Chem. Eng. 2019, 7, 103213. [Google Scholar] [CrossRef]
  20. Irala, D.; Fontana, L.; Sagás, J.; Maciel, H. The effects of plasma nitriding pretreatment in steel substrates on the photocatalytic activity of TiO2 films. Surf. Coat. Tech. 2014, 240, 154–159. [Google Scholar] [CrossRef]
  21. Calisir, M.; Gungor, M.; Demir, A.; Kilic, A.; Khan, M. Nitrogen-doped TiO2 fibers for visible-light-induced photocatalytic activities. Ceram. Int. 2020, 46, 16743–16753. [Google Scholar]
  22. Zhang, Y.; Tan, H.; Wang, C.; Li, B.; Yang, H.; Hou, H.; Xiao, C. TiO2-coated glass hollow fiber membranes: Preparation and application for photocatalytic methylene blue removal. J. Eur. Ceram. Soc. 2022, 42, 2496–2504. [Google Scholar] [CrossRef]
  23. Li, Y.; Zhang, P.; Zhang, J.; Zhang, H.; Ai, T.; Zhao, Z.; Liu, Y.; Pu, Z. Photocatalytic performance of Fe doped TiO2 on the surface of carbon fiber. Opt. Mater. 2022, 133, 112970. [Google Scholar]
  24. Nowicka, E.P.; Horczyczak, E.G.; Hanula, M.; Lesiak, M.M.; Pogorzelski, G.; Wierzbicka, A.; Półtorak, A. Sage extracts obtained with cold plasma improves beef quality. Meat Sci. 2022, 194, 108988. [Google Scholar] [CrossRef]
  25. Alhomsi, S.; Bauville, G.; Pasquiers, S.; Minea, T. Radio-Frequency linear plasma process for heating of metallic surfaces. Vacuum 2023, 207, 111571. [Google Scholar] [CrossRef]
  26. Liu, X.; Hua, R.; Niu, J.; Zhang, Z.; Zhang, J. N2 plasma treatment TiO2 nanosheets for enhanced visible light-driven photocatalysis. J. Alloys Compd. 2021, 881, 160509. [Google Scholar] [CrossRef]
  27. Gosavi, S.; Tabei, R.; Roy, N.; Latthe, S.S.; Hunge, Y.M.; Suzuki, N.; Kondo, T.; Yuasa, M.; Teshima, K.; Fujishima, A.; et al. Low Temperature Deposition of TiO2 Thin Films through Atmospheric Pressure Plasma Jet Processing. Catalysts 2021, 11, 91. [Google Scholar] [CrossRef]
  28. Tripatanasuwan, S.; Reneker, D.H. Corona discharge from electrospinning jet of poly (ethylene oxide) solution. Polymer 2009, 50, 1835–1837. [Google Scholar] [CrossRef]
  29. Kajita, S.; Miyaguchi, K.; Tanaka, H.; Yasunaga, E.; Yoshida, T.; Ohno, N. Enhanced photocatalytic ethylene decomposition with anatase-rutile mixed nanostructures formed by He plasma treatment. J. Photochem. Photobiol. A 2021, 418, 113420. [Google Scholar] [CrossRef]
  30. Fang, D.; Lin, K.; Xue, T.; Cui, C.; Chen, X.; Yao, P.; Li, H. Influence of Al doping on structural and optical properties of Mg-Al co-doped ZnO thin films prepared by sol-gel method. J. Alloy. Compd. 2014, 589, 346–352. [Google Scholar] [CrossRef]
  31. Tarigh, G.D.; Shemirani, F.; Maz’hari, N.S. Fabrication of a reusable magnetic multi-walled carbon nanotube-TiO2 nanocomposite by electrostatic adsorption: Enhanced photodegradation of malachite green. RSC Adv. 2015, 5, 35070–35079. [Google Scholar] [CrossRef]
  32. Wang, Y.; Feng, T.; Li, X.; Li, L. Thermochemistry of nano-phased titanium dioxides relevant to energy application: A Review. Chem. Thermodyn. Therm. Anal. 2022, 5, 100033. [Google Scholar] [CrossRef]
  33. Chen, Q.; Liu, H.; Xin, Y.; Cheng, X.; Li, J. Enhanced photoelectrochemical and photocatalytic performance of single-crystalline anatase TiO2 (101) nanobelts arrays originating from nanotubes arrays. Appl. Surf. Sci. 2013, 264, 476–484. [Google Scholar] [CrossRef]
  34. Khatibnezhad, H.; Ambriz-Vargas, F.; Ettouil, F.; Moreau, C. An investigation on the photocatalytic activity of sub-stoichiometric TiO2-x coatings produced by suspension plasma spray. J. Eur. Ceram. Soc. 2021, 41, 544–556. [Google Scholar] [CrossRef]
  35. Turgut, G.; Sonmez, E.; Aydın, S.; Dilber, R.; Turgut, U. The effect of Mo and F double doping on structural, morphological, electrical and optical properties of spray deposited SnO2 thin films. Ceram. Int. 2014, 40, 12891–12898. [Google Scholar] [CrossRef]
  36. Mittemeijer, E.; Welzel, U. The “state of the art” of the diffraction analysis of crystallite size and lattice strain. Z. Für Krist. 2008, 223, 552–560. [Google Scholar] [CrossRef]
  37. Horikoshi, S.; Minatodani, Y.; Tsutsumi, H.; Uchida, H.; Abe, M.; Serpone, N. Influence of lattice distortion and oxygen vacancies on the UV-driven/microwave-assisted TiO2 photocatalysis. J. Photoch. Photobio. A 2013, 265, 20–28. [Google Scholar] [CrossRef]
  38. Machín, A.; Fontánez, K.; García, D.; Sampayo, P.; Cruz, C.C.; Serrano, G.J.C.; Vázquez, L.S.; Resto, E.; Petrescu, F.I.; Morant, C.; et al. Hydrogen Production and Degradation of Ciprofloxacin by Ag@TiO2-MoS2 Photocatalysts. Catalysts 2022, 12, 267. [Google Scholar] [CrossRef]
  39. Mendez, M.S.; Lemarchand, A.; Traore, M.; Perruchot, C.; Sassoye, C.; Selmane, M.; Nikravech, M.; Amar, M.B.; Kanaev, A. Photocatalytic Activity of Nanocoatings Based on Mixed Oxide V-TiO2 Nanoparticles with Controlled Composition and Size. Catalysts 2021, 11, 1457. [Google Scholar] [CrossRef]
  40. Hu, S.; Kang, Z.; Ning, Z.; Ye, J.; Li, F.; Fan, Z. H2 plasma treatment to prepare reduced TiO2 catalyst with high oxygen vacancies content. Asian. J. Chem. 2014, 26, 2403–2406. [Google Scholar] [CrossRef]
  41. Kim, H.; Kim, J.; Hong, B. Effect of hydrogen plasma treatment on nano-structured TiO2 films for the enhanced performance of dye-sensitized solar cell. Appl. Surf. Sci. 2013, 274, 171–175. [Google Scholar] [CrossRef]
  42. Madhavi, V.; Kondaiah, P.; Ghosh, M.; Rao, G. Hydrogen plasma-treated 1D/3D TiO2 nanorod array photoanode for efficient photoelectrochemical water splitting. Ceram. Int. 2020, 46, 17791–17799. [Google Scholar] [CrossRef]
  43. Kawakami, R.; Yoshitani, Y.; Shirai, A.; Yanagiya, S.; Koide, H.; Mimoto, Y.; Kajikawa, K.; Niibe, M.; Nakano, Y.; Azuma, C.; et al. Effects of nonequilibrium atmospheric-pressure O2 plasma-assisted annealing on anatase TiO2 nanoparticles. Appl. Surf. Sci. 2020, 526, 146684. [Google Scholar] [CrossRef]
  44. Liu, M.; Ai, Q.; Wang, S.; Shuai, Y. Analysis on influence factors for transmission measurements of absorbing and scattering media based on the internal optical-path of FTIR spectrometer. Measurement 2022, 203, 111963. [Google Scholar] [CrossRef]
  45. Kong, C.P.Y.; Suhaimi, N.A.A.; Shahri, N.N.M.; Lim, J.W.; Nur, M.; Hobley, J.; Usman, A. Auramine O UV Photocatalytic Degradation on TiO2 Nanoparticles in a Heterogeneous Aqueous Solution. Catalysts 2022, 12, 975. [Google Scholar] [CrossRef]
  46. Xie, Y.; Liu, X.; Huang, A.; Ding, C.; Chu, P.K. Improvement of surface bioactivity on titanium by water and hydrogen plasma immersion ion implantation. Biomaterials 2005, 26, 6129–6135. [Google Scholar] [CrossRef] [PubMed]
  47. Liao, M.; Hsu, C.; Chen, D. Preparation and properties of amorphous titania-coated zinc oxide nanoparticles. J. Solid State Chem. 2006, 179, 2020–2026. [Google Scholar] [CrossRef]
  48. Andrea, A.; Bianca, D.; Nadia, G. Lipid-coated zinc oxide nanoparticles as innovative ROS-Generators for photodynamic therapy in cancer Cells. Nanomaterials 2018, 8, 143. [Google Scholar]
  49. Bezrodna, T.; Puchkovska, G.; Shymanovska, V.; Baran, J.; Ratajczak, H. IR-analysis of H-bonded H2O on the pure TiO2 surface. J. Mol. Struct. 2004, 700, 175–181. [Google Scholar] [CrossRef]
  50. Lee, D.Y.; Park, J.; Kim, Y.; Lee, M.; Cho, N. Effect of Nb doping on morphology, crystal structure, optical band gap energy of TiO2 thin films. Curr. Appl. Phys. 2014, 14, 421–427. [Google Scholar] [CrossRef]
  51. Dave, D.P.; Chauhan, K.V. Synthesis of visible spectrum-active TiO2 thin film induced by RF magnetron sputtering. Mater. Today Proc. 2022, 62, 4254–4259. [Google Scholar] [CrossRef]
  52. Komaraiah, D.; Radha, E.; Sivakumar, J.; Reddy, M.; Sayanna, R. Photoluminescence and photocatalytic activity of spin coated Ag+ doped anatase TiO2 thin films. Opt. Mater. 2020, 108, 110401. [Google Scholar] [CrossRef]
  53. Chouhan, L.; Srivastava, S.K. Observation of room temperature d0 ferromagnetism, band-gap widening, zero dielectric loss and conductivity enhancement in Mg doped TiO2 (rutile + anatase) compounds for spintronics applications. J. Solid State Chem. 2022, 307, 122828. [Google Scholar] [CrossRef]
  54. You, J.; Zhang, L.; He, L.; Zhang, B. Photocatalytic degradation of methyl orange on ZnO–TiO2/SO42− heterojunction composites. Opt. Mater. 2022, 131, 112737. [Google Scholar] [CrossRef]
  55. Li, D.; Zhang, W.; Niu, Z.; Zhang, Y. Improvement of photocatalytic activity of BiOBr and BiOBr/ZnO under visible-light irradiation by short-time low temperature plasma treatment. J. Alloys Compd. 2022, 924, 166608. [Google Scholar] [CrossRef]
  56. Lee, C.; Choi, H.; Lee, C.; Kim, H. Photocatalytic properties of nano-structured TiO2 plasma sprayed coating. Surf. Coat. Tech. 2003, 173, 192–200. [Google Scholar] [CrossRef]
  57. Uricchio, A.; Nadal, E.; Plujat, B.; Plantard, G.; Massines, F.; Fanelli, F. Low-temperature atmospheric pressure plasma deposition of TiO2-based nanocomposite coatings on open-cell polymer foams for photocatalytic water treatment. Appl. Surf. Sci. 2021, 561, 150014. [Google Scholar] [CrossRef]
  58. Panniello, A.; Curri, M.; Diso, D.; Licciulli, A.; Locaputoa, V.; Agostiano, A.; Comparelli, R.; Mascolo, G. Nanocrystalline TiO2 based films onto fibers for photocatalytic degradation of organic dye in aqueous solution. Appl. Catal. B- Environ. 2012, 121–122, 190–197. [Google Scholar] [CrossRef]
  59. Vijay, M.; Ramachandran, K.; Ananthapadmanabhan, P.; Nalini, B.; Pillai, B.; Bondioli, F.; Manivannan, A.; Narendhirakannan, R.T. Photocatalytic inactivation of Gram-positive and Gram-negative bacteria by reactive plasma processed nanocrystalline TiO2 powder. Curr. Appl. Phys. 2013, 13, 510–516. [Google Scholar] [CrossRef]
  60. Dong, P.; Huang, Z.; Nie, X.; Cheng, X.; Jin, Z.; Zhang, X. Plasma enhanced decoration of nc-TiO2 on electrospun PVDF fibers for photocatalytic application. Mater. Res. Bull. 2019, 111, 102–112. [Google Scholar] [CrossRef]
  61. Bordes, M.; Vicent, M.; Moreno, A.; López, V.; Moreno, R.; Salvador, M.; Benavente, R.; Sánchez, E. Preparation of feedstocks from nano/submicron-sized TiO2 particles to obtain photocatalytic coatings by atmospheric plasma spraying. Ceram. Int. 2014, 40, 16213–16225. [Google Scholar] [CrossRef] [Green Version]
  62. Chen, Y.; Huang, J.; Zhong, J.; Li, M.; Li, Z.; Yang, C. Enhanced photocatalytic performance of TiO2/BiOI heterojunctions benefited from effective separation of photogenerated carriers. Chem. Phys. Lett. 2021, 780, 138966. [Google Scholar] [CrossRef]
  63. Huang, X.; Zhang, R.; Gao, X.; Yu, B.; Gao, Y.; Han, Z. TiO2-rutile/anatase homojunction with enhanced charge separation for photoelectrochemical water splitting. Int. J. Hydrog. Energy 2021, 46, 26358–26366. [Google Scholar] [CrossRef]
  64. Yang, L.; Liu, X.; Wang, C.; Liu, Z.; Feng, X. Influence of calcination temperatures on the anatase and rutile mixed phase composition and photocatalytic activity of the carbon doped mesoporous TiO2. Opt. Mater. 2022, 133, 112997. [Google Scholar]
  65. Nakamura, I.; Negishi, N.; Kutsuna, S.; Ihara, T.; Sugihara, S.; Takeuchi, K. Role of oxygen vacancy in the plasma-treated TiO2 photocatalyst with visible light activity for NO removal. J. Mol. Catal. A Chem. 2000, 161, 205–212. [Google Scholar] [CrossRef]
Figure 1. SEM images of TiO2 fibers obtained after calcination at different temperatures and plasma treatments: (a) TiO2-500 °C, (b) TiO2-600 °C, (c) TiO2-700 °C, (d) TiO2-800 °C, and (e) TiO2-PH72.
Catalysts 12 01441 g001
Figure 2. N2 gas adsorption/desorption isotherm of all samples; the inset is the corresponding pore-size distribution.
Catalysts 12 01441 g002
Figure 3. TEM observation of the TiO2 fiber annealed at 700 °C; (a) TEM image of local magnification; (b) HRTEM image and lattice annotation of anatase and rutile, and (c) calibration of diffraction pattern.
Catalysts 12 01441 g003
Figure 4. TEM observation of the TiO2 fiber annealed at 800 °C; (a) TEM image of local magnification; (b) HRTEM image and lattice annotation of anatase and rutile, and (c) calibration of diffraction pattern.
Catalysts 12 01441 g004
Figure 5. (a) XRD patterns and (b) Raman spectra of those TiO2 fibers obtained after calcination at different temperatures and plasma treatments.
Catalysts 12 01441 g005
Figure 6. XPS spectra of the TiO2 fiber obtained after calcination at different temperatures and plasma treatments: (a) survey spectra, (b) Ti 2p spectra, and (c) O 1s spectra.
Catalysts 12 01441 g006
Figure 7. EDX images of the (a) TiO2-700 °C and (b) TiO2-PH72 samples.
Catalysts 12 01441 g007
Figure 8. FTIR spectra of the TiO2 fibers obtained after calcination at different temperatures and plasma treatments.
Catalysts 12 01441 g008
Figure 9. UV-vis diagram (a) and Tauc plots (b) of the fibers obtained after different calcination temperatures and plasma treatments.
Catalysts 12 01441 g009
Figure 10. (a) Photocatalytic degradation rate of the TiO2 fibers obtained after calcination at different temperatures and plasma treatments; (b) first-order kinetics of photocatalytic degradation.
Catalysts 12 01441 g010
Figure 11. EPR spectra of TiO2-700 °C and TiO2-PH72.
Catalysts 12 01441 g011
Figure 12. (a) Photocatalytic mechanism before plasma treatment; (b) photocatalytic mechanism after plasma treatment.
Catalysts 12 01441 g012
Figure 13. Process flow chart of electrospinning TiO2 fiber preparation; heat treatment and plasma modification.
Catalysts 12 01441 g013
Table 1. Grain size and lattice constant of all samples.
SampleGrain Size (nm)Standard Value of Lattice Parameter (Å)Calculated Lattice
Parameter (Å)
AnataseRutileAnataseRutile
TiO2-500 °C55a = 3.785
c = 9.514
a = 4.593
c = 2.959
a = 3.8536
c = 9.3607
/
TiO2-600 °C55.2a = 3.7742
c = 9.4382
/
TiO2-700 °C56.2a = 3.7892
c = 9.4010
a = 4.5815
c = 2.9422
TiO2-800 °C59.3a = 3.7799
c = 9.4939
a = 4.5836
c = 2.9681
TiO2-PH7256.4a = 3.7948
c = 9.3347
a = 4.5850
c = 2.9485
Table 2. Element content and O/Ti of each sample from XPS.
SamplesElement ConcentrationO/Ti
O(%)Ti(%)
TiO2-500 °C62.9032.121.96
TiO2-600 °C62.3432.891.90
TiO2-700 °C61.8333.121.87
TiO2-800 °C61.1433.671.82
TiO2-PH7261.0333.821.80
Table 3. The corresponding vibrational bonds in the FTIR spectra.
Wavenumber (cm−1)Vibrational Bonds
437Ti-O (Anatase)
494Ti-O (Rutile)
717Ti-O-Ti
1051Ti-OH
1634Polarity -OH
3364Adsorbed water
Table 4. The recent literature review on TiO2 and the comparison between their photocatalytic efficiency and the results in this work.
MethodsPhotocatalysts TypeSimulated PollutantThe Degradation Rate Constant K ValueRef.
Plasma sprayingCoatingMethylene blue0.0014 min−1[57]
DBDCoatingMethyl orange0.0146 min−1[58]
Sol-gel methodParticlesMethyl red0.0160 min−1[59]
Reactive plasmaPowderBacteria0.0010 min−1[60]
Hydrothermal synthesisFiberCO20.0110min−1[61]
DBDCoatingMethylene blue0.0099 min−1[62]
* Electrospinning, calcinationFiberMethyl orange0.0157 min−1/
* H2 plasma treatmentFiberMethyl orange0.0223 min−1/
(DBD: Dielectric Barrier Discharge; * Represents the photocatalysts synthesized in this study).
Publisher’s Note: MDPI stays neutral with regard to jurisdictional claims in published maps and institutional affiliations.

