Article

Synthesis and Characterization of SiO2/TiO2 as Photocatalyst on Methylene Blue Degradation

by
Aleksandra Babyszko
,
Agnieszka Wanag
*,
Marcin Sadłowski
,
Ewelina Kusiak-Nejman
and
Antoni W. Morawski
Faculty of Chemical Technology and Engineering, Department of Inorganic Chemical Technology and Environment Engineering, West Pomeranian University of Technology in Szczecin, Pułaskiego 10, 70-322 Szczecin, Poland
*
Author to whom correspondence should be addressed.
Catalysts 2022, 12(11), 1372; https://doi.org/10.3390/catal12111372
Submission received: 30 September 2022 / Revised: 21 October 2022 / Accepted: 3 November 2022 / Published: 5 November 2022
(This article belongs to the Special Issue Structured Semiconductors in Photocatalysis)

Abstract

:
The paper presents a modification of titanium dioxide with fumed silica. The SiO2/TiO2 photocatalysts were obtained by the sol-gel method and then were calcined under an argon atmosphere. Various SiO2 weights (2–17.2 wt.%) were used in the materials’ preparation stage. The obtained samples were characterized using advanced analytical methods, such as FT-IR/DRS infrared spectroscopy, X-ray diffraction, SEM scanning electron microscopy, and UV-Vis/DRS spectroscopy. The BET specific surface area and zeta potential of samples were also measured. Based on the obtained results, it was observed that the modification of titanium dioxide with SiO2 effectively inhibited the increase in crystallite size of anatase and brookite during calcination and the decrease in specific surface area values. Moreover, the presence of SiO2 in the nanomaterials contributed to the increase in the size of specific surface area and the change in band gap energy values. The photocatalytic activity was determined based on the decomposition of methylene blue under UV irradiation. Thermal modification in an inert gas atmosphere significantly increased the dye removal rate. It should be noted that all the obtained SiO2/TiO2 photocatalysts showed higher activity compared to the starting TiO2. It was also found that the photocatalytic activity increased along with the increase in SiO2 content in the sample (up to 14.3 wt.% of SiO2). The highest activity was recorded for SiO2(11.1%)/TiO2_400 and SiO2(14.3%)/TiO2_400 samples.

1. Introduction

Advanced oxidation processes are promising methods for removing pollutants from the environment. One is heterogeneous photocatalysis, which can purify water and air [1,2,3,4]. Due to its properties, titanium dioxide is one of the most commonly used semiconductors in the photocatalytic oxidation of organic compounds. It is characterized by a relatively low price, non-toxicity, high photoactivity, and chemical stability [5]. At the same time, intensive research is being conducted worldwide to increase the efficiency of photocatalytic processes. The studies aim to improve the physicochemical properties of titanium dioxide affecting photocatalytic activity.
There are many methods used to obtain TiO2, such as hydrothermal, solvothermal, sol-gel, or precipitation [6], but the sol-gel method is effective for controlling the size and morphology of the synthesized particles while obtaining homogeneous materials [7,8,9,10,11]. During the sol-gel process, factors such as the initial composition of the reaction mixture, i.e., the molar ratio of water to the metal precursor, type of solvent, type and concentration of catalyst, temperature, and the pH of the solution affect the rate of hydrolysis and polycondensation [12]. In addition, calcination also significantly influences the physical and chemical properties of the final product [13]. For example, Ciesielczyk et al. [14] proved that calcination causes significant changes in the porous structure parameters. In particular, there was a significant reduction in the surface area and pore volume for the calcined samples.
Photocatalysts with enhanced activity can be obtained by modifying titanium dioxide using various compounds, e.g., metals or their oxides and non-metals [15]. Recently, the silica modification of titanium dioxide is becoming more popular. It has been proven that the addition of SiO2 increases the surface of the photocatalyst, increasing the adsorption of pollutants [16]. The enhanced adsorption of contaminants on the silica surface, in turn, improves the photocatalytic activity of mixed SiO2–TiO2 oxides compared to pure TiO2 [17,18]. Jimmy et al. [19] and Yu et al. [20] found that the addition of SiO2 causes the inhibition of TiO2 crystallization. Moreover, adding SiO2 increases the amount of water and hydroxyl groups adsorbed on the surface, improving the hydrophilic and photocatalytic properties [21,22,23].
Several methods of preparation of TiO2 with silica are presented in the literature. The most commonly used silica precursors are tetraethoxysilane (TEOS), tetramethoxysilane (TMOS), and silica gel [24,25]. The sol-gel method for the synthesis of TiO2/SiO2 was used by Fatimah [24]. Titanium(IV) isopropoxide (TTIP) was used as a TiO2 precursor, while tetramethoxysilane (TMOS) and tetraethoxysilane (TEOS) were used as silica precursors. The molar ratio of titanium dioxide to silicon was 4:9. The obtained nanomaterials were then calcined at 500 °C for 4 h. The photocatalytic activity of new nanomaterials was determined based on the decomposition of methylene blue. It was found that using tetraethoxysilane as a silica precursor results in obtaining material with a larger specific surface area and pore volume, which in turn increases photocatalytic efficiency. Qourzal et al. [25] obtained a TiO2-SiO2 photocatalyst by hydrolyzing TTIP in silica gel. The material was calcined at 400 °C for 2 h in the air atmosphere. It was noted that the presence of silica suppresses the anatase to rutile phase transformation. Based on the decomposition of β-naphthol under UV light, they found that the prepared material showed 2.7, 4, and 7.8 times higher photocatalytic activity than commercial TiO2 P25, TiO2 PC50, and TiO2 “Aldrich” photocatalysts, respectively. Enhances photocatalytic activity has been attributed to the high adsorption capacity of the photocatalyst and a large specific surface area. Nandanwar et al. [26] obtained composites by the sol-gel method, using titanium(IV) isopropoxide as TiO2 precursor, tetraethoxysilane (TEOS) as silica precursor, ethanol as solvent, and hydrochloric acid as a promoter of the hydrolysis reaction. In addition, polyethylene glycol (PEG) and the non-ionic Triton X-100 surfactant were used during the preparation phase. The photocatalytic activity was measured by methylene blue degradation. In the case of the Triton X-100 sample, after only a few minutes of exposure to the UV light, approx. 50% of methylene blue was degraded. These results confirm that TiO2/SiO2 with the addition of Triton X-100 shows a higher degradation efficiency than TiO2/SiO2 with polyethylene glycol.
This work proposes a new method of titanium dioxide nanomaterial modification with fumed silica. SiO2/TiO2 nanomaterials were prepared using the sol-gel method. An essential element of the preparation was introducing the heating stage of the obtained nanomaterials in the argon atmosphere. This represents a kind of novelty concerning the preparation methods because, in the methods described in the literature for obtaining this type of materials, the calcination process was carried out mainly in an air atmosphere. The photocatalytic activity of gained samples was determined based on the methylene blue decomposition under UV irradiation. The effect of specific physicochemical properties on photocatalytic activity was also investigated. To the best of our knowledge, this is the first paper in which fumed silica with average primary particle size of 7–14 nm was used as a silica precursor. According to the manufacturer, the used silica characterizes a relatively large specific surface area (>200 m2/g). The novelty of the presented study was also the determination of the calcination effect on the photocatalytic and physicochemical properties of TiO2 nanomaterials modified with fumed silica obtained in an inert gas atmosphere.

2. Results and Discussion

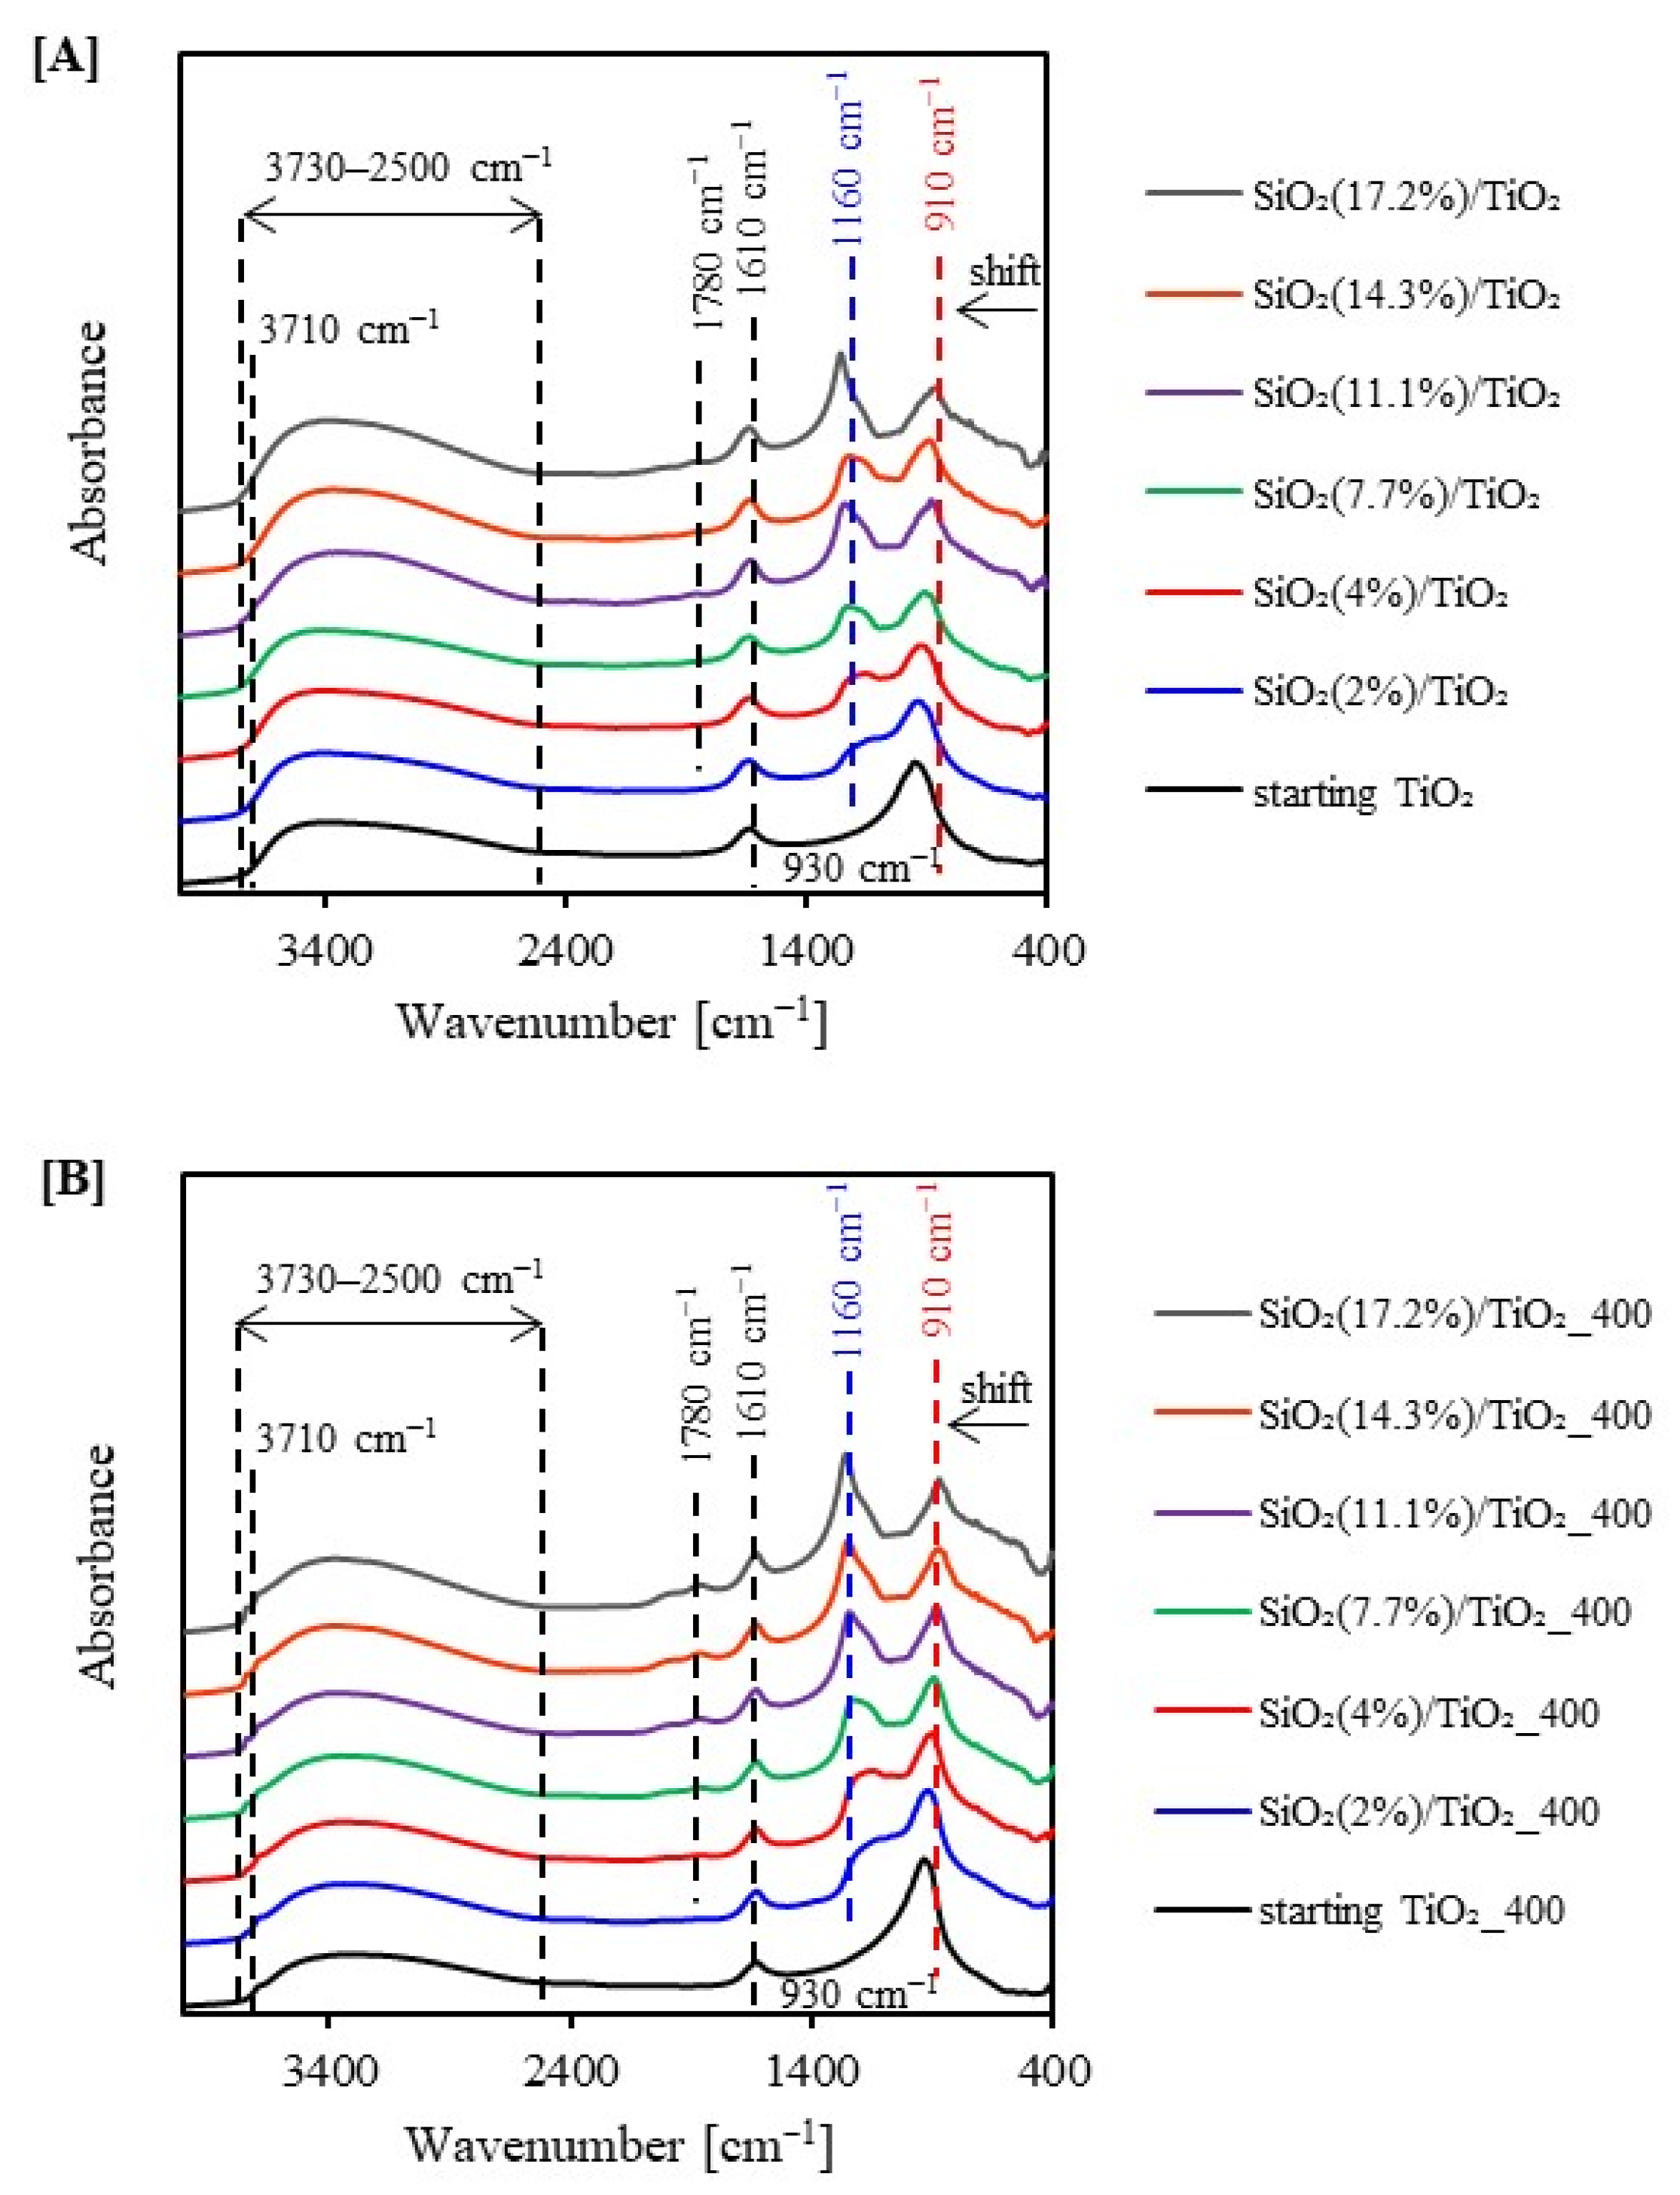
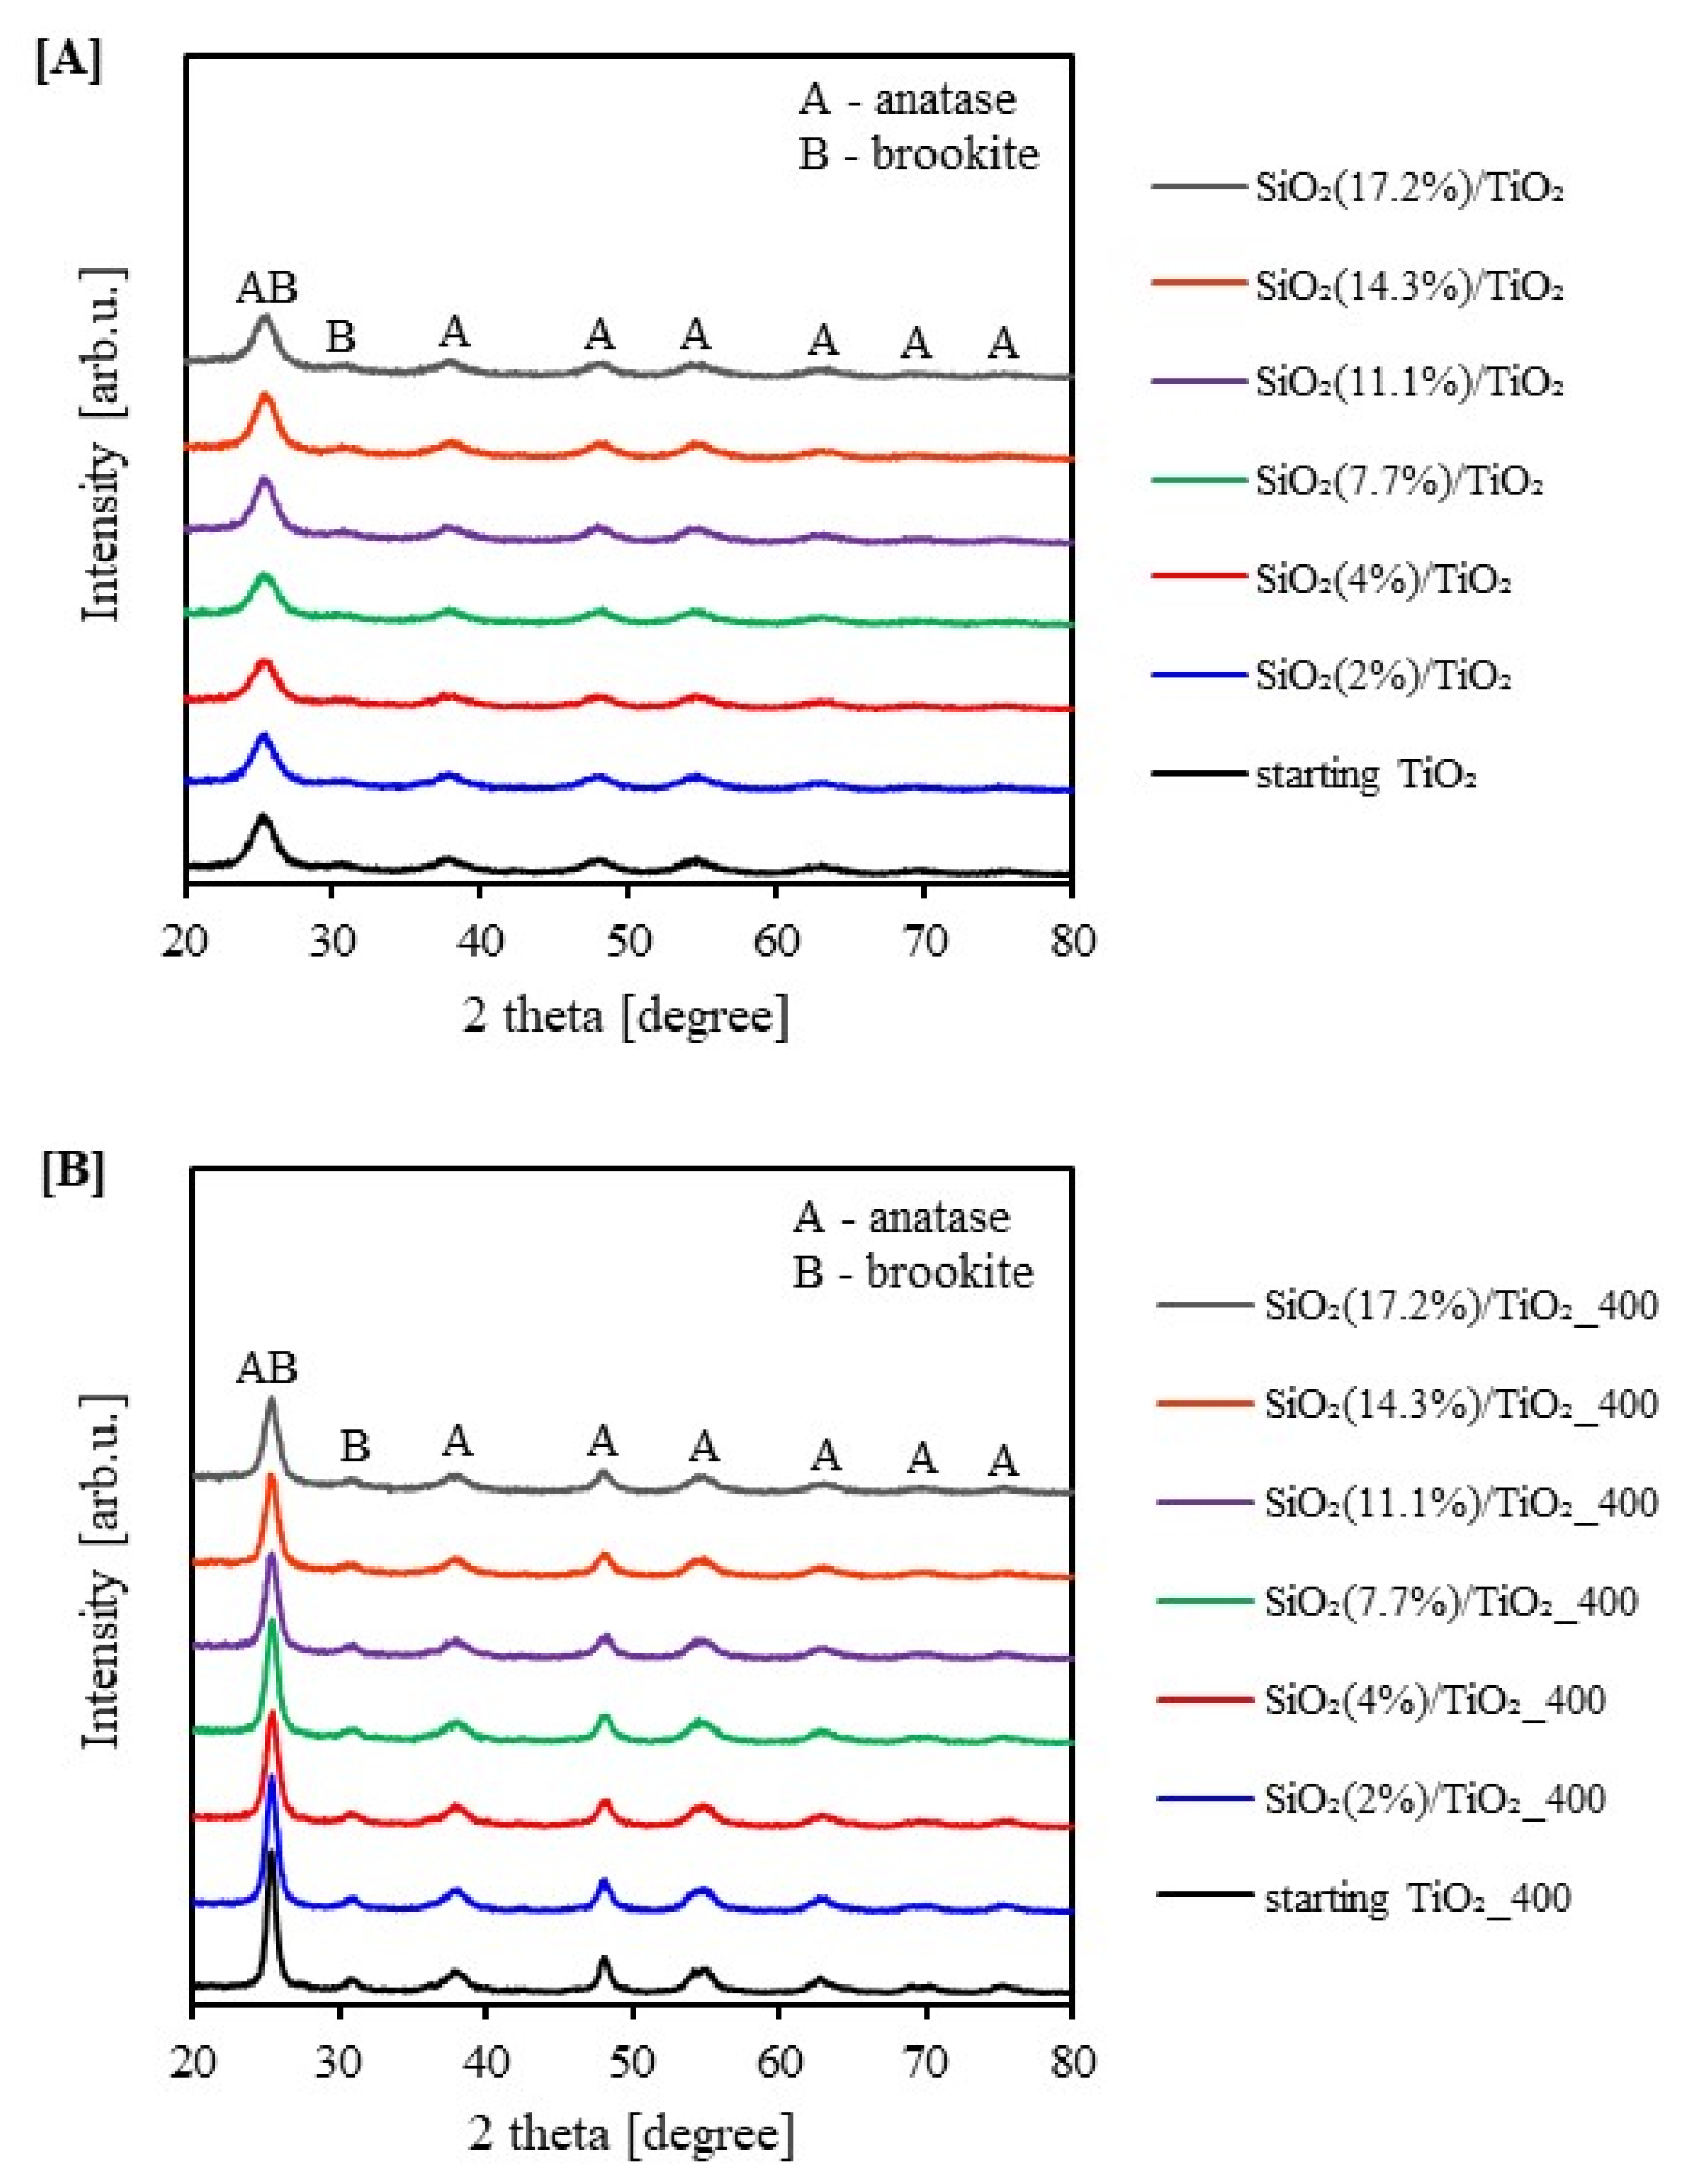
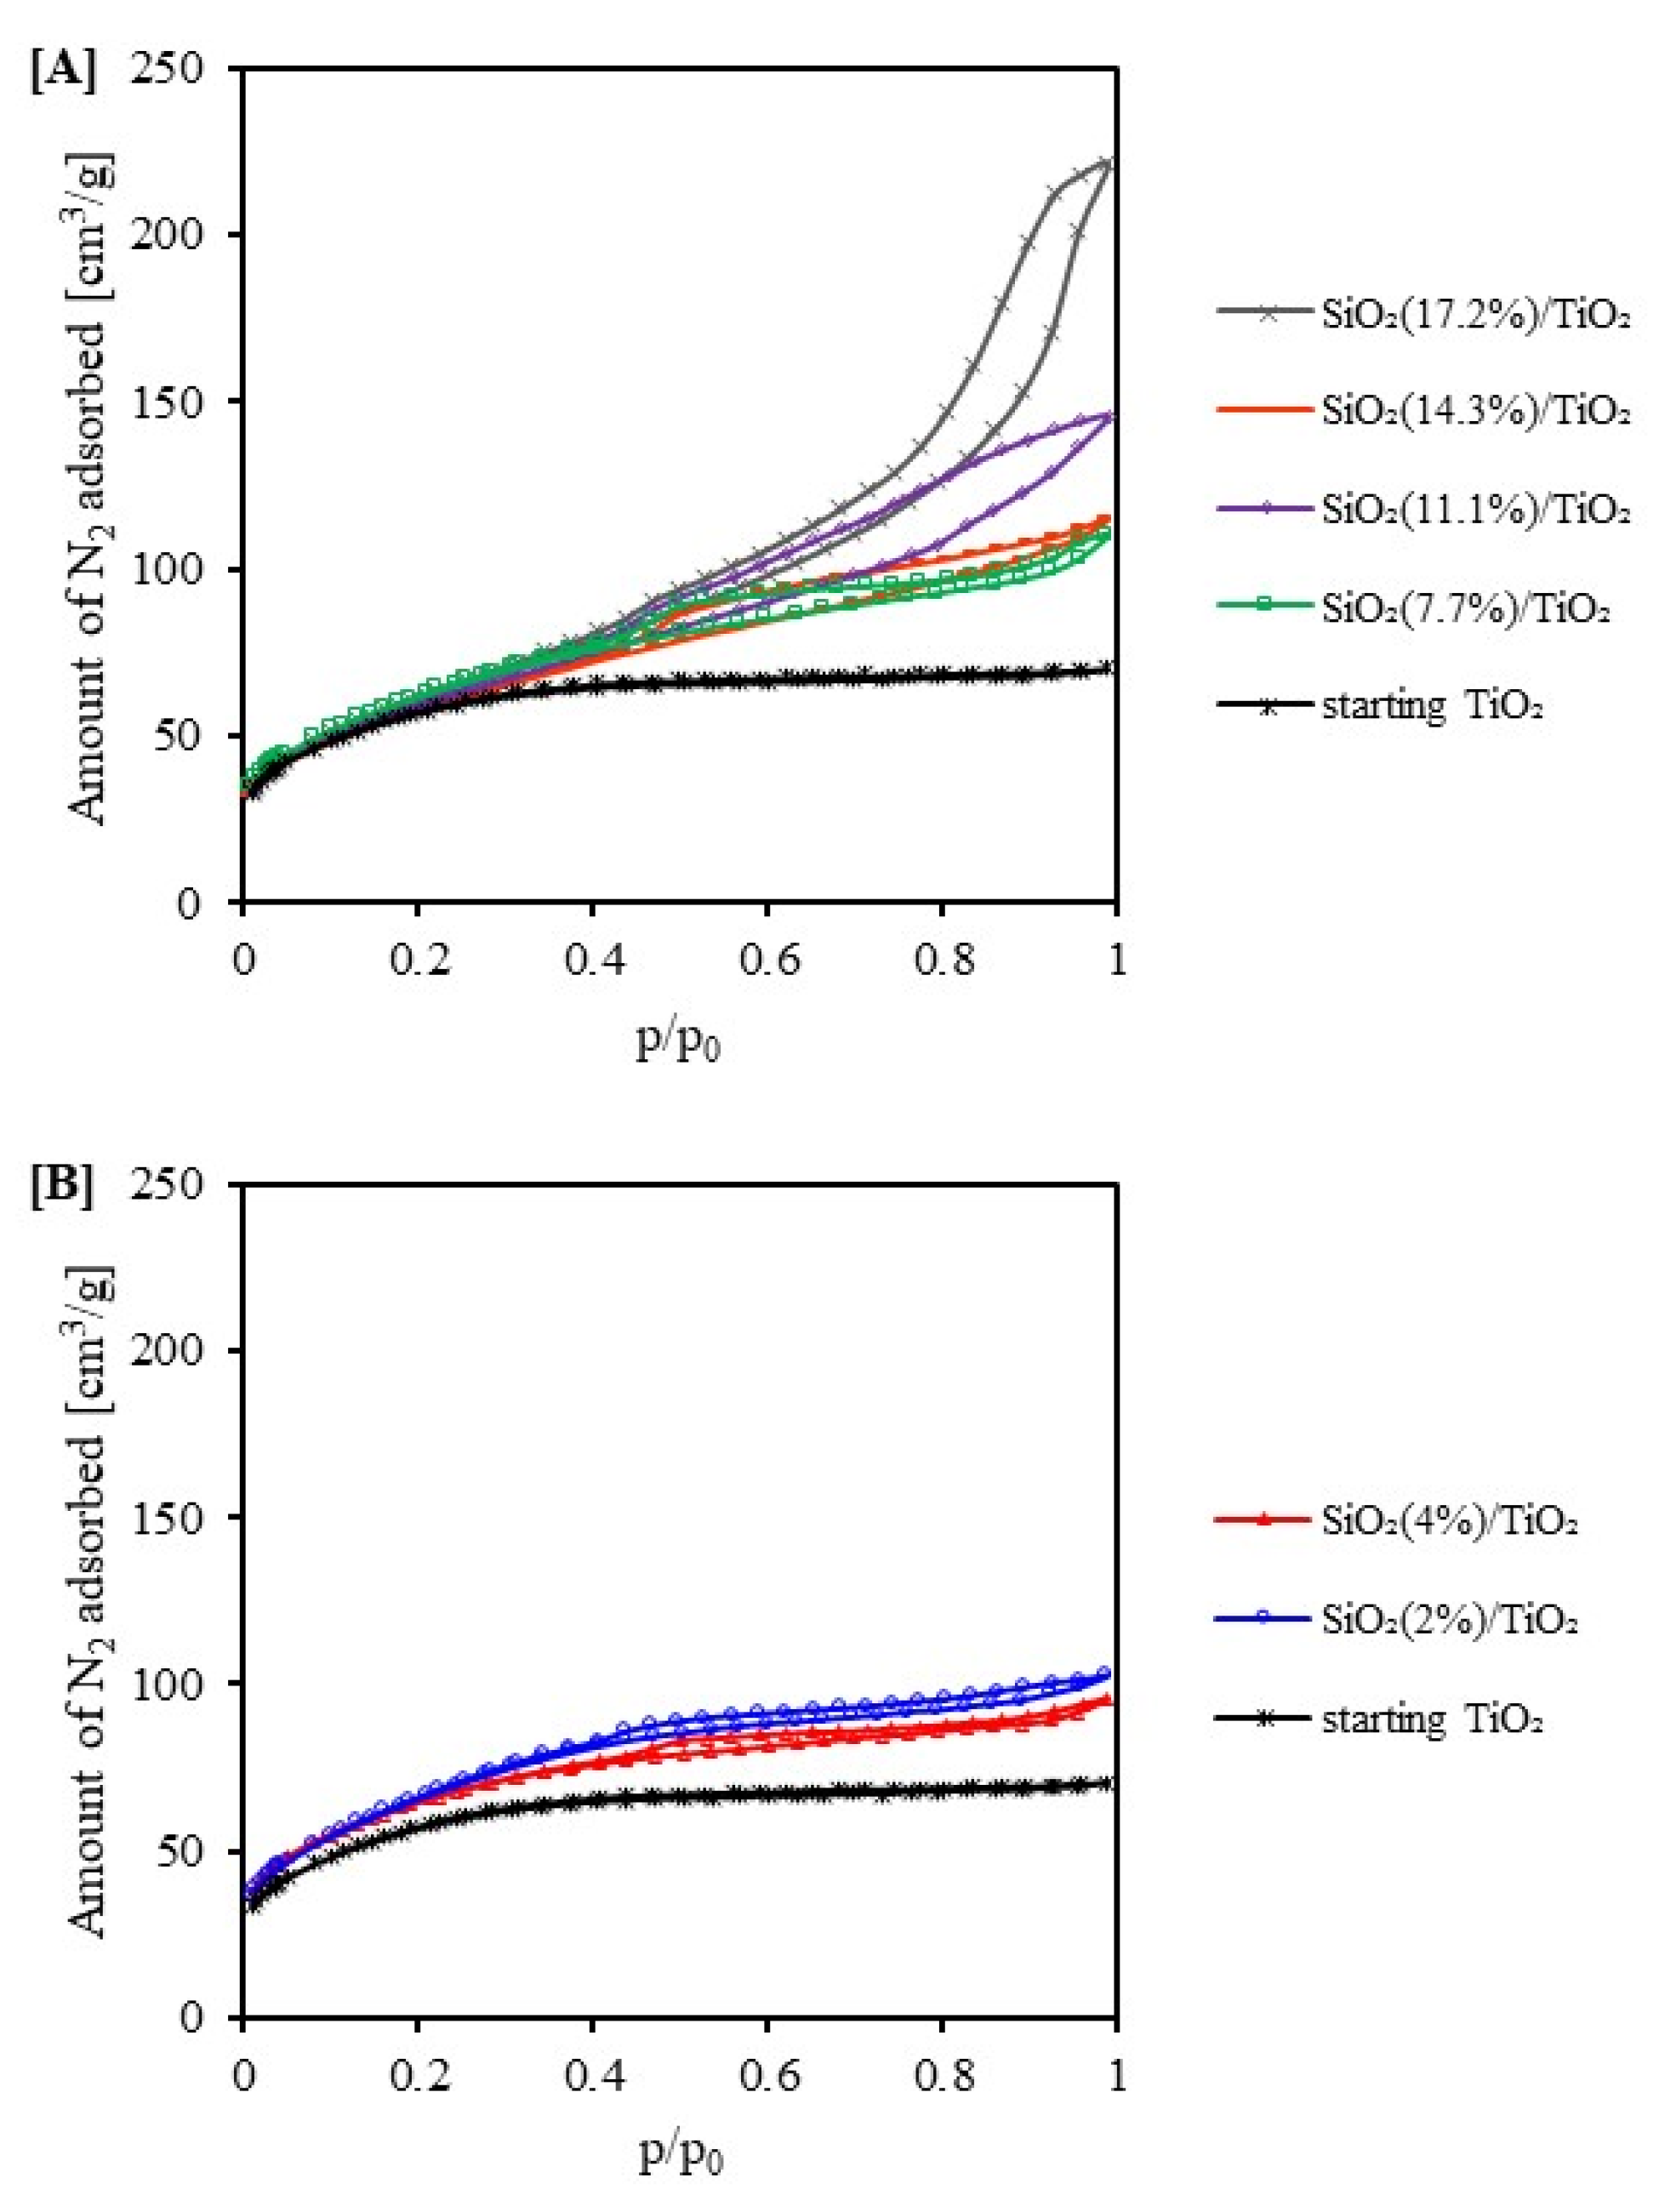
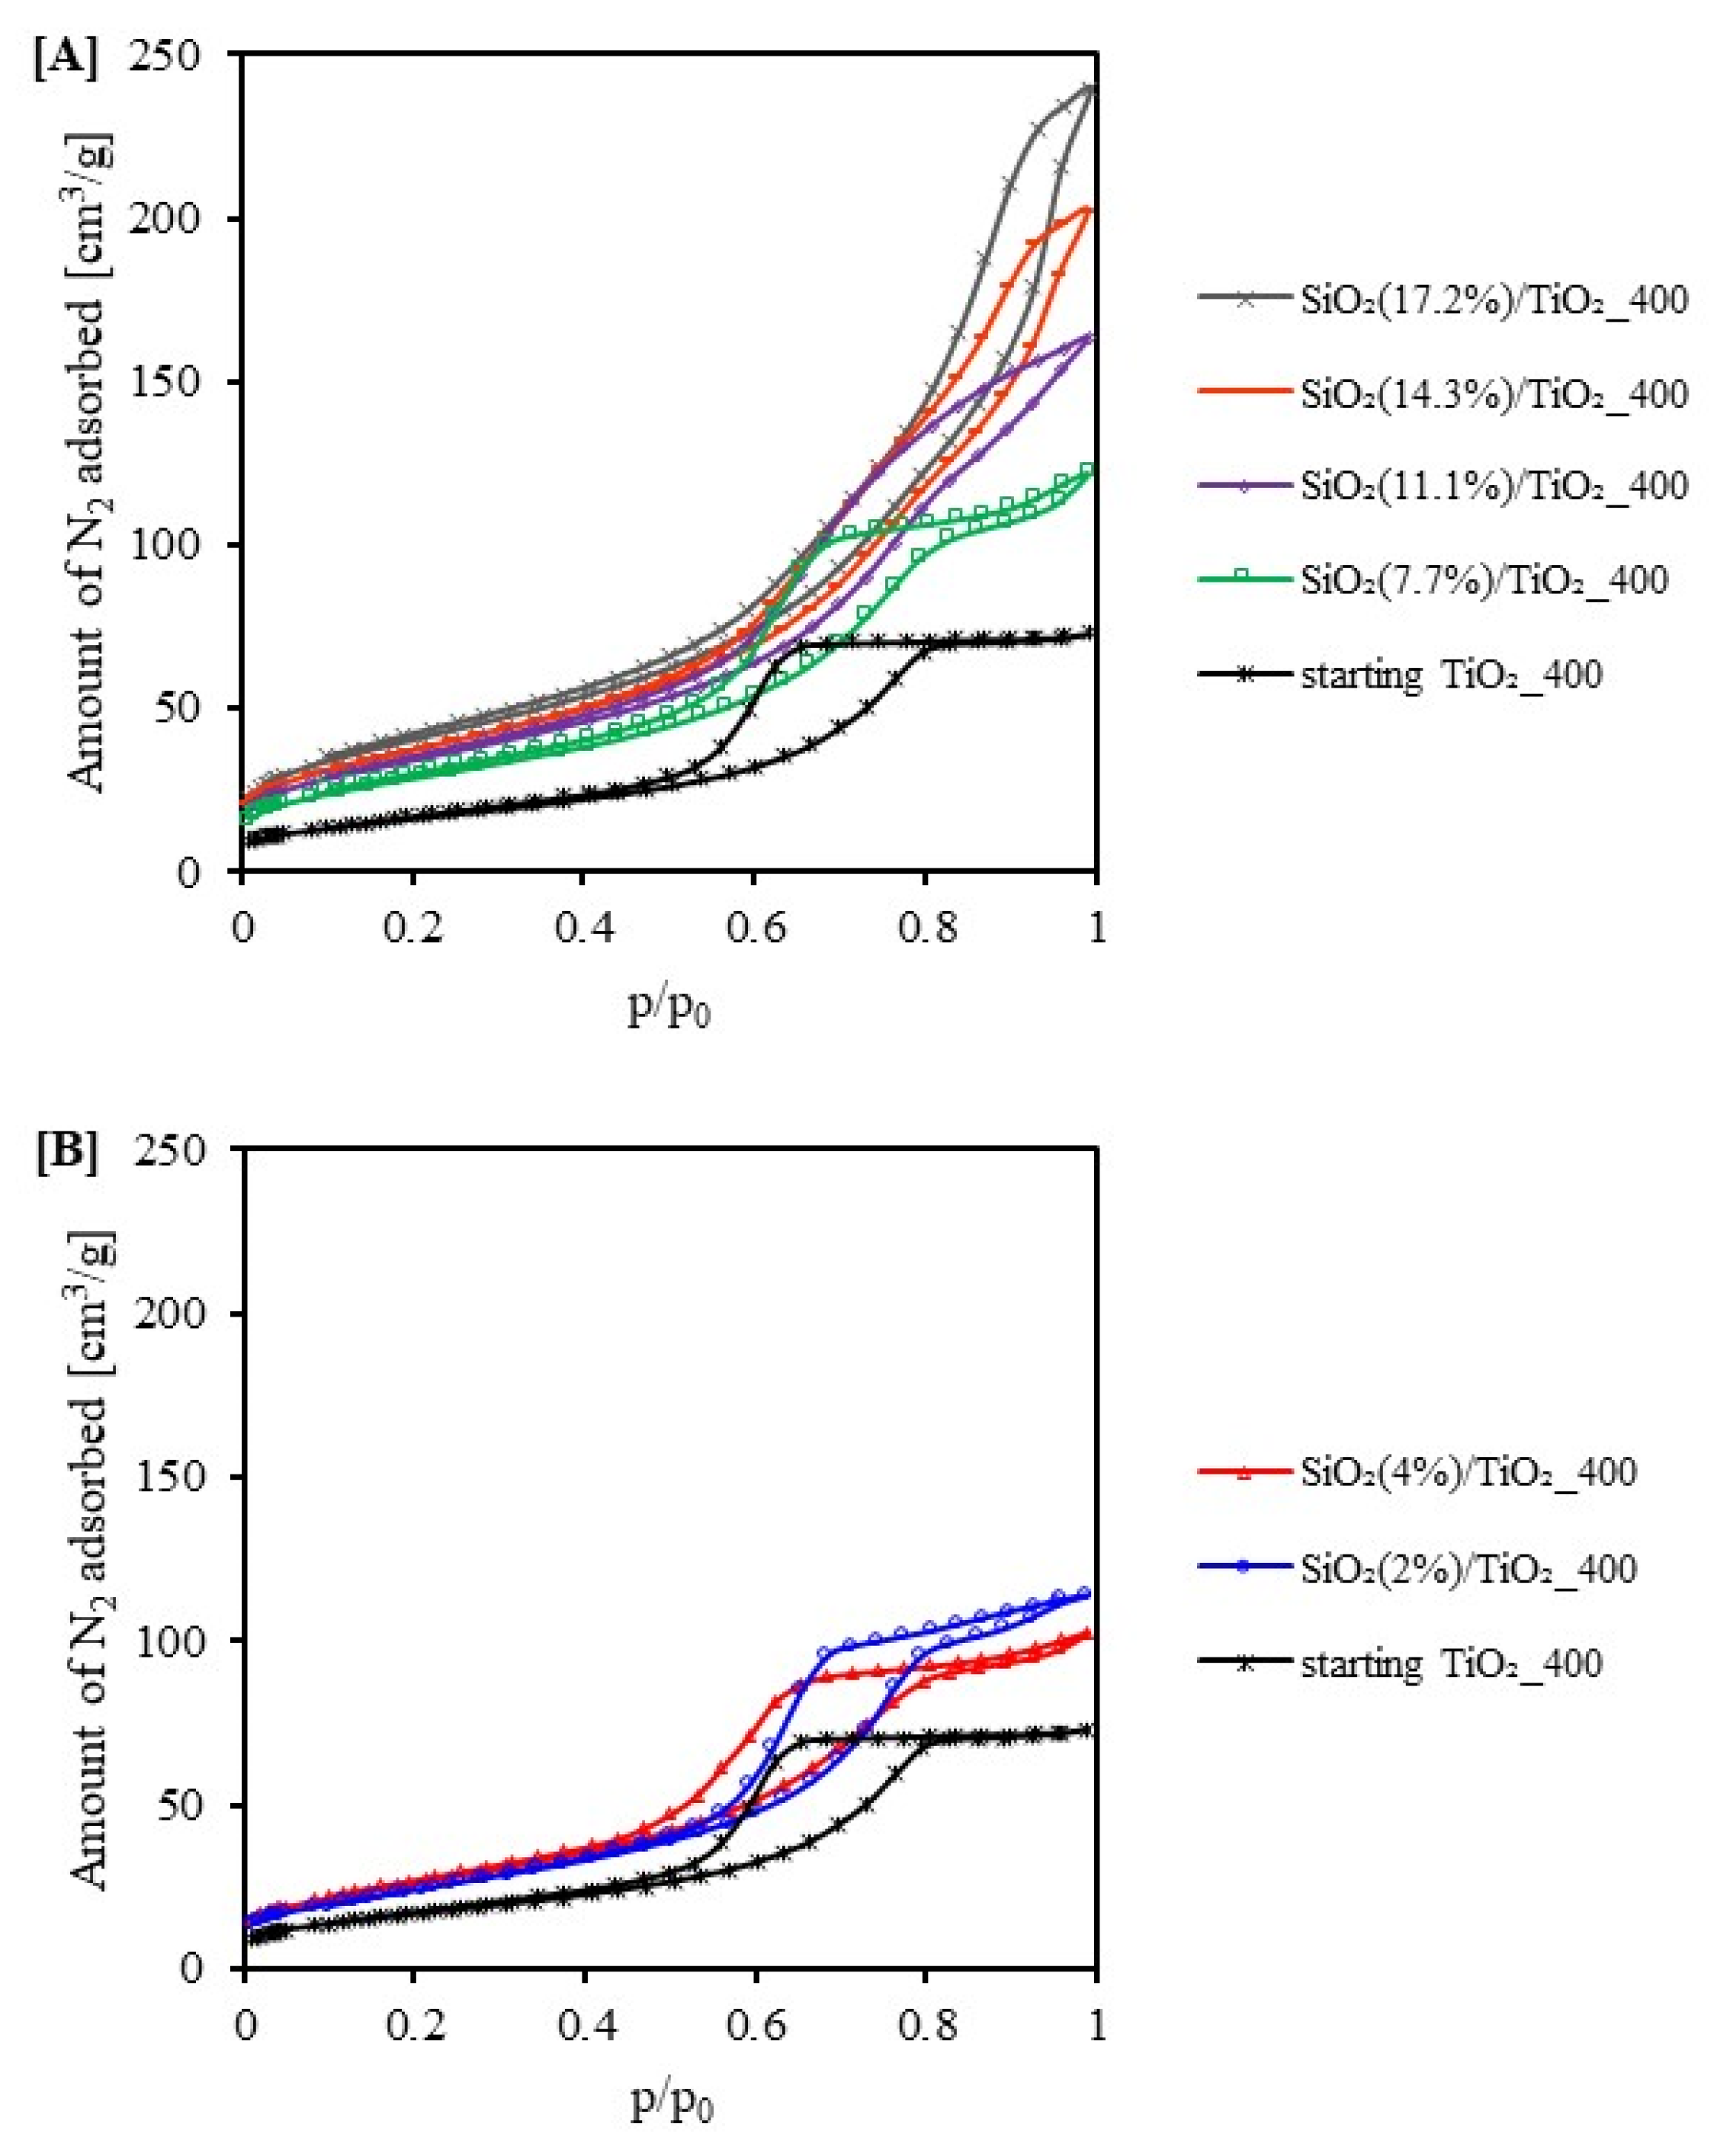
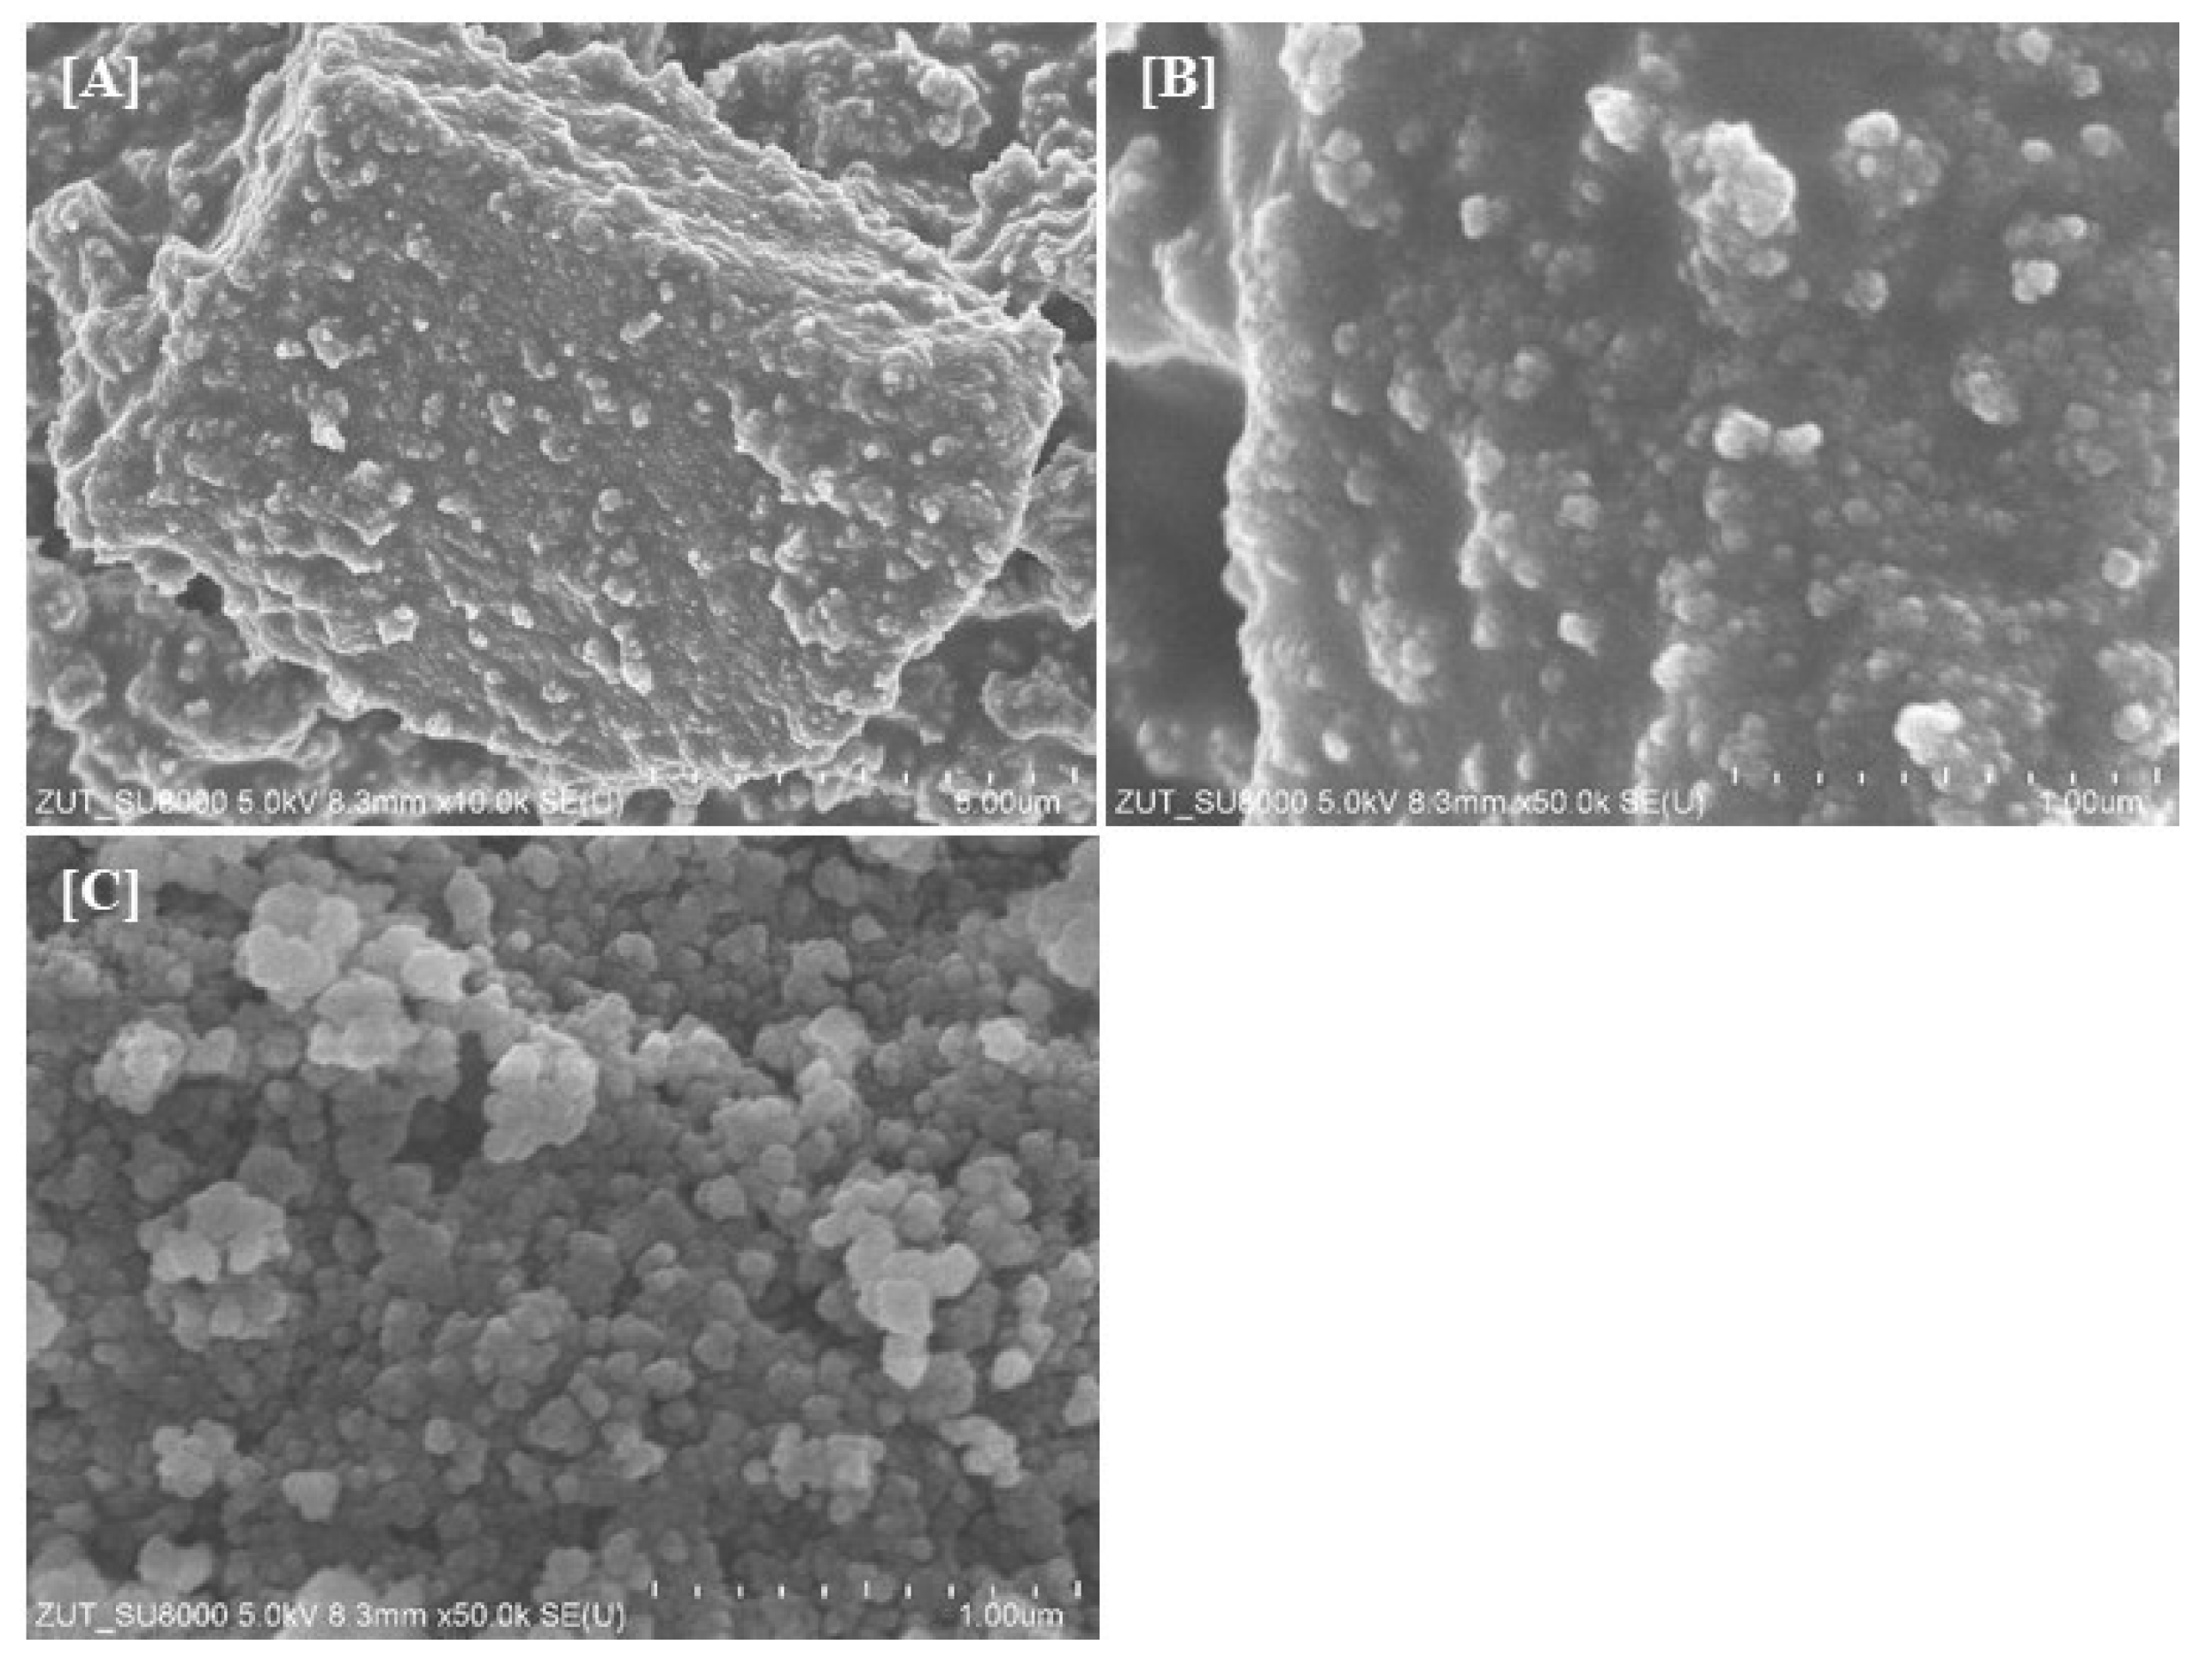
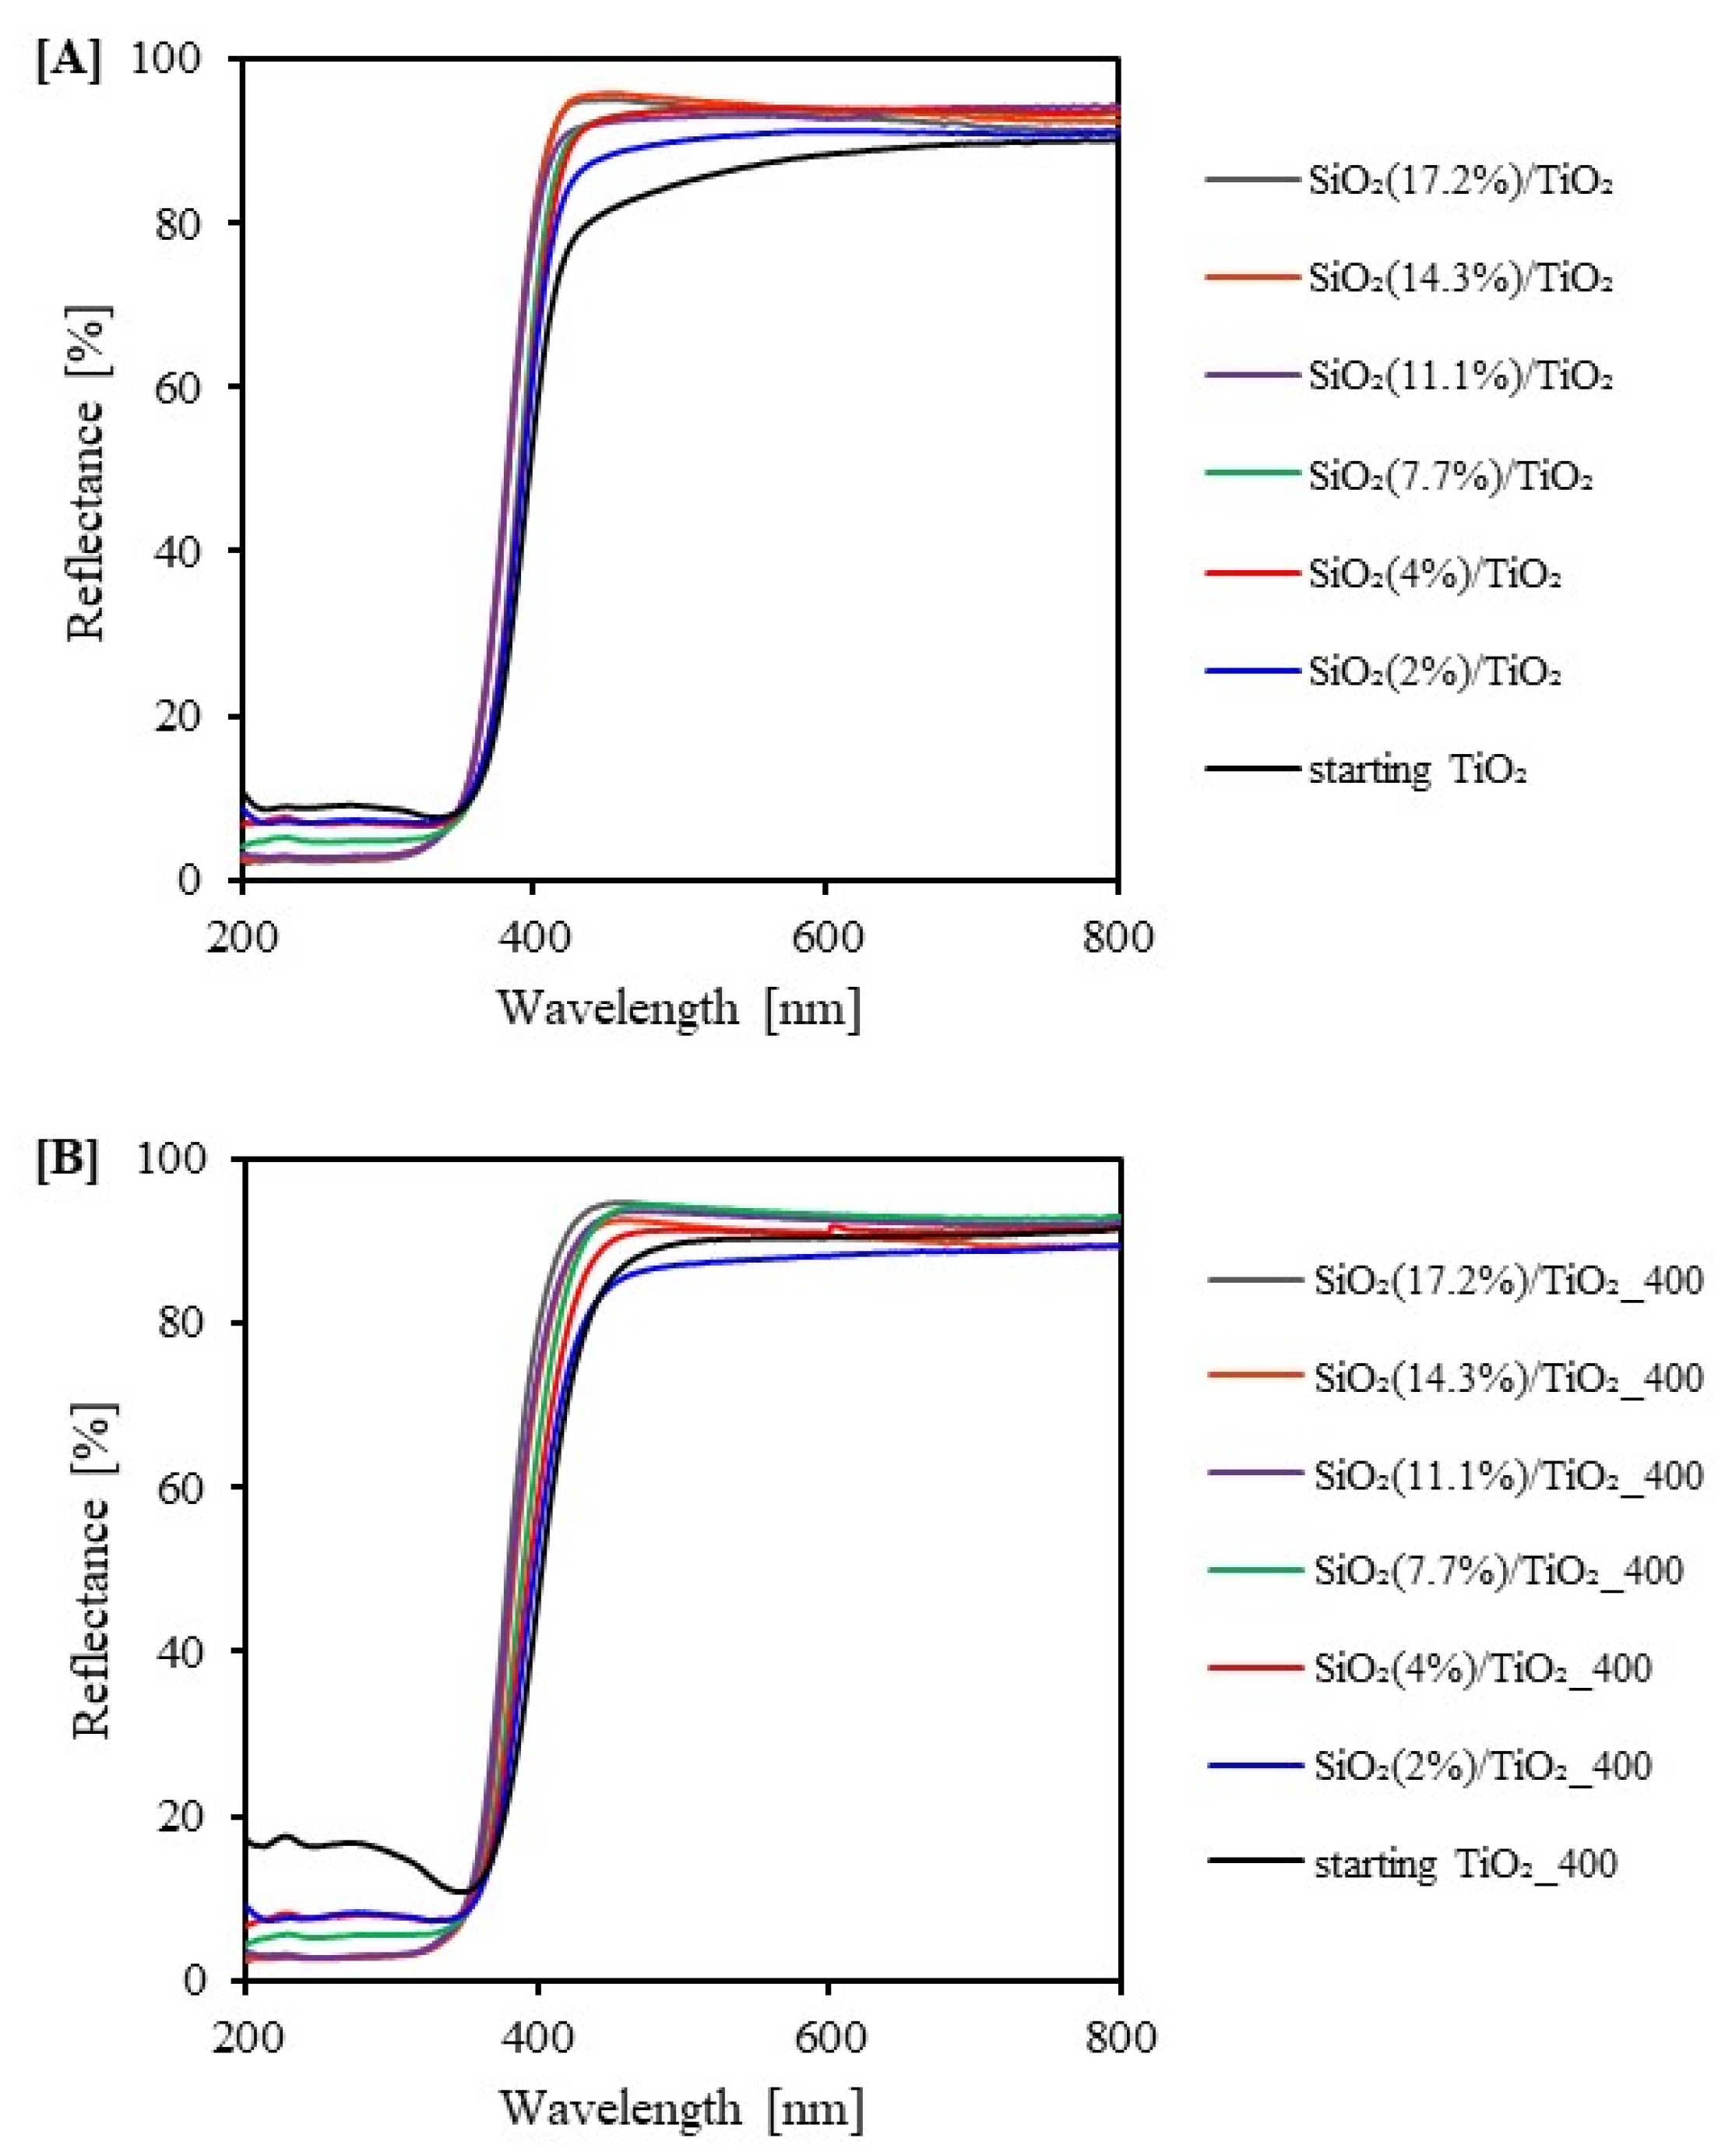
2.1. Characterization of the Photocatalysts

The surface character of the prepared TiO2 samples was analysed by FT-IR/DRS spectroscopy. In Figure 1A,B, the FT-IR/DR spectra of starting TiO2, silica-modified TiO2 and samples calcined in an argon atmosphere are shown. All spectra presented characteristic bands for TiO2-based nanomaterials. Analysing the obtained spectra, the bands in the range of 3730–2500 cm−1 attributed to the stretching mode of O–H group were confirmed [27]. As can be seen from Figure 1A,B, the intensity of the mentioned peaks increased with the increasing amount of silica used for modification. It was related to the presence of Si–OH groups and adsorbed water formed by silica deposition on titanium particles [28]. After the calcination process (see Figure 1B), a decrease in the intensity of this band was observed compared to the unheated materials due to the change in the content of hydroxyl groups on the semiconductor surface [29]. The narrow band located at 1610 cm−1 is characteristic of the vibrations of molecular water bending mode [30]. Band located at 3710 cm−1 corresponds to the OH groups surface-bonded to titanium [31,32]. At 930 cm−1, an intense band assigned to the O–Ti–O stretching modes was observed, and for photocatalysts modified with silica, the band in question was slightly shifted, which indicates the presence of interaction between titanium and silicon [33]. After silica modification, a new band located at 1160 cm−1 attributed to the asymmetrical stretching of Si–O–Si bonds was noticed [34]. It can be noted that the intensity of the upper-mentioned peak increased with the increase in silica amount used for TiO2 modification. The peak noticed at 1780 cm−1 was ascribed to the C=O stretching vibration.
In Figure 2A,B, the XRD diffraction patterns of the starting TiO2, silica-modified TiO2 and samples calcined in an argon atmosphere are shown. The phase composition and average crystallite sizes of the studied samples are compared in Table 1. It should be noted that the presented results refer to the crystalline phase. Based on the analysis of obtained data, the presence of reflections characteristic of anatase and brookite was found. The characteristic reflections (101), (004), (200), (105), (204), (116), and (215), corresponding to the anatase phase, were recorded at 2θ = 25.6, 38.6, 48.8, 55.2, 63.6, 70.1, and 76.3°, respectively (JCPDS 04-002-8296 PDF4+ card). Two reflections (111), (121) characteristic of the brookite phase were recorded at 2θ = 25.6 and 30.3° (JCPDS 04-007-0758 PDF4+ card). The reflection from brookite located at 2θ = 25.6° overlapped with the reflection characteristic of anatase. Therefore, the size of brookite crystallites was calculated based on the reflectance located at 2θ = 30.3°. The presence of the brookite phase was due to the use of hydrochloric acid as a catalyst for the hydrolysis reaction of titanium(IV) isopropoxide [35]. It can be noted that calcination at 400 °C did not contribute to the phase transition of anatase to rutile, and this is a typical phenomenon because the phase transition of anatase to rutile occurs at temperatures above 600 °C [36]. It is also worth noting that the reflections narrowed and sharpened after calcination. This was attributed to eliminating defects at grain boundaries during heating at higher temperatures [37]. According to the data in Table 1, the anatase to brookite ratio remained similar, i.e., 59:41, only when the amount of silica precursor introduced was 11.1wt.% the anatase content started to increase. This can be explained by the fact that the amorphous phase was not included in the presented results. As it is known, silica used for modification was amorphous. Therefore, the observed increase in the anatase phase with increasing SiO2 content may be overestimated by up to 20–30%. After the calcination process, a decrease in brookite content was observed, which was related to the greater crystallization of anatase than brookite. Only when the amount of silica precursor introduced was 11.1wt.% the brookite content start increasing, which was related to the crystallization process progress. It should also be noted that the calcination process had a significant effect on the increase in average anatase and brookite crystallite size. The average crystallite sizes of anatase for non-calcined materials were 4–5 nm and 8–16 nm for the calcined samples. In contrast, the crystallite sizes of brookite ranged from 2 to 6 nm for non-calcined photocatalysts and 7–9 nm for calcined photocatalysts. This indicates an increase in the crystallinity of samples after calcination. However, comparing the crystallite size of SiO2/TiO2 materials after heating with starting TiO2_400 sample, it can be observed that the crystallite size of anatase and brookite was smaller for silica-modified photocatalysts than for the sample without SiO2 addition. For example, the size of anatase crystallites for starting TiO2_400 was 14 nm, while for the SiO2(17.2%)/TiO2_400 sample, it was only 8 nm. According to Xu et al. [38] and Lu et al. [39], silica can effectively prevent the growth of TiO2 crystallites during the calcination process.
The adsorption–desorption N2 isotherms of starting TiO2 and the SiO2/TiO2 materials are shown in Figure 3 and Figure 4. It can be noted that the samples presented three kinds of isotherm types. Most of the photocatalysts (starting TiO2, SiO₂(2, 4%)/TiO₂, starting TiO2_400, SiO₂(2–7.7%)/TiO₂_400) displayed a typical type IV isotherm with an H3 hysteresis loop, which is characteristic of mesoporous materials, according to the IUPAC classification [40]. The H3-type hysteresis loop does not show any adsorption limit in the high relative pressure range and is characteristic of slotted pores [41,42]. The sample (starting TiO2) showed a type I isotherm characteristic of microporous materials. On the other hand, SiO₂(2%)/TiO₂ and SiO₂(4%)/TiO₂ isotherms in the initial p/p0 range were defined as type I isotherm, and in the intermediate and higher pressure range as type II isotherm. The isotherms of starting TiO₂_400, SiO₂(2%)/TiO₂_400, SiO₂(4%)/TiO₂_400 and SiO₂(7.7%)/TiO₂_400 samples demonstrated an asymmetric and triangular type H2 of the hysteresis loop, what was attributed to blockage of pores/percolation in a narrow range of pore necks [40,43]. For starting TiO2, the hysteresis loop did not occur.
Table 1 shows the specific surface area value and the pore size distribution for all the obtained materials. The specific surface area of the starting TiO2 was 193 m2/g. The values presented in Table 1 show that the photocatalysts modified with silica were characterized by a higher specific surface area (up to 234 m2/g) in comparison to the materials obtained the same way but without the addition of SiO2. The average size of anatase crystallites has not changed. Therefore, the use of silica in the titanium dioxide modification process contributed to the increase in the specific surface area of the photocatalysts. The specific surface area of the silica used for modification was >200 m2/g [44]. Bao et al. [45] also observed an increase in the surface area for the materials modified with silica. In this case, the specific surface area changed from 15.4 m2/g for pure TiO2 to 127.7 m2/g for silica-modified TiO2. Table 1 noted that, as the SiO2 content increased, the total pore volume also increased. This is a normal phenomenon associated with an increase in the size of a specific surface area. For example, the pore volume for the starting TiO2 was 0.109 cm3/g, and for SiO2(17.2%)/TiO2 was 0.366 cm3/g. It can be concluded that the SiO2 modification had a significant effect on the increase in SBET and the total pore volume. After the heat treatment, the specific surface area of the reference photocatalysts decreased from 193 m2/g for the starting TiO2 sample to 54 m2/g for the sample calcined at 400 °C (starting TiO2_400). Thus, the correlation between calcination and the decrease in the size of the specific surface area is possible to observe. Calcining titanium dioxide causes the sintering and agglomeration of TiO2 particles, which then results in a decrease in the size of the specific surface area [46]. It should also be noted that the specific surface area did not decrease in the range of materials after calcination. This is related to the relatively large specific surface area of silica and the fact that the addition of silica inhibits the growth of crystallites. The specific surface area of photocatalysts changed from 54 m2/g for the starting TiO2_400 to 146 m2/g for the SiO2(17.2%)/TiO2_400 sample.
Scanning electron microscope analysis in the SE (secondary electron) mode was conducted to determine the morphology of obtained photocatalysts and the approximate size of agglomerates/aggregates that form SiO2/TiO2 particles. Figure 5A–C shows example SEM images for the starting TiO2 and the SiO2(14.3%)/TiO2_400 sample. The SEM images shown in Figure 5A,B indicate that the particles of starting TiO2 form large aggregates consisting of finely agglomerated particles and larger clusters at the periphery, forming a matrix of large aggregates. An irregular and indeterminate shape characterized the individual particles. It is also worth noting that the TiO2 particles were embedded in unreacted TTIP matrix. After the modification process using SiO2 and calcination in an argon atmosphere, the grains had a more regular spherical shape. An increase in the size of photocatalyst aggregates was also observed after modification (350–500 nm) compared to the starting TiO2 (150–350 nm). This results from the tendency of silica particles to form larger structures [47]. In addition, silica can effectively prevent the growth of TiO2 crystallites after calcination, and it is well known that the tendency of particle agglomeration/aggregation is especially observed for small particles [38,39]. Both the starting TiO2 and SiO2(14.3%)/TiO2_400 particles tended to form large aggregates. However, it can be noted that the aggregation ability of the photocatalyst particles increased due to the modification of titanium dioxide with silica.
In Figure 6A,B, the UV-Vis/DR spectra of starting TiO2, silica-modified TiO2 and samples calcined in an argon atmosphere are shown. The SiO2/TiO2 materials exhibited typical absorption of radiation in the UV area due to the intrinsic absorption of TiO2 [48]. For the starting TiO2_400 sample, an absorption peak was observed at 305 nm, which was related to the transition of an electron from the valence band (O 2p) to the conduction band (Ti 3d) [49]. Compared with the reference sample, all silica-modified materials showed a shift in the absorption edge toward lower wavelengths (blue shift). The values of the band gap energy of SiO2/TiO2 photocatalysts were higher than the starting TiO2 because of the blue shift that occurred due to modification. According to the literature [45], the increase in the value of band gap energy can be attributed to the quantum effect. This increase in the value of band gap energy causes a decrease in the energy valence band and an increase in the edge of the conductivity band, which may lead to the slowdown of the electron–hole pair recombination process. In turn, the slowing the electron–hole pair recombination process contributes to the increase in photocatalytic activity.
According to the data presented in Table 2, silica modification did not change the surface character of the tested materials. After the modification, the surface of the SiO2/TiO2 photocatalysts remained positively charged, as did the surface of the reference sample without any SiO2 content. Silicon-derived bands were observed on the FT-IR spectra of the studied samples. Ferreiry-Neto et al. [50] showed that modification of TiO2 with silica causes a decrease in the zeta potential. Therefore, the TiO2 photocatalysts modified with silica showed lower zeta potential values than the starting TiO2. It is also important to note the decrease in zeta potential for SiO2/TiO2 photocatalysts after heating compared to non-calcined materials. Moreover, as the pH increased, the zeta potential value for these samples decreased. The higher the pH, the lower the zeta potential value of tested materials. The SiO2(17.2%)/TiO2_400 sample showed the lowest zeta potential (+14.6 mV). Our observations agree with those of Nowacka et al. [51], who found that the zeta potential decreases with increasing pH value, confirming that the zeta potential value strongly depends on pH.

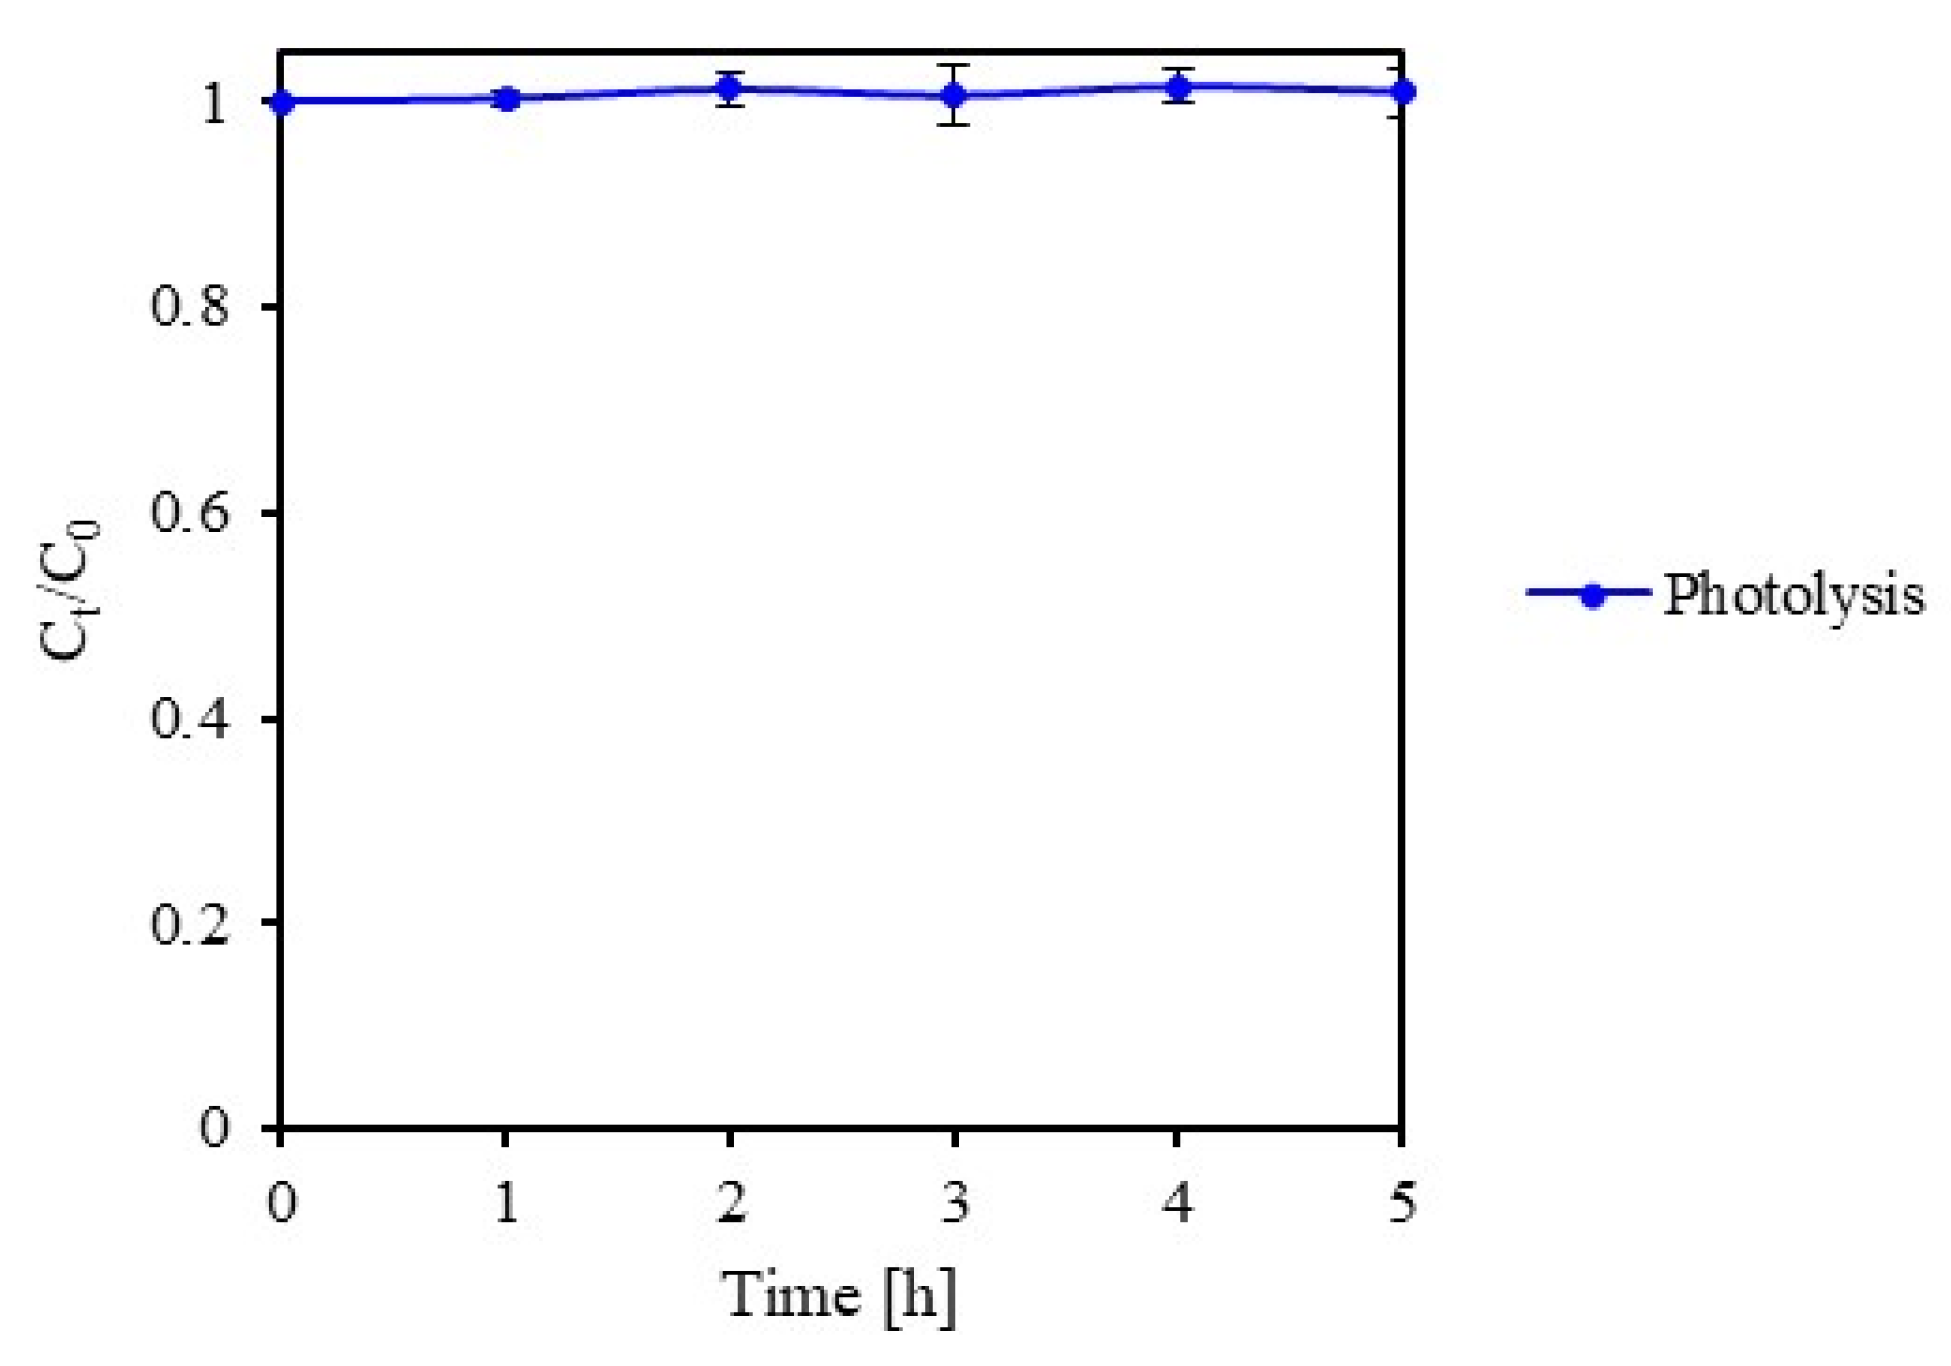
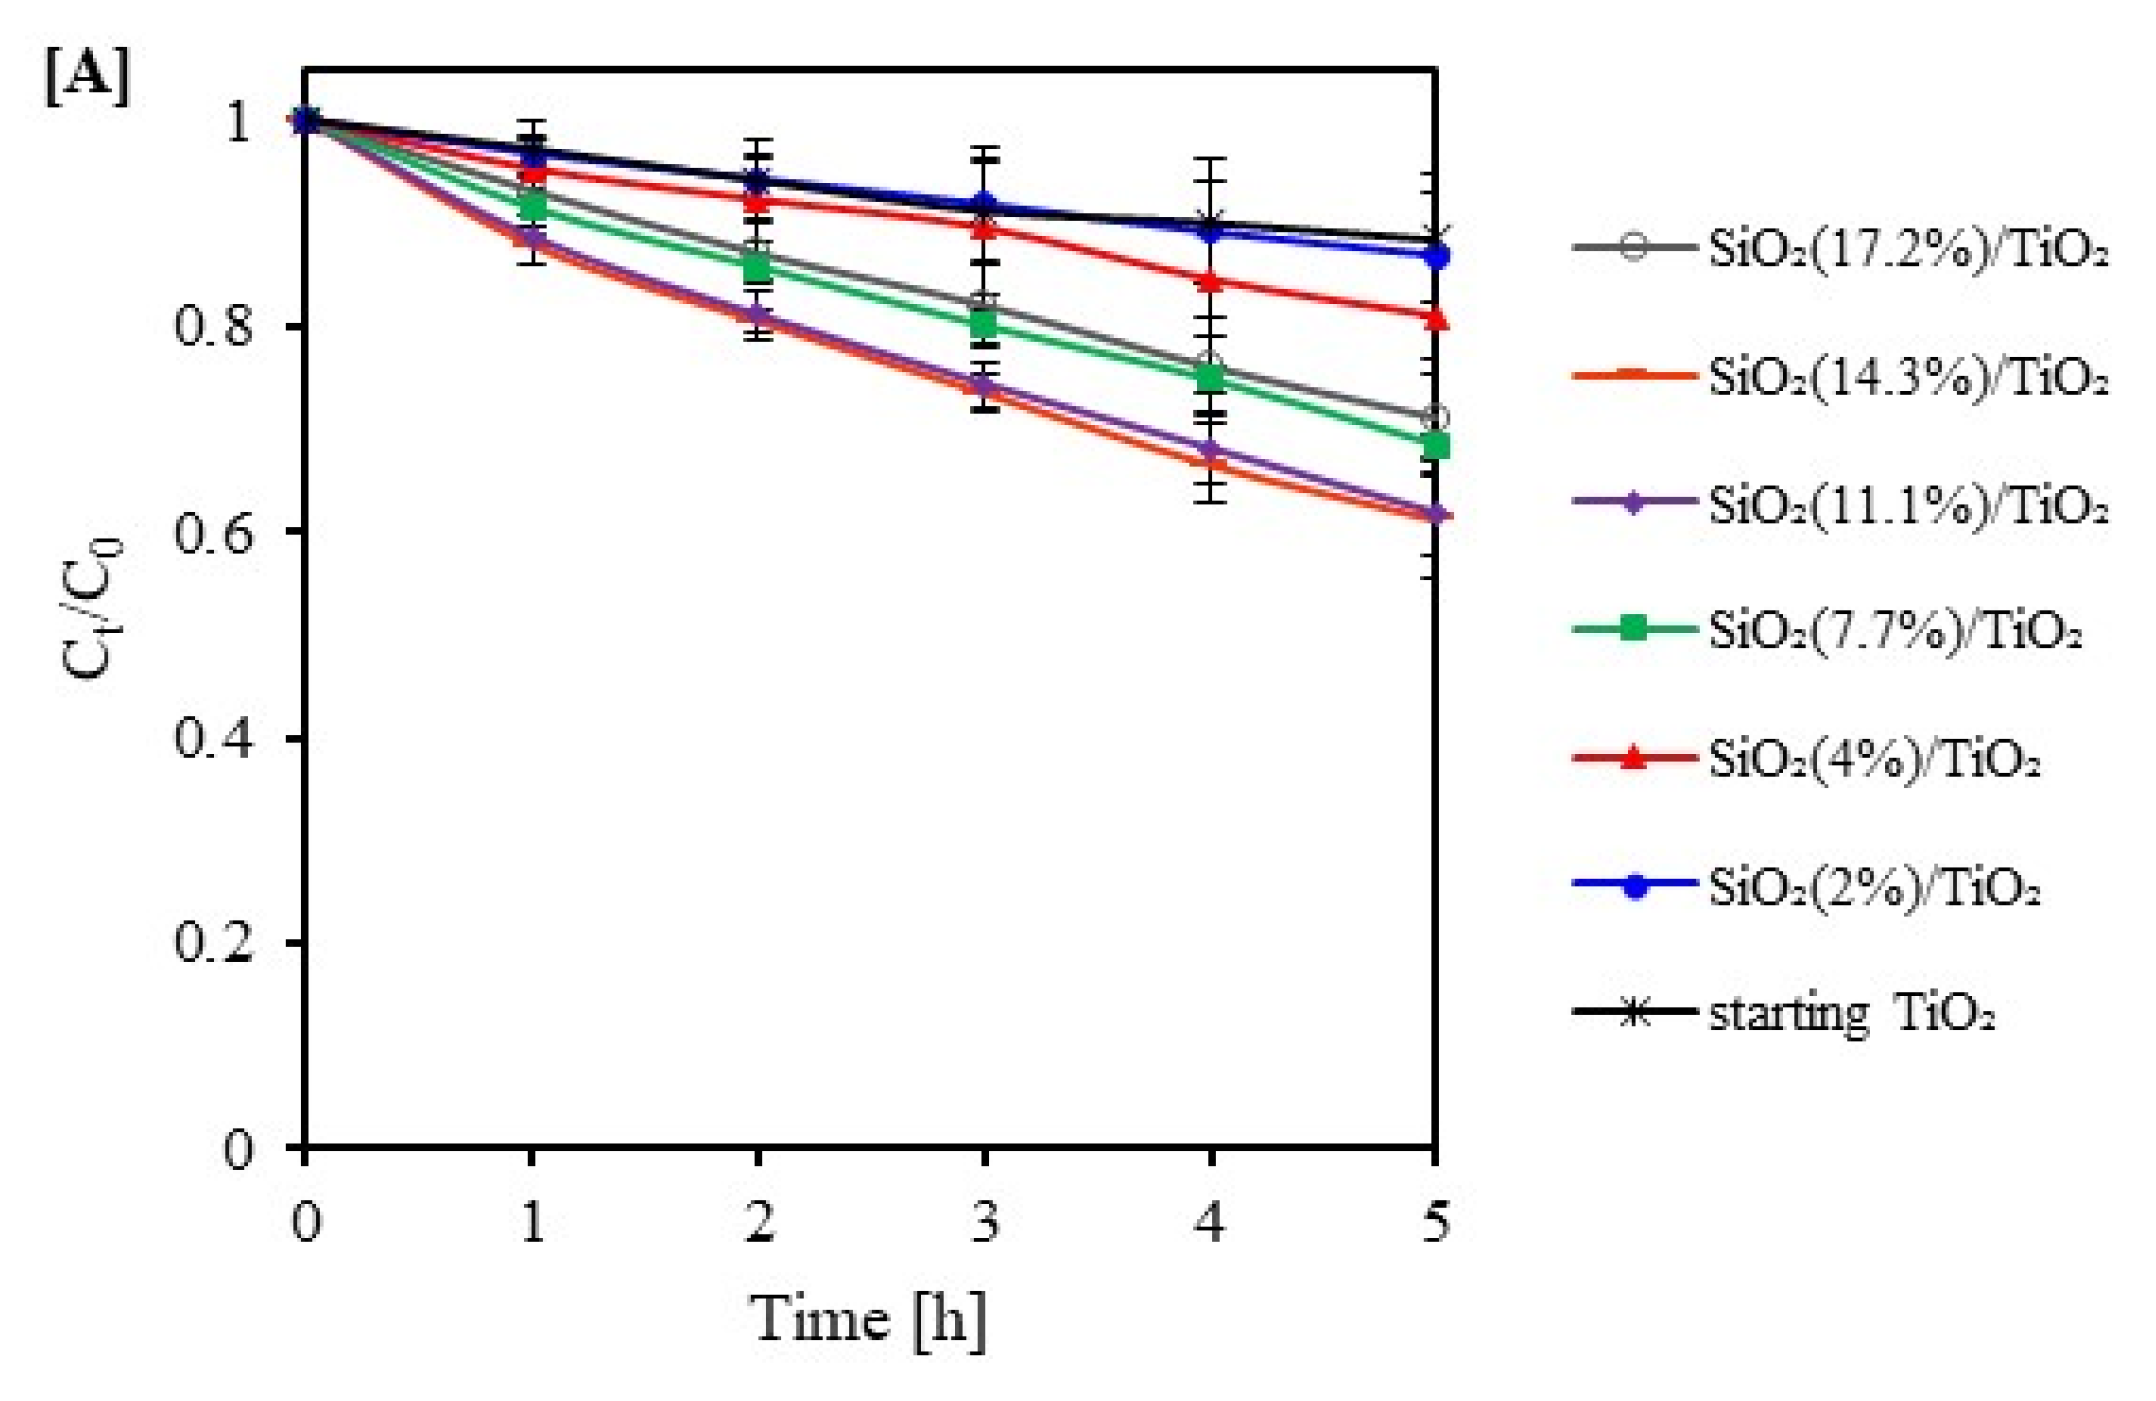
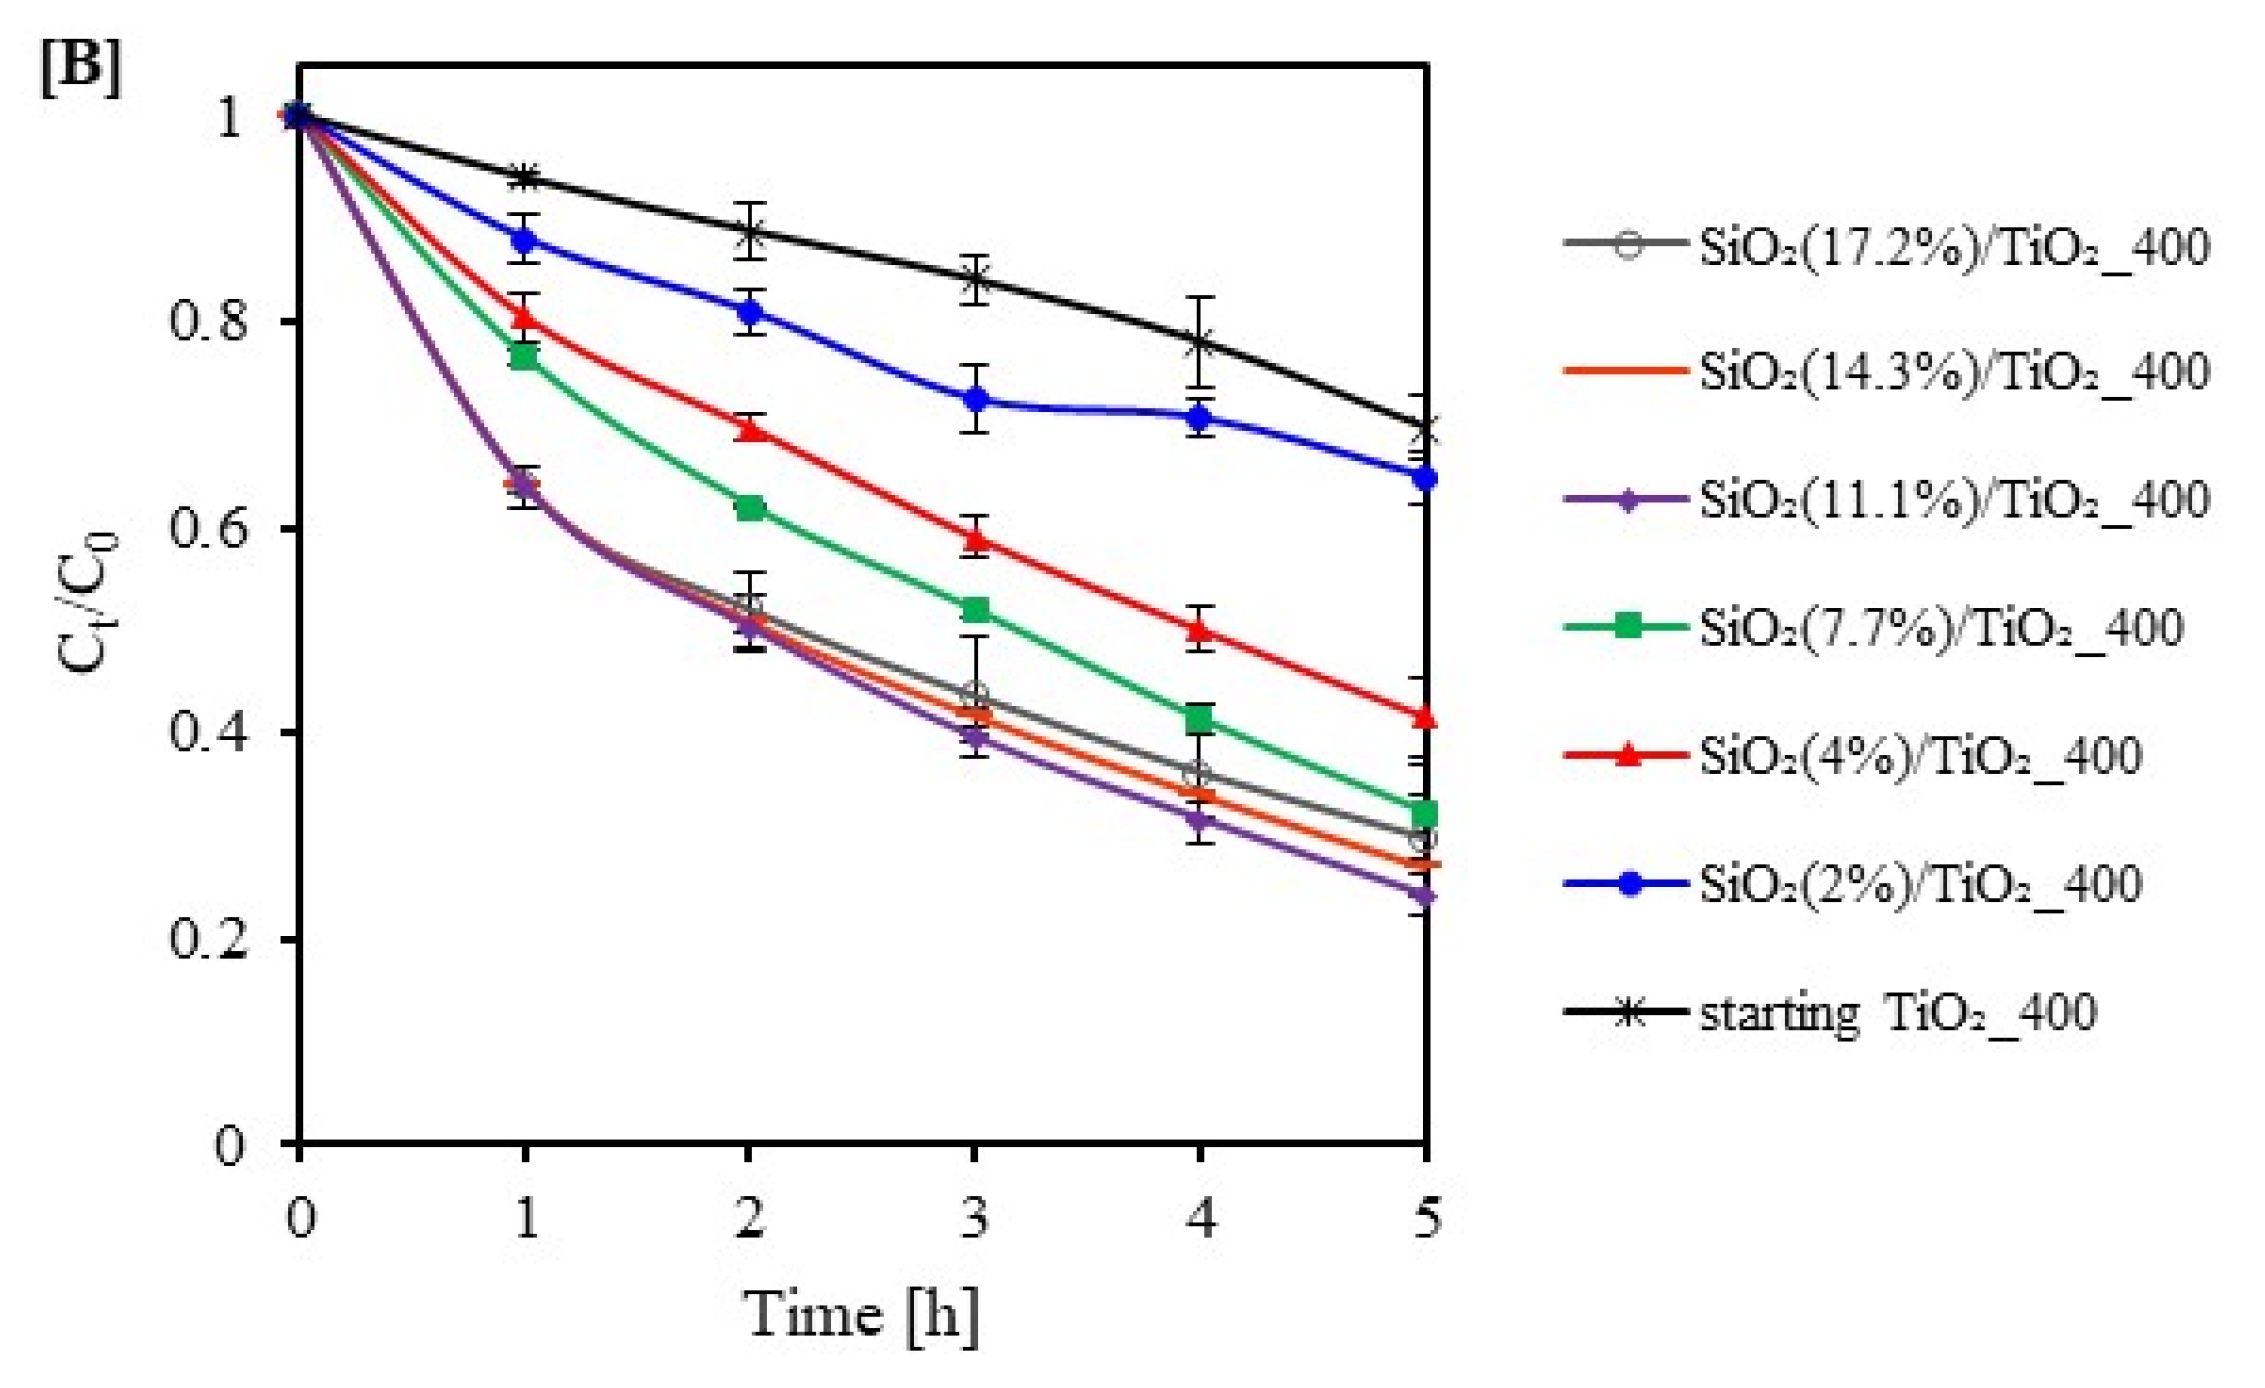
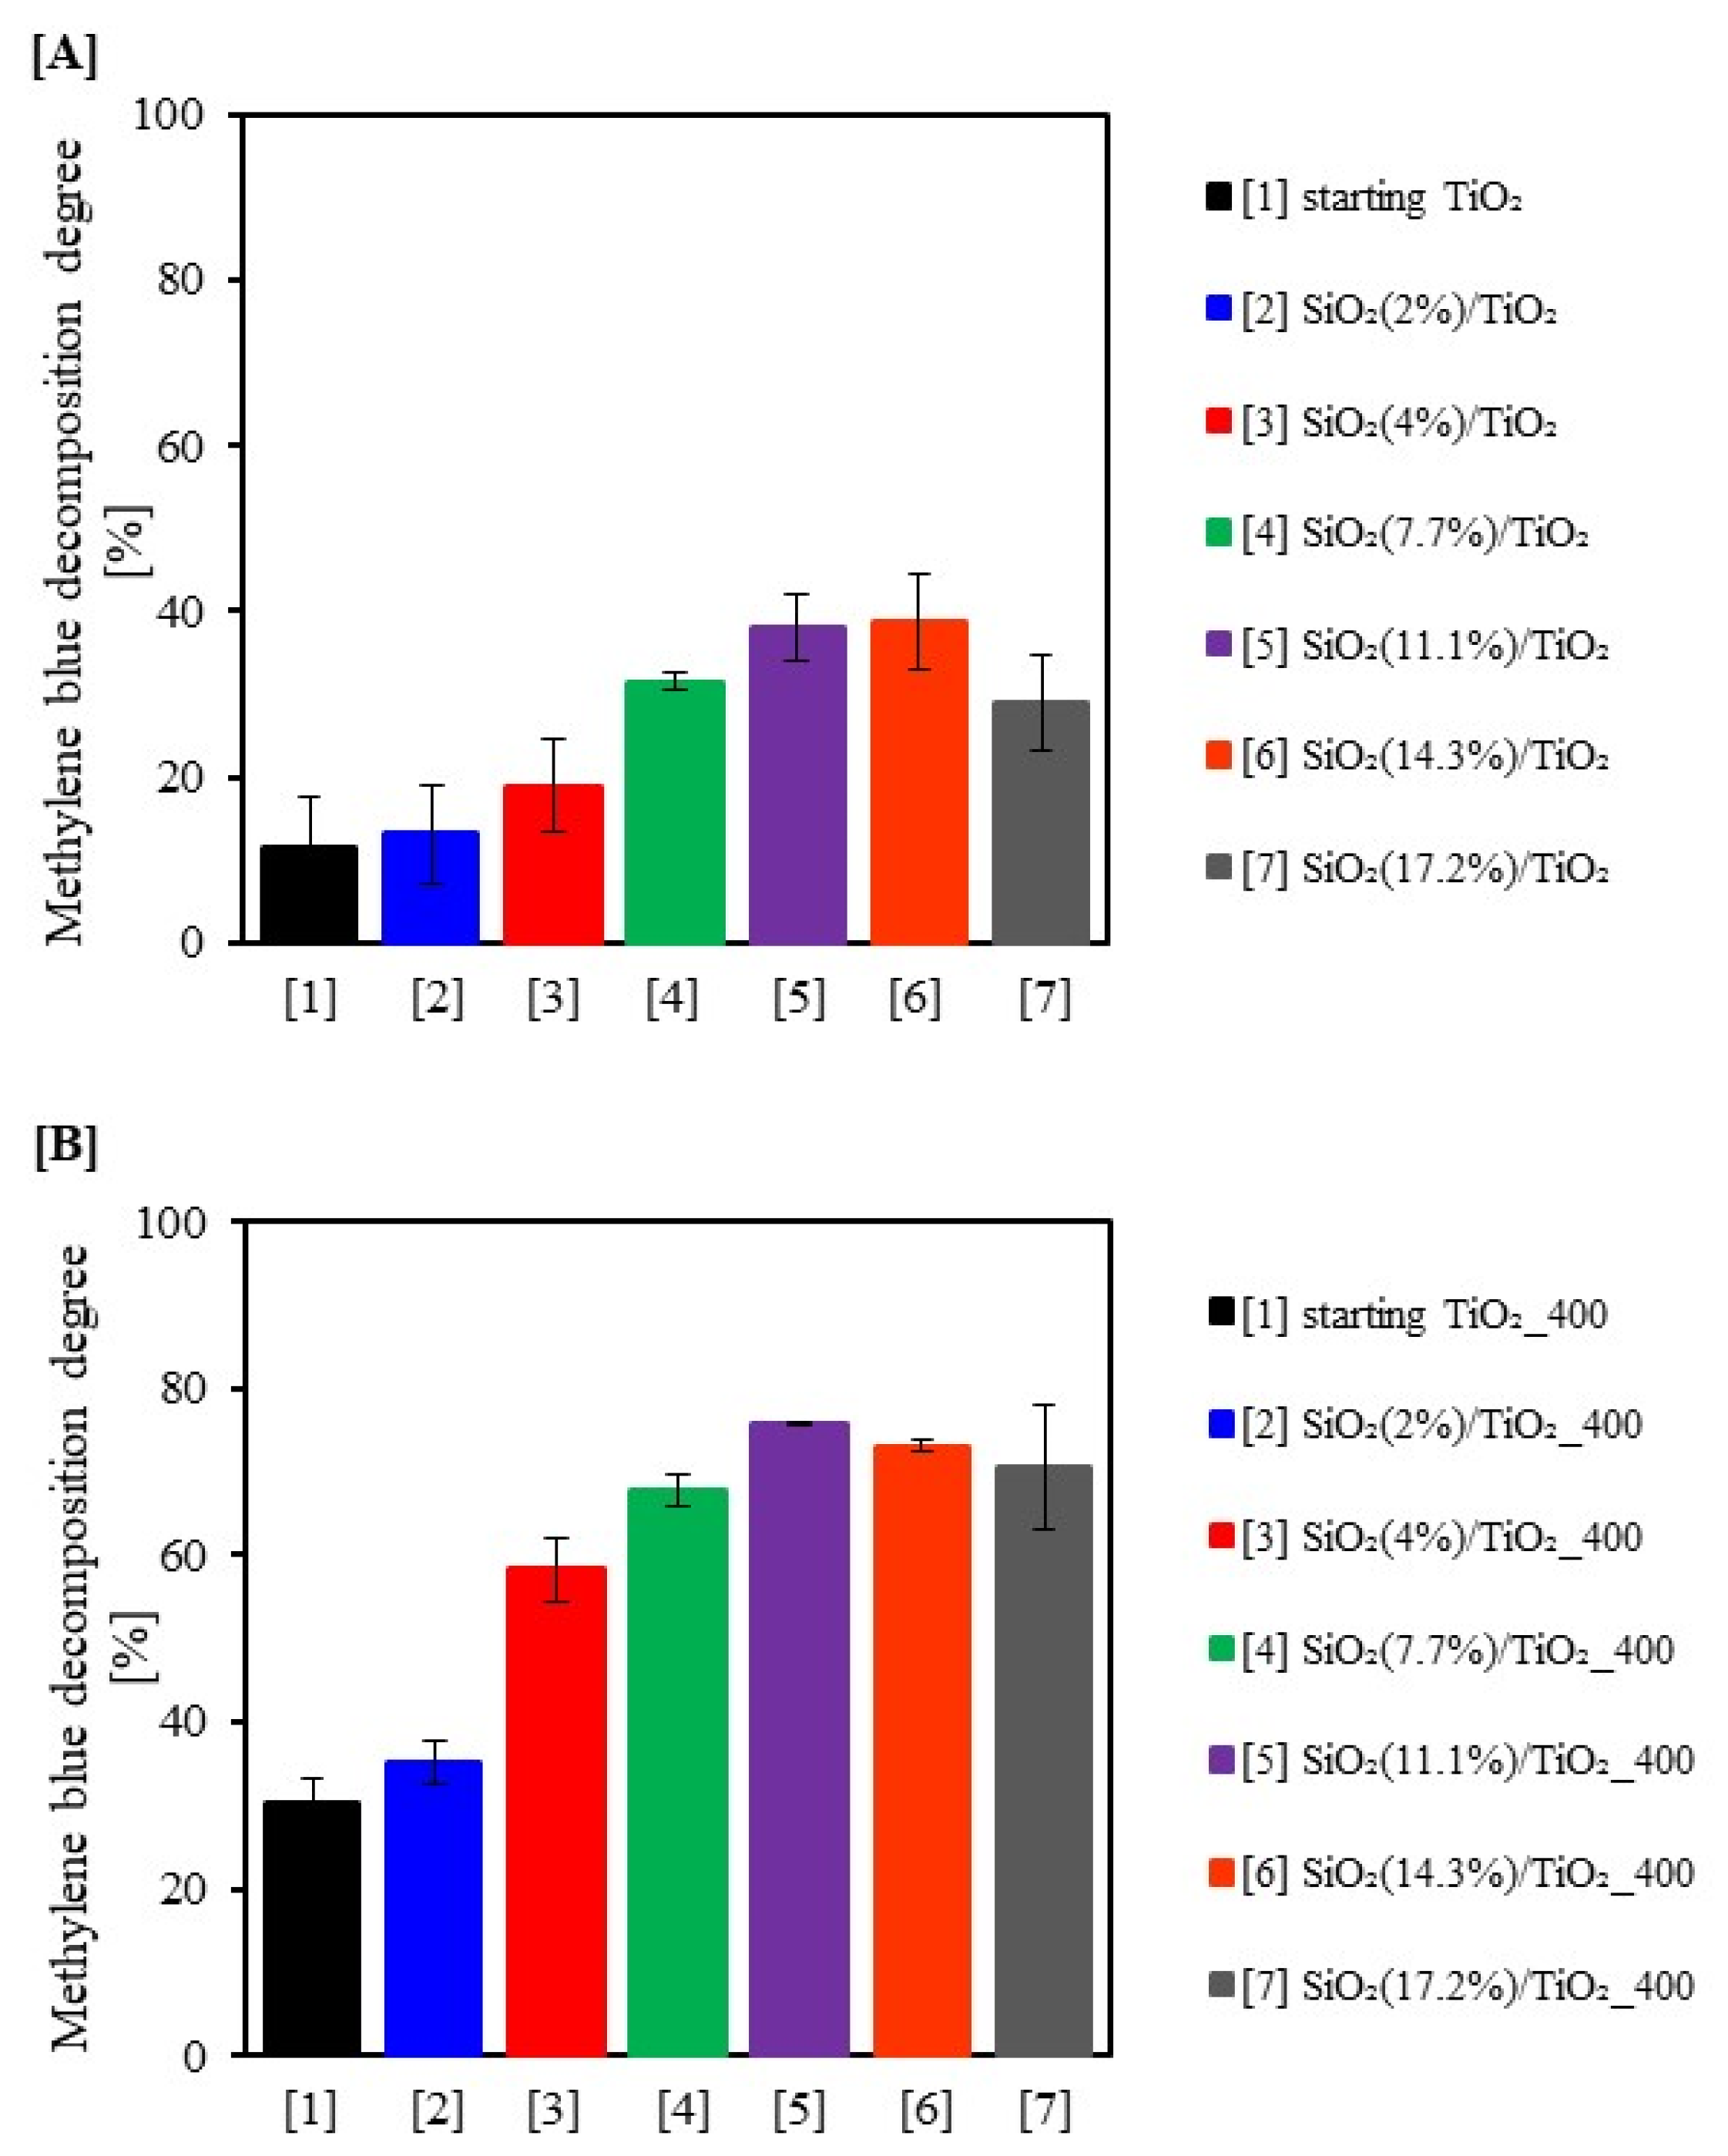
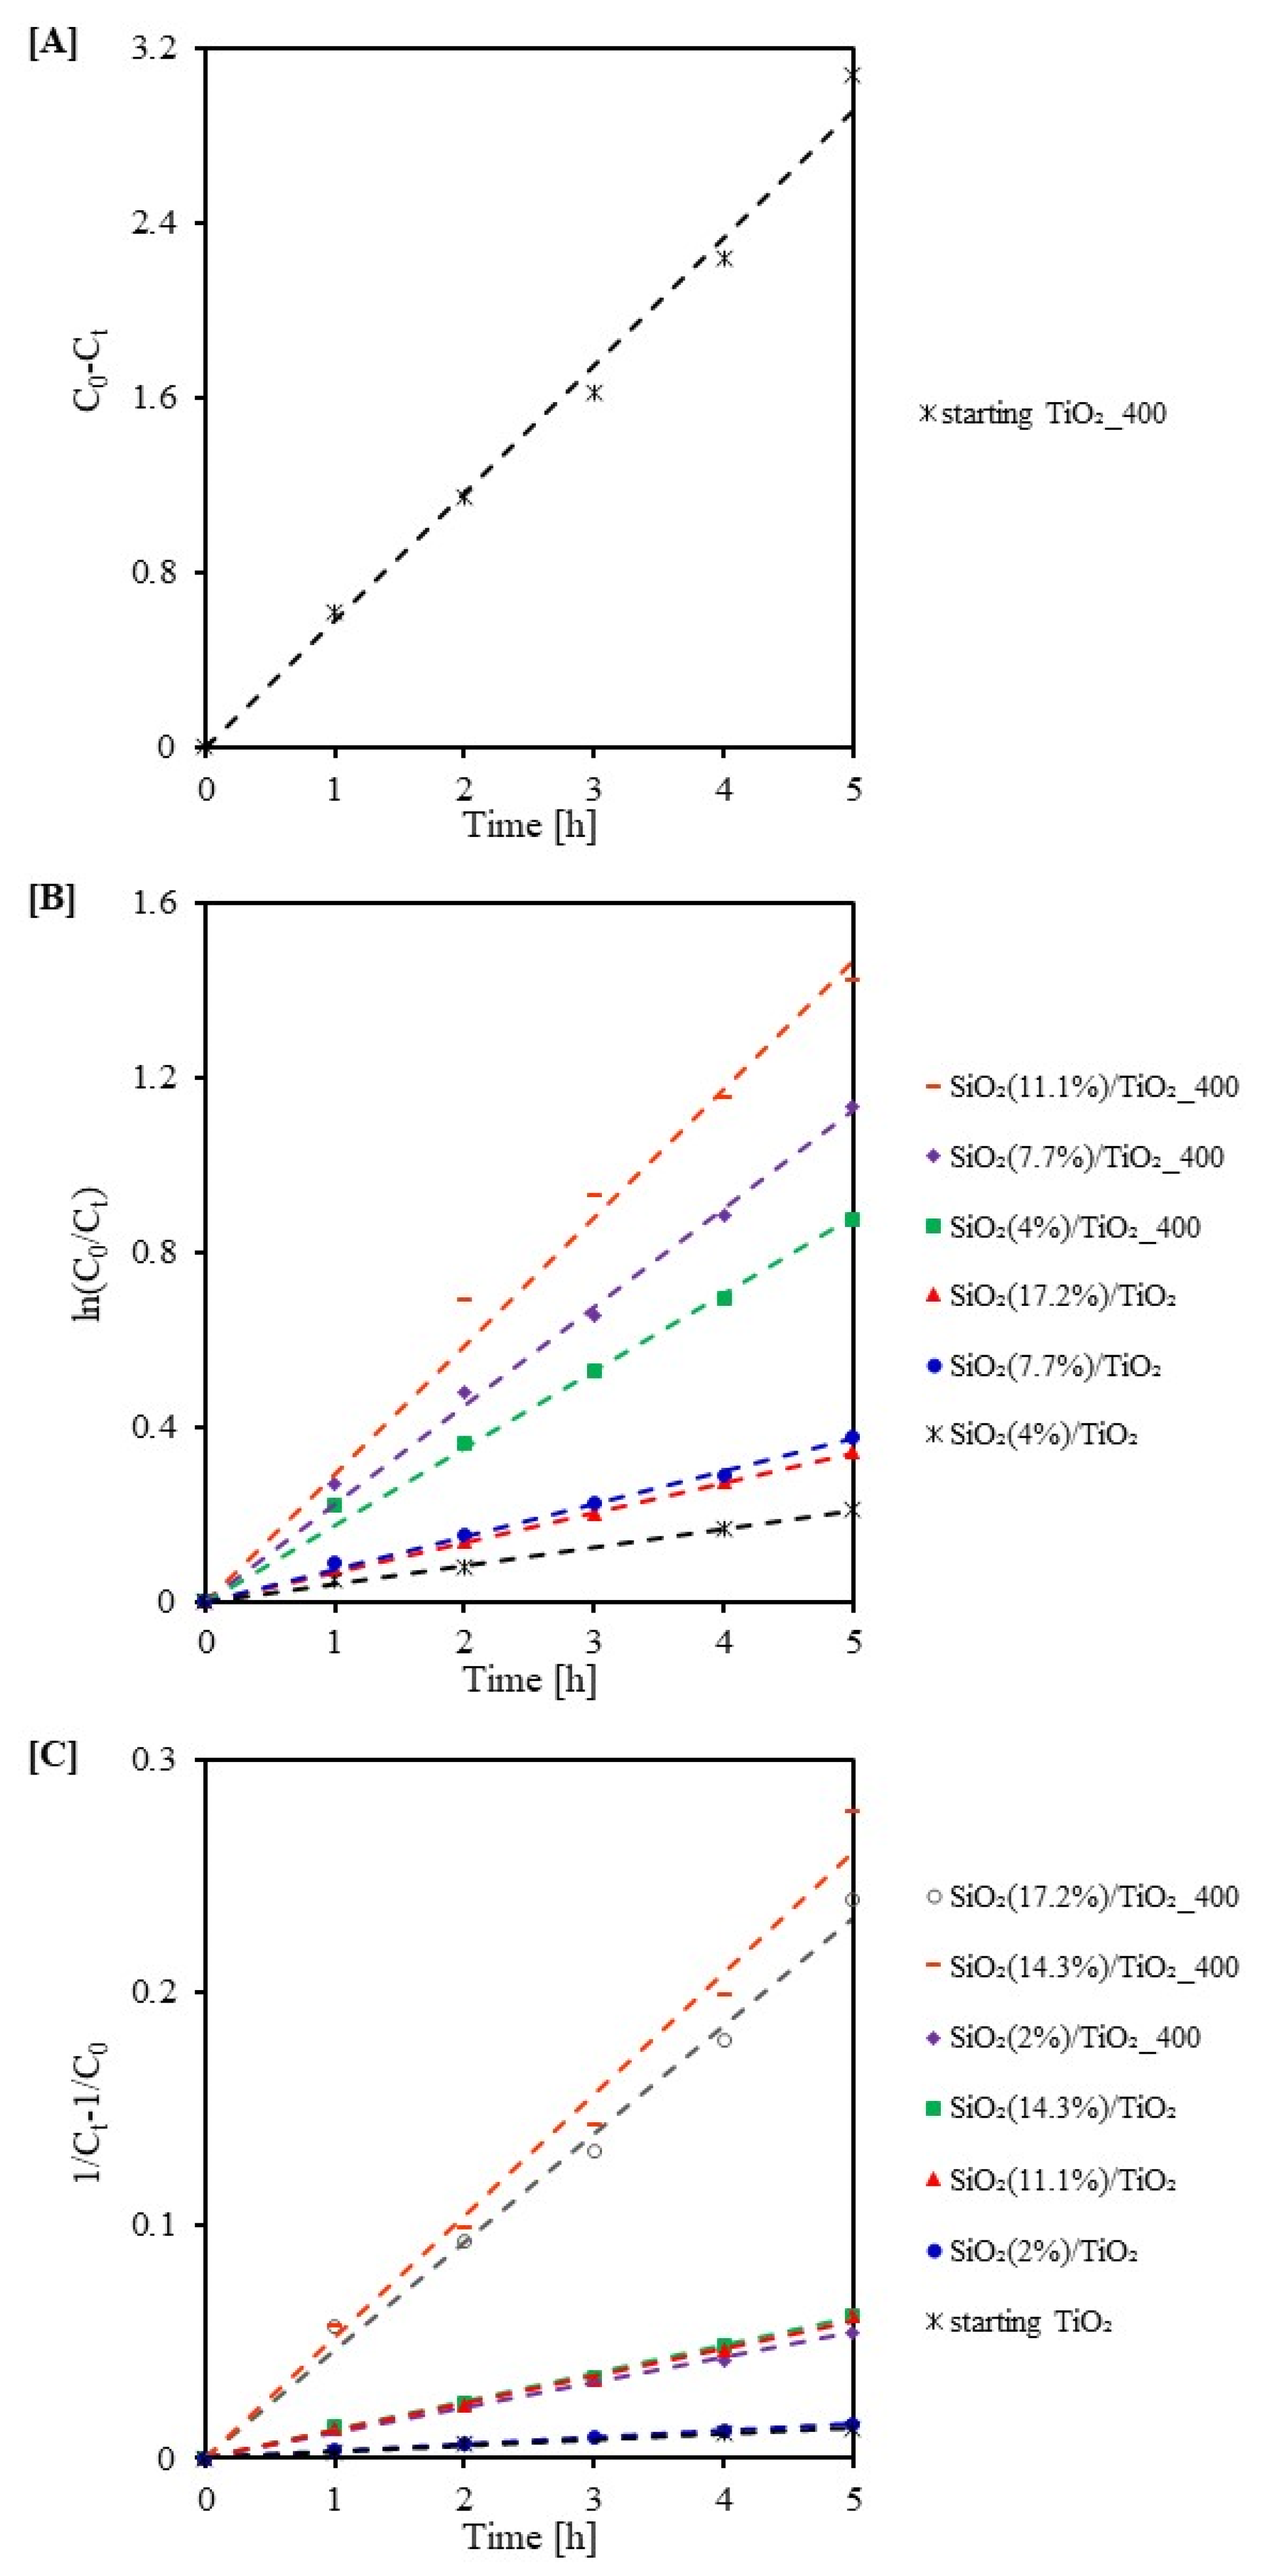
2.2. Photocatalytic Activity Test

The photocatalytic activity of the starting TiO2 and the new silica-modified TiO2 photocatalysts were assessed based on the methylene blue degradation under the influence of UV radiation. The photolysis of dye solution (without the addition of a photocatalyst, see Figure 7) was also investigated. The experiment showed that the MB decomposition due to the photolysis process was negligible (ca. 0.5%). The distribution of methylene blue in the presence of starting TiO2 and TiO2 modified with silica before and after heat treatment is shown in Figure 8A,B. In addition, the results of the dye decomposition rate after 5 h of UV (138 W/m2 UV in the range of 280–400 nm and 167 W/m2 VIS in the range of 300–2800 nm) irradiation were compared, as shown in Figure 9A,B. It should be noted that all SiO2/TiO2 photocatalysts showed higher activity compared to the photocatalyst without the addition of SiO2. Undoubtedly, the amount of silica used for modification played an important role in the photoactivity of the tested samples. It was observed that the decomposition degree increased with an increase in the SiO2 content in the sample (up to 14.3 wt.% of SiO2). SiO2(11.1%)/TiO2 and SiO2(14.3%)/TiO2 samples demonstrated the highest activity, for which the methylene blue degradation degree was 40.99 and 42.73%, respectively. In comparison, the MB decomposition degree for the starting TiO2 was 7.19%. The silica modification contributed to an increase in specific surface area and pore volume, as well as a change in the band gap energy value. All SiO2-modified samples showed a higher specific surface area and pore volume than the starting TiO2. For example, the specific surface area and pore volume of starting TiO2 sample were 193 m2/g and 0.109 cm3/g, respectively, and those of the SiO2(11.1%)/TiO2 sample were 208 m2/g and 0.265 cm3/g. In addition, the use of silica in the titanium dioxide modification process contributed to the inhibition of SBET decrease in the range of materials after calcination. For example, the size of specific surface area for starting TiO2_400 sample was 54 m2/g, while that for SiO2(11.1%)/TiO2_400 and SiO2(14.3%)/TiO2_400 was 121 m2/g and 135 m2/g, respectively. It is well known that the specific surface area has an important role in increasing photocatalytic activity [52]. The high surface area provides a number of active centers that can adsorb a large number of pollutant molecules [53]. In the case of post-calcination materials, a relationship between the increase in specific surface area and the increase in the applied silica weighting was also noted. The higher the amount of silica in the material composition, the higher the specific surface area. For example, the size of the specific surface area for the sample SiO2(2%)/TiO2_400 was 89 m2/g, and for the sample SiO2(17.2%)/TiO2_400, it was already 146 m2/g. This was related to the fact that silica inhibits the growth of crystallites. Another parameter influencing the improvement of the photocatalytic activity was the change in the band gap energy. The band gap energy for the SiO2(11.1%)/TiO2 and SiO2(14.3%)/TiO2 (3.22 eV) samples was higher than for the starting TiO2 (3.05 eV). Moreover, a relationship between the increase in activity and the value of band gap energy was observed. The higher the value of band gap energy, the higher the activity. The highest activity was observed in photocatalysts, whose Eg value was 3.22 eV and 3.23 eV. Bao et al. [45] and Periyat et al. [54] suggested that the increase in band gap energy value slows down the electron–hole pair recombination process. This is since an increase in the band gap energy reduces the energy valence band and increases the edge of the conductivity band. The phase composition was also an important parameter determining the activity. It is important to note that the photocatalysts that showed the highest activity comprised 66–72% anatase and 28–34% brookite. Similar results were also obtained by Allen et al. [55], who studied the effect of the brookite phase on the photoactivity of TiO2. They showed that photocatalysts mixtures of anatase and brookite show high photocatalytic activity. A photocatalyst obtained by calcination at 400 °C and containing 69% anatase and 31% brookite in its composition removed about 97% of methyl orange after 180 min of irradiation. This was explained by the fact that the conductivity band of the TiO2 brookite phase is shifted more cathodically by 0.14 eV than that of anatase. This displacement facilitates interfacial electron transfer to molecular oxygen. It should be noted that photocatalysts after calcination showed higher activity compared to non-calcined materials. The higher activity for the samples after calcination was attributed to the larger crystallite size of anatase. The recorded increase in anatase crystallite size indicates the transformation of the amorphous phase present in non-calcined materials. Zhang et al. [56] determined that the photocatalytic activity is the highest when the anatase crystallite size is around 10 nm, which concord with our observations. In our case, the photocatalysts with a crystallite size up to 10 nm showed the highest activity.
In order to better understand the photocatalytic degradation of methylene blue, the apparent reaction rate constants were determined. The degradation of methylene blue for the starting TiO2_400 followed the zero-order model. However, for SiO2(4%)/TiO2, SiO2(7.7%)/TiO2, SiO2(17.2%)/TiO2, SiO2(4%)/TiO2_400, SiO2(7.7%)/TiO2_400 and SiO2(11.1%)/TiO2_400, the dye degradation followed a pseudo-first-order model. For all other samples, the degradation followed a pseudo-second-order model. The linear transformations of zero order, pseudo-first order, and pseudo-second order are shown in Figure 10A–C. It can be seen that, after 3 h of radiation, the points on the graphs started to deviate slightly from the typical linear curve. The observed reduction in reaction rate was due to the formation of intermediates during the dye decomposition. According to the data presented in Table 3, the highest k1 values of methylene blue decomposition were obtained for the heat-treated photocatalysts. Similar to the pseudo-first-order model, higher k2 values were recorded for the materials after calcination. It should be noted that the highest rate constant (0.052 L/(min·mg) was observed for SiO2(14.3%)/TiO2_400, and this value is 17.3 times higher than for starting TiO2.

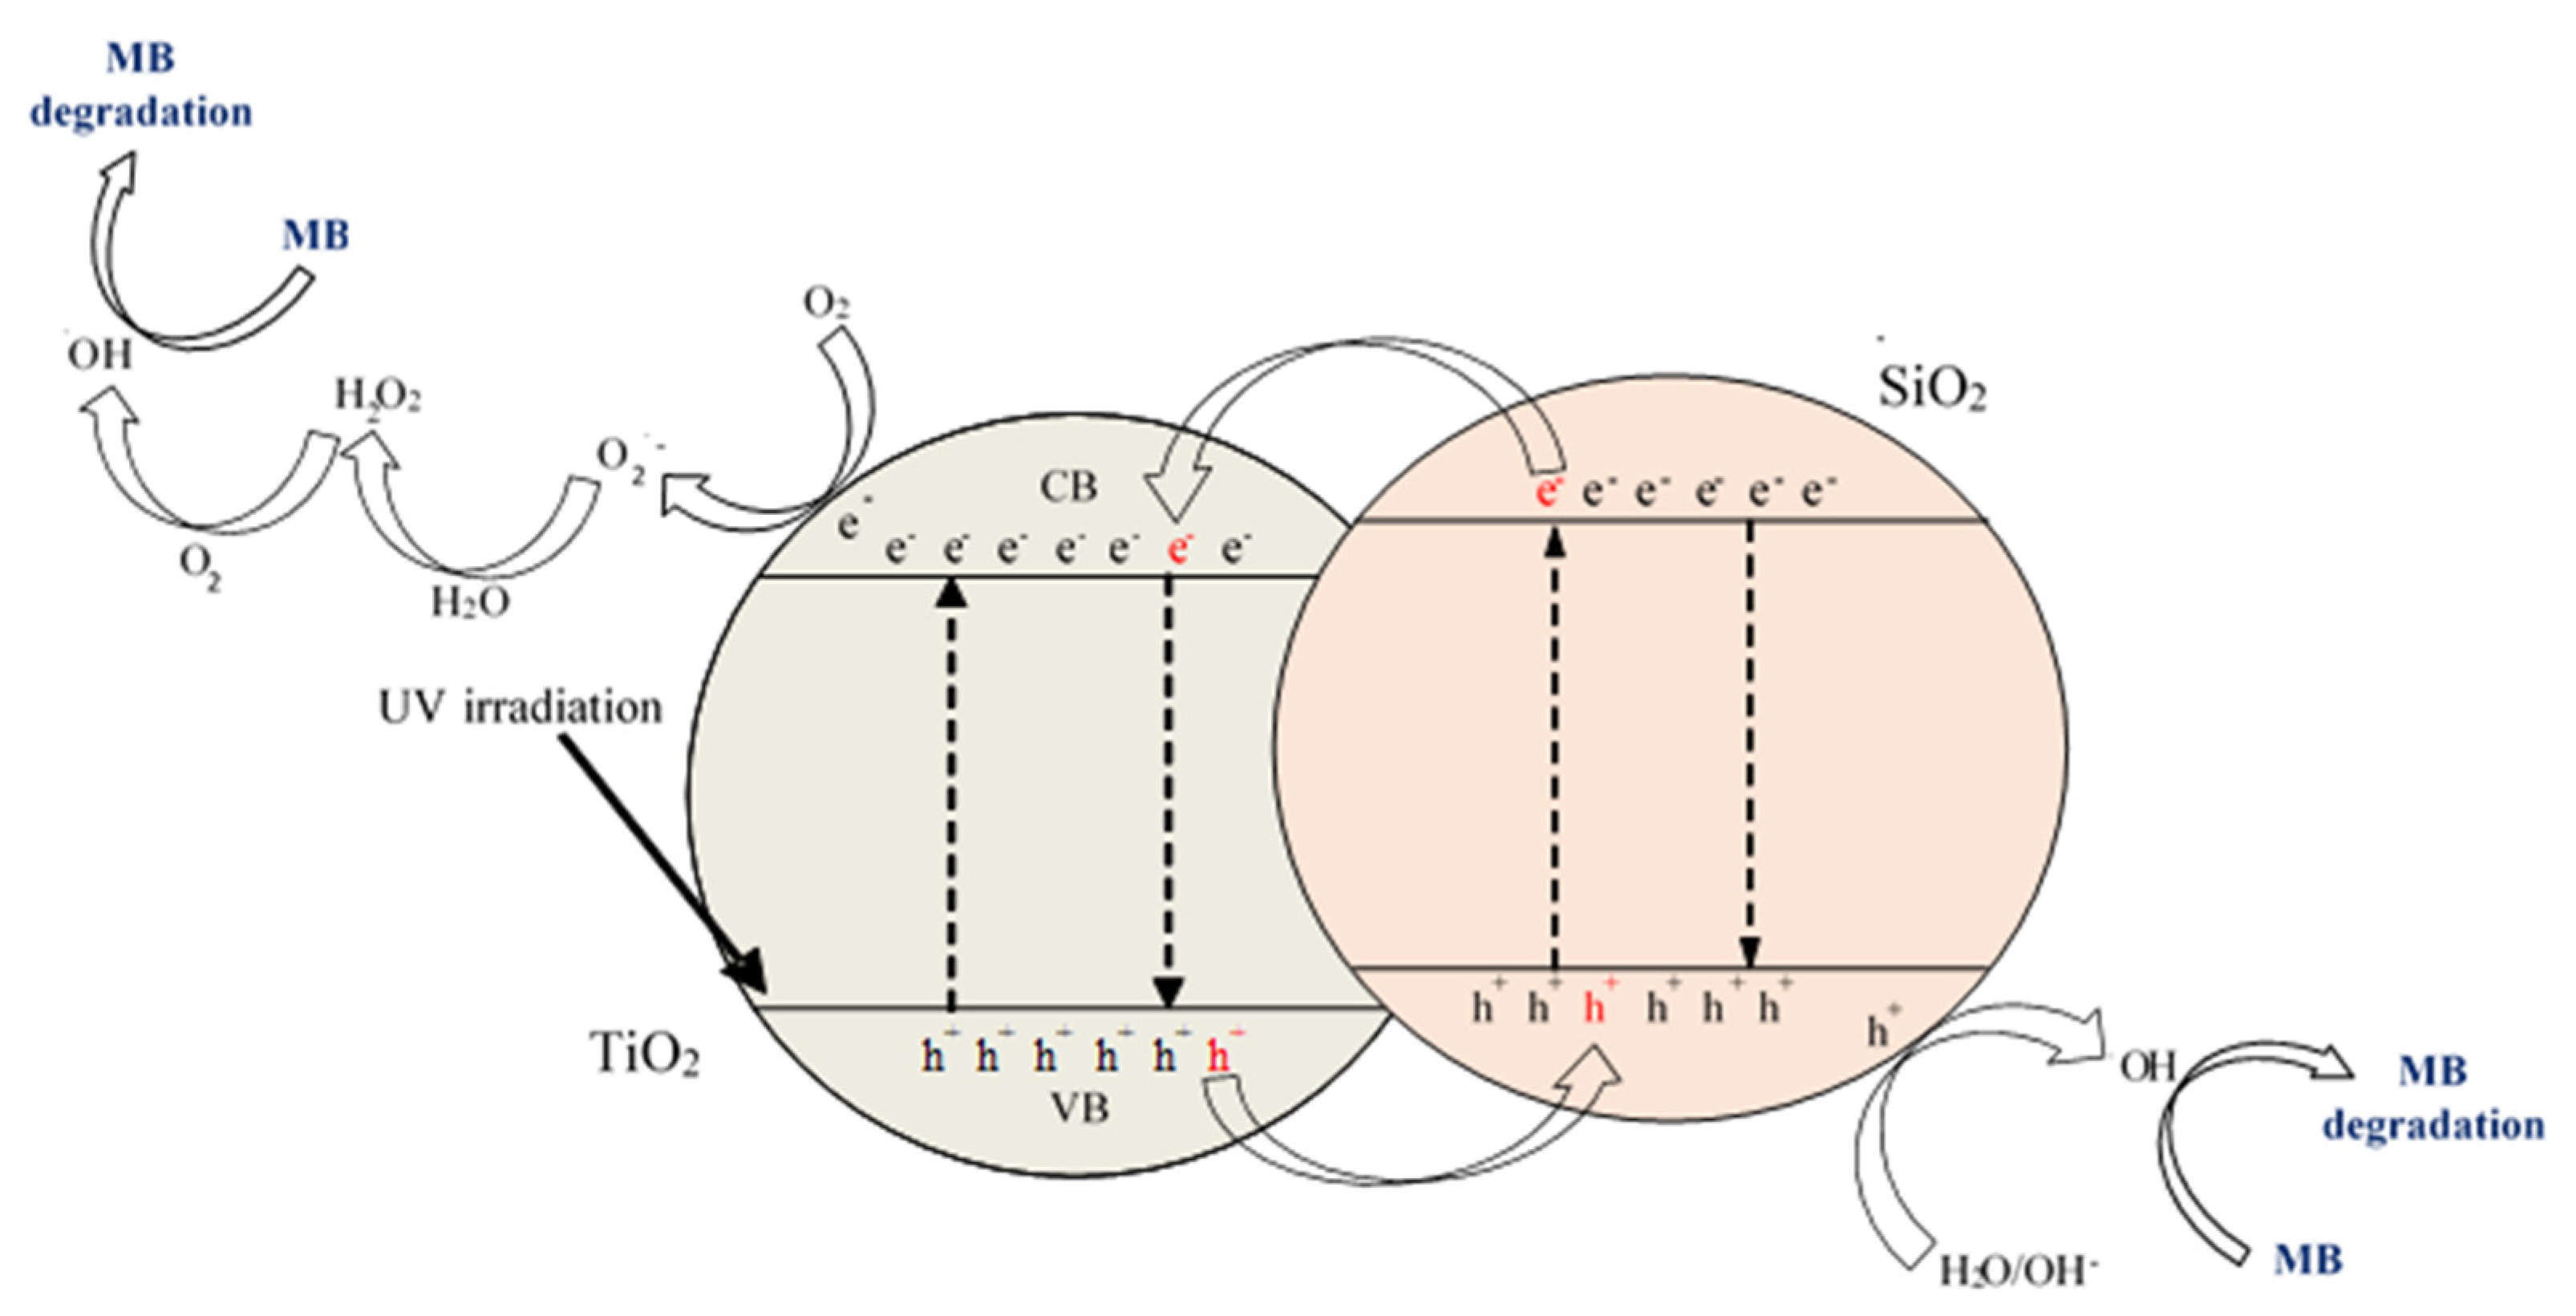
2.3. Photocatalytic Mechanism

The proposed mechanism for methylene blue (MB) degradation in the presence of SiO2/TiO2 is shown in Figure 11. When the photocatalyst absorbs a photon with an energy equal or greater than the band gap energy, the activation occurs, which means an electron ejection from the valence band and its transfer to the conduction band with the generation of an electron gap. The active hydroxyl radicals are generated. As an active oxidizing agent, the hydroxyl radicals attack the MB presents at the surface of TiO2 and decompose it into harmless species, such as carbon dioxide and water. However, it is well known that the high recombination of photogenerated e-h+ pairs makes it difficult for the effective photodegradation of pollutants. According to the literature [57,58], connection between TiO2 and SiO2 (in our case, confirmed by the DRIFT analysis suggesting the presence of Ti–O–Si band) enhances charge carriers’ separation (e and h+) and facilitates the transfer between each other. Thus, the suppression of the electron–hole recombination is limited, causing the enhancement in photoactivity.

3. Materials and Methods

3.1. Materials and Reagents

The SiO2/TiO2 photocatalysts were obtained with the sol-gel method using titani-um(IV) isopropoxide TTIP (≥97%, Sigma-Aldrich Co., Saint Louis, MO, USA) as a precursor of TiO2, fumed silica (≥99.8%, SBET > 200 m2/g, average particle size 7–14 nm, PlasmaChem GmbH, Germany) as a silica precursor, isopropyl alcohol (pure p.a, Firma Chempur®, Piekary Śląskie, Poland) as a solvent and hydrochloric acid (35–38% pure, Firma Chempur®, Piekary Śląskie, Poland) as a promoter of the hydrolysis reaction. Methylene blue (purity ≥ 82%, Firma Chempur®, Piekary Śląskie, Poland) was used as an organic dye compound in photocatalytic tests.

3.2. Preparation of SiO2/TiO2 Photocatalysts

The sol-gel method was used to obtain SiO2/TiO2 photocatalysts. Titanium(IV) iso-propoxide and fumed silica were chosen as TiO2 and SiO2 precursors, respectively. At first, 5 mL of titanium precursor was dropwise added to 15 mL of isopropyl alcohol. Then, 2, 4, 7.7, 11.1, 14.3, or 17.2 wt.% of silica precursor was added. Next, the pH of the obtained solution was adjusted to 2 with hydrochloric acid. Then, the hydrolysis process was started by slowly adding 100 mL of water: isopropyl alcohol mixture (25:75 v/v). In the end, the solution was placed in a magnetic stirrer for 1 h and then left for the ageing process taking 24 h. The obtained gel was dried in a muffle furnace at 100 °C for 24 h. Finally, the received material was calcined at 400 °C in a tube furnace under an argon atmosphere (60 mL/min, purity: 5.0, Messer Polska Sp. z o.o., Chorzów, Poland). The obtained photocatalysts were determined as follows: SiO2(x%)/TiO2_400, where x is the weight percentage of SiO2 in the sample and 400 is the heating temperature. The reference sample, labelled as a starting TiO2, was also received using the same method but without silica.

3.3. Characterization Methods

Diffuse reflectance DRIFT spectra were recorded using FT-IR-4200 spectrometer (JASCO International Co. Ltd., Tokyo, Japan) equipped with a DiffuseIR accessory (PIKE Technologies, Cottonwood Dr, Fitchburg, WI, USA) and were examined in the range of 4000–400 cm−1. The crystalline structure of received photocatalysts was identified utilizing XRD analysis (Malvern PANalytical B.V., Almelo, The Netherlands), using Cu Kα radiation (λ = 0.154056 nm). The XRD diffractograms were collected in the range of 20–80° on 2θ scale. The PDF-4+ 2014 International Centre for Diffraction Data database (04-0028296 PDF4+ card for anatase and 04-007-0758 PDF4+ card for brookite) was used for the specification of the phase composition. The mean crystallite sizes of the nanomaterials were calculated using the Rietveld method. The surface area (SBET) and pore volume of the tested photocatalysts were calculated from the nitrogen adsorption–desorption measurements at 77 K carried out in QUADRASORB evoTM Gas Sorption analyzer (Anton Paar GmbH, Graz, Austria). All samples were degassed at 100 °C for 16 h under a high vacuum before measurements to preclean the surface of the tested samples. The total pore volume (Vtotal) was calculated from the adsorbed nitrogen after the pore condensation was completed at a relative pressure p/p0 = 0.99. The volume of micropores (Vmicro) was determined using the Dubinin–Radushkevich equation. The volume of mesopores (Vmeso) was determined as the difference between Vtotal and Vmicro. The surface nature of the studied materials was determined from scanning electron microscopy SEM images. The SU8020 Ultra-High Resolution Field Emission microscope (Hitachi Ltd., Tokyo, Japan) was used for the measurements. The UV-Vis/DR diffuse reflection spectra of the prepared samples were recorded in the range of 200–800 nm using a V-650 UV-Vis spectrophotometer (JASCO International Co., Tokyo, Japan) equipped with an PIV-756 integrating sphere accessory for studying DR spectra. Spectralon (Spectralon® Diffuse Reflectance Material, Labsphere, USA) was used as the standard sample. The values of the band gap energy (Eg) of the studied photocatalysts were calculated with the Kubelk–Munk Equation (1) [59]:
F(R) = (1 − R)2/2R
where
  • F(R)—radiation absorption coefficient;
  • R—reflectance.
From the above equation, the radiation absorption coefficient was determined. Next, the dependence of energy corresponding to each wavelength was plotted against the square of the inverse of the energy product and the absorption coefficient (F(R)·E)1/2. Finally, a tangent was drawn where the fit is closest to the energy change curve. After transforming the equation of the plotted line, the value of band gap energy was obtained. ZetaSizer NanoSeries ZS (Malvern Panalytical Ltd., Malvern, UK) was used to determine the zeta potential values. The zero-order reaction rate constant can be described as (Equation (2)) [60]:
C0 − Ct = k0t
The pseudo-first reaction rate constant was determined using the Langmuir–Hinshelwood kinetics model, as shown in Equation (3) [61]:
ln(C0/Ct) = kKt = k1t
While the pseudo-second reaction rate constant can be described as (Equation (4)) [62]:
1/Ct − 1/C0 = k2t
where:
  • C0—initial concentration of the methylene blue in solution [mg/L];
  • Ct—concentration of the methylene blue at time t [mg/L];
  • k0—zero-order reaction rate constant [mg/(L·min)];
  • k1—pseudo-first reaction rate constant [1/min];
  • k2—pseudo-second reaction rate constant [L/(min·mg)];
  • t—time of irradiation [min];
  • K—adsorption coefficient of the reactant [L/mg].

3.4. Photocatalytic Activity Test

The photocatalytic activity of the obtained SiO2/TiO2 materials was determined using a methylene blue (MB) solution (10 mg/L) as a model water pollutant. During the experiment, a glass beaker containing 0.2 g/L of the tested photocatalyst and 0.5 L of MB solution was placed under an artificial UV-VIS light source comprised of six lamps with the power of 20 W each (Philips) with the radiation intensity of about 138 W/m2 UV (for the range of 280–400 nm) and 167 W/m2 VIS (for the range of 300–2800 nm). The emission spectrum of the lamp used is shown in Figure 12. Prior to irradiation, the suspension was stirred in the dark for 1 h to establish the adsorption–desorption equilibrium. After that, the lamps were switched on, and the suspension was irradiated for 5 h while maintaining vigorous stirring. A sample (10 mL) of the suspension was collected every 1 h and then centrifuged to separate the photocatalyst from the MB solution to determine the MB degradation. The methylene blue absorbance was measured by the V-630 UV-Vis spectrometer (Jasco International Co., Tokyo, Japan). The degradation degree of methylene blue was described with Ct/C0 formula, where Ct stands for the dye absorbance at a given time point and C0 for the dye absorbance after adsorption.

4. Conclusions

In conclusion, SiO2/TiO2 nanomaterials were prepared by a sol-gel method combined with a calcination process at 400 °C in an inert gas atmosphere. In this paper, fumed silica was used as a silica precursor for the first time. The presence of SiO2 on the TiO2 surface was confirmed by FT-IR/DRS infrared spectroscopy. The relationships between the effects of different properties on the photocatalytic activity of the obtained materials were determined. It was found that the modification with SiO2 increased the specific surface area and total pore volume. In addition, the presence of a modifier contributed to a change in the value of band gap energy and effectively inhibited the growth of crystallites during thermal modification. The photoactivity of the obtained samples was investigated by the degradation of methylene blue under UV irradiation. In general, it was found that the applied modification of titanium dioxide using SiO2, both without and with the calcination phase, contributed to the increase in photocatalytic activity. All the obtained photocatalysts showed higher activity (up to 75.81%) than the starting TiO2, which removed only 7.19% of methylene blue. Moreover, the photocatalytic activity increased with increasing SiO2 content in the sample. Samples containing 11.1 and 14.3 wt.% SiO2 showed the highest removal of methylene blue.

Author Contributions

Conceptualization: A.B. and A.W.; investigation: A.B., A.W. and M.S.; data curation: A.W., E.K.-N. and A.W.M.; writing—original draft preparation: A.B.; writing—review and editing: A.W., E.K.-N. and A.W.M.; project administration: A.W.M.; funding acquisition: A.W.M. All authors have read and agreed to the published version of the manuscript.

Funding

This work was supported by grant 2017/27/B/ST8/02007 from the National Science Centre, Poland.

Data Availability Statement

The data presented in this study are available upon request from the corresponding author.

Conflicts of Interest

The authors declare no conflict of interest.

References

  1. Liu, C.; Mao, S.; Wang, H.; Wu, Y.; Wang, F.; Xia, M.; Chen, Q. Peroxymonosulfate-assisted for facilitating photocatalytic degradation performance of 2D/2D WO3/BiOBr S-scheme heterojunction. Chem. Eng. J. 2022, 430, 132806. [Google Scholar] [CrossRef]
  2. Liu, C.; Mao, S.; Shi, M.; Wang, F.; Xia, M.; Chen, Q.; Ju, X. Peroxymonosulfate activation through 2D/2D Z-scheme CoAl-LDH/BiOBr photocatalyst under visible light for ciprofloxacin degradation. J. Hazard. Mater. 2021, 420, 126613. [Google Scholar] [CrossRef] [PubMed]
  3. Liu, C.; Mao, S.; Shi, M.; Hong, X.; Wang, D.; Wang, F.; Xia, M.; Chen, Q. Enhanced photocatalytic degradation performance of BiVO4/BiOBr through combining Fermi level alteration and oxygen defect engineering. Chem. Eng. J. 2022, 449, 137757. [Google Scholar] [CrossRef]
  4. Boyjoo, Y.; Sun, H.; Liu, J.; Pareek, V.K.; Wang, S. A review on photocatalysis for air treatment: From catalyst development to reactor design. Chem. Eng. J. 2017, 310, 537–559. [Google Scholar] [CrossRef]
  5. Reddy, P.V.L.; Kavitha, B.; Reddy, P.A.K.; Kim, K.H. TiO2-based photocatalytic disinfection of microbes in aqueous media: A review. Environ. Res. 2017, 154, 296–303. [Google Scholar] [CrossRef]
  6. Nyamukamba, P.; Okoh, O.; Mungondori, H.; Taziwa, R.; Zinya, S. Synthetic methods for titanium dioxide nanoparticles: A review. In Titanium Dioxide—Material for a Sustainable Environment; IntechOpen: London, UK, 2018. [Google Scholar] [CrossRef] [Green Version]
  7. Chen, H.S.; Kumar, R.V. Sol-gel TiO2 in self-organization process: Growth, ripening and sintering. RSC Adv. 2012, 2, 2294–2301. [Google Scholar] [CrossRef]
  8. Badmus, K.O.; Wewers, F.; Al-Abri, M.; Shahbaaz, M.; Petrik, L.F. Synthesis of Oxygen Deficient TiO2 for Improved Photocatalytic Efficiency in Solar Radiation. Catalysts 2021, 11, 904. [Google Scholar] [CrossRef]
  9. Tsebriienko, T.; Popov, A.I. Effect of poly (titanium oxide) on the viscoelastic and thermophysical properties of interpenetrating polymer networks. Crystals 2021, 11, 794. [Google Scholar] [CrossRef]
  10. Serga, V.; Burve, R.; Krumina, A.; Romanova, M.; Kotomin, E.A.; Popov, A.I. Extraction-pyrolytic method for TiO2 polymorphs production. Crystals 2021, 11, 431. [Google Scholar] [CrossRef]
  11. Jiang, Y.; Amal, R. Selective synthesis of TiO2-based nanoparticles with highly active surface sites for gas-phase photocatalytic oxidation. Appl. Catal. B Environ. 2013, 138, 260–267. [Google Scholar] [CrossRef]
  12. Danks, A.E.; Hall, S.R.; Schnepp, Z.J.M.H. The evolution of ‘sol-gel’chemistry as a technique for materials synthesis. Mater. Horiz. 2016, 3, 91–112. [Google Scholar] [CrossRef] [Green Version]
  13. Tryba, B.; Tygielska, M.; Colbeau-Justin, C.; Kusiak-Nejman, E.; Kapica-Kozar, J.; Wróbel, R.; Żołnierkiewicz, G.; Guskos, N. Influence of pH of sol-gel solution on phase composition and photocatalytic activity of TiO2 under UV and visible light. Mater. Res. Bull. 2016, 84, 152–161. [Google Scholar] [CrossRef]
  14. Ciesielczyk, F.; Przybysz, M.; Zdarta, J.; Piasecki, A.; Paukszta, D.; Jesionowski, T. The sol-gel approach as a method of synthesis of xMgO· ySiO2 powder with defined physicochemical properties including crystalline structure. J. Sol-Gel Sci. Technol. 2014, 71, 501–513. [Google Scholar] [CrossRef] [Green Version]
  15. Daghrir, R.; Drogui, P.; Robert, D. Modified TiO2 for environmental photocatalytic applications: A review. Ind. Eng. Chem. Res. 2013, 52, 3581–3599. [Google Scholar] [CrossRef]
  16. Pal, A.; Jana, T.K.; Chatterjee, K. Silica supported TiO2 nanostructures for highly efficient photocatalytic application under visible light irradiation. Mater. Res. Bull. 2016, 76, 353–357. [Google Scholar] [CrossRef]
  17. Raj, K.; Smith, Y.R.; Subramanian, V.R.; Viswanathan, B. Structural studies of silica modified titania and its photocatalytic activity of 4-chlorophenol oxidation in aqueous medium. Indian J. Chem. 2010, 49, 867–875. [Google Scholar]
  18. Fu, X.; Clark, L.A.; Yang, Q.; Anderson, M.A. Enhanced photocatalytic performance of titania-based binary metal oxides: TiO2/SiO2 and TiO2/ZrO2. Environ. Sci. Technol. 1996, 30, 647–653. [Google Scholar] [CrossRef]
  19. Jimmy, C.Y.; Yu, J.; Ho, W.; Zhao, J. Light-induced super-hydrophilicity and photocatalytic activity of mesoporous TiO2 thin films. J. Photochem. Photobiol. A Chem. 2002, 148, 331–339. [Google Scholar]
  20. Yu, J.; Zhao, X.; Jimmy, C.Y.; Zhong, G.; Han, J.; Zhao, Q. The grain size and surface hydroxyl content of super-hydrophilic TiO2/SiO2 composite nanometer thin films. J. Mater. Sci. Lett. 2001, 20, 1745–1748. [Google Scholar]
  21. Chun, H.; Yizhong, W.; Hongxiao, T. Influence of adsorption on the photodegradation of various dyes using surface bond-conjugated TiO2/SiO2 photocatalyst. Appl. Catal. B Environ. 2001, 35, 95–105. [Google Scholar] [CrossRef]
  22. Xie, C.; Xu, Z.; Yang, Q.; Xue, B.; Du, Y.; Zhang, J. Enhanced photocatalytic activity of titania–silica mixed oxide prepared via basic hydrolyzation. Mater. Sci. Eng.S B 2004, 112, 34–41. [Google Scholar] [CrossRef]
  23. Ding, Z.; Lu, G.Q.; Greenfield, P.F. Role of the crystallite phase of TiO2 in heterogeneous photocatalysis for phenol oxidation in water. J. Phys. Chem. B 2000, 104, 4815–4820. [Google Scholar] [CrossRef]
  24. Fatimah, I. Preparation of TiO2-SiO2 via sol-gel method: Effect of silica precursor on catalytic and photocatalytic properties. In Proceedings of the 11th Joint Conference on Chemistry in Conjunction with the 4th Regional Biomaterials Scientific Meeting, Purwokerto, Indonesia, 15–16 September 2016. [Google Scholar] [CrossRef] [Green Version]
  25. Qourzal, S.; Barka, N.; Tamimi, M.; Assabbane, A.; Nounah, A.; Ihlal, A.; Ait-Ichou, Y. Sol-gel synthesis of TiO2–SiO2 photocatalyst for β-naphthol photodegradation. Mater. Sci. Eng. C 2009, 29, 1616–1620. [Google Scholar] [CrossRef]
  26. Nandanwar, R.; Singh, P.; Syed, F.F.; Haque, F.Z. Preparation of TiO2/SiO2 nanocomposite with non-ionic surfactants via sol-gel process and their photocatalytic study. Orient. J. Chem. 2014, 30, 1577–1584. [Google Scholar] [CrossRef] [Green Version]
  27. Morawski, A.W.; Kusiak-Nejman, E.; Wanag, A.; Kapica-Kozar, J.; Wróbel, R.J.; Ohtani, B.; Aksienionek, M.; Lipińska, L. Photocatalytic degradation of acetic acid in the presence of visible light-active TiO2-reduced graphene oxide photocatalysts. Catal. Today 2017, 280, 108–113. [Google Scholar] [CrossRef]
  28. Resende, S.F.; Nunes, E.H.M.; Houmard, M.; Vasconcelos, W.L. Simple sol-gel process to obtain silica-coated anatase particles with enhanced TiO2-SiO2 interfacial area. J. Colloid Interface Sci. 2014, 433, 211–217. [Google Scholar] [CrossRef] [Green Version]
  29. Górska, P.; Zaleska, A.; Kowalska, E.; Klimczuk, T.; Sobczak, J.W.; Skwarek, E.; Janusz, W.; Hupka, J. TiO2 photoactivity in vis and UV light: The influence of calcination temperature and surface properties. Appl. Catal. B Environ. 2008, 84, 440–447. [Google Scholar] [CrossRef]
  30. Maira, A.J.; Coronado, J.M.; Augugliaro, V.; Yeung, K.L.; Conesa, J.C.; Soria, J. Fourier transform infrared study of the performance of nanostructured TiO2 particles for the photocatalytic oxidation of gaseous toluene. J. Catal. 2001, 202, 413–420. [Google Scholar] [CrossRef] [Green Version]
  31. Chesalov, Y.A.; Chernobay, G.B.; Andrushkevich, T.V. FTIR study of the surface complexes of β-picoline, 3-pyridine-carbaldehyde and nicotinic acid on sulfated TiO2 (anatase). J. Mol. Catal. A Chem. 2013, 373, 96–107. [Google Scholar] [CrossRef]
  32. Yang, G.; Jiang, Z.; Shi, H.; Xiao, T.; Yan, Z. Preparation of highly visible-light active N-doped TiO2 photocatalyst. J. Mater. Chem. 2010, 20, 5301–5309. [Google Scholar] [CrossRef]
  33. Araghi, M.A.; Shaban, N.; Bahar, M. Synthesis and characterization of nanocrystalline barium strontium titanate powder by a modified sol-gel processing. Mater. Sci.-Pol. 2016, 34, 63–68. [Google Scholar] [CrossRef]
  34. Li, Z.; Hou, B.; Xu, Y.; Wu, D.; Sun, Y.; Hu, W.; Deng, F. Comparative study of sol–gel-hydrothermal and sol-gel synthesis of titania–silica composite nanoparticles. J. Solid State Chem. 2005, 178, 1395–1405. [Google Scholar] [CrossRef]
  35. Andrade-Guel, M.; Díaz-Jiménez, L.; Cortés-Hernández, D.; Cabello-Alvarado, C.; Ávila-Orta, C.; Bartolo-Pérez, P.; Gamero-Melo, P. Microwave assisted sol–gel synthesis of titanium dioxide using hydrochloric and acetic acid as catalysts. Boletín Soc. Española Cerámica Vidr. 2019, 58, 171–177. [Google Scholar] [CrossRef]
  36. Pelaez, M.; Nolan, N.T.; Pillai, S.C.; Seery, M.K.; Falaras, P.; Kontos, A.G.; Dunlop, P.S.M.; Hamilton, J.W.J.; Byrne, J.A.; O’Shea, K.; et al. A review on the visible light active titanium dioxide photocatalysts for environmental applications. Appl. Catal. B Environ. 2012, 125, 331–349. [Google Scholar] [CrossRef] [Green Version]
  37. Kim, M.G.; Kang, J.M.; Lee, J.E.; Kim, K.S.; Kim, K.H.; Cho, M.; Lee, S.G. Effects of calcination temperature on the phase composition, photocatalytic degradation, and virucidal activities of TiO2 nanoparticles. ACS Omega 2021, 6, 10668–10678. [Google Scholar] [CrossRef] [PubMed]
  38. Xu, G.; Zheng, Z.; Wu, Y.; Feng, N. Effect of silica on the microstructure and photocatalytic properties of titania. Ceram. Int. 2009, 35, 1–5. [Google Scholar] [CrossRef]
  39. Lu, Z.; Jiang, X.; Zhou, B.; Wu, X.; Lu, L. Study of effect annealing temperature on the structure, morphology and photocatalytic activity of Si doped TiO2 thin films deposited by electron beam evaporation. Appl. Surf. Sci. 2011, 257, 10715–10720. [Google Scholar]
  40. Sing, K.S.W. Reporting physisorption data for gas/solid systems with special reference to the determination of surface area and porosity (Provisional). Pure Appl. Chem. 1982, 54, 2201–2218. [Google Scholar] [CrossRef]
  41. Sing, K.S.; Williams, R.T. Physisorption hysteresis loops and the characterization of nanoporous materials. Adsorpt. Sci. Technol. 2004, 22, 773–782. [Google Scholar]
  42. Kutarov, V.V.; Tarasevich, Y.I.; Aksenenko, E.V.; Ivanova, Z.G. Adsorption hysteresis for a slit-like pore model. Russ. J. Phys. Chem. A 2011, 85, 1222–1227. [Google Scholar] [CrossRef]
  43. Leofanti, G.; Padovan, M.; Tozzola, G.; Venturelli, B.J.C.T. Surface area and pore texture of catalysts. Catal. Today 1998, 41, 207–219. [Google Scholar] [CrossRef]
  44. SiO#2—Krzemionka Koloidalna, Nanoproszek, Hydrofilowy. Available online: https://3d-nano.com/pl/catalogue/sio2-krzemionka-koloidalna-nanoproszek-hydrofilowy/ (accessed on 22 September 2022).
  45. Bao, N.; Wei, Z.; Ma, Z.; Liu, F.; Yin, G. Si-doped mesoporous TiO2 continuous fibers: Preparation by centrifugal spinning and photocatalytic properties. J. Hazard. Mater. 2010, 174, 129–136. [Google Scholar] [CrossRef] [PubMed]
  46. Nyamukamba, P.; Tichagwa, L.; Greyling, C. The influence of carbon doping on TiO2 nanoparticle size, surface area, anatase to rutile phase transformation and photocatalytic activity. Mater. Sci. Forum 2012, 712, 49–63. [Google Scholar] [CrossRef]
  47. Jesionowski, T.; Żurawska, J.; Krysztafkiewicz, A.; Pokora, M.; Waszak, D.; Tylus, W. Physicochemical and morphological properties of hydrated silicas precipitated following alkoxysilane surface modification. Appl. Surf. Sci. 2003, 205, 212–224. [Google Scholar] [CrossRef]
  48. Tan, L.L.; Ong, W.J.; Chai, S.P.; Mohamed, A.R. Reduced graphene oxide-TiO2 nanocomposite as a promising visible-light-active photocatalyst for the conversion of carbon dioxide. Nanoscale Res. Lett. 2013, 8, 465. [Google Scholar] [CrossRef] [Green Version]
  49. Nilchi, A.; Janitabar-Darzi, S.; Mahjoub, A.R.; Rasouli-Garmarodi, S. New TiO2/SiO2 nanocomposites—Phase transformations and photocatalytic studies. Colloids Surf. A: Physicochem. Eng. Asp. 2010, 361, 25–30. [Google Scholar] [CrossRef]
  50. Ferreira-Neto, E.P.; Ullah, S.; Simões, M.B.; Perissinotto, A.P.; de Vicente, F.S.; Noeske, P.L.M.; Ribeiro, S.J.L.; Rodrigues-Filho, U.P. Solvent-controlled deposition of titania on silica spheres for the preparation of SiO2@ TiO2 core@ shell nanoparticles with enhanced photocatalytic activity. Colloids Surf. A Physicochem. Eng. Asp. 2019, 570, 293–305. [Google Scholar] [CrossRef]
  51. Nowacka, M.; Ambrożewicz, D.; Jesionowski, T. TiO2-SiO2/Ph-POSS functional hybrids: Preparation and characterisation. J. Nanomater. 2013, 2013, 1–10. [Google Scholar] [CrossRef] [Green Version]
  52. Carp, O.; Huisman, C.L.; Reller, A. Photoinduced reactivity of titanium dioxide. Prog. Solid State Chem. 2004, 32, 33–177. [Google Scholar] [CrossRef]
  53. Alvaro, M.; Aprile, C.; Benitez, M.; Carbonell, E.; García, H. Photocatalytic activity of structured mesoporous TiO2 materials. J. Phys. Chem. B 2006, 110, 6661–6665. [Google Scholar] [CrossRef]
  54. Periyat, P.; Baiju, K.V.; Mukundan, P.; Pillai, P.K.; Warrier, K.G.K. High temperature stable mesoporous anatase TiO2 photocatalyst achieved by silica addition. Appl. Catal. A Gen. 2008, 349, 13–19. [Google Scholar] [CrossRef]
  55. Allen, N.S.; Mahdjoub, N.; Vishnyakov, V.; Kelly, P.J.; Kriek, R.J. The effect of crystalline phase (anatase, brookite and rutile) and size on the photocatalytic activity of calcined polymorphic titanium dioxide (TiO2). Polym. Degrad. Stab. 2018, 150, 31–36. [Google Scholar] [CrossRef]
  56. Zhang, Z.; Wang, C.C.; Zakaria, R.; Ying, J.Y. Role of particle size in nanocrystalline TiO2-based photocatalysts. J. Phys. Chem. B 1998, 102, 10871–10878. [Google Scholar] [CrossRef]
  57. Nabih, S.; Shalan, A.E.; Serea, E.S.A.; Goda, M.A.; Sanad, M.F. Photocatalytic performance of TiO2@ SiO2 nanocomposites for the treatment of different organic dyes. J. Mater. Sci. Mater. Electron. 2019, 30, 9623–9633. [Google Scholar] [CrossRef]
  58. Gholami, T.; Bazarganipour, M.; Salavati-Niasari, M.; Bagheri, S. Photocatalytic degradation of methylene blue on TiO2@ SiO2 core/shell nanoparticles: Synthesis and characterization. J. Mater. Sci. Mater. Electron. 2015, 26, 6170–6177. [Google Scholar] [CrossRef]
  59. Chen, D.; Zou, L.; Li, S.; Zheng, F. Nanospherical like reduced graphene oxide decorated TiO2 nanoparticles: An advanced catalyst for the hydrogen evolution reaction. Sci. Rep. 2016, 6, 20335. [Google Scholar] [CrossRef] [Green Version]
  60. Abdullah, M.A.; Chong, F.K. Dual-effects of adsorption and photodegradation of methylene blue by tungsten-loaded titanium dioxide. Chem. Eng. J. 2010, 158, 418–425. [Google Scholar]
  61. Sahoo, C.; Gupta, A.K.; Sasidharan Pillai, I.M. Photocatalytic degradation of methylene blue dye from aqueous solution using silver ion-doped TiO2 and its application to the degradation of real textile wastewater. J. Environ. Sci. Health 2012, 47, 1428–1438. [Google Scholar] [CrossRef]
  62. Khan, F.; Wahab, R.; Hagar, M.; Alnoman, R.; Rashid, M. Nanotransition materials (NTMs): Photocatalysis, validated high effective sorbent models study for organic dye degradation and precise mathematical data’s at standardized level. Nanomaterials 2018, 8, 134. [Google Scholar] [CrossRef]
Figure 1. FT-IR/DR spectra of starting TiO2 and silica-modified TiO2 prior (A) and after heat treatment (B).
Catalysts 12 01372 g001
Figure 2. XRD patterns of starting TiO2 and silica-modified TiO2 prior (A) and after heat treatment (B).
Catalysts 12 01372 g002
Figure 3. Adsorption–desorption isotherms of: (A) starting TiO2, SiO2(2%)/TiO2 and SiO2(4%)/TiO2, (B) starting TiO2, SiO2(7.7%)/TiO2, SiO2(11.1%)/TiO2, SiO2(14.3%)/TiO2 and SiO2(17.2%)/TiO2.
Catalysts 12 01372 g003
Figure 4. Adsorption–desorption isotherms of: (A) starting TiO2_400, SiO2(2%)/TiO2_400 and SiO2(4%)/TiO2_400, (B) starting TiO2_400, SiO2(7.7%)/TiO2_400, SiO2(11.1%)/TiO2_400, SiO2(14.3%)/TiO2_400 and SiO2(17.2%)/TiO2_400.
Catalysts 12 01372 g004
Figure 5. SEM images taken for (A,B) starting TiO2 captured at different magnifications and (C) SiO2(14.3%)/TiO2_400.
Catalysts 12 01372 g005
Figure 6. UV-Vis/DR spectra of starting TiO2 and silica-modified TiO2 prior (A) and after heat treatment (B).
Catalysts 12 01372 g006
Figure 7. Methylene blue photolysis curve during 5 h of UV light irradiation.
Catalysts 12 01372 g007
Figure 8. Methylene blue decomposition under UV irradiation of starting TiO2 and silica-modified TiO2 prior (A) and after calcination at 400 °C (B).
Catalysts 12 01372 g008aCatalysts 12 01372 g008b
Figure 9. Methylene blue decomposition degree after 5 h of UV light irradiation for starting TiO2 and silica-modified TiO2 prior (A) and after calcination at 400 °C (B).
Catalysts 12 01372 g009
Figure 10. The zero-order plot (A), the pseudo-first-order (B), and the pseudo-second-order plot (C) of methylene blue decomposition.
Catalysts 12 01372 g010
Figure 11. Schematic of the photocatalysis mechanism on SiO2/TiO2 surface (based on [57]).
Catalysts 12 01372 g011
Figure 12. Emission spectrum of the UV-VIS lamp (6 × 20 W, Philips), 138 W/m2 UV for 280–400 nm and 167 W/m2 VIS for 300–2800 nm.
Catalysts 12 01372 g012
Table 1. XRD phase composition, average crystallites size, specific surface area and pore volume distribution of starting TiO2 and silica-modified photocatalysts.
Sample CodePhase Composition [%]Mean Crystallite Size [nm]SBET [m2/g]Vtotal [cm3/g]Vmicro [cm3/g]Vmeso [cm3/g]
AnataseBrookiteAnataseBrookite
starting TiO257435 ± 0.22 ± 0.21930.1090.0790.030
SiO2(2%)TiO258425 ± 0.22 ± 0.22340.1590.0900.069
SiO2(4%)/TiO259415 ± 0.24 ± 0.22210.1480.0900.058
SiO2(7.7%)/TiO259415 ± 0.24 ± 0.22180.1710.0850.171
SiO2(11.1%)/TiO281195 ± 0.25 ± 0.22080.2650.0800.185
SiO2(14.3%)/TiO277235 ± 0.26 ± 0.22070.2850.0800.205
SiO2(17.2%)/TiO281194 ± 0.26 ± 0.22280.3660.0880.278
starting TiO2_400633714 ± 0.49 ± 0.4540.1010.0200.081
SiO2(2%)/TiO2_400663416 ± 0.47± 0.4890.1770.0310.146
SiO2(4%)/TiO2_400683211 ± 0.47 ± 0.4980.1600.0360.124
SiO2(7.7%)/TiO2_400663411 ± 0.47 ± 0.41040.1890.0390.150
SiO2(11.1%)/TiO2_400673310 ± 0.4 7 ± 0.41210.2590.0430.216
SiO2(14.3%)/TiO2_40072289 ± 0.48 ± 0.41350.3130.0510.262
SiO2(17.2%)/TiO2_40072288 ± 0.48 ± 0.41460.3710.0560.315
Table 2. The band gap energy and zeta potential values of starting TiO2 and silica-modified titania photocatalysts.
Sample CodeEg [eV]pHZeta Potential δ [mV]
starting TiO23.05 ± 0.013.1+38.9
SiO2(2%)/TiO23.09 ± 0.012.8+35.8
SiO2(4%)/TiO23.10 ± 0.013.2+35.7
SiO2(7.7%)/TiO23.12 ± 0.013.2+32.8
SiO2(11.1%)/TiO23.22 ± 0.013.3+33.6
SiO2(14.3%)/TiO23.22 ± 0.013.4+31.0
SiO2(17.2%)/TiO23.23 ± 0.013.4+31.0
starting TiO2_4002.98 ± 0.014.1+39.0
SiO2(2%)/TiO2_4003.07 ± 0.014.0+33.2
SiO2(4%)/TiO2_4003.11 ± 0.014.2+30.2
SiO2(7.7%)/TiO2_4003.15 ± 0.014.3+19.5
SiO2(11.1%)/TiO2_4003.23 ± 0.014.4+19.7
SiO2(14.3%)/TiO2_4003.22 ± 0.014.4+17.9
SiO2(17.2%)/TiO2_4003.24 ± 0.014.5+14.6
Table 3. The fitting parameters, zero, pseudo-first, and pseudo-second reaction rate constants for methylene blue decomposition (after 5 h of UV radiation).
Sample Codek0
(mg/(L·min))
R2Sample Codek1
(1/min)
R2Sample Codek2
(L/(min·mg))
R2
starting TiO2_4000.5830.99SiO2(4%)/TiO20.0420.99starting TiO20.0030.99
SiO2(17.2%)/TiO20.0680.99SiO2(2%)/TiO20.0030.99
SiO2(7.7%)/TiO20.0750.99SiO2(2%)/TiO2_4000.0110.99
SiO2(4%)/TiO2_4000.1760.99SiO2(11.1%)/TiO20.0120.99
SiO2(7.7%)/TiO2_4000.2250.99SiO2(14.3%)/TiO20.0120.99
SiO2(11.1%)/TiO2_4000.2940.98SiO2(17.2%)/TiO2_4000.0460.99
SiO2(14.3%)/TiO2_4000.0520.98
Publisher’s Note: MDPI stays neutral with regard to jurisdictional claims in published maps and institutional affiliations.

