Abstract
We investigate a susceptible–exposed–infected–recovered epidemic model that distinguishes between two subpopulations: individuals favoring vaccination (pro-vaccination), represented by the compartments , and those opposing vaccination (anti-vaccination), described by . The two systems are interconnected through flows between the susceptible classes, capturing the possibility of individuals switching their vaccination strategy, as well as through transitions involving recovered individuals. This framework captures the behavioral interplay during an epidemic, where individuals may reconsider their strategies depending on infection prevalence and the perceived costs and benefits of vaccination versus infection. In the model, immunity may be acquired either through vaccination or after being infected, while waning immunity adds further complexity to individual decision-making. To study these dynamics, we embed the epidemiological system into an evolutionary game framework, where strategy adoption depends on infection levels and associated payoffs. Our analysis shows that, at Nash equilibrium, both pro- and anti-vaccination groups exhibit similar behavior. Numerical simulations further indicate that greater vaccination coverage mitigates the social dilemma, whereas higher rates of waning immunity intensify it.
1. Introduction
Darwin’s principle of natural selection, often summarized as “survival of the fittest”, explains that the most adapted individuals are more likely to survive and persist in nature (). This idea has also inspired the study of social dilemmas, situations where individual concerns diverge from collective interests (). Although natural selection often favors selfish behavior, cooperative strategies still emerge, prompting questions about the mechanisms that sustain them. Mathematically, social dilemmas can be described as interactions among individuals (or agents) who select from multiple possible actions. When such interactions are repeated, certain strategies can spread through the population. The long-term dominance of a strategy depends on how agents adapt their choices over time. Adaptation may occur through imitation learning, where individuals copy more successful peers (; ; ; ), or through aspiration learning, where agents adjust based on whether outcomes meet their personal expectations (; ). Evolutionary game theory (EGT) provides a powerful framework for studying these processes and examining how different learning mechanisms shape the persistence of cooperation.
Introduced by Smith and Price (; ), evolutionary games extend classical game theory from purely rational decision-making to population-level dynamics relevant to biology and the social sciences (). EGT captures both genetic evolution, where advantageous traits spread through reproductive success (), and cultural evolution, where behaviors spread by imitation, even among species with limited cognition (). A basic example is the pairwise game, in which two players choose between cooperation and defection, producing four possible payoffs: reward, punishment, sucker’s payoff, and temptation. Classical examples such as the Prisoner’s Dilemma, Hawk–Dove, and Stag Hunt highlight the tension between self-interest and collective benefit, encapsulating the essence of social dilemmas ().
Human behavior also plays a critical role in the spread of infectious diseases, and EGT offers a natural framework to model such behavioral responses. Traditional epidemic models, such as the susceptible–infected–recovered (SIR) framework by (), divide populations into compartments with transmission occurring generally through contact. Preventive actions such as vaccination, distancing, or mask-wearing are individual choices, yet they create social dilemmas at the collective level. Voluntary vaccination, for example, represents a “vaccination game” (), since non-vaccinators benefit from herd immunity while avoiding vaccination costs or risks. This exemplifies the conflict between personal incentives and public health. Vaccination is often implemented preemptively, as with seasonal influenza (), but can also be adopted reactively, as during the COVID-19 pandemic. Numerous studies on dynamic vaccination games (; ) analyze how such individual decisions evolve in response to shifting risks and benefits.
Recently, researchers have combined EGT with epidemic models that go beyond the classical SIR structure. For instance, () examined an SIR model with two behavioral subgroups—pro- and anti-vaccination strategies—and explored how social dilemmas shape epidemic outcomes. Extending this line of research, we develop an enhanced framework that introduces an additional compartment representing exposed individuals. The resulting model, which we refer to as an SEIR system with behavioral components, captures the dynamics of these compartments and their interactions through a system of eight nonlinear ordinary differential equations (see the next section).
Recent studies have extensively applied game-theoretic approaches to explore vaccination behavior and optimal immunization strategies. For instance, () demonstrated that imperfect vaccines can lead to the coexistence of multiple Nash equilibria, revealing the complex behavioral responses to varying vaccine efficacies. Similarly, () developed a voluntary vaccination model for yellow fever, showing how individual choices affect outbreak prevention in urban settings. () examined competition between vaccine and drug companies, emphasizing how economic incentives influence public health outcomes. Extending these ideas, () analyzed COVID-19 vaccination dynamics at endemic equilibrium, while () highlighted how voluntary immunization of adults and adolescents could eradicate hepatitis B in China. More recently, () proposed optimal vaccination strategies to reduce meningitis prevalence in Africa, further underscoring the value of integrating epidemiological modeling with behavioral and strategic decision-making. Together, these works provide a strong theoretical foundation for understanding the role of individual and institutional behavior in shaping epidemic control outcomes.
2. Model Presentation, Total Infection and Average Social Payoff
2.1. Model Presentation and Basic Reproduction Number
The model considered in this study is described by the following system:
with the total population normalized as
Here, represents the susceptible individuals in the pro-vaccination group, while stands for the susceptible individuals in the anti-vaccination group. Similarly, and denote the exposed (infected but not yet infectious) individuals in the pro- and anti-vaccination groups, respectively. The variables and correspond to the infectious individuals in the pro- and anti-vaccination groups, respectively, while and represent the recovered (temporarily immune) individuals in the pro- and anti-vaccination groups, respectively. The parameters of the model are defined as follows. and denote the infection rates within the pro- and anti-vaccination groups, respectively. We assume that , since vaccinated individuals face a reduced risk of infection at the population level. The parameters and represent the recovery rates for infected individuals in the pro- and anti-vaccination groups, respectively. For consistency, we take , meaning that the recovery period of pro-vaccination individuals is shorter, which allows the basic reproduction number of the model to remain unchanged. The parameter refers to the waning rate of immunity, while stands for the vaccination rate in the pro-vaccination group. The coefficient a denotes the rate at which individuals move from the pro-vaccination susceptible group to the anti-vaccination susceptible group , while b represents the opposite transition, that is, from to . y denotes the fraction of recovered individuals from the pro-vaccination group who, upon losing immunity, shift to the anti-vaccination susceptible group , while a fraction of them return to the susceptible pro-vaccination class . Conversely, x represents the fraction of recovered individuals from the anti-vaccination group who, after losing immunity, join the susceptible pro-vaccination class , whereas a fraction of them return to the susceptible anti-vaccination group . Finally, the parameters and denote the progression rates from the exposed to the infectious compartments in the pro- and anti-vaccination groups, respectively, and are thus the inverses of the average incubation periods. The dynamics of the problem is illustrated by the flowchart in Figure 1.
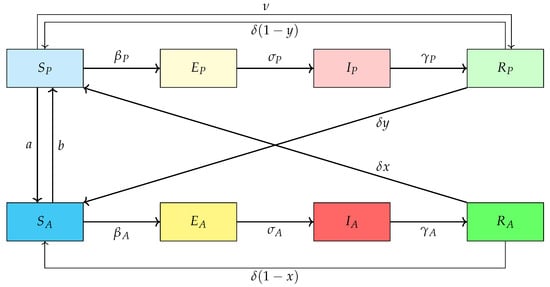
Figure 1.
The SEIR infection flowchart.
It is clear that the disease-free equilibrium (DFE) is
for the system (1) and (2). At the DFE we have
and
Note that x does not appear in these expressions since at the DFE .
Linearizing the system around the DFE gives
The next-generation matrix is and the basic reproduction number is
where denotes the spectral radius.
Straightforward calculations then yield:
2.2. Behavior Model
We present a behavior model that accounts for the time-dependent migration between subpopulations. Individuals in the susceptible provaccination group (P) may switch to the susceptible antivaccination group (A) at rate a, while those in A may switch to P at rate b. Similarly, recovered individuals from the provaccination group () may return to A at rate y, and recovered individuals from the antivaccination group () may return to P at rate x.
The dynamic evolution of these migration rates is given by
where the parameters , , , and represent the inertial effects of migration from P to A, from A to P, from to P, and from to A, respectively. The quantities and denote the individual cost associated with choosing the antivaccination and provaccination strategies, respectively. Here we assume that . In addition, individuals choose their strategy twice: before infection and after recovery.
Before infection, individuals evaluate the total number of infected in both subpopulations. If the infection among P (i.e., ) increases, individuals are more likely to adopt the antivaccination strategy A, whereas if the infection among A (i.e., ) increases, they tend to adopt P. After recovery, individuals decide based on the payoff accrued during infection and the total number of recovered individuals from both groups. The total payoff at each time interval is computed as the product of individual costs and the number of recovered individuals. If the payoff from the antivaccination group increases, individuals tend to prefer the provaccination strategy, and vice versa.
2.3. Total Infection, Average Social Payoff and Social Efficiency Deficit
The total number of infected individuals from the provaccination and antivaccination groups are, respectively,
where denotes the equilibrium state (the Nash equilibrium (NE)).
The average social payoff (ASP) at NE is
where the first and second terms represent the total payoffs of individuals who commit to provaccination and antivaccination strategies, respectively.
Following the definition of the social efficiency deficit (SED), we evaluate the discrepancy between the ASP at NE and the ASP at a socially optimal state (SO). The SO state is obtained for and such that
In practice, in order to calculate , we assumed a time-constant a, b, x and y instead of the introduction of the Equation (10). Subsequently, varying time-constant a, b, x and y, we found a certain values of them maximizing , which is the definition of .
The SED is then
If NE equals SO, SED is zero; if SED is positive, a social dilemma exists.
3. Numerical Simulations and Discussion
The fourth-order Runge–Kutta numerical method is used to solve the system (1), and (10). From (1), we observe that the total population remains constant. To ensure the validity of (2), we choose the following initial conditions:
(with their sum equal to one).
The initial values for the migration rates are:
The parameters used in this study () are , , , , , , and . The new parameters of the problem are set as and .
Figure 2 shows the population dynamics as well as the time evolution of migration rates. The transmission and recovery rates differ between pro- and anti-vaccination groups but are adjusted to keep. Results show that at NE, the dynamics of both groups align, particularly for the infected compartments. However, the recovered population is larger in the pro-vaccination group than in the anti-vaccination group. Behavioral dynamics indicate that individuals tend to shift toward the pro-vaccination state due to higher infection in the anti-vaccination group and toward the anti-vaccination group when the payoff associated with recovery is greater.
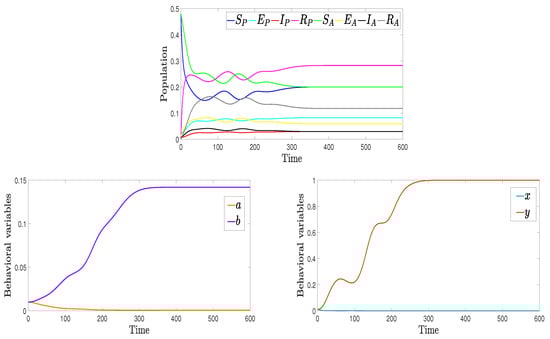
Figure 2.
Population dynamics (top), migration rates a and b (bottom left) and migration rates x and y (bottom right) for , , , and .
The top row of Figure 3 illustrates the total number of infected individuals in both the provaccination and antivaccination groups at equilibrium, along with the ASP at the NE state. The second row shows the total number of infected individuals and the ASP at the SO state. The bottom row corresponds to the SED information. In all panels, the horizontal axis represents the waning immunity rate , while the vertical axis represents the vaccination rate .
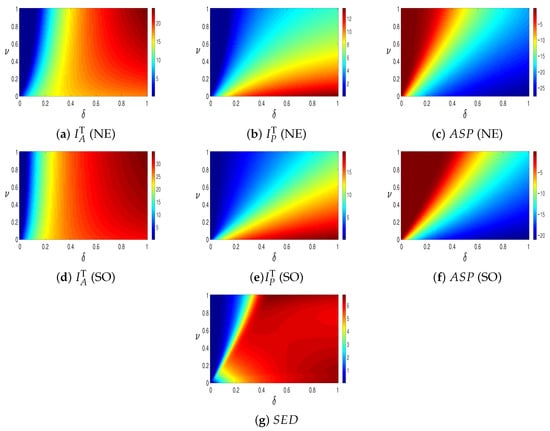
Figure 3.
Comparison of , , and for NE (top row) and SO (middle row), and (bottom) and .
Panel (a) shows that as the waning immunity rate increases, the total number of infected individuals also increases (from blue to red). Conversely, increasing the vaccination rate reduces infections (from red to blue), as shown in panel (b). The overall number of infections is lower compared to panel (a), as individuals tend to adopt the provaccination strategy more frequently near the NE state. Panel (c) displays ASP at NE, obtained by combining panels (a) and (b) with their respective payoffs.
In panel (d), infections remain low for small values of the waning rate. Panel (e) shows that higher vaccination rates decrease infections, whereas higher waning rates increase them, following a similar pattern to panels (a) and (b). This occurs because, at the SO state, the provaccination strategy—despite yielding a lower individual payoff than the antivaccination strategy—is chosen as the socially optimal option, leading to a maximal flow into the provaccination group. As a result, most infections at SO are concentrated among provaccination individuals. Panel (f) illustrates the total payoff in the SO case, which is lower than in the NE case.
Finally, panel (g) presents the SED, i.e., the difference between the SO and NE states. The results indicate that higher vaccination rates reduce the social dilemma, as the payoffs at SO and NE become more aligned. In contrast, higher waning rates exacerbate the dilemma, since individuals face greater uncertainty when immunity—whether vaccine- or infection-induced—is short-lived. When both the waning immunity and vaccination rates are high, the social dilemma reaches its peak.
The top row of Figure 4 presents the total number of infected individuals in both the provaccination and antivaccination groups at the NE state, together with the ASP at NE. The second row illustrates the total number of infected individuals from both groups and the ASP at the SO state. The bottom row corresponds to the SED information. Each panel is plotted with the transmission rate of the antivaccination group, , on the horizontal axis, and the transmission rate of the provaccination group, , on the vertical axis. These are triangular heat maps, assuming that the infection rate in the antivaccination group is higher than in the provaccination group.
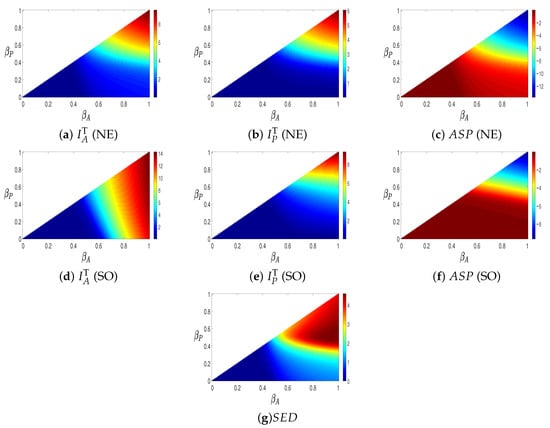
Figure 4.
Comparison of , , and for NE (top row) and SO (middle row), and (bottom) for , and .
Panel (a) shows that the total number of infections becomes large when both and are high. A similar trend is observed in panel (b), although the number of infections is higher than in panel (a). Hence, the provaccination group experiences more infections than the antivaccination group. Since the transmission rates are comparable across both groups, more individuals adopt the provaccination strategy despite its lower payoff. In the SO case, infections in the antivaccination group remain very low, while infections in the provaccination group are relatively high. This outcome arises because the SO state aims to minimize the overall cost, and therefore favors the provaccination strategy due to its lower individual payoff.
Panels (c) and (f) report the ASP of the provaccination and antivaccination groups, respectively, while panel (g) shows the resulting SED. In panel (c), the NE case reveals that increasing the transmission rate leads to higher payoffs. A similar pattern is observed in panel (f). From the SED in panel (g), we observe that a simultaneous increase in both and intensifies the social dilemma.
The numerical simulations obtained using the fourth-order Runge–Kutta method provide valuable insights into the coupled epidemiological and behavioral processes of the proposed SEIR model. The preservation of the total population confirms the internal consistency of the system, while the differentiation in transmission and recovery parameters between pro- and anti-vaccination groups highlights the behavioral heterogeneity influencing epidemic outcomes. At the Nash equilibrium, both groups exhibit synchronized infection dynamics, but the pro-vaccination group achieves a larger recovered population, reflecting the protective effect of vaccination advocacy. The behavioral dynamics demonstrate that individuals tend to migrate toward the pro-vaccination group when infection levels rise within the anti-vaccination group, thereby reducing overall disease prevalence. Conversely, when the perceived payoff associated with recovery exceeds the perceived infection risk, a shift toward the anti-vaccination stance occurs, emphasizing the role of individual incentives in shaping population behavior. These findings reveal the feedback loop between disease dynamics and behavioral adaptation, suggesting that enhancing the perceived benefits of vaccination could stabilize the system and mitigate oscillatory transitions between behavioral groups. Overall, the results underscore the importance of incorporating social and behavioral mechanisms in epidemic models to better inform public health interventions and policy design.
4. Conclusions
This study investigates how individual behavior influences the spread of infectious diseases by modeling a population divided into provaccination and antivaccination groups. Individuals are allowed to switch strategies based on vaccination and recovery outcomes. We have considered an SEIR-based epidemic model that integrates behavioral dynamics by distinguishing between pro-vaccination and anti-vaccination subpopulations. By allowing individuals to switch strategies in response to disease prevalence and payoff differences, the model captures the adaptive nature of human behavior during an epidemic. Embedding the system within an evolutionary game framework reveals that at Nash equilibrium, both groups tend to exhibit similar behavioral patterns. The analysis highlights that increasing vaccination coverage can reduce the social dilemma associated with individual versus collective interests, while higher rates of waning immunity exacerbate it. These findings underscore the importance of both behavioral adaptation and long-term immunity in shaping epidemic outcomes. These results highlight that the interplay between epidemiological dynamics and individual decision-making can significantly alter disease outcomes. The integration of behavioral feedbacks within the SEIR framework demonstrates how perceptions of risk and reward drive shifts in vaccination behavior over time. Encouraging pro-vaccination attitudes and ensuring long-term immunity can therefore stabilize population dynamics and reduce epidemic peaks. Moreover, policies that align individual incentives with collective health benefits may effectively minimize the social dilemma. Future extensions could incorporate demographic heterogeneity or information diffusion to further refine behavioral–epidemic modeling.
Funding
This research received no external funding.
Data Availability Statement
The original contributions presented in this study are included in the article. Further inquiries can be directed to the corresponding author.
Conflicts of Interest
The author declares no conflict of interest.
References
- Augsburger, I. B., Galanthay, G. K., Tarosky, J. H., Rychtář, J., & Taylor, D. (2023). Imperfect vaccine can yield multiple Nash equilibria in vaccination games. Mathematical Biosciences, 356, 108967. [Google Scholar] [CrossRef] [PubMed]
- Axelrod, R., & Hamilton, W. D. (1981). The evolution of cooperation. Science, 211, 1390–1396. [Google Scholar] [CrossRef] [PubMed]
- Bauch, C. T. (2005). Imitation dynamics predict vaccinating behaviour. Proceedings of the Royal Society B: Biological Sciences, 272, 1669–1675. [Google Scholar] [CrossRef] [PubMed]
- Bauch, C. T., & Earn, D. J. D. (2004). Vaccination and the theory of games. Proceedings of the National Academy of Sciences, 101, 13391–13394. [Google Scholar] [CrossRef] [PubMed]
- Caasi, J. A. S., Joseph, B. M., Kodiyamplakkal, H. J., Manibusan, J. R. U., Camacho Aquino, L. J., Oh, H., Rychtář, J., & Taylor, D. (2022). A game-theoretic model of voluntary yellow fever vaccination to prevent urban outbreaks. Games, 13(4), 55. [Google Scholar] [CrossRef]
- Darwin, C. (1859). On the origin of species by means of natural selection, or the preservation of favoured races in the struggle for life. John Murray. [Google Scholar]
- Dawes, R. M. (1980). Social dilemmas. Annual Review of Psychology, 31, 169–193. [Google Scholar] [CrossRef]
- Hausken, K., & Ncube, M. (2022). A game theoretic analysis of competition between vaccine and drug companies during disease contraction and recovery. Medical Decision Making, 42(5), 571–586. [Google Scholar] [CrossRef] [PubMed]
- Hofbauer, J., & Sigmund, K. (1998). Evolutionary games and population dynamics. Cambridge University Press. [Google Scholar]
- Karandikar, R., Mookherjee, D., Ray, D., & Vega-Redondo, F. (1998). Evolving aspirations and cooperation. Journal of Economic Theory, 80, 292–331. [Google Scholar] [CrossRef]
- Kermack, W. O., & McKendrick, A. G. (1927). A contribution to the mathematical theory of Epidemics. Proceedings of the Royal Society A, 115, 700–721. [Google Scholar] [CrossRef]
- Kerr, B., Riley, M. A., Feldman, M. W., & Bohannan, B. J. M. (2002). Local dispersal promotes biodiversity in a real-life game of Rock–Paper–Scissors. Nature, 418, 171–174. [Google Scholar] [CrossRef] [PubMed]
- Khan, M. M. U. R., & Tanimoto, J. (2023). Investigating the social dilemma of an Epidemic model with provaccination and antivaccination groups: An evolutionary approach. Alexandria Engineering Journal, 75, 341–349. [Google Scholar] [CrossRef]
- Marquez, R. M. A., Minas, M. S. C., Santos, J. V. T., Yoon, K., Campo, V. N. S., Oh, H., Rychtář, J., & Taylor, D. (2024). Game-theoretical model of COVID-19 vaccination in the endemic equilibrium. Journal of Biological Systems, 32(02), 349–370. [Google Scholar] [CrossRef]
- Martcheva, M. (2015). An introduction to mathematical epidemiology. Springer. [Google Scholar]
- Martinez, A., Machado, J., Sanchez, E., & Erovenko, I. V. (2025). Optimal vaccination strategies to reduce endemic levels of meningitis in Africa. Games, 16(5), 45. [Google Scholar] [CrossRef]
- Maynard Smith, J. (1982). Evolution and the theory of games. Cambridge University Press. [Google Scholar]
- Nowak, M. A. (2006). Evolutionary dynamics: Exploring the equations of life. Harvard University Press. [Google Scholar]
- Oechssler, J. (2002). Cooperation as a result of learning with aspiration levels. Journal of Economic Behavior & Organization, 49, 405–409. [Google Scholar] [CrossRef]
- Scheckelhoff, K., Ejaz, A., Erovenko, I. V., Rychtář, J., & Taylor, D. (2021). Optimal voluntary vaccination of adults and adolescents can help eradicate hepatitis B in China. Games, 12(4), 82. [Google Scholar] [CrossRef]
- Smith, J. M., & Price, G. R. (1973). The logic of animal conflict. Nature, 246, 15–18. [Google Scholar] [CrossRef]
- Traulsen, A., & Hauert, C. (2009). Stochastic evolutionary game dynamics. In Reviews of nonlinear dynamics and complexity (pp. 25–61). Wiley. [Google Scholar]
- von Neumann, J., & Morgenstern, O. (1944). Theory of games and economic behavior. Princeton University Press. [Google Scholar]
Disclaimer/Publisher’s Note: The statements, opinions and data contained in all publications are solely those of the individual author(s) and contributor(s) and not of MDPI and/or the editor(s). MDPI and/or the editor(s) disclaim responsibility for any injury to people or property resulting from any ideas, methods, instructions or products referred to in the content. |
© 2025 by the author. Licensee MDPI, Basel, Switzerland. This article is an open access article distributed under the terms and conditions of the Creative Commons Attribution (CC BY) license (https://creativecommons.org/licenses/by/4.0/).