Ion Juvina found an error in our manuscript published in Games [1]. The error led to overestimation (by about 3%) of the alternation rate presented in Table 2 (in page 120). The correction does not change the main conclusions, but it slightly changes five exhibits. The corrected exhibits are presented below, and in the competition website (http://sites.google.com/site/gpredcomp).

Table 2.
The 40 market entry games that were studied in the estimation experiment. At each trial, each of 4 players has to decide (individually) between “entering a risky market”, or “staying out” (a safer prospect). The payoffs depended on a realization of a binary gamble (the realization at trial t is denoted Gt, and yields “H with probability Ph; and L otherwise”), the number of entrants (E), and two additional parameters (k and S). The exact payoff for player i at trial t is:
The left hand-columns present the exact value of the different parameters in the 40 games, the right hand columns present the equilibrium predictions, and the main experimental results in the first and second block (B1 and B2).
| Experimental results | |||||||||||||
|---|---|---|---|---|---|---|---|---|---|---|---|---|---|
| The games | Entry at eq. | Entry rates | Efficiency | Alternations | |||||||||
| # | K | ph | H | L | S | pure | symmetric | B1 | B2 | B1 | B2 | B1 | B2 |
| 1 | 2 | 0.04 | 70 | -3 | 5 | 1.00 | 1.00 | 0.71 | 0.80 | 2.77 | 2.66 | 0.16 | 0.16 |
| 2 | 2 | 0.23 | 30 | -9 | 4 | 1.00 | 1.00 | 0.55 | 0.62 | 2.64 | 2.75 | 0.25 | 0.23 |
| 3 | 2 | 0.67 | 1 | -2 | 3 | 1.00 | 1.00 | 0.88 | 0.94 | 2.39 | 2.24 | 0.10 | 0.04 |
| 4 | 2 | 0.73 | 30 | -80 | 4 | 1.00 | 1.00 | 0.71 | 0.64 | 2.58 | 2.57 | 0.28 | 0.27 |
| 5 | 2 | 0.80 | 20 | -80 | 5 | 1.00 | 1.00 | 0.66 | 0.67 | 2.50 | 2.67 | 0.29 | 0.27 |
| 6 | 2 | 0.83 | 4 | -20 | 3 | 1.00 | 1.00 | 0.73 | 0.82 | 2.45 | 2.50 | 0.24 | 0.18 |
| 7 | 2 | 0.94 | 6 | -90 | 5 | 1.00 | 1.00 | 0.86 | 0.87 | 2.34 | 2.38 | 0.13 | 0.11 |
| 8 | 2 | 0.95 | 1 | -20 | 5 | 1.00 | 1.00 | 0.86 | 0.91 | 2.48 | 2.31 | 0.12 | 0.08 |
| 9 | 2 | 0.96 | 4 | -90 | 3 | 1.00 | 1.00 | 0.87 | 0.90 | 2.36 | 2.34 | 0.14 | 0.08 |
| 10 | 3 | 0.10 | 70 | -8 | 4 | 0.75 | 0.77 | 0.42 | 0.48 | 1.22 | 1.11 | 0.29 | 0.25 |
| 11 | 3 | 0.90 | 9 | -80 | 4 | 0.75 | 0.77 | 0.80 | 0.73 | -0.33 | 0.29 | 0.18 | 0.25 |
| 12 | 3 | 0.91 | 7 | -70 | 6 | 0.75 | 0.77 | 0.76 | 0.83 | 0.10 | -0.41 | 0.19 | 0.12 |
| 13 | 4 | 0.06 | 60 | -4 | 2 | 0.50 | 0.50 | 0.42 | 0.41 | 0.52 | 0.84 | 0.22 | 0.15 |
| 14 | 4 | 0.20 | 40 | -10 | 4 | 0.50 | 0.50 | 0.48 | 0.46 | -0.34 | 0.04 | 0.31 | 0.31 |
| 15 | 4 | 0.31 | 20 | -9 | 4 | 0.50 | 0.50 | 0.49 | 0.44 | -0.07 | 0.30 | 0.34 | 0.38 |
| 16 | 4 | 0.60 | 4 | -6 | 2 | 0.50 | 0.50 | 0.56 | 0.58 | -0.27 | -0.26 | 0.22 | 0.26 |
| 17 | 4 | 0.60 | 40 | -60 | 3 | 0.50 | 0.50 | 0.58 | 0.55 | -0.96 | -0.20 | 0.28 | 0.25 |
| 18 | 4 | 0.73 | 3 | -8 | 2 | 0.50 | 0.50 | 0.57 | 0.55 | -0.29 | 0.09 | 0.24 | 0.20 |
| 19 | 4 | 0.80 | 20 | -80 | 2 | 0.50 | 0.50 | 0.64 | 0.63 | -1.30 | -1.21 | 0.28 | 0.27 |
| 20 | 4 | 0.90 | 1 | -9 | 6 | 0.50 | 0.50 | 0.53 | 0.48 | 0.12 | 0.63 | 0.21 | 0.16 |
| 21 | 4 | 0.96 | 3 | -70 | 3 | 0.50 | 0.50 | 0.65 | 0.62 | -0.84 | -0.38 | 0.23 | 0.18 |
| 22 | 5 | 0.02 | 80 | -2 | 3 | 0.25 | 0.33 | 0.36 | 0.31 | 0.24 | 0.64 | 0.17 | 0.17 |
| 23 | 5 | 0.07 | 90 | -7 | 3 | 0.25 | 0.33 | 0.39 | 0.24 | -0.81 | 0.34 | 0.19 | 0.13 |
| 24 | 5 | 0.53 | 80 | -90 | 5 | 0.25 | 0.33 | 0.65 | 0.58 | -3.41 | -2.44 | 0.27 | 0.36 |
| 25 | 5 | 0.80 | 1 | -4 | 2 | 0.25 | 0.33 | 0.45 | 0.42 | -0.31 | 0.11 | 0.20 | 0.18 |
| 26 | 5 | 0.88 | 4 | -30 | 3 | 0.25 | 0.33 | 0.52 | 0.49 | -0.95 | -0.57 | 0.22 | 0.21 |
| 27 | 5 | 0.93 | 5 | -70 | 4 | 0.25 | 0.33 | 0.57 | 0.57 | -1.63 | -1.43 | 0.27 | 0.20 |
| 28 | 6 | 0.10 | 90 | -10 | 5 | 0.25 | 0.22 | 0.26 | 0.27 | -0.13 | 0.07 | 0.22 | 0.19 |
| 29 | 6 | 0.19 | 30 | -7 | 3 | 0.25 | 0.22 | 0.39 | 0.32 | -1.35 | -0.45 | 0.27 | 0.26 |
| 30 | 6 | 0.29 | 50 | -20 | 3 | 0.25 | 0.22 | 0.47 | 0.48 | -2.74 | -2.43 | 0.38 | 0.36 |
| 31 | 6 | 0.46 | 7 | -6 | 6 | 0.25 | 0.22 | 0.38 | 0.34 | -0.90 | -0.38 | 0.23 | 0.24 |
| 32 | 6 | 0.57 | 6 | -8 | 4 | 0.25 | 0.22 | 0.44 | 0.39 | -1.56 | -0.59 | 0.26 | 0.27 |
| 33 | 6 | 0.82 | 20 | -90 | 3 | 0.25 | 0.22 | 0.63 | 0.55 | -5.33 | -3.14 | 0.26 | 0.21 |
| 34 | 6 | 0.88 | 8 | -60 | 4 | 0.25 | 0.22 | 0.57 | 0.50 | -3.30 | -1.96 | 0.16 | 0.19 |
| 35 | 7 | 0.06 | 90 | -6 | 4 | 0.25 | 0.14 | 0.31 | 0.35 | -1.40 | -1.43 | 0.29 | 0.21 |
| 36 | 7 | 0.21 | 30 | -8 | 3 | 0.25 | 0.14 | 0.39 | 0.31 | -2.20 | -1.04 | 0.30 | 0.23 |
| 37 | 7 | 0.50 | 80 | -80 | 5 | 0.25 | 0.14 | 0.51 | 0.55 | -4.18 | -4.78 | 0.34 | 0.32 |
| 38 | 7 | 0.69 | 9 | -20 | 5 | 0.25 | 0.14 | 0.46 | 0.34 | -2.62 | -0.88 | 0.25 | 0.23 |
| 39 | 7 | 0.81 | 7 | -30 | 2 | 0.25 | 0.14 | 0.41 | 0.34 | -2.25 | -0.93 | 0.22 | 0.21 |
| 40 | 7 | 0.91 | 1 | -10 | 2 | 0.25 | 0.14 | 0.34 | 0.27 | -0.71 | -0.30 | 0.19 | 0.17 |
| Means | 0.51 | 0.51 | 0.56 | 0.54 | -0.39 | 0.04 | 0.23 | 0.21 | |||||
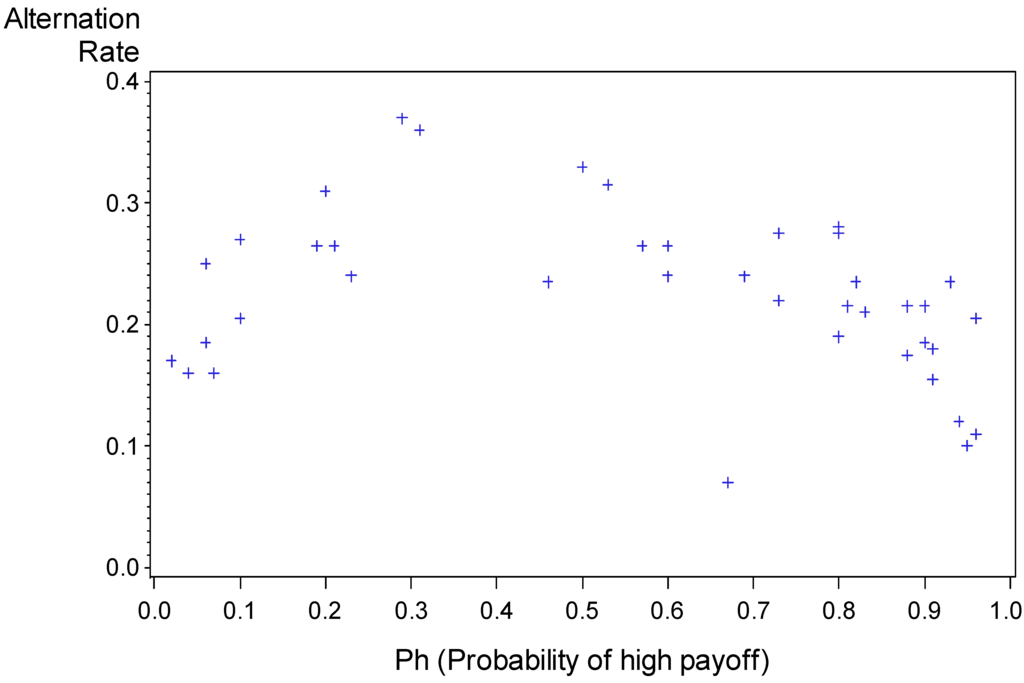
Figure 1.
Proportion of alternation as a function of Ph. Each data point summarizes the results of one game. The outlier (alternation rate of 0.07 when Ph = 0.67) is Problem 3: The problem with the lowest payoff variance, and the only problem in which entry cannot lead to losses.
Table 3.
Summary of correlation analyses that examine the possibility of consistent individual differences. The summary scores are based on 180 correlation analyses (180 pairs of games) for each of the four variables.
| Variable | Mean correlation | Proportion of positive correlations |
|---|---|---|
| Entry rate | 0.249 | 0.844 |
| Maximization | 0.058 | 0.611 |
| Alternation | 0.415 | 0.983 |
| Recency | 0.281 | 0.888 |
Table 4.
The baseline models, the estimated parameters, and the implied normalized MSD scores by statistic and block.
| Model | Fitted parameters | Normalized Mean Squared Deviation Scores by statistic and block | ||||||
|---|---|---|---|---|---|---|---|---|
| Entry rates | Efficiency | Alteration | Mean | |||||
| Block: | 1 | 2 | 1 | 2 | 1 | 2 | ||
| Pure | 26.52 | 21.56 | 39.41 | 28.01 | 49.50 | 35.26 | 33.38 | |
| Symmetric | 29.57 | 25.11 | 21.13 | 13.24 | 30.59 | 25.95 | 24.26 | |
| RL | λ = 4, w = 0.01 | 8.57 | 16.37 | 5.19 | 8.84 | 19.14 | 12.22 | 11.72 |
| NRL | λ = 12, w = 0.025 | 6.36 | 14.03 | 3.59 | 7.35 | 4.58 | 1.53 | 6.24 |
| SFP | λ = 1.5, w = 0.1 | 5.91 | 5.36 | 9.37 | 14.99 | 6.53 | 3.79 | 7.66 |
| NFP | λ = 4, w = 0.15 | 4.75 | 4.16 | 3.60 | 6.13 | 2.70 | 3.80 | 4.19 |
| EWA | λ = 0.7, φ = 0.8, δ = 0.5, ρ = 0.4 | 10.06 | 8.91 | 4.69 | 9.22 | 4.38 | 2.49 | 6.62 |
| SAW | εi ~ U[0,0.02], wi ~ U[0,1], ρi ~ U[0,0.02], and µi = {1, 2, or 3}. | 3.93 | 2.49 | 1.87 | 2.04 | 4.18 | 5.37 | 3.31 |
| I-SAW | εi ~ U[0,0.24], wi ~ U[0,0.8], ρi ~ U[0,0.2], πi ~ U[0,0.6], and µi = {1, 2, or 3}. | 1.56 | 1.19 | 1.37 | 1.47 | 1.43 | 1.30 | 1.38 |
Table 5.
The predictions of the best baseline models (I-SAW): The lowest row presents the correlation with the experimental results by statistic.
| The games | Entry rates | Efficiency | Alternations | ||||||||
|---|---|---|---|---|---|---|---|---|---|---|---|
| # | K | Ph | h | l | Sf | B1 | B2 | B1 | B2 | B1 | B2 |
| 1 | 2 | 0.04 | 70 | -3 | 5 | 0.78 | 0.81 | 2.60 | 2.56 | 0.17 | 0.13 |
| 2 | 2 | 0.23 | 30 | -9 | 4 | 0.58 | 0.62 | 2.39 | 2.62 | 0.24 | 0.22 |
| 3 | 2 | 0.67 | 1 | -2 | 3 | 0.90 | 0.91 | 2.33 | 2.32 | 0.10 | 0.08 |
| 4 | 2 | 0.73 | 30 | -80 | 4 | 0.64 | 0.64 | 2.47 | 2.59 | 0.26 | 0.25 |
| 5 | 2 | 0.80 | 20 | -80 | 5 | 0.67 | 0.67 | 2.47 | 2.61 | 0.24 | 0.23 |
| 6 | 2 | 0.83 | 4 | -20 | 3 | 0.77 | 0.78 | 2.49 | 2.57 | 0.20 | 0.18 |
| 7 | 2 | 0.94 | 6 | -90 | 5 | 0.82 | 0.82 | 2.39 | 2.49 | 0.15 | 0.14 |
| 8 | 2 | 0.95 | 1 | -20 | 5 | 0.84 | 0.85 | 2.42 | 2.47 | 0.13 | 0.11 |
| 9 | 2 | 0.96 | 4 | -90 | 3 | 0.84 | 0.86 | 2.35 | 2.43 | 0.13 | 0.11 |
| 10 | 3 | 0.10 | 70 | -8 | 4 | 0.42 | 0.45 | 0.97 | 1.23 | 0.23 | 0.21 |
| 11 | 3 | 0.90 | 9 | -80 | 4 | 0.74 | 0.75 | -0.06 | 0.11 | 0.19 | 0.18 |
| 12 | 3 | 0.91 | 7 | -70 | 6 | 0.76 | 0.76 | -0.15 | 0.05 | 0.18 | 0.17 |
| 13 | 4 | 0.06 | 60 | -4 | 2 | 0.41 | 0.43 | 0.22 | 0.34 | 0.24 | 0.22 |
| 14 | 4 | 0.20 | 40 | -10 | 4 | 0.43 | 0.44 | -0.04 | 0.25 | 0.27 | 0.25 |
| 15 | 4 | 0.31 | 20 | -9 | 4 | 0.48 | 0.49 | -0.22 | 0.01 | 0.29 | 0.28 |
| 16 | 4 | 0.60 | 4 | -6 | 2 | 0.52 | 0.52 | -0.20 | -0.05 | 0.30 | 0.28 |
| 17 | 4 | 0.60 | 40 | -60 | 3 | 0.55 | 0.55 | -0.78 | -0.47 | 0.29 | 0.28 |
| 18 | 4 | 0.73 | 3 | -8 | 2 | 0.53 | 0.52 | -0.20 | -0.08 | 0.29 | 0.27 |
| 19 | 4 | 0.80 | 20 | -80 | 2 | 0.65 | 0.64 | -1.65 | -1.23 | 0.24 | 0.24 |
| 20 | 4 | 0.90 | 1 | -9 | 6 | 0.52 | 0.52 | 0.07 | 0.06 | 0.25 | 0.23 |
| 21 | 4 | 0.96 | 3 | -70 | 3 | 0.61 | 0.59 | -0.80 | -0.51 | 0.21 | 0.19 |
| 22 | 5 | 0.02 | 80 | -2 | 3 | 0.35 | 0.35 | -0.08 | 0.06 | 0.23 | 0.20 |
| 23 | 5 | 0.07 | 90 | -7 | 3 | 0.31 | 0.32 | -0.42 | -0.05 | 0.21 | 0.19 |
| 24 | 5 | 0.53 | 80 | -90 | 5 | 0.52 | 0.52 | -2.03 | -1.59 | 0.29 | 0.28 |
| 25 | 5 | 0.80 | 1 | -4 | 2 | 0.40 | 0.40 | -0.24 | -0.10 | 0.25 | 0.23 |
| 26 | 5 | 0.88 | 4 | -30 | 3 | 0.47 | 0.46 | -0.89 | -0.73 | 0.25 | 0.22 |
| 27 | 5 | 0.93 | 5 | -70 | 4 | 0.51 | 0.50 | -1.43 | -1.08 | 0.24 | 0.21 |
| 28 | 6 | 0.10 | 90 | -10 | 5 | 0.31 | 0.31 | -1.08 | -0.63 | 0.22 | 0.20 |
| 29 | 6 | 0.19 | 30 | -7 | 3 | 0.36 | 0.36 | -1.28 | -0.90 | 0.26 | 0.24 |
| 30 | 6 | 0.29 | 50 | -20 | 3 | 0.42 | 0.42 | -2.05 | -1.62 | 0.29 | 0.27 |
| 31 | 6 | 0.46 | 7 | -6 | 6 | 0.35 | 0.35 | -0.86 | -0.67 | 0.27 | 0.24 |
| 32 | 6 | 0.57 | 6 | -8 | 4 | 0.36 | 0.35 | -0.94 | -0.70 | 0.27 | 0.25 |
| 33 | 6 | 0.82 | 20 | -90 | 3 | 0.60 | 0.57 | -4.69 | -3.73 | 0.25 | 0.24 |
| 34 | 6 | 0.88 | 8 | -60 | 4 | 0.47 | 0.46 | -2.20 | -1.83 | 0.25 | 0.22 |
| 35 | 7 | 0.06 | 90 | -6 | 4 | 0.26 | 0.26 | -1.19 | -0.68 | 0.20 | 0.18 |
| 36 | 7 | 0.21 | 30 | -8 | 3 | 0.34 | 0.33 | -1.77 | -1.32 | 0.26 | 0.24 |
| 37 | 7 | 0.50 | 80 | -80 | 5 | 0.49 | 0.48 | -4.31 | -3.61 | 0.29 | 0.28 |
| 38 | 7 | 0.69 | 9 | -20 | 5 | 0.37 | 0.36 | -1.84 | -1.52 | 0.26 | 0.24 |
| 39 | 7 | 0.81 | 7 | -30 | 2 | 0.37 | 0.36 | -1.81 | -1.50 | 0.26 | 0.23 |
| 40 | 7 | 0.91 | 1 | -10 | 2 | 0.29 | 0.28 | -0.76 | -0.58 | 0.22 | 0.19 |
| Means | 0.525 | 0.526 | -0.270 | -0.011 | 0.234 | 0.215 | |||||
| Correlation with the experimental results | 0.973 | 0.979 | 0.982 | 0.970 | 0.750 | 0.834 | |||||
References and Notes
- Erev, I.; Ert, E.; Roth, A.E. A choice prediction competition for market entry games: An introduction. Games 2010, 1, 117–136. [Google Scholar]
© 2010 by the authors; licensee MDPI, Basel, Switzerland. This article is an Open Access article distributed under the terms and conditions of the Creative Commons Attribution license (http://creativecommons.org/licenses/by/3.0/).