Abstract
Novel architectures incorporating transport networks and artificial intelligence (AI) are currently being developed for beyond 5G and 6G technologies. Given that the interfacing mobile and transport network nodes deliver high transactional packet volume in downlink and uplink streams, 6G networks envision adopting diverse transport networks, including non-terrestrial types of transport networks such as the satellite network, High-Altitude Platform Systems (HAPS), and DOCSIS cable TV. Hence, there is a need to match the traffic to the transport network. This paper focuses on such a matching problem and defines a method that leverages machine learning and mixed-integer linear programming. Consequently, the proposed scheme in this paper is to develop a traffic steering capability based on types of transport networks, namely, optical, satellite, and DOCSIS cable. Novel findings demonstrate a more than 90% accuracy of steered traffic to respective types of transport networks for dedicated transport network resources.
1. Introduction
Various elements are enabled in the development progress beyond 5G, including artificial intelligence (AI) and ubiquitous connectivity. Telecommunication intelligence (specifically in 6G networks) refers to the ability of a self-contained ecosystem, the self-awareness of state conditions, and optimal appropriate response reactions [1]. Since 6G technology delivers extended distributed intelligence and control mechanisms, artificial intelligence (AI) and machine learning (ML) can benefit the control and optimization processes. For example, the radio function in the access layer is efficiently controlled and coordinated using ML. ML enhances the gNodeB (gNB) functions in bearer coordination, interference management, and radio resource allocation [2,3,4].
The progression toward 6G promotes innovation in telecommunication services and functionalities, in which a blueprint comprising potential use cases is set [5]. This blueprint includes in-depth and new use cases, producing numerous traffic taxonomies in an infrastructure. The blueprint also improves the handling mechanism for traffic classifications in an infrastructure. Generally, a 5G network using the Quality of Flow Index (QFI) method ensures a granular traffic classification. This outcome enhances the Quality of Service (QoS) approach in the previous generation. Nevertheless, the upcoming 6G network is more holistic due to the end-to-end network flexibility. This flexibility enables the network to adapt to traffic behaviors along the entire connection regardless of the terrestrial type [5].
The increasing number of telecommunication devices is directly proportional to the growing spatial demand for these services. This observation necessitates the provision of viable services to every populated area. Given that network adoption can increase in the forthcoming years, higher transport network variations concerning their selection and deployment can be observed. One example of addressing the less populated areas (rural land areas) is through network adoption by providing offshore services. The 5G Infrastructure Public–Private Partnership (5G PPP) introduced a vision to have an architecture design as a single access network comprising terrestrial networks (TNs) and non-terrestrial networks (NTNs) to advance ubiquitous connectivity [1]. An example of NTN technology is satellite technology. Satellite ubiquity aptitude demonstrates its presence for quick and accessible options for service provisioning.
The advancement of technology towards 6G is encouraged by diverse use cases and supported by advanced transport networks. Nonetheless, there are missing areas in integrating the heterogeneity of use cases and transport networks that could lead to more efficient infrastructure. This study proposed an intelligent steering mechanism for regrouping the data that shared the same attributes and matched the transport network properties. The data or traffic in this study were reorganized and regrouped into a total number of available transport networks arranged in a particular service area. Each data group was redirected towards optimum-matched transport technologies compared to the conventional traffic-splitting method. For example, in an urban area where the current terrestrial transport network is reaching capacity, expansion works are not time- and operationally feasible; therefore, integrating a non-terrestrial network is the most viable alternative, and steering the traffic to alternative paths is a feasible approach. Therefore, the most viable alternative is integrating an NTN technology and redirecting the traffic to alternative paths. Hence, utilizing existing satellite and cable TV is an option in which these two technologies are dynamically provisioned and readily available [6,7,8].
This paper defines an optimization problem that aims to maximize overall resource utilization by steering pertinent traffic types to appropriate transport networks that resolve unnecessary issues such as traffic delays and congestion. The process assigned relevant traffic clusters to appropriate transport networks, using machine learning (ML) and mixed integer linear programming (MILP) techniques. Subsequently, the resource assignment method was manipulated to determine the optimal assignment between the cluster and the transport network. The objectives of this study are as follows:
- i.
- Introduce a traffic steering scheme that optimizes the coexistence of heterogeneous transport networks.
- ii.
- Demonstrate the comparative measures for traffic steering using ML and MILP against traffic classifications.
- iii.
- Demystify the factors contributing to the cluster-transport assignment.
The remainder of this study is organized as follows: Section 2 refers to several research studies related to this study. Section 3 details the foreseeable issues discovered by these studies. Section 4 discusses the framework for the traffic-to-transport network assignment proposal. Section 5 highlights the findings and analysis of the observations from the simulation scenario incorporated in the framework. Finally, Section 6 describes the conclusion and future works.
2. Related Works
The future of the 6G transport network anticipates the possibility of multiple co-existing transport network technologies. Meanwhile, the 5G network optimally utilizes an optical transport network to connect the network elements. Given that the developed optical transport networks have made significant progress in facilitating various use cases, the optical network is extensively used for hyperscale applications in data center network architecture. This process adheres to the strict requirements of Data Center Interconnects (DCIs) [9]. A study by Ruffini et al. reported a state-of-the-art passive optical network (PON) technology (NG-PON2) [10]. The study effectively performed the convergence process in a single PON infrastructure. Conversely, Mitra et al. described that the optical network deployment involved significant concerns regarding land acquisition and long deployment time [11].
There are circumstances where, geographically, it would not be optimal to lay the fiber networks in greenfield or brownfield areas. Hence, the most practical solution to address the increasing service demand is redirecting the traffic to alternative transport network technology (non-terrestrial network options). The software-defined network (SDN) and network function virtualization (NFV) technology also encourages software function developments in a white box, providing significant advantages to distributed nodes with steering (or load balance) and gateway functions to other transport network technologies. A study by Tirmizi et al. denoted the recent works in hybrid satellite and terrestrial fields, which provided twofold values [12] concerning the workability of the satellite transport network, and also revealed the issues concerning the necessary coordination steps in understanding the respective transport network technology properties and synthesizing the two technologies. These circumstances can inevitably result in the coexistence of heterogeneous transport networks, requiring an effective intelligent mechanism. Therefore, the coverage capability of satellite technology renders it a feasible option for transport network service accessibility. The Data Over Cable Service Interface Specification (DOCSIS) cable infrastructure is another technology option with an extensive footprint in residential areas [5]. Consequently, this study maximized the three coexistence lists of transport network technology by harnessing the ML ability and the utilization of an optimization solver to yield intelligent mechanisms.
Another study by Tirmizi et al. surveyed the findings from an integration process involving TN and NTN transport technologies [12]. The study highlighted several challenges in adopting satellite technology, including resource management, the mechanism to offload traffic, and path selection or routing. Considering the satellite network attributes and the obligation to sustain traffic QoS, steering the right traffic to the right transport network was the underlying factor in these challenges. Each stipulated challenge was elaborated by establishing a mechanism for utilizing hybrid networks (satellite and terrestrial) to achieve the most effective configuration. The study also reported that using the traditional approach to handle traffic in the hybrid network or adopting a distinctive resource management approach from these two networks could generate inefficient resource utilization and compromise network performance. Therefore, future network generation should emphasize improved connectivity, including various technologies to support the exponential growth of data, devices, and use cases [1,5,7]. A novel mechanism is needed to maximize and achieve optimal integration in a heterogeneous network infrastructure due to the demands concerning future ideas and the unique attributes of integrating multiple transport network technologies.
Numerous studies have investigated this condition in single-domain and multi-domain transport technologies. Two studies by Giambene et al. and Lubna et al. effectively contributed to the concept of this study [6,13]. Lubna et al. studied links connecting two distinctive sender and receiver nodes [14]. The study computed an optimum path based on various link attributes such as bandwidth, delay, and loss. Subsequently, the optimal link from the computing process decided to schedule the traffic to the link to carry the low latency and high data rate traffic. This study used a similar approach in which the selected transport network acquired specific bandwidth, delay, and error rate values. In contrast, the optimal matching attributes between the traffic and link determined the link or transport selection. An intelligent pre-path selection process was also necessary for the node, comprising various traffic types and terrestrial and transport network integration. This process divided the traffic into respective transport networks, and each transport network type exclusively handled similar traffic patterns within its domain.
Although traffic engineering studies concerning path selections and routing decisions have existed for many years, the incoming technology can slightly modify the current states of 5G and 6G heterogeneous networks, routing strategy, and optimal path selection. Hence, integrating NTNs into the infrastructure is essential to present the network adoption benefits [15]. The coexistence of TNs and NTNs initiates the exploration of the mechanisms to redirect certain traffic types to designated transport networks [15]. Moreover, effectively directing traffic to various transport networks requires determining the optimal approach to distribute the traffic load across different transport network types. This necessity occurs as each traffic possesses unique attributes that define its properties. For example, satellite constellations demonstrate quick resolution to infrastructure, service provisioning, and capacity planning constraints. Even though the satellite network is optimal for delivering efficient service coverage, the longer round-trip time constraint cannot be eliminated. Hence, intelligent mechanisms are vital in the infrastructure to comprehensively comprehend the traffic load properties and the transport network attributes. This process determines the most suitable traffic-transport allocation and assignment to optimize end-to-end efficiency.
Several studies have investigated 6G networks across multiple layers. One approach is to pursue the capability to enable a disaggregated infrastructure and achieve an optimal operational state by implementing distributed service provisioning mechanisms [16]. Therefore, the end-to-end design of the next-generation network must be adapted to meet emerging demands. Numerous studies have implemented AI and traffic engineering methods to cope with the robust requirements supporting future networks. The advancement of ML facilitated the expansion of AI, which became one of its fundamental components. Furthermore, the innovation breakthrough in end-to-end operation and efficiency in the infrastructure has led to numerous enhancements. A study by Tang et al. performed a thorough and chronological survey, analyzing many ML use case types in 5G infrastructure [17]. The study involved the elements at the network access, routing, congestion control, and application layers.
Introducing newer use cases expands the traffic classifications for 6G networks. A study by Alevizaki et al. developed a distributed control mechanism using evolution game theory [16]. This mechanism resolved the traffic flow assignment issues from the UE. Hence, future network generation anticipates a highly dynamic state of traffic behavior. The pursuit of minimizing costs and optimizing resources are fundamental principles for ensuring the sustainability of operators or service providers. Likewise, a study by Oughton et al. emphasized a survey principle and listed the financial metrics that led to operators adopting resource-sharing mechanisms [18].
The diversity of use cases led to the translation to traffic classification, followed by the QoS Flow Index (QFI) method setting up the specific treatment of each packet in the infrastructure. From another perspective, the generated traffic from every UE has a range of characteristics set as a type of use case, which is made based on size and critical properties like latency and error rate. Nevertheless, certain applications (single-use cases) have attributes overlapping with other use cases. For example, virtual reality (VR) is classified as enhanced mobile broadband (eMBB) and ultra-reliable low-latency communication (URLLC) (subject to operator definition). In some scenarios, a casual internet user produces low and non-critical traffic sharing attributes similar to a massive machine type communication (mMTC) use case traffic. These circumstances forage the investigation to demystify the interrelation between user equipment (UEs) in the serving area; hence, this study opted to manipulate the unsupervised machine learning to produce a cluster within it and find the classifications amongst the UEs that shared similar characteristics.
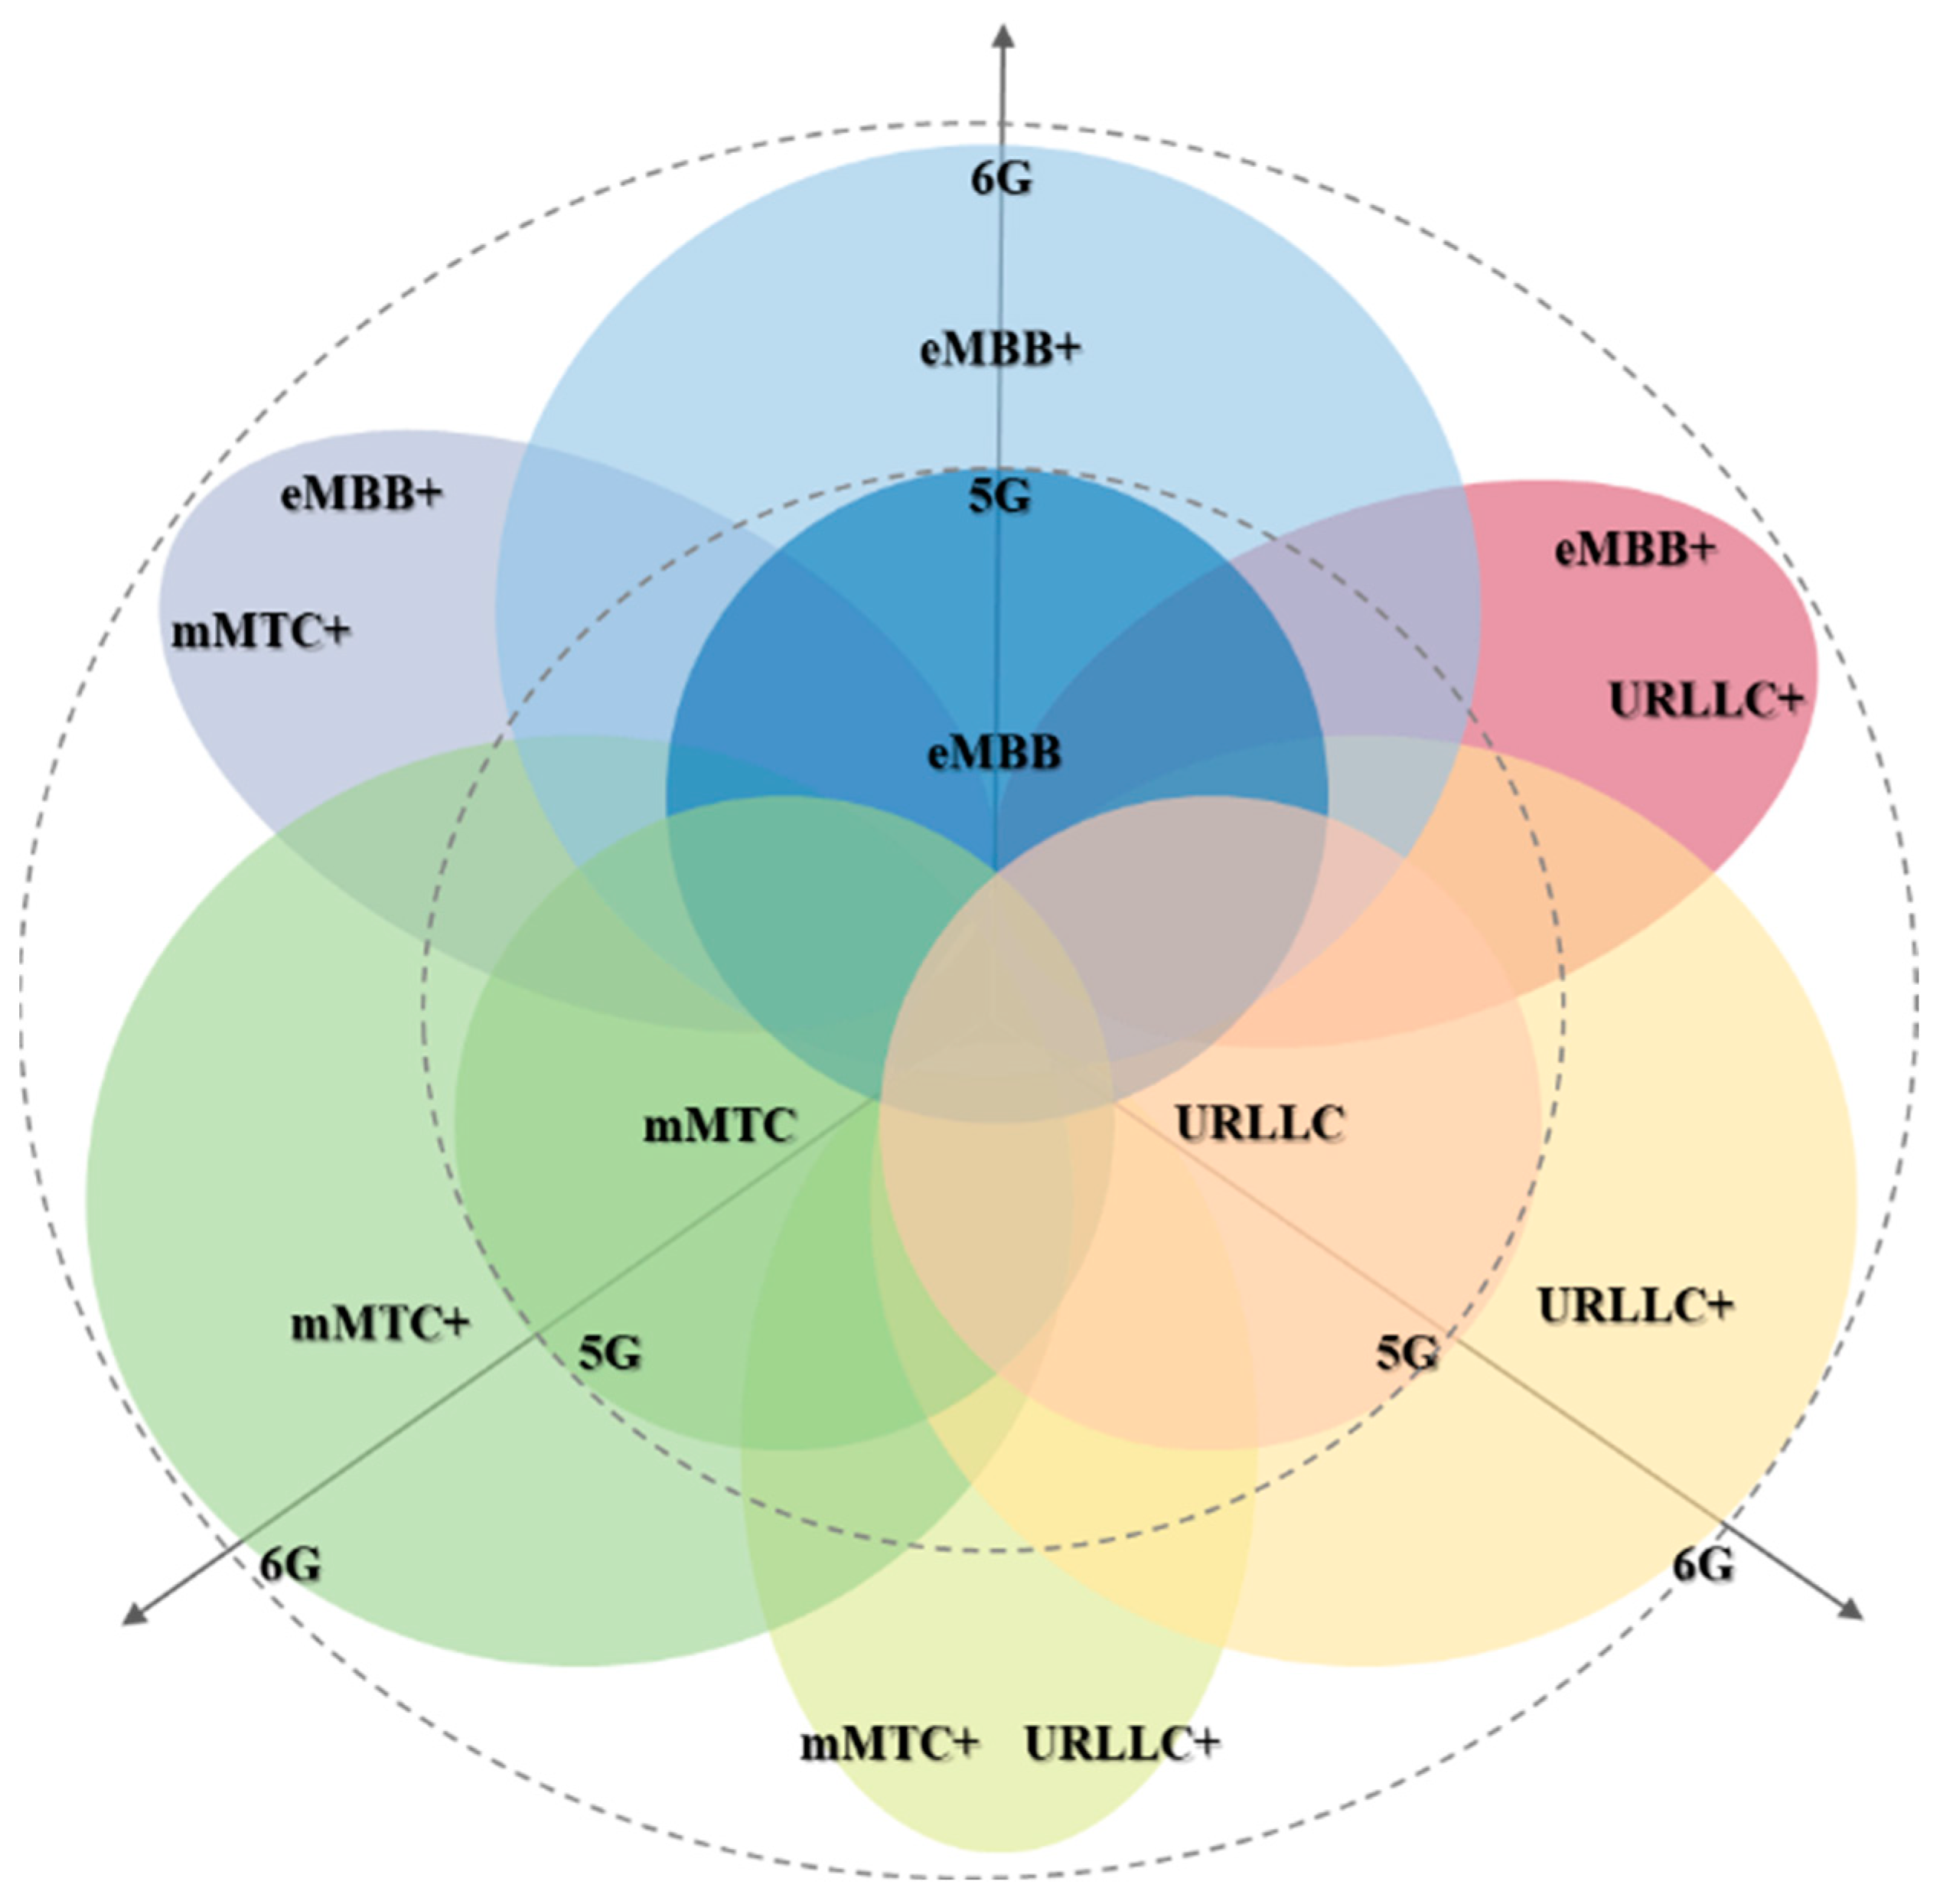
A study by Schotten documented a comprehensive list of prospective use cases following the introduction of 6G networks [19]. The study revealed multiple novel use cases, such as holographic communication, extended reality (XR), tactile internet, and haptic communication [20,21]. These use cases highlighted the extreme infrastructure requirements to deliver the products [20]. Figure 1 depicts the novel use cases for 6G shared multi-attributes. The hologram and XR use cases were effectively performed under low latency and substantial bandwidth provisions. Meanwhile, tactile internet demonstrated high reliability, security, and availability while occasionally requiring high bandwidth capacity [19]. Tactile internet also required the cross attributes of capacity, reliability, and low latency connectivity. Notably, Schotten examined and classified the 6G use cases by identifying the overlapping attributes shared by three 5G use cases [19].
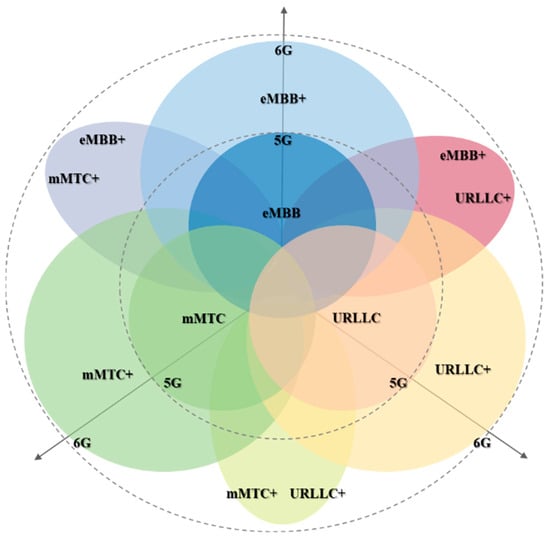
Figure 1.
The use case expansion from 5G and 6G.
Typically, the current system for splitting traffic employs various approaches, such as the round-robin scheduling method and a split ratio method that proportions traffic to available path options. A study by Lubna et al. applied a multipath scheduler to multiple transport links by classifying traffic types based on low- and high-latency traffic [14]. The study did not discover any relevant scheduling or splitting traffic mechanism research based on the attributes of specific transport network technology mentioned earlier. An alternative method proposed by Giambene et al. involved splitting the traffic into designated satellite and terrestrial paths based on both link conditions [6]. This method did not consider the assigned traffic type to the transport. Nonetheless, traffic and transport network conditions require optimal resource management in actual network conditions. Infrastructure-related resource management efficiency and network performance can be increased by directing pertinent traffic to appropriate links, specifically in highly densely populated traffic. Hence, more comprehensive splitting mechanisms are essential to comprehend and assign traffic intelligently to the transport network.
New challenges are observed because various services and use cases require the most efficient operating infrastructure. A study by Goścień demonstrated that traffic engineering leveraged the adaptiveness of a network to traffic behavior [22]. The study classified the traffic types into four categories, representing real traffic observation from real networks. In addition, the study mitigated the bandwidth-blocking probability and implemented an optimization mechanism to resolve the routing and channel resource assignment. This algorithm computed the resources of a total number of light paths in one of the connecting nodes in the network and measured the channel usage size. The algorithm also determined an optimum state that translated into a relocation scheme to address the bandwidth-blocking probability. The optimization scheme improved the overall traffic assignment or allocation and surpassed the traditional method. Nevertheless, the relocation policy enforced in the study was among the same optical transport network technology types.
A recent growth of interest in the ML application for the traffic engineering sector has been observed. A study by Fan et al. summarized the ML applicability for traffic classification with a high accuracy of classification outcomes [23]. The study concluded that a more accurate type was critical for assigning and managing traffic for pertinent network applications. Thus, this classification was vital for optimizing resource allocation instead of relying on traditional methods (payload and port-based). Considering that the 6G transport network encompasses heterogeneous technologies, numerous ML techniques have been applied to various network circumstances concerning path and node selection. This process necessitates the efficient management of heterogeneous transport networks.
Another study by Mendoza et al. created an environment containing wired ethernet and satellite links [24]. The study used this environment to experiment with the end-to-end traffic engineering application in a 5G environment. Better network visibility was presented when SDN was integrated into wired and satellite links, enabling routing computation and path restoration. The SDN in the infrastructure assisted in populating path options and determining the desired traffic path. The study also showcased the SDN in implementing traffic engineering, enabling the selection of the most efficient route for certain traffic types. Meanwhile, the performance of the user datagram protocol (UDP) traffic transport using a satellite link was optimal within the satellite link capacity. Only a minimum traffic amount with a high-bandwidth channel and higher link capacity was permitted in the forwarding transmission control protocol (TCP) traffic path using a satellite link. Consequently, the SDN features for incorporating technology into terrestrial networks were feasible in the study. On the contrary, conducting additional traffic classification research could be advantageous to comprehensively understand resource management in an infrastructure.
Recent studies in integrating satellite–terrestrial networks focused on enabling computing functions in satellite ecosystems. Ref. [25] focused on enabling double-edge computing functions to reduce processing time when using satellite transport networks. As a result, the study in [25] computes a value that determines the cache for content delivery and a deterministic value to offload tasks in both resource nodes in terrestrial and satellite. The output from [25] demonstrates the ability of the network to react based on data on the ground and in space for higher efficiency than conventional architecture. Thus, it enabled the reduction of processing time and delay, which are crucial for future 6G with terrestrial and non-terrestrial heterogeneity. Another study proved the use case of machine learning in Multi-Access Edge Computing (MEC) [26] and explored the scaling mechanism, creating a dynamic scaling capability based on demand and producing a sufficient number of virtual network function (VNF) nodes to cope and maintain the QoS.
In the traffic engineering framework, the study of [27] demonstrated the capability to locate the optimal placement of VNF to determine highly efficient service function chaining (SFC) in a network function virtualization (NFV) environment using MILP and approximation solution. The findings from [27] indicate the optimum method to address strict SFC routing policy, the efficient management of VNF usability, and the identification of an algorithm that works efficiently in specific scenarios. The study in [28] demonstrated deep reinforcement learning (DRL), a subsection in machine learning frameworks. The authors of [28] explained the on-demand routing mechanism in wide area networks (WANs) of 6G. The specific DDPG was used to determine the routing action from the study. Ref. [28] included various factors to improve the routing action by computing the state via the routing agent. The optimal routing path was computed from the reward values learned from the routing agent that collects delay, jitter, and loss ratio. Each parameter was multiplied with weightage values generated from the links’ congestion, thus significantly reducing the delay, jitter, and loss ratio.
Since traffic engineering-based studies contribute to developing a state-aware infrastructure, highlighting Intent-Based Networks (IBNs) is crucial for developing the 6G network. Several ML and SDN NFV-related studies have influenced a few aspects, such as the IBN innovation, the model developed from the learning process, and the dynamic configuration ability from the SDN capability. This outcome enables the infrastructure to possess real-time configuration, dynamic network topology adaptation, and efficient management [29]. A study by Velasco et al. assessed the ML, ML orchestrator, and pipeline to address the optical communication parameters in enabling network automation and IBN architecture [30]. Generally, IBNs are pivotal for producing a distributed architecture [16]. An ML pipeline is necessary at a network edge to make decisions, which involves evaluating the network condition and implementing SDN-based actions. Thus, Velasco et al. classified the automation of optical networks that managed and assigned light paths or channels in optical links regarding traffic behavior [30]. Notably, the study emphasized network adaptation enablement, where it monitors the network and reacts to maintain the threshold of the network’s performance set by the network operator. Conversely, the study focused on traffic capacity variations and predicted link accommodations by ML and SDN regardless of traffic classification.
Thus, this study complements the numerous methods with a novel approach to splitting traffic based on its classifications, assigning each to appropriate transport network technologies. Subsequently, the applicability of using IBN with an ML pipeline was explored. The ML pipeline produced a traffic classification output, and the MILP generated path selection decisions for the traffic in the heterogeneous transport network. A specific transport network technology type was also selected in this study, and the detailed properties of each transport network technology were applied in the learning steps. The intelligent mechanisms were aligned and feasible with the IBN architecture, and the ML enabled the orchestrator to use a suitable model. Therefore, this process computed a proper configuration for the network.
3. Problem Statement
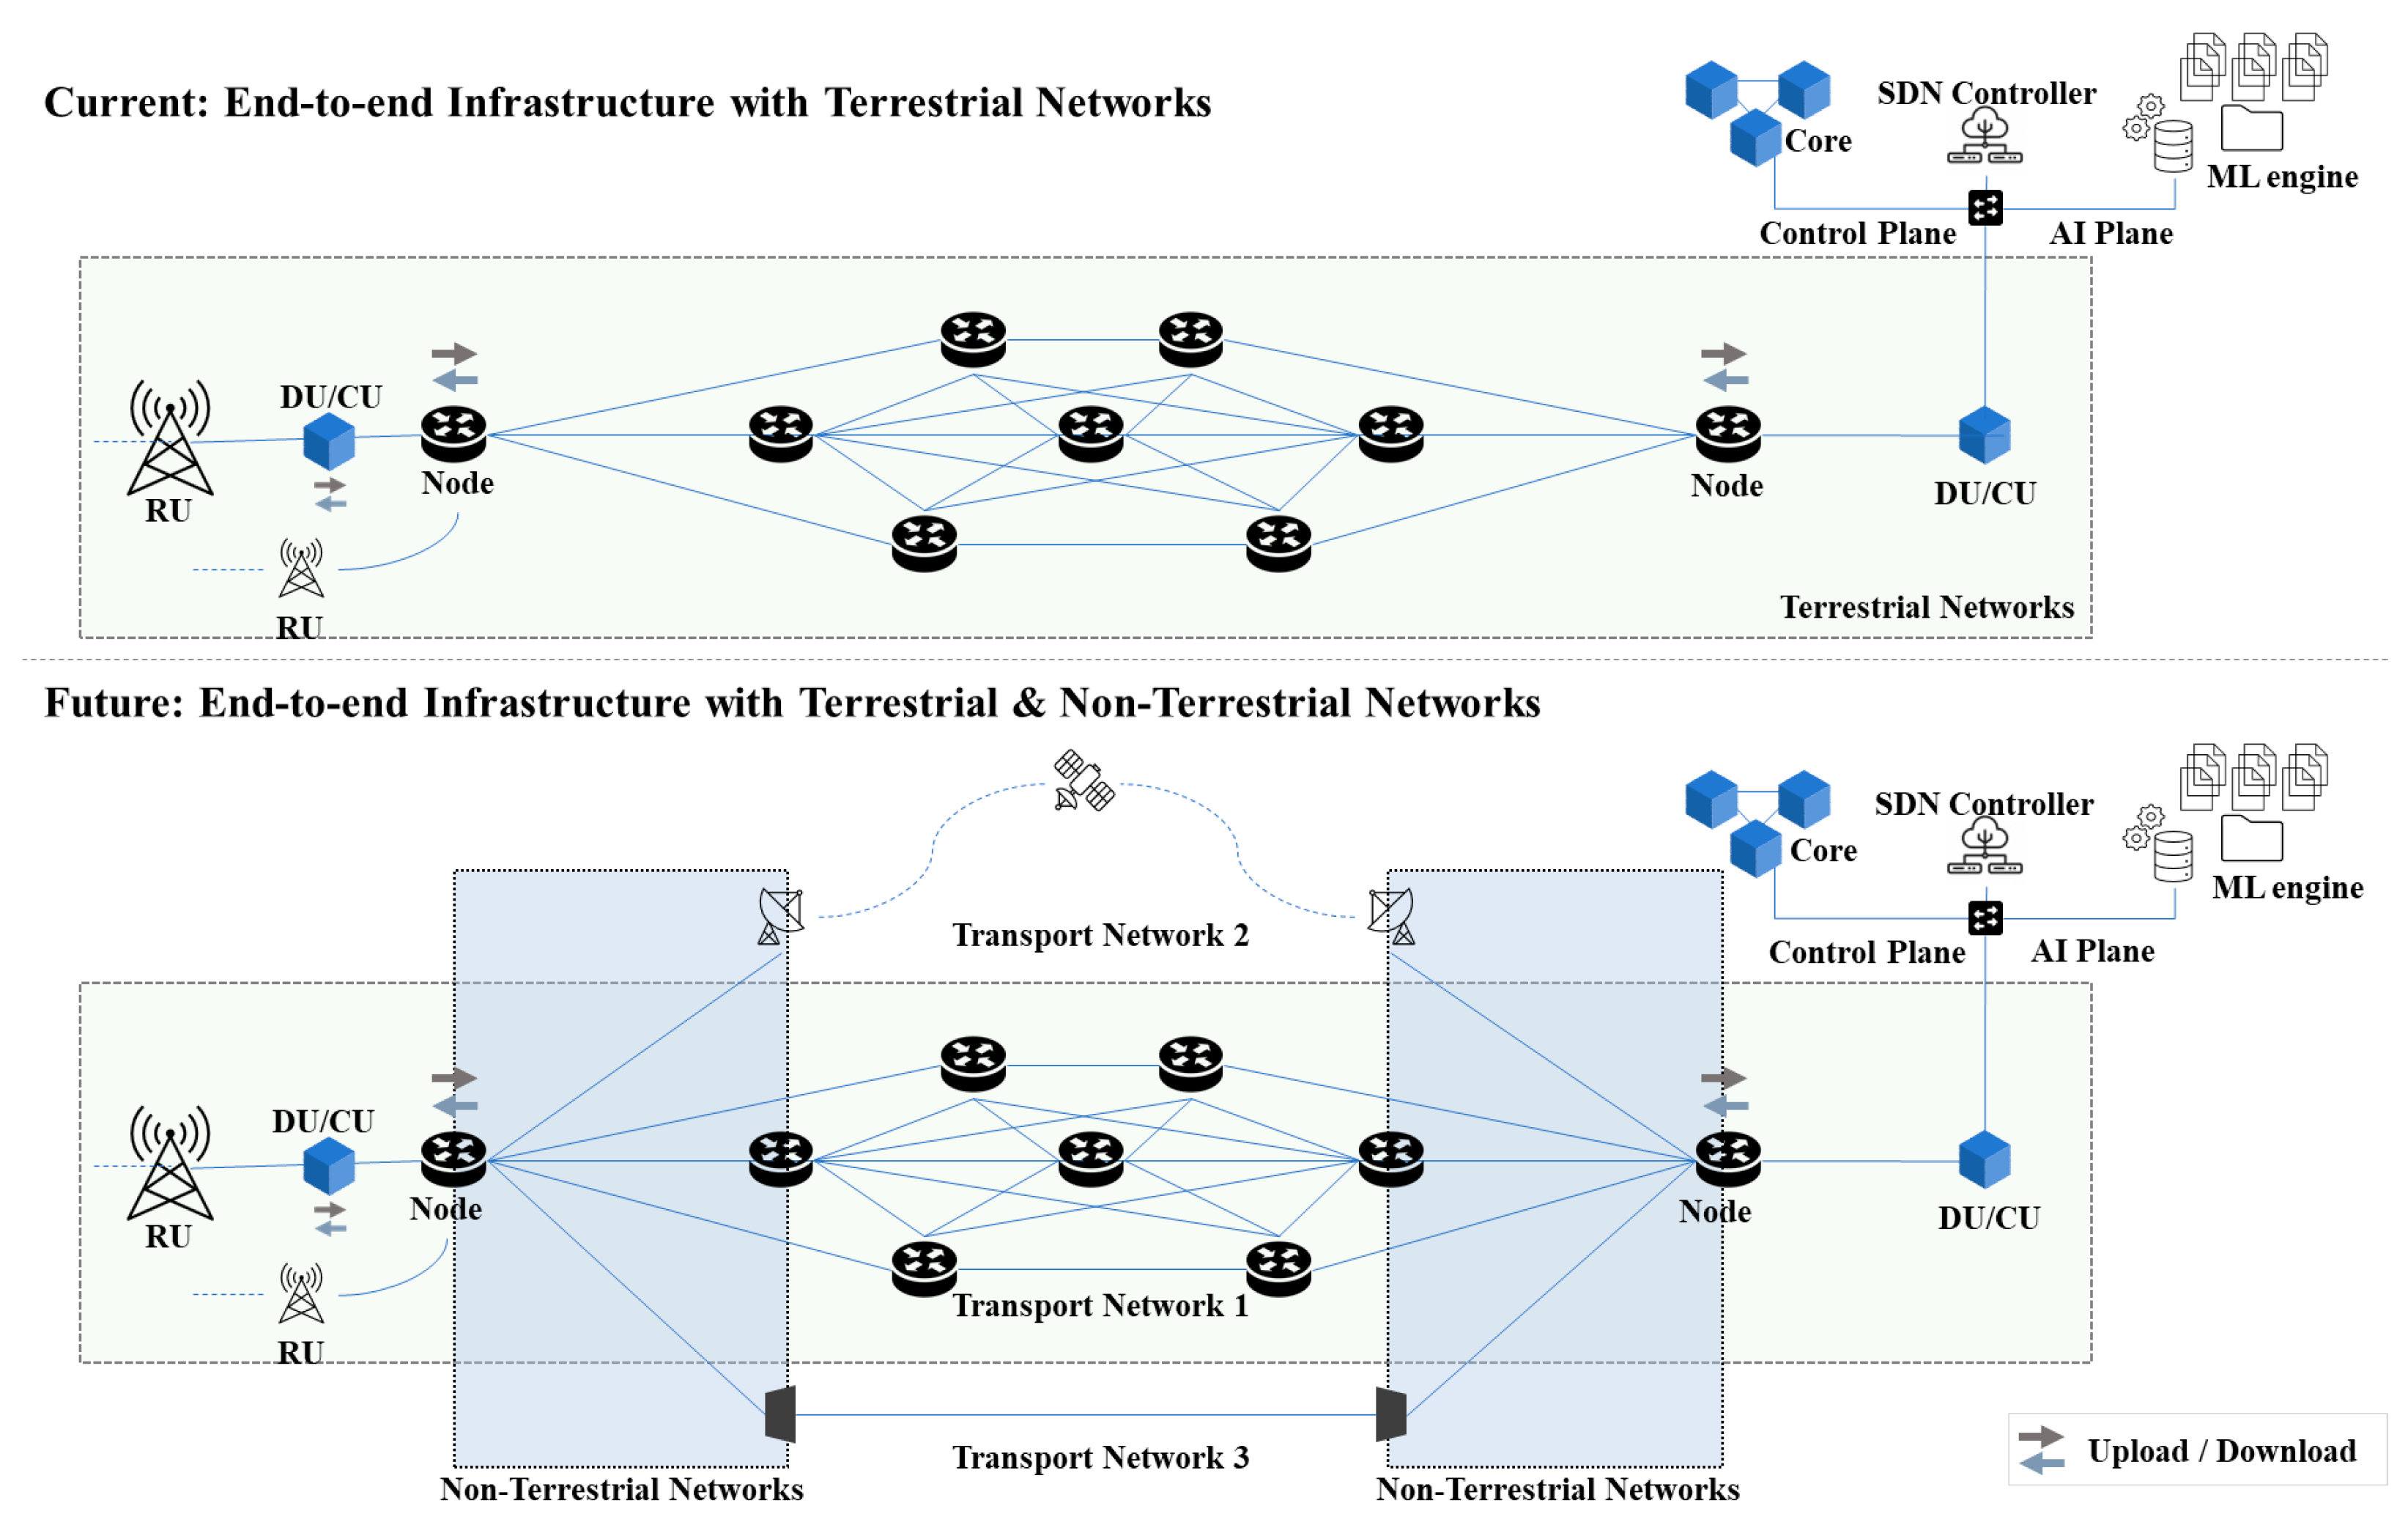
The role of the non-terrestrial transport network in 6G was anticipated to acquire a more significant function over a secondary or backup link (see Figure 2). However, there are challenges in determining the optimum uses of the respective transport networks based on various traffic classifications. A report [1] synthesized the coexistence of terrestrial networks and the upcoming network topology as a single 6G access network. However, the current approach leads to an apparent gap of inefficient resource management. The regular approach is to incorporate a novel path and route optimization using ML. This study developed a traffic steering mechanism to analyze the traffic and direct relevant traffic to the appropriate transport network types using ML and MILP methodology. This study also assessed the accuracy of decisions based on the ML clustering output and the transport network selection. Consequently, traffic was assigned optimally to designated transport networks in an ideal environment.
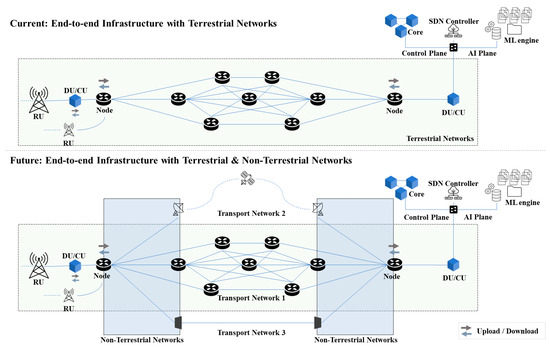
Figure 2.
The non-terrestrial transport networks for the 6G infrastructure.
4. Proposed ML Techniques, MILP Framework, and Methodology
4.1. Network Model
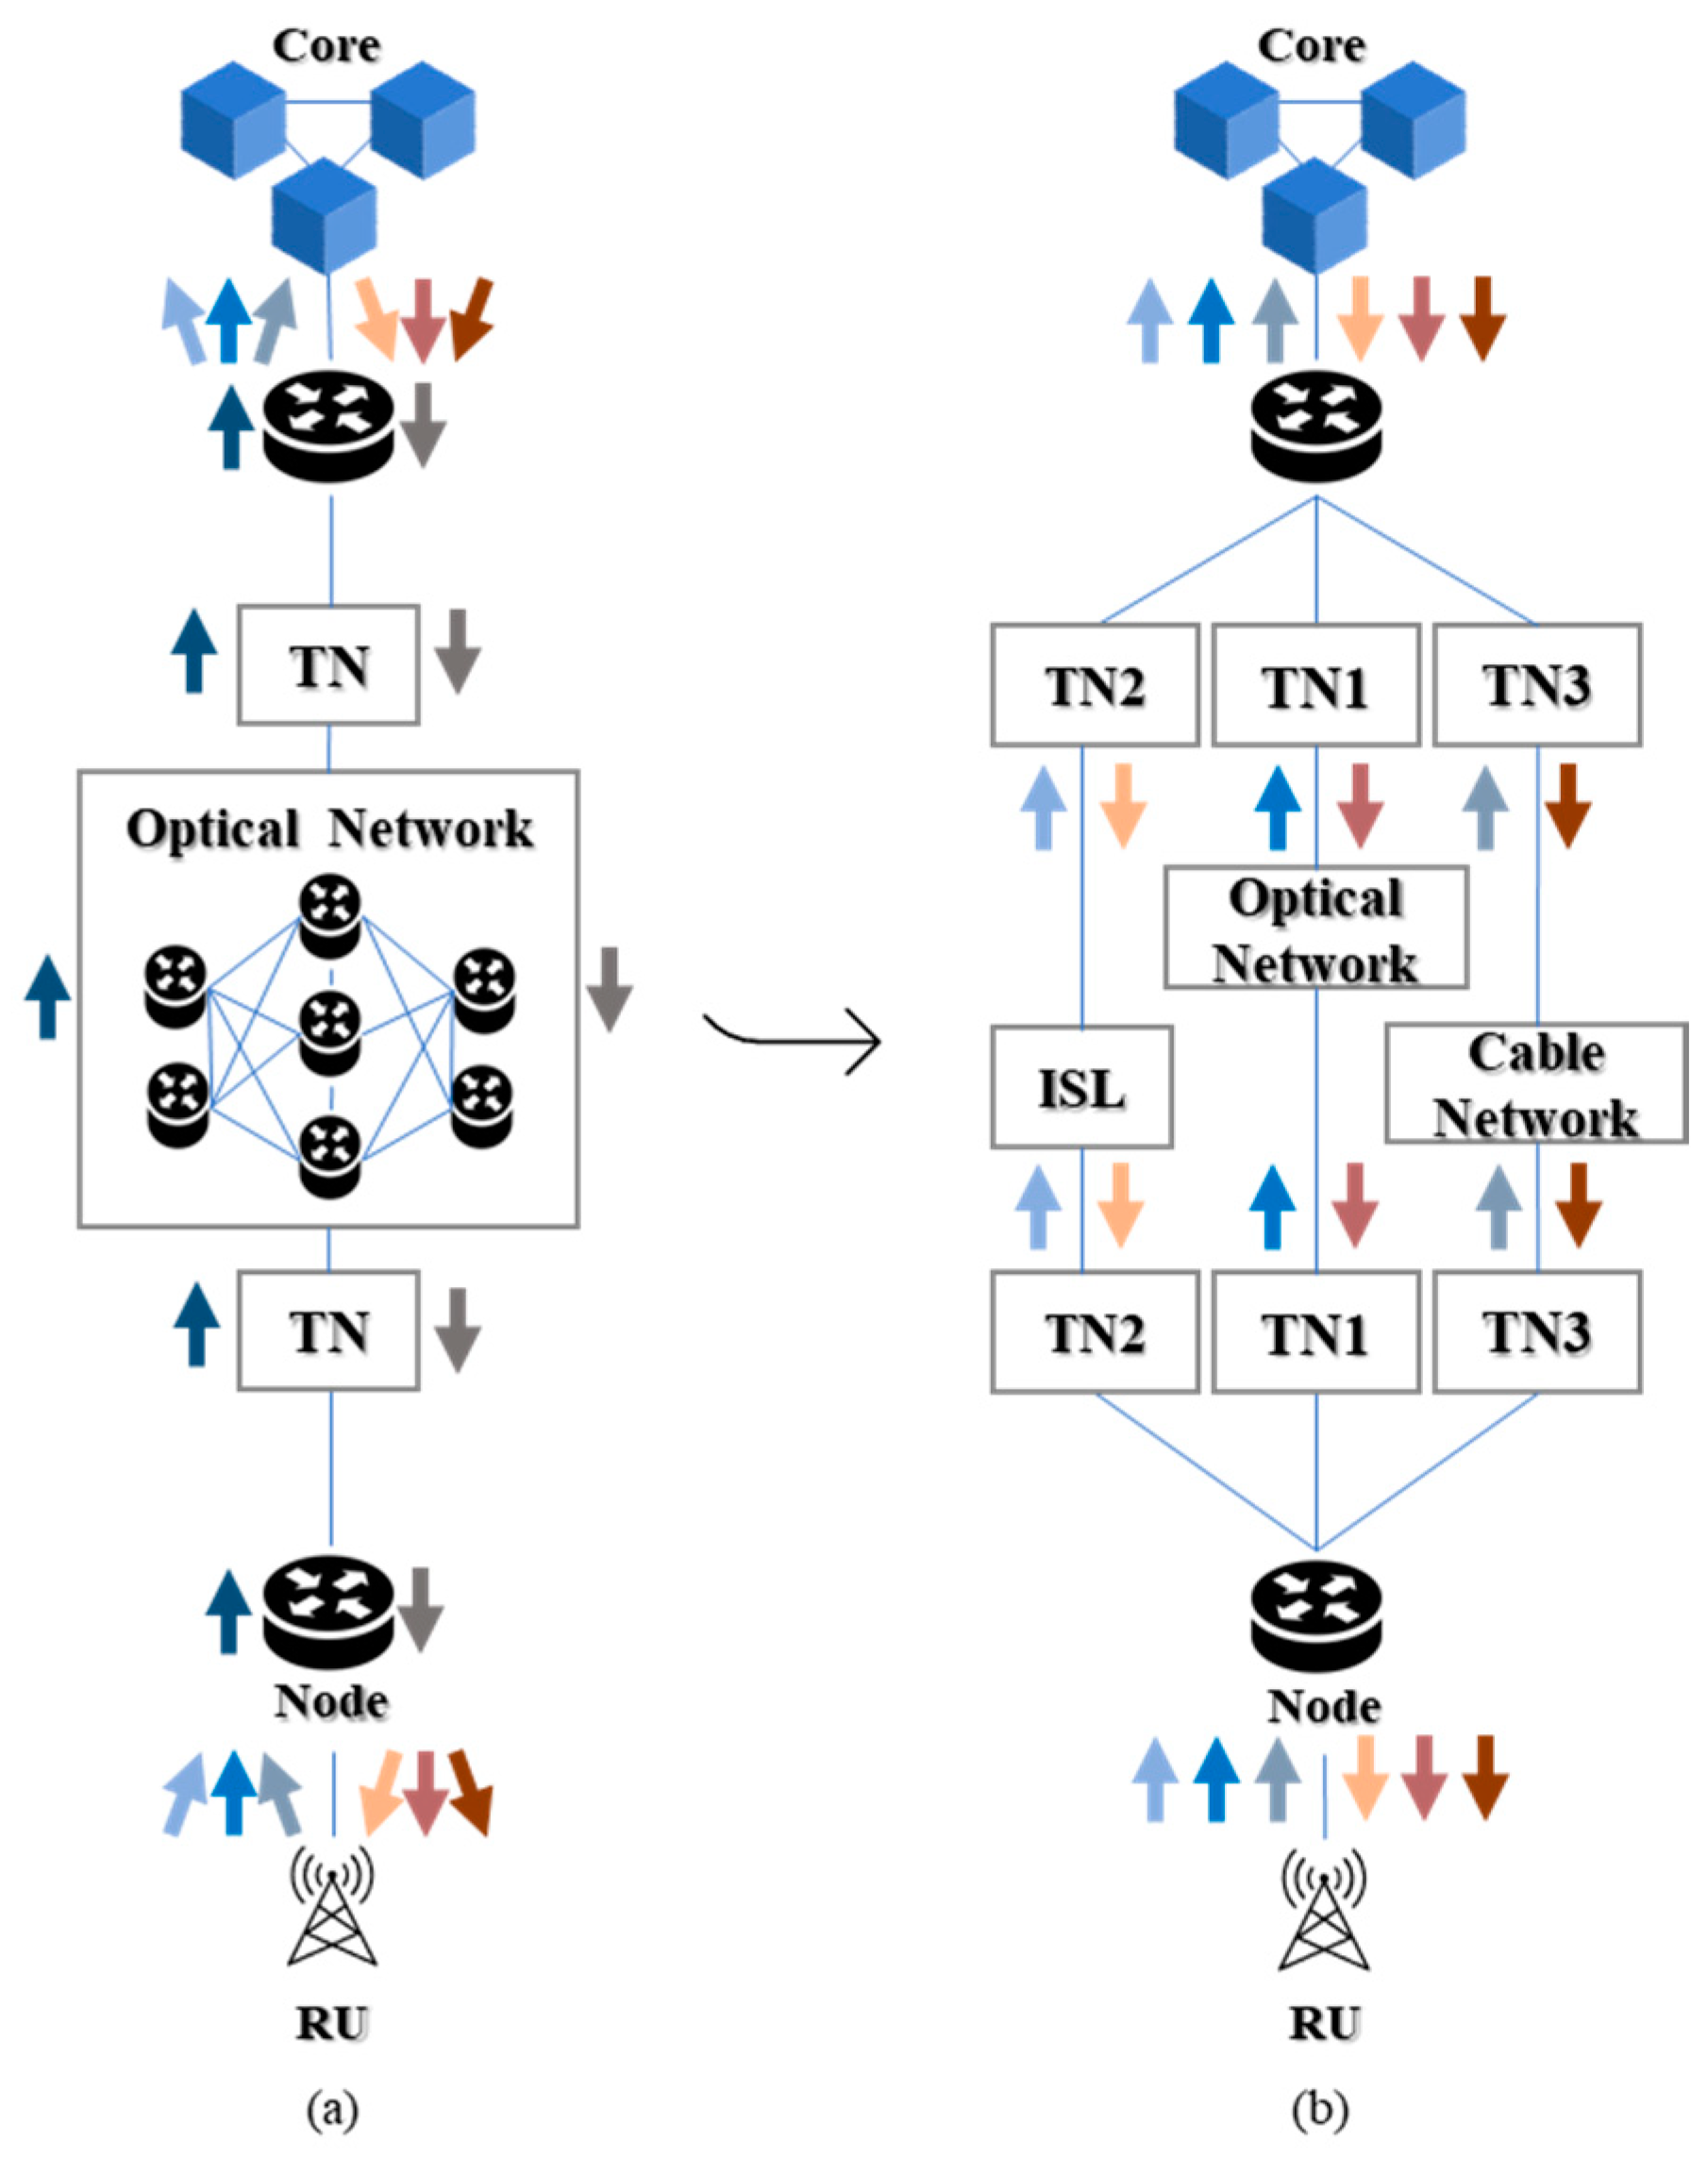
Figure 3 highlights that this study operates within the defined network model, with K numbers of transport network technology (connectivity alternatives between the access layer node and the core node). Even though each transport technology possessed various links to form mesh connectivity in optical and DOCSIS cables, the technology was treated as a single connectivity line. This observation was similar to the inter-satellite links from satellite technology. The transport network to the provided list mentioned in the previous section was scoped using a K value of 3. Meanwhile, the different annotations of arrow colors and directions indicating the downlink (DL) and uplink (UL) traffic represented the traffic classifications. Specifically, the code color represented the traffic types exchanged inside the infrastructure. Figure 3a,b illustrate the difference in traffic classification treatment between the conventional and the proposed intelligent traffic engineering for 6G architectures.

Figure 3.
The coexistence of heterogeneous transport networks for the 6G infrastructure using (a) conventional and (b) the proposed architectures.
The traffic classification in the conventional architecture was treated with different priorities and scheduling. Nonetheless, the proposed architecture in this study complemented the approach by adding preliminary traffic segregation works before accessing the transport networks. The post-clustering and assignment process indicates that a group of packets that shares the same attributes is steered to optimal-matched transport network attributes and subsequently undergoes a conventional traffic prioritization process. This proposed architecture mission aimed to maximize end-to-end efficiency by enabling relevant packets to be steered into optimal paths following their respective transport network technologies. Equation (1) describes the calculation of the total volume of packets, , from the i-th index of packets that sums up the total traffic volume in an instance, .
where Ui(t) is the packet in the instance, and umn(t) represents a packet based on their traffic classification types denoted by m, representing traffic classification types ranging from 1 to 5 and the n-th index of packets. T(t) equals the total number of packets in an instance in the respective m category, where n ranges from 1 to N. T(t) underwent unsupervised learning, a clustering technique to group the total UE and traffic per instance.
4.2. Clustering Model
The clustering process transformed the packets from T(t) into the aggregated volume of packets within clusters, denoted as Dj(t), where j is the cluster label set to equal the number of transport network technologies equal to three, represented as j ϵ {C#1, C#2, C#3}. Thus, Tj(t) = DC#1(t) + DC#2(t) + DC#3(t). Meanwhile, the series of instances, t, exhibited different Dj(t) values over time based on the dataset and clustering output. Subsequently, a variation of traffic types in a cluster, umn(t,j), determines the value Dj(t). Each Dj(t) was analyzed to produce the total downlink (DL) or uplink (UL) denoted by Vdl/ul, minimum error rate, εmin, and packet delay budget, βmax, values in forming Dj(t):(Vdl/ul, εmin, βmax). Each instance in the format in the clusters, Dj(t), incorporated the total sums of packets handled by the transport network. Given that the number of transport network technologies is K, λk is the respective denotation of K transport network technology. Moreover, a similar format, λk:(VT-dl/ul, εT-min, βT-max), represents the transport network technology, where VT-dl/ul is the capacity of the transport network, εT-min is the error rate, and βT-max is the packet trip time.
4.3. Clustering Process
This study examined the functionality of unsupervised ML under clustering algorithms. The clustering algorithms were conducted with unlabeled data, in which the attributes of each data point were analyzed, and the similarity in a cluster was exhibited. An emulator that emulated the generated inbound and outbound data transacting from UE to gNB and the core (including vice versa) was used to derive the data for this study. These data included the Reference Signal Received Power (RSRP), DL, UL, and QFI values. A clustering algorithm was employed to learn from each data point and generate a vector value, Dj(t), representing a point’s attributes or properties. Subsequently, the process combined all points with similar attributes into clusters.
A different perspective on the resource assignment was also obtained based on different input types, and this study performed traffic clustering based on the use cases of the traffic. Three use cases were considered in this study: eMBB, URLLC, and mMTC. These use cases were represented with Fi(t), where i = [eMBB, URLLC, mMTC]. The datasets were classified into three categories, resulting in a format that resembled the previous cluster format, Fi(t):(Vdl/ul, εmin, βmax). This process asserted uniform traffic types within the group, contradicting the clustering process performed using the ML clustering technique. The clustering process then had to undergo another unsupervised learning technique for detailed execution.
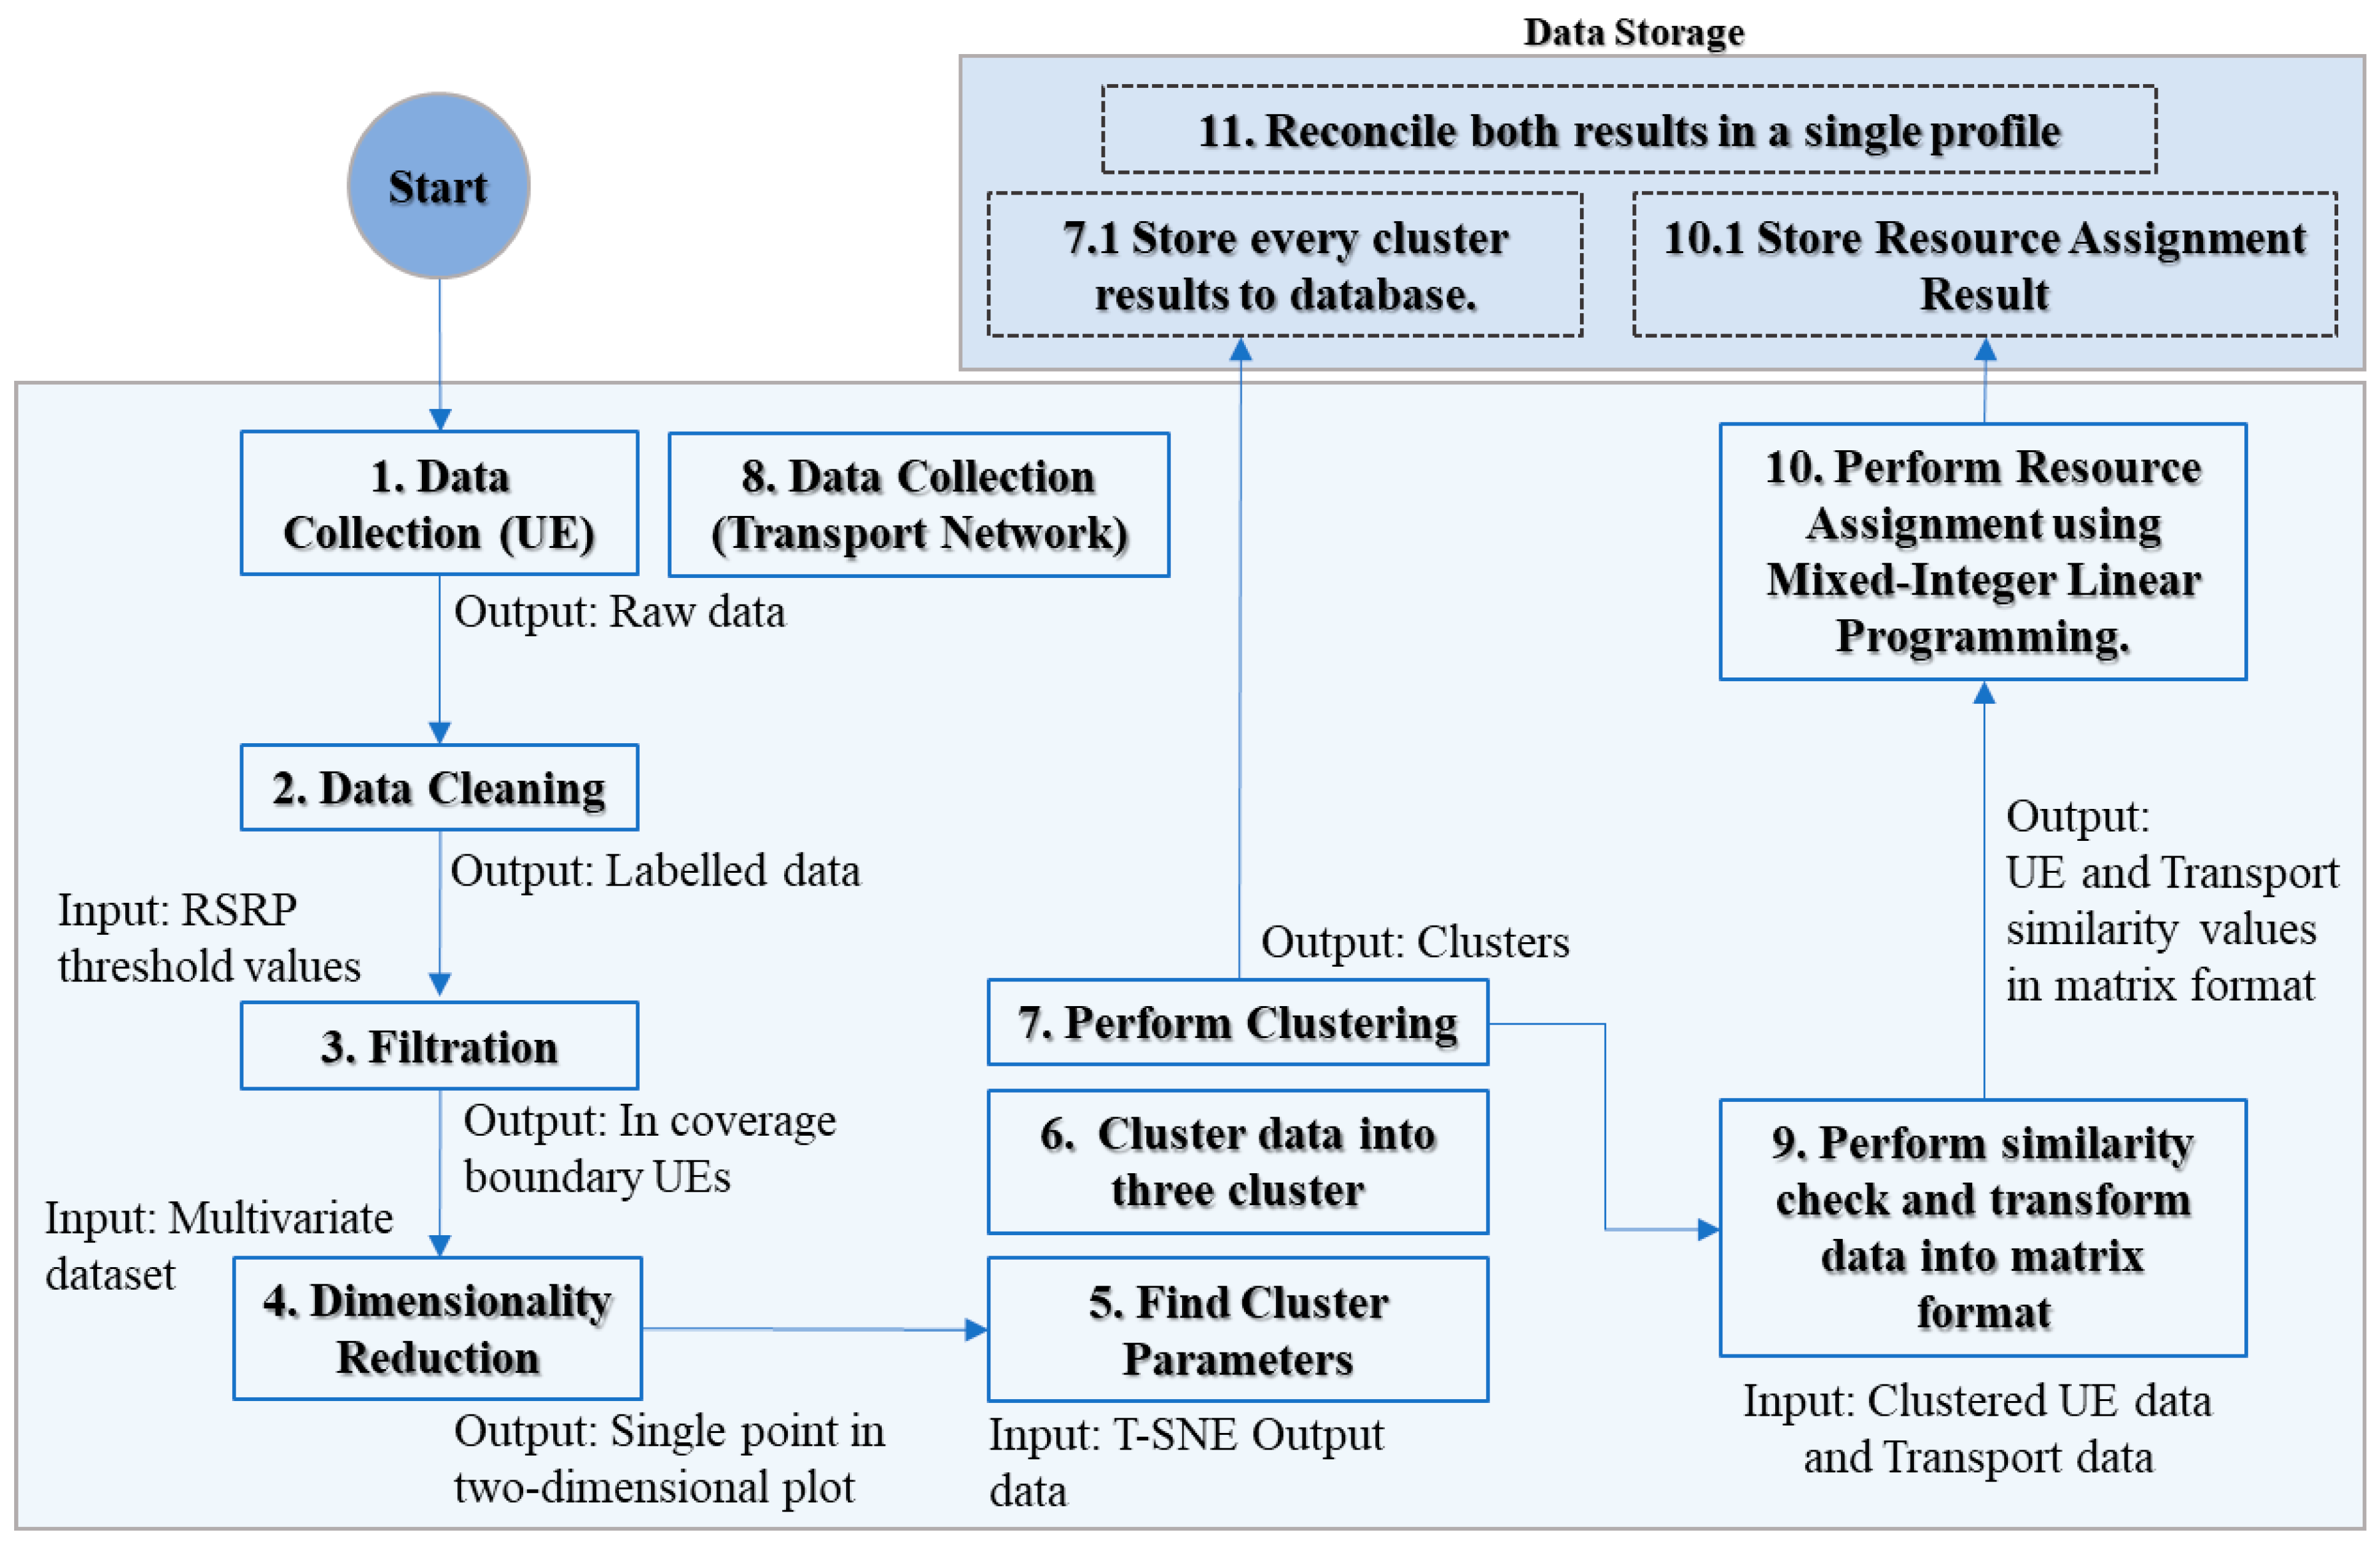
The dimensionality reduction algorithm produced two-dimensional data from the multivariate data. Before clustering, this process reshaped the data into a vector value using the t-distributed stochastic neighboring embedding (T-SNE) method. The data were filtered based on the referenced signal receive power (RSRP) values to exclude the farthest UE from the serving radio unit (RU). Only the UE inside the serving area was considered in the subsequent stages (step 3 in Figure 4). Finally, the filtered list of downlink and uplink values with QoS Flow ID (QFI) underwent the T-SNE transformation process to create an unlabeled dataset before the data execution for the clustering process (step 4 in Figure 4). The multivariate data from the prior processes underwent initial steps of scaling and transformation to produce a standardized scale to enable the balance dominance of every dataset field before applying T-SNE to reduce the multivariate dataset into a single unlabeled value.
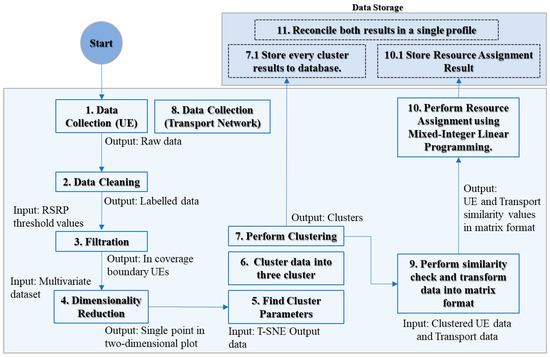
Figure 4.
The end-to-end flow of the clustering and resource assignment.
A clustering process was performed using Hierarchical Density-Based Spatial Clustering of Applications with Noise (HDBSCAN) to identify patterns from the T-SNE transformation output. The clustering process identified the attributes of each point and grouped them into three clusters: Tj(t) = DC#1(t) + D C#2(t) + DC#3(t). Each point (represented as UE) was assigned a cluster label (C#1, C#2, and C#3) after the clustering procedure was completed, indicating the group of each point (UE) (steps 5, 6, and 7 in Figure 4).
Subsequently, each label on a UE was stored and recorded for future data training and learning processes. The post-clustering process then shifted to the resource assignment stages. Steps 8 and 9 were the preprocessing stages before the resource assignment step. During this stage, the data were collected and converted into a matrix format. The transport network data comprised capacity information, round trip time, and packet loss rate, representing a transport network attribute value in a particular instance, λk:(Vdl/ul, εmin, βmax).
4.4. Matching Process
The MILP was employed to determine the optimal resource assignment based on the cluster transport network assignment. Each value from the UE cluster and the transport network was checked similarly during the resource assignment process. Step 9 in Figure 4 implies the iteration process of the similarity check between each cluster and the transport network properties or attributes. xij is the decision variable where the value of ‘i’ represents the clusters assigned to the available ‘j’ transport network as resources. Hence, xij 1 to determine the output of the cluster transport assignment. xij ∈ {0,1}, i = the transport networks, j = the clusters
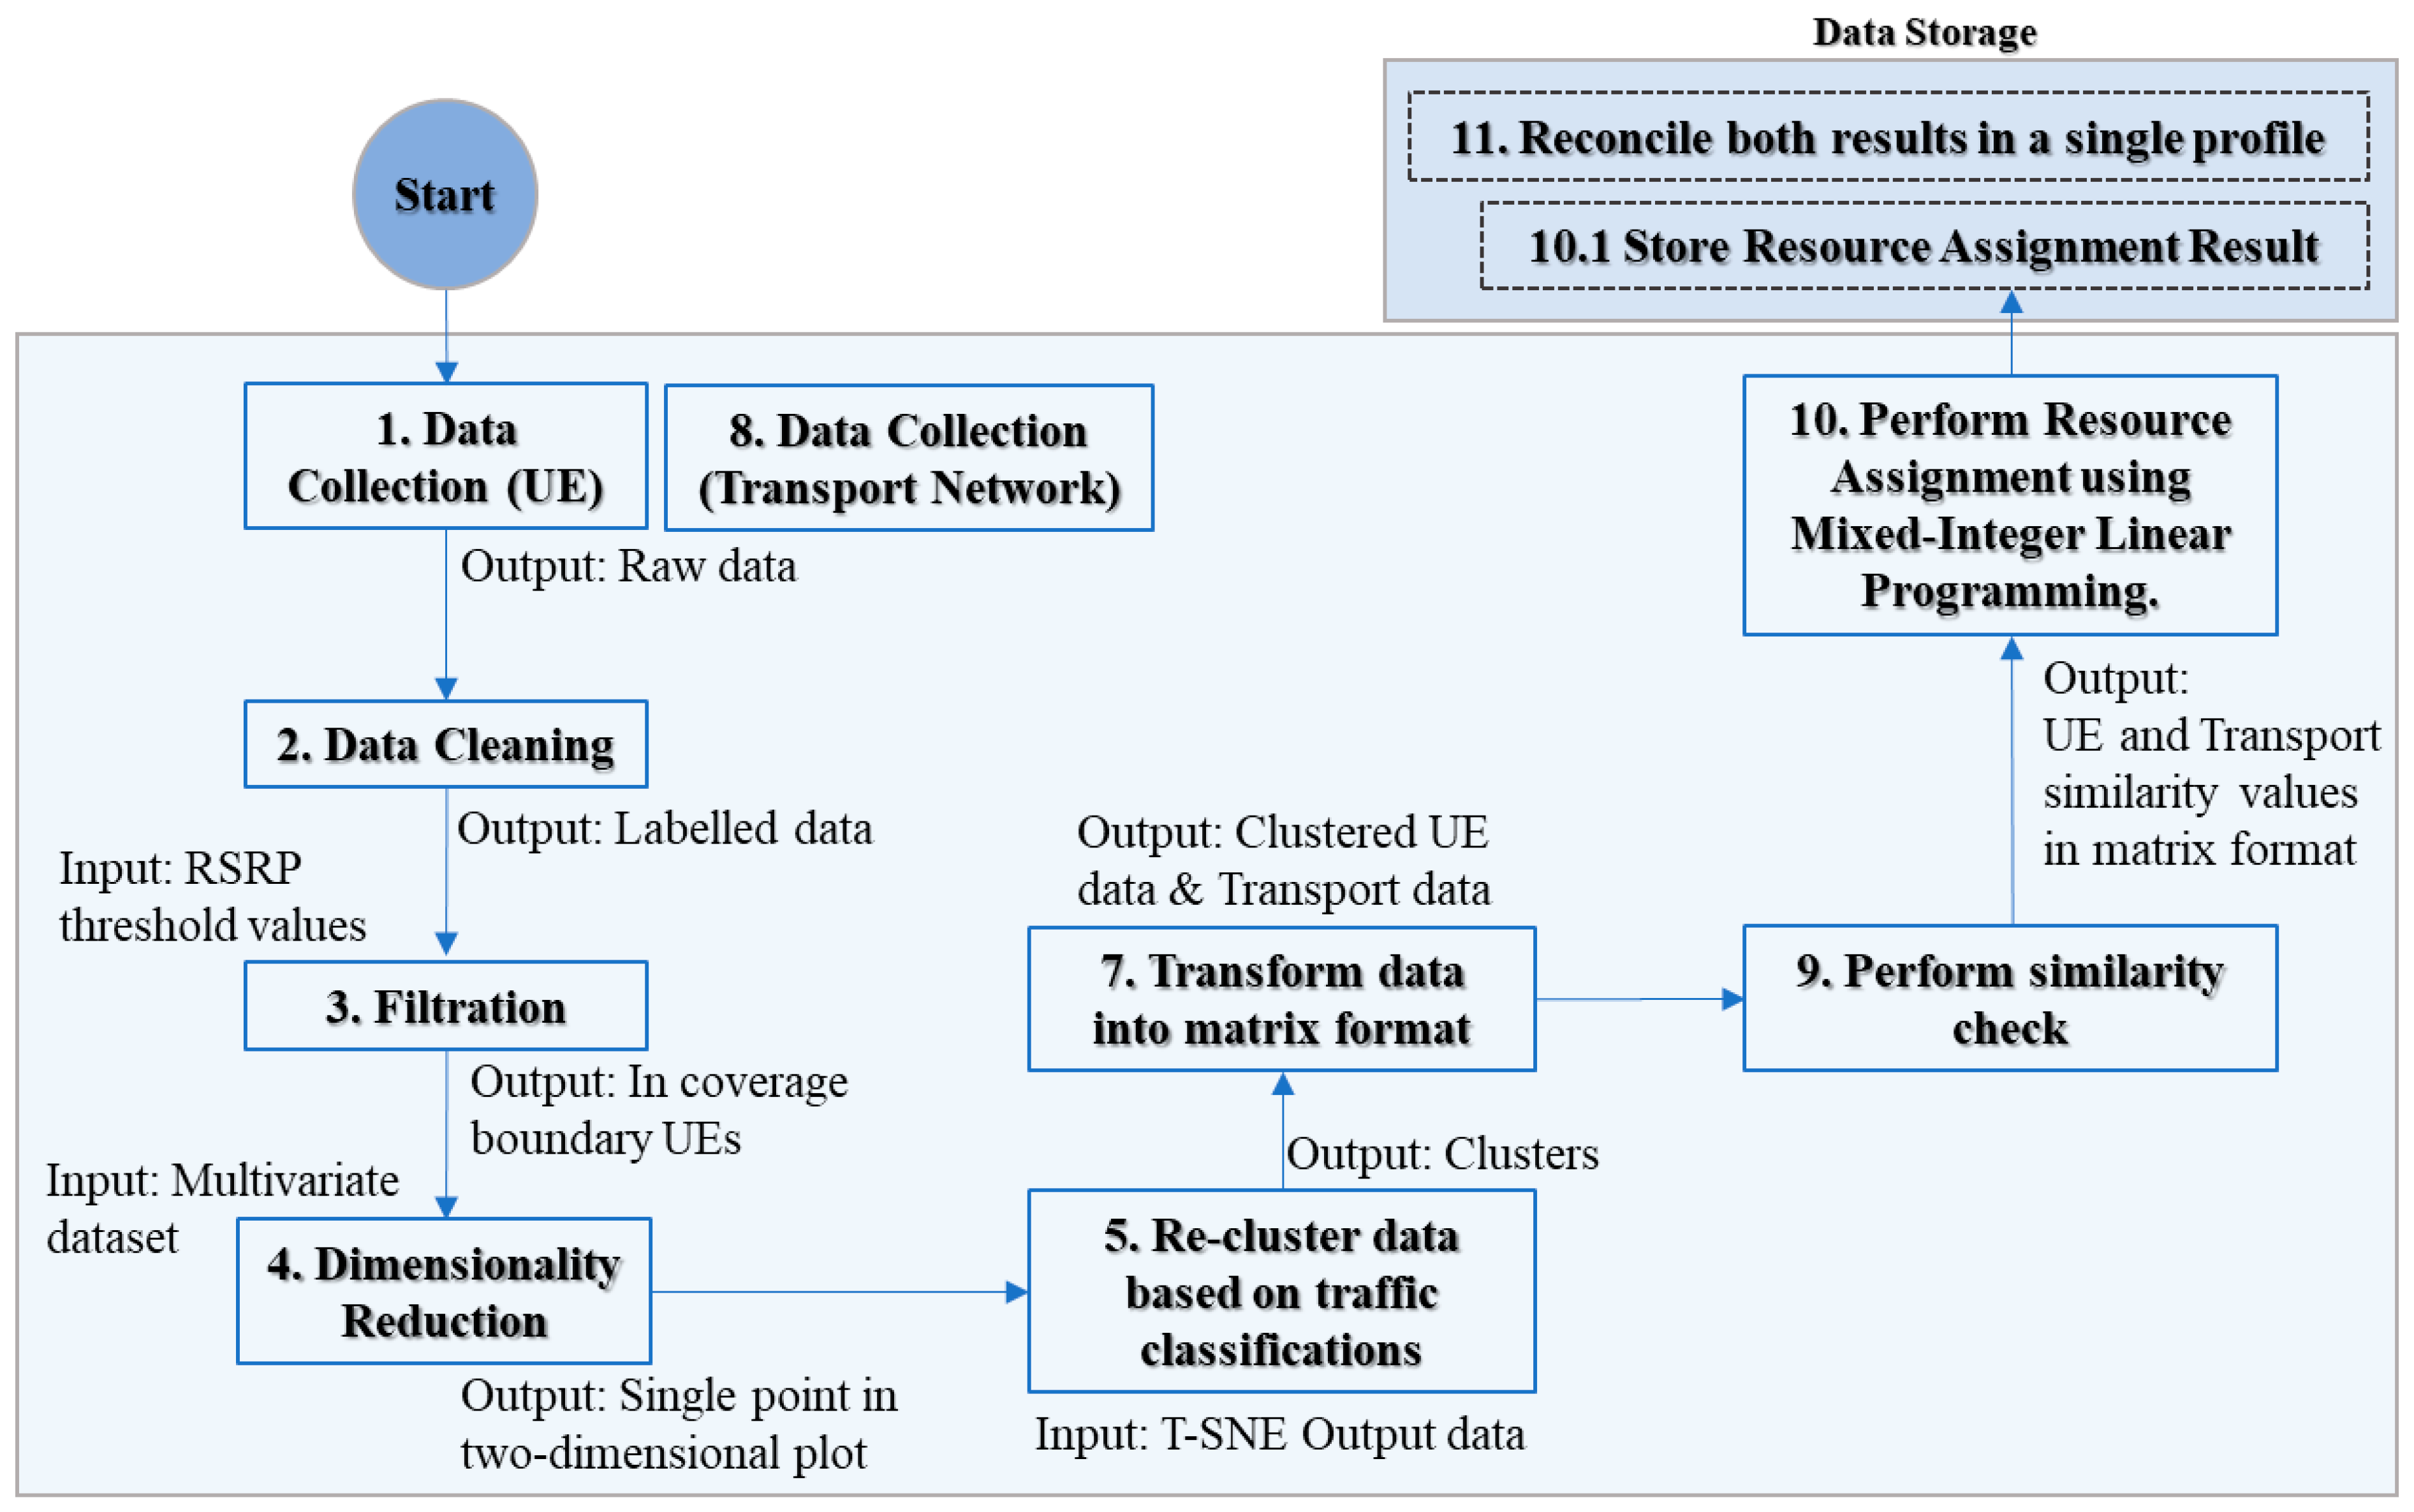
This study evaluated the assignment output by matching clusters with transport networks with qualities compatible with the cluster. Similarly, the same processes were applied to examine the corresponding matching assignment on the clusters formed by various UE types (see Figure 5). Consequently, three significant clusters were created from the eMBB, URLLC, and mMTC UE types, and the same matching assignment output using MILP was evaluated. The process also considered clustering each UE type in an instance. Furthermore, the total DL or UL size, maximum packet delay budget values, and minimum packet loss rate of the cluster were recorded and represented as cluster attributes. Lastly, similarity checks were performed between the attributes, clusters, and transport networks.
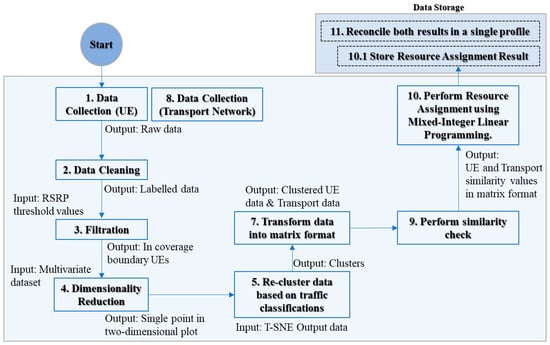
Figure 5.
The end-to-end flow of the resource assignment process based on various UE types.
5. Discussion and Findings
The parameters in table below defines the simulation to generate the UE dataset (see Table 1). Table 2 shows the compositions of clustering output for the first instance. The percentage in each cluster indicates the types of UE traffic classification in the clusters.

Table 1.
The list of parameters for UE and transport network simulations.
Table 2.
The outcome of the clustering process.
5.1. Proportion Results of the UEs in the Cluster
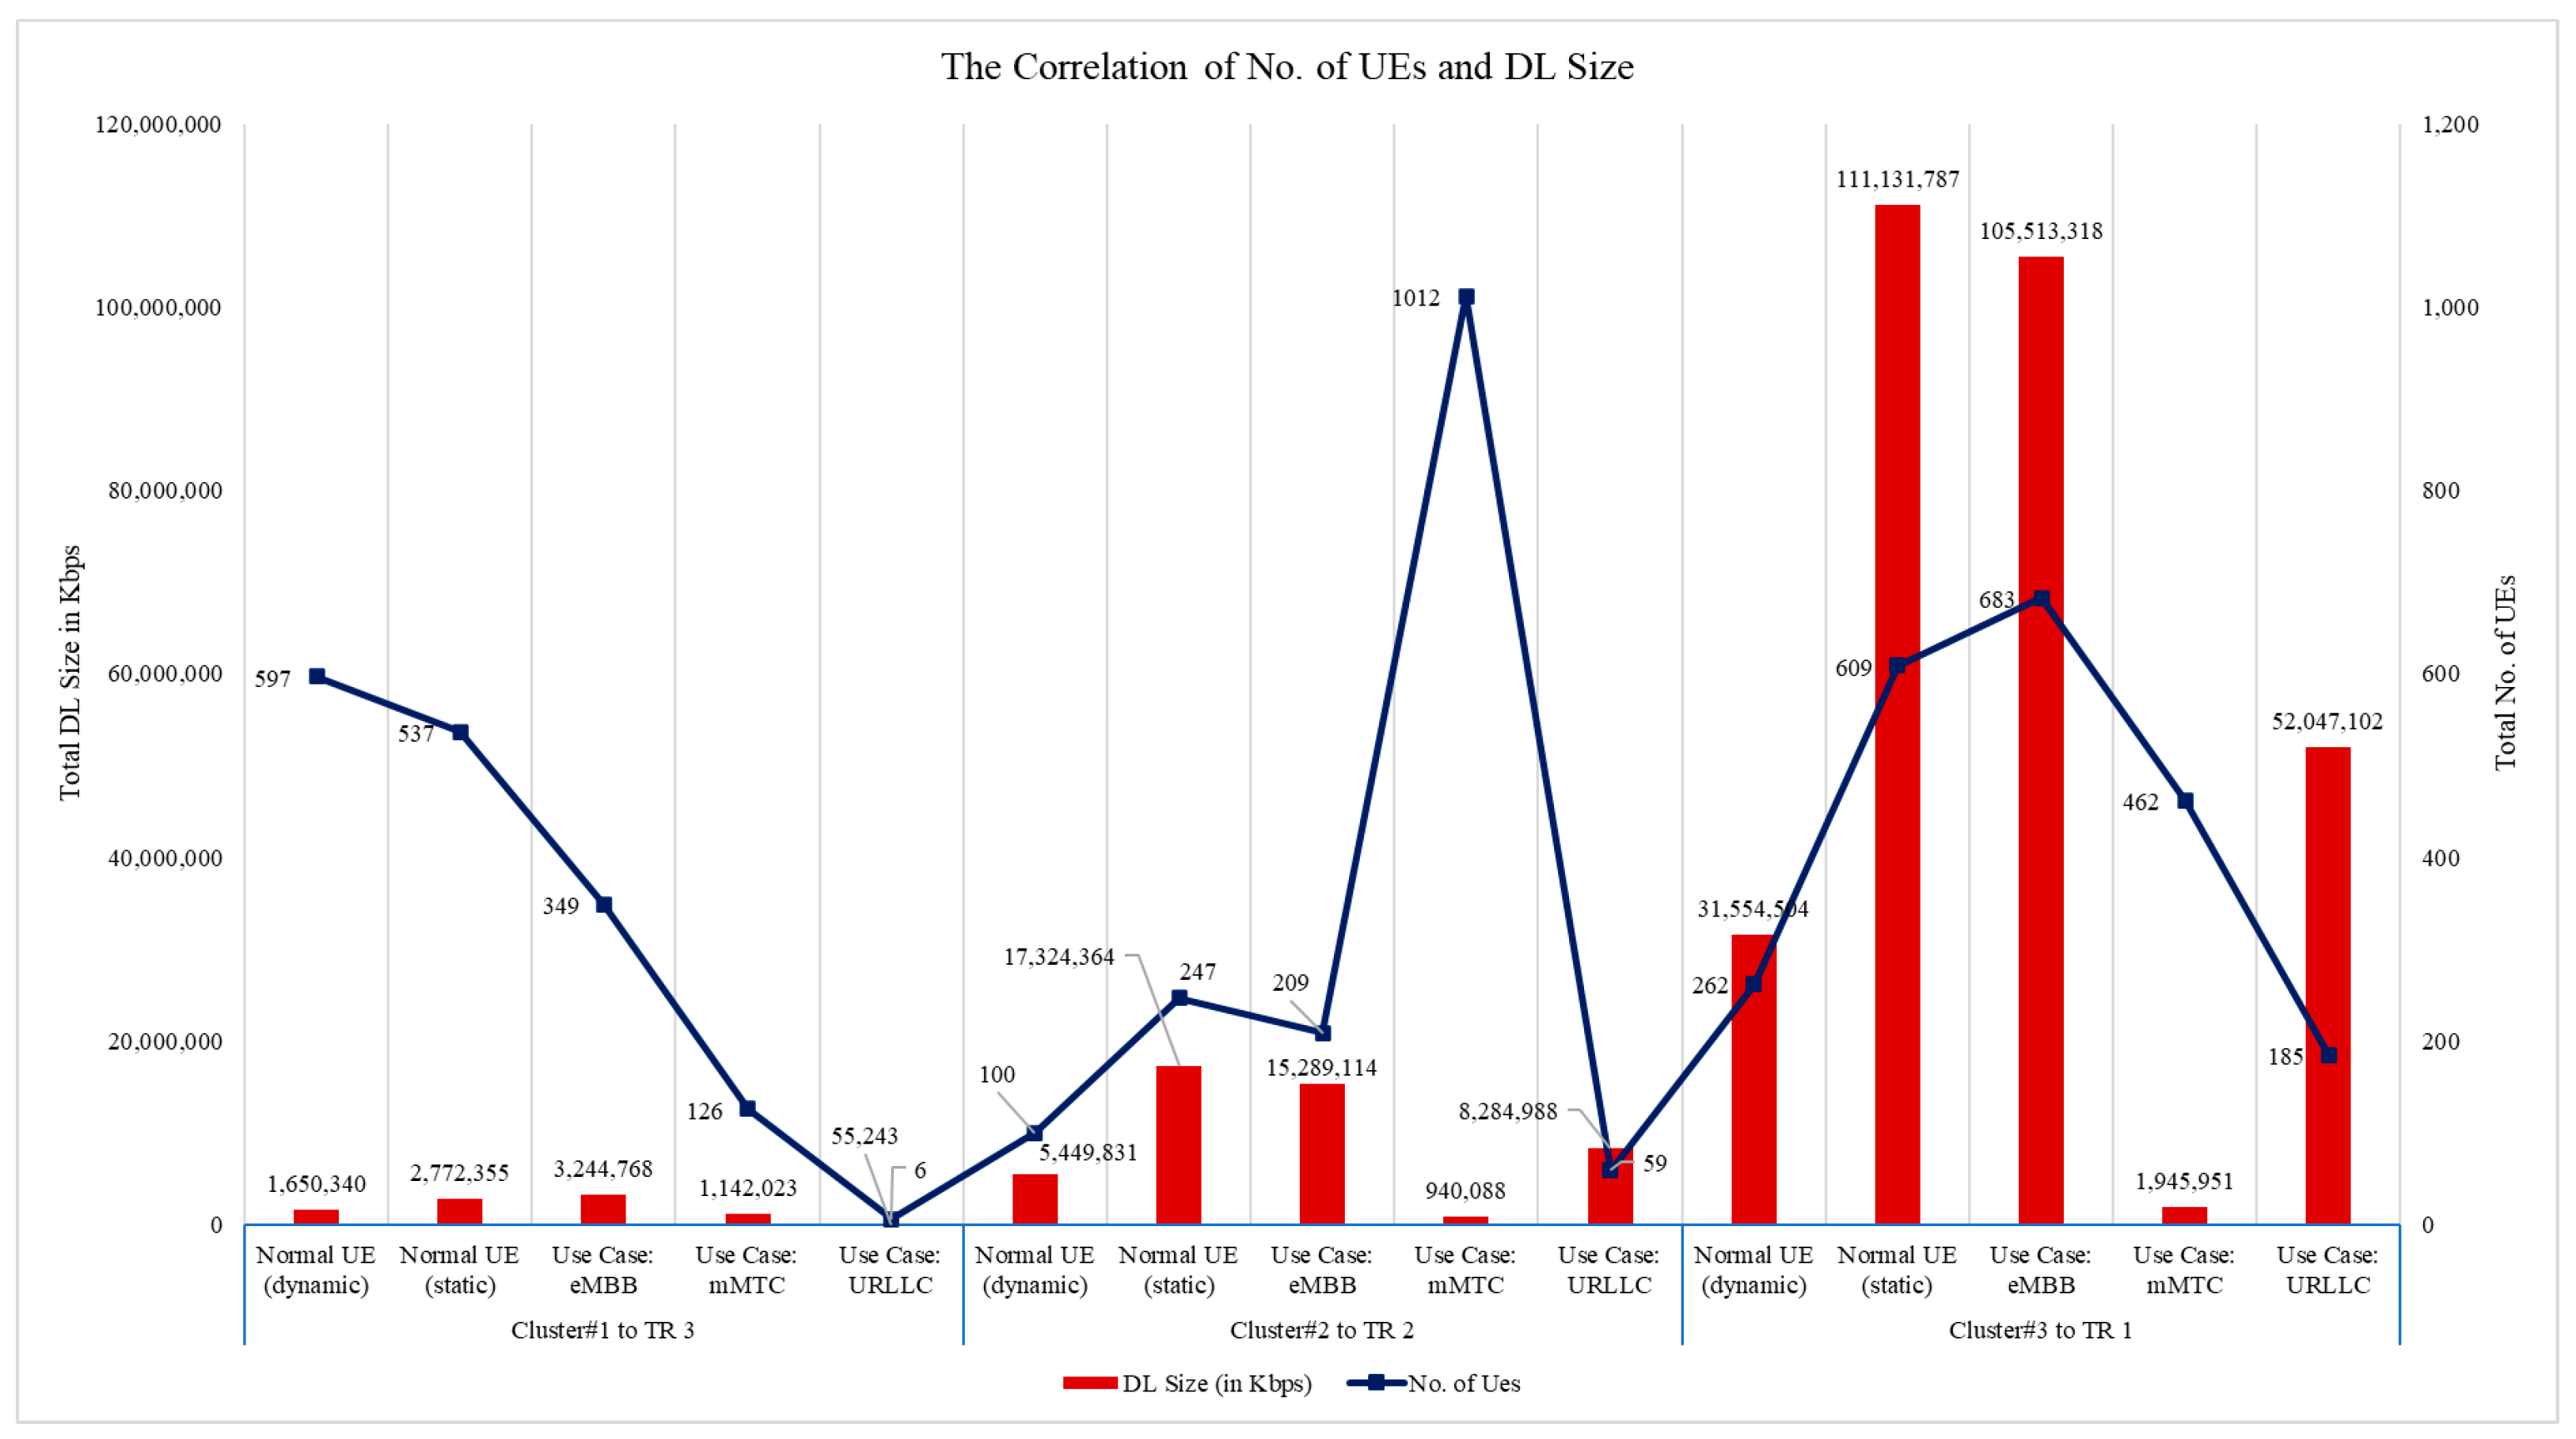
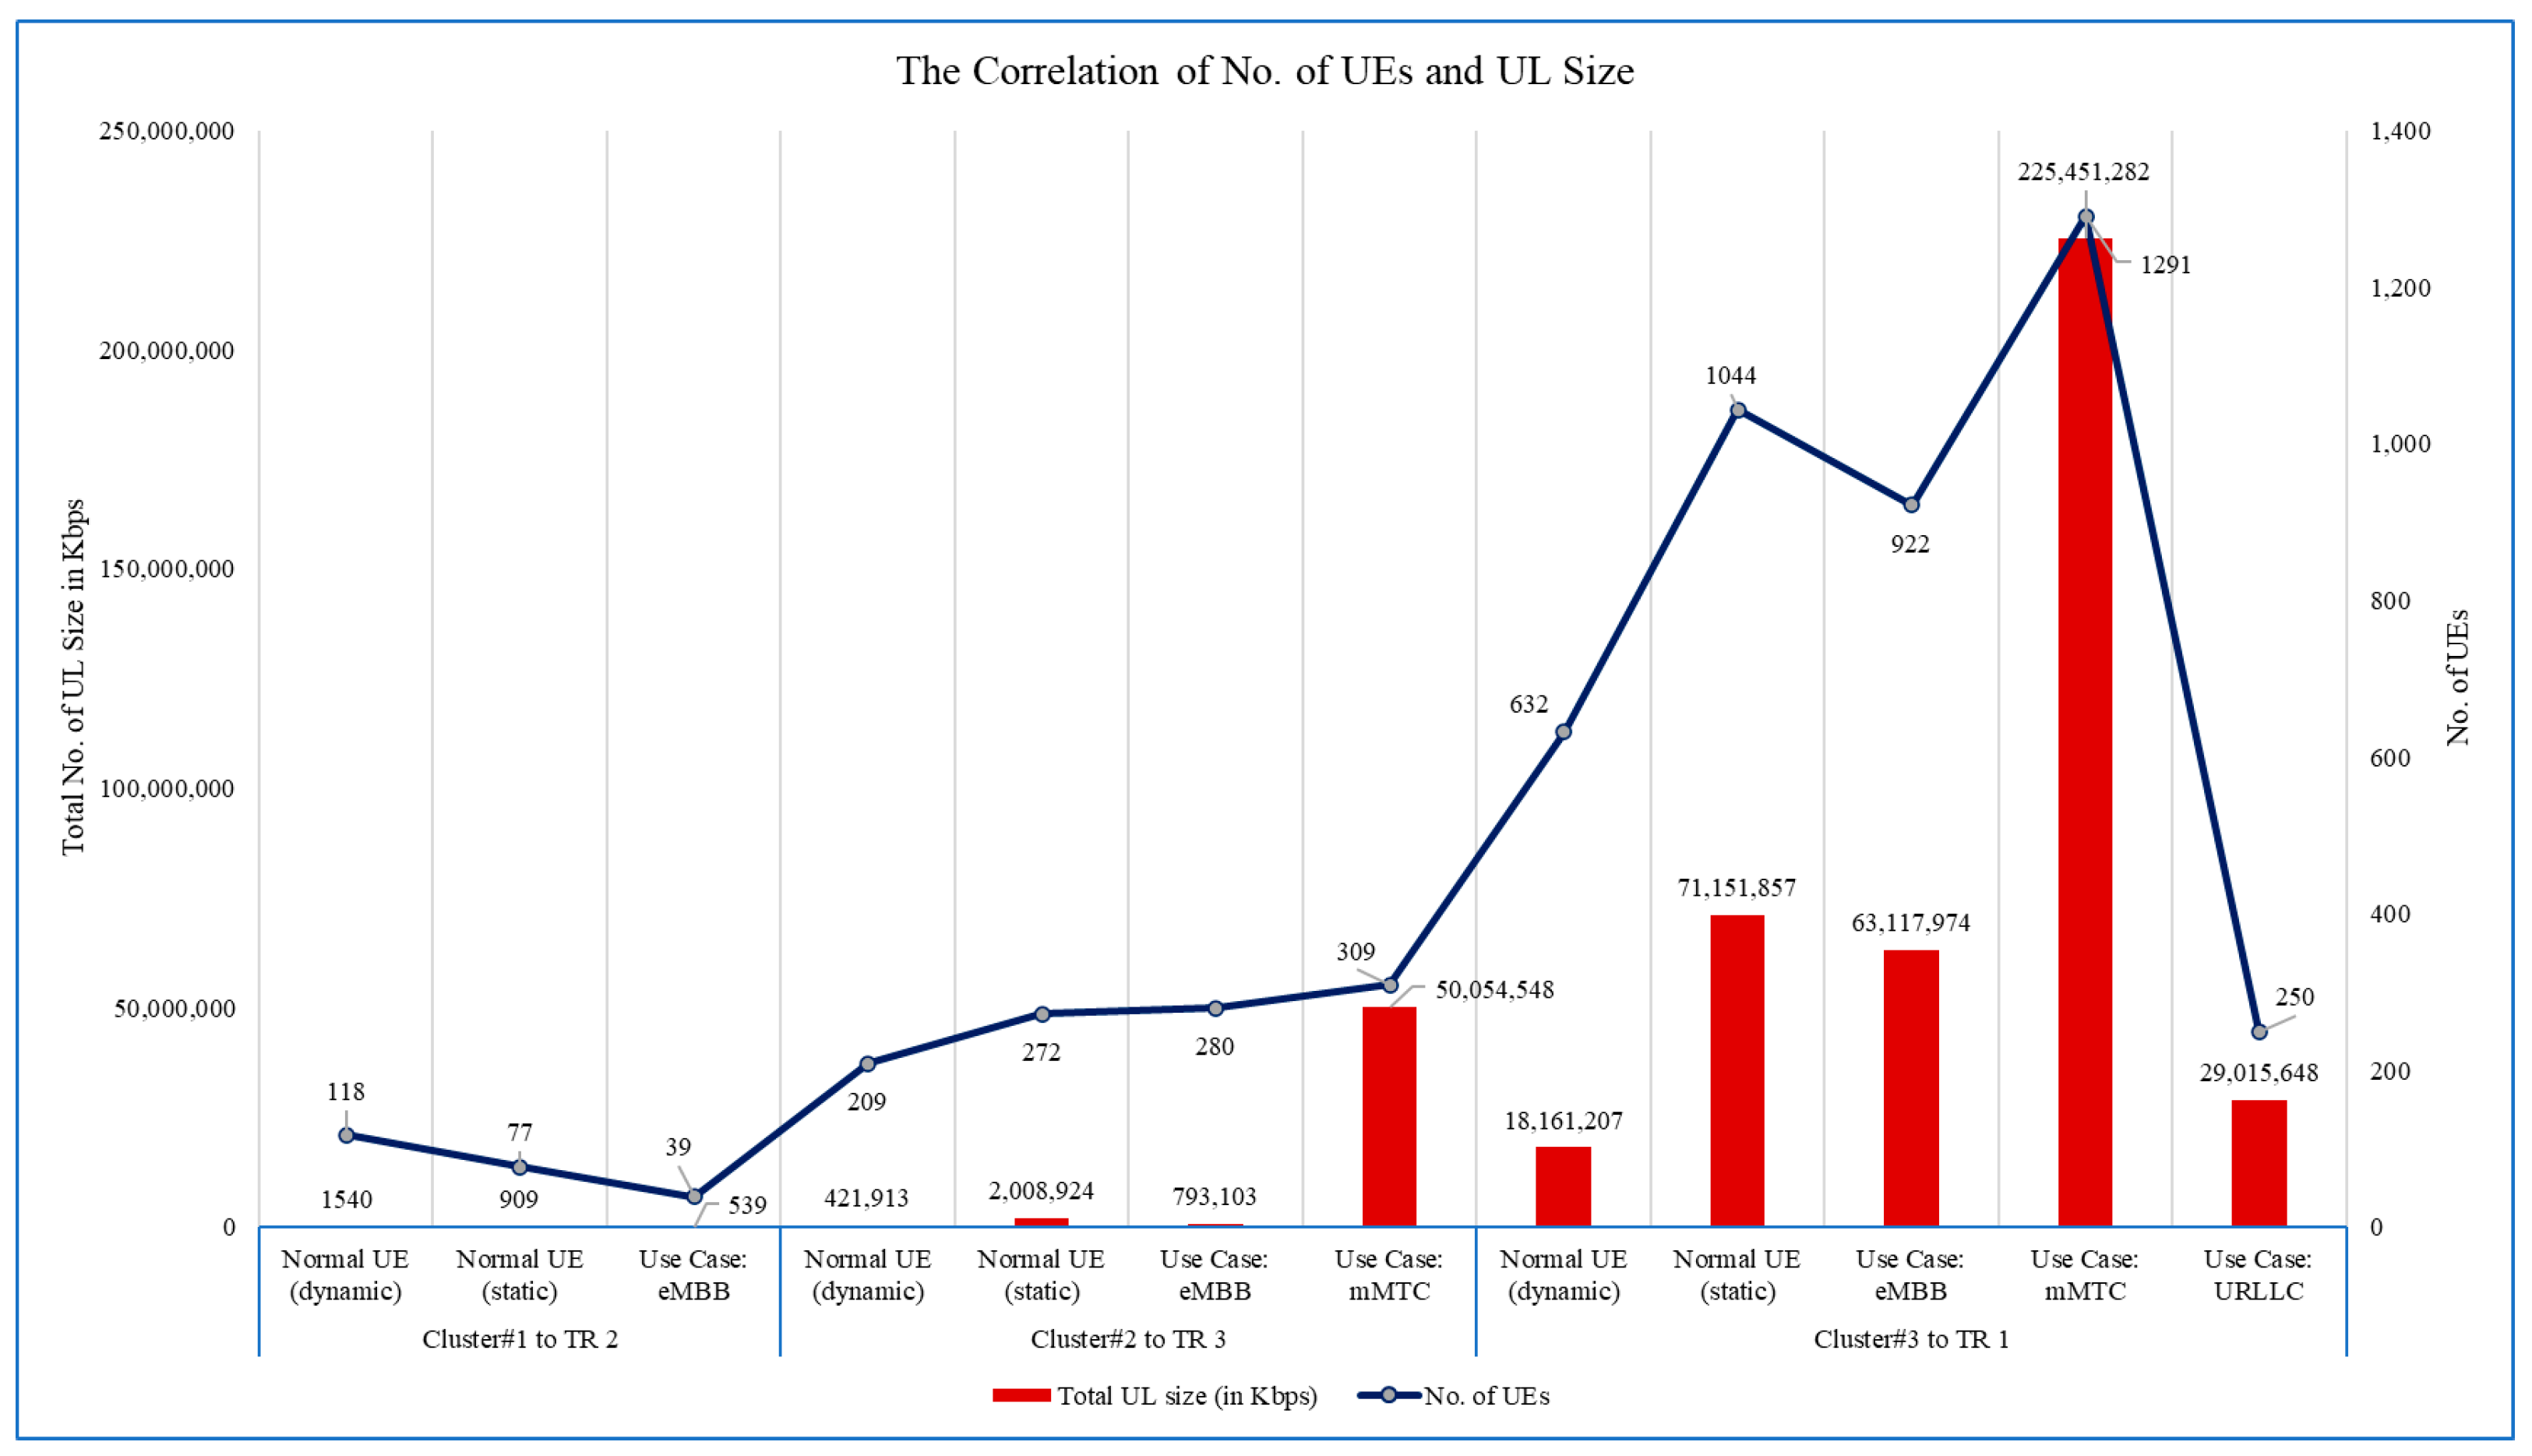
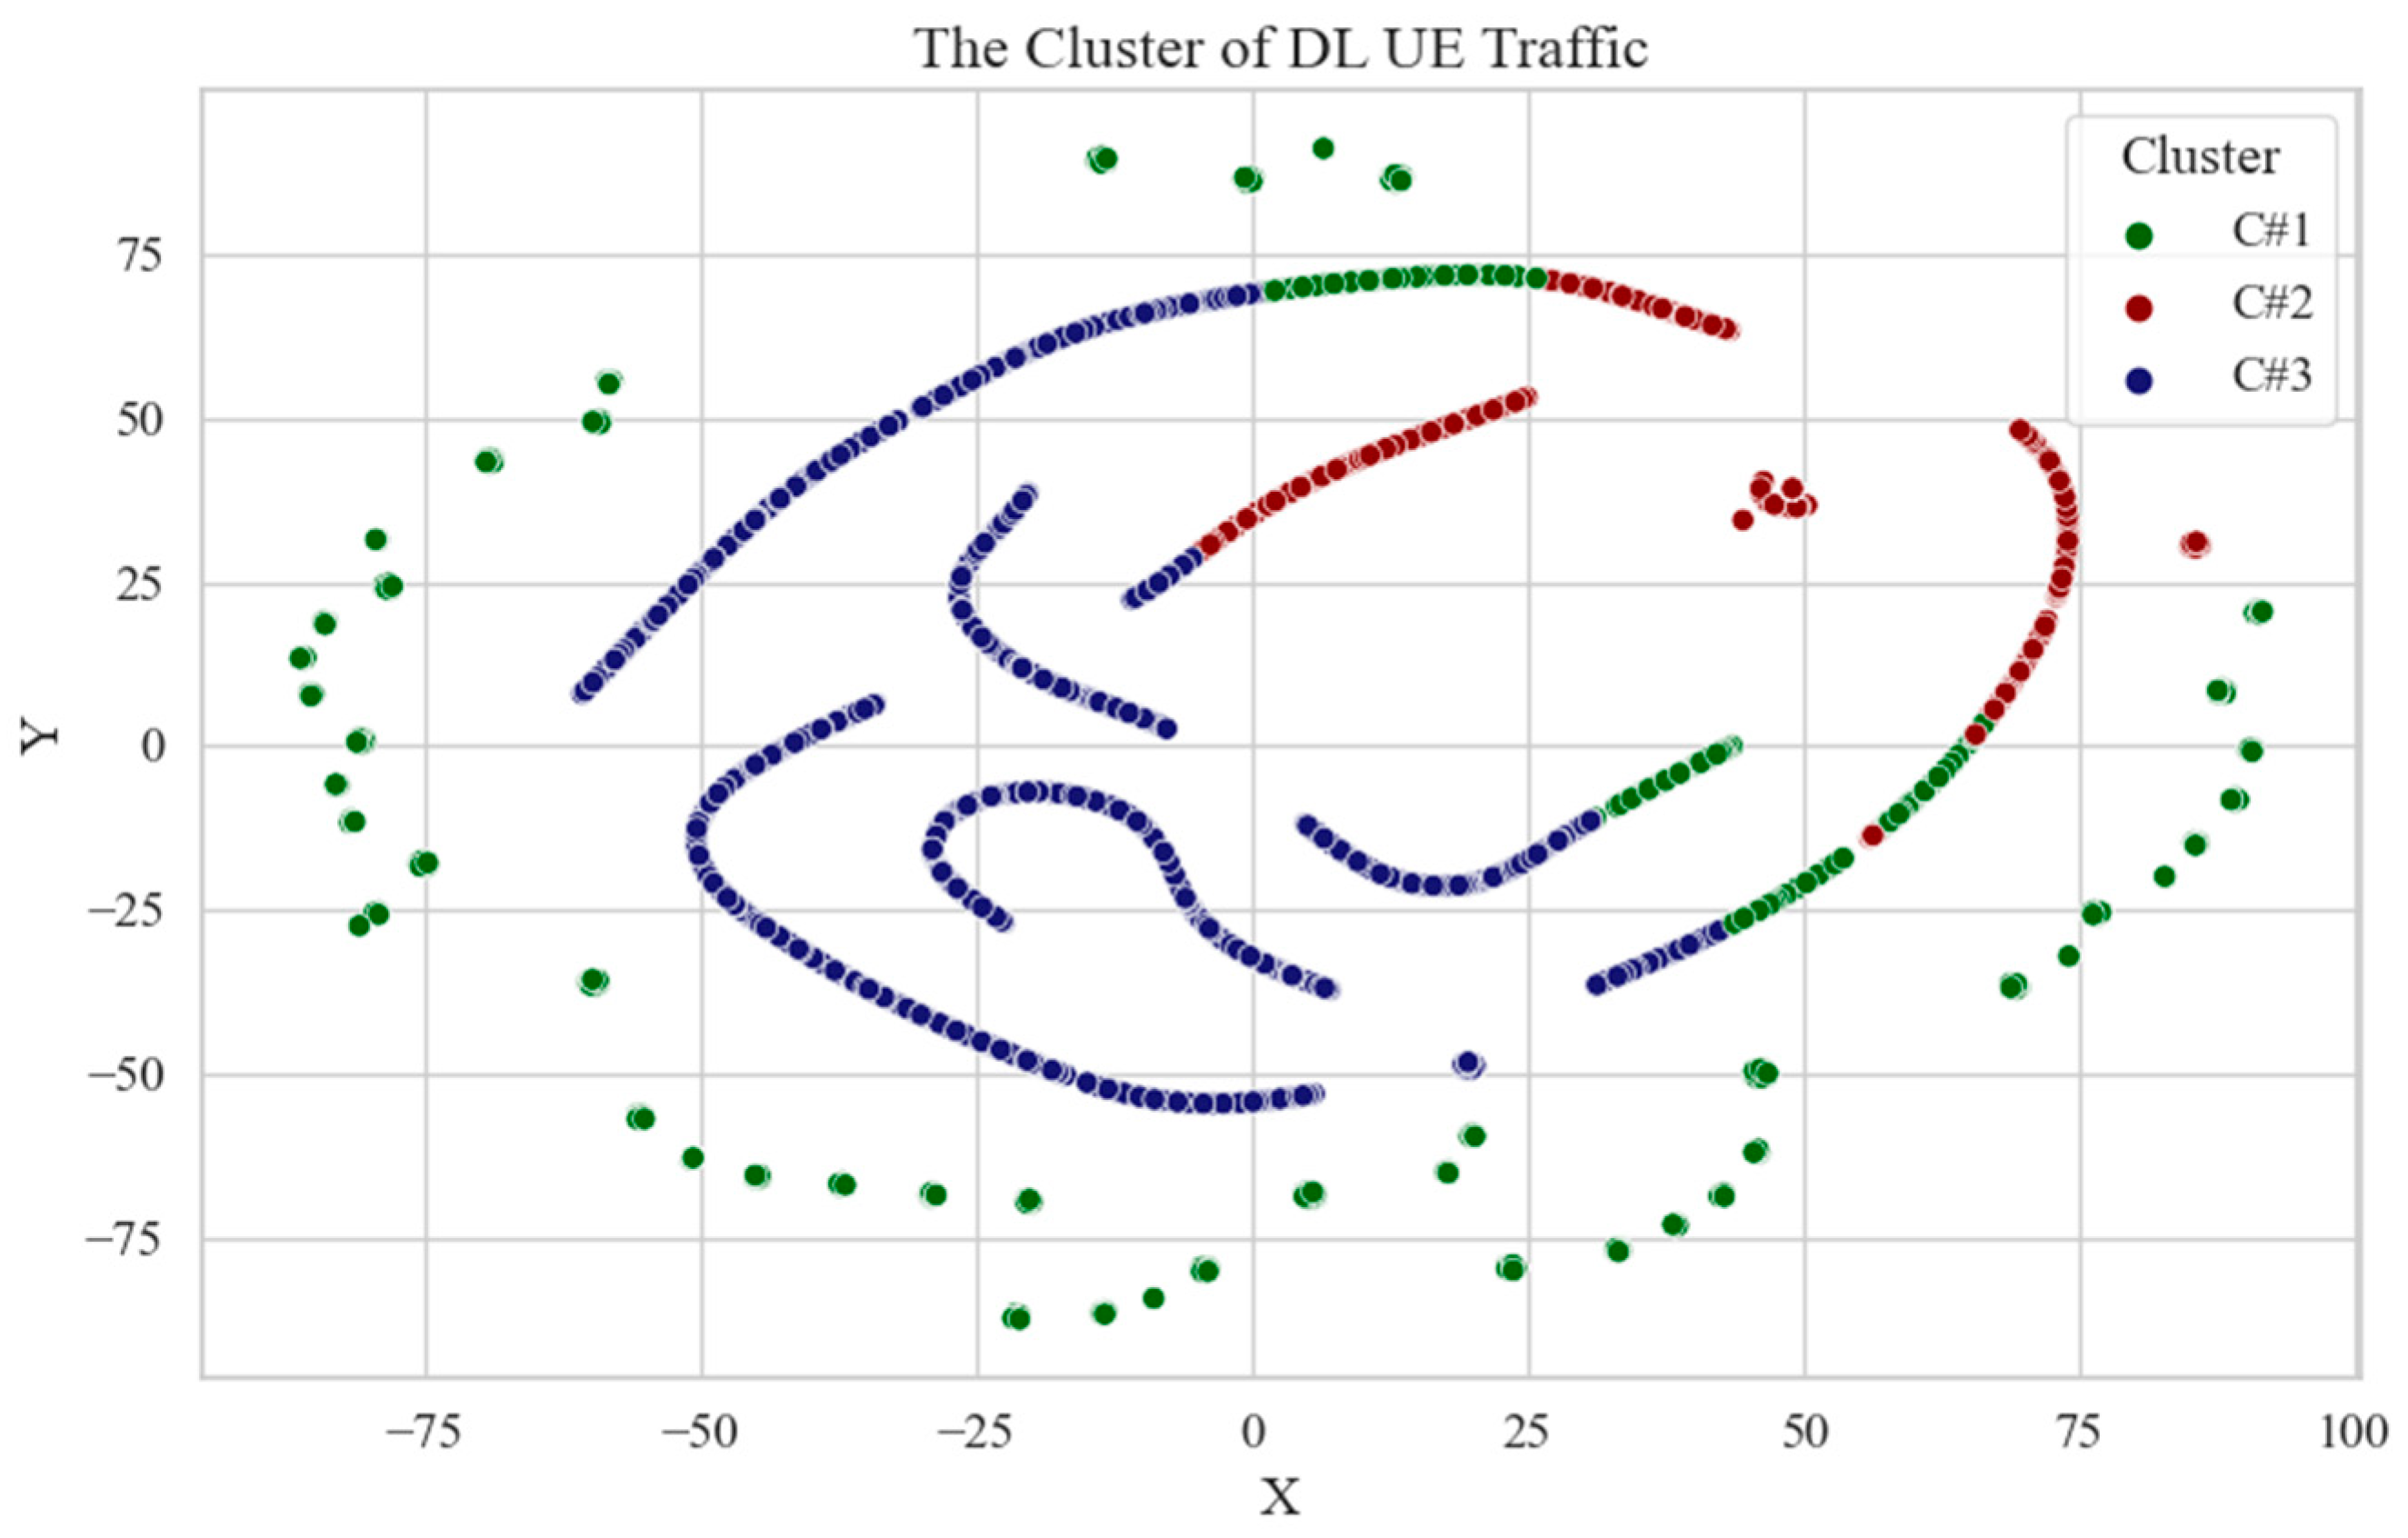
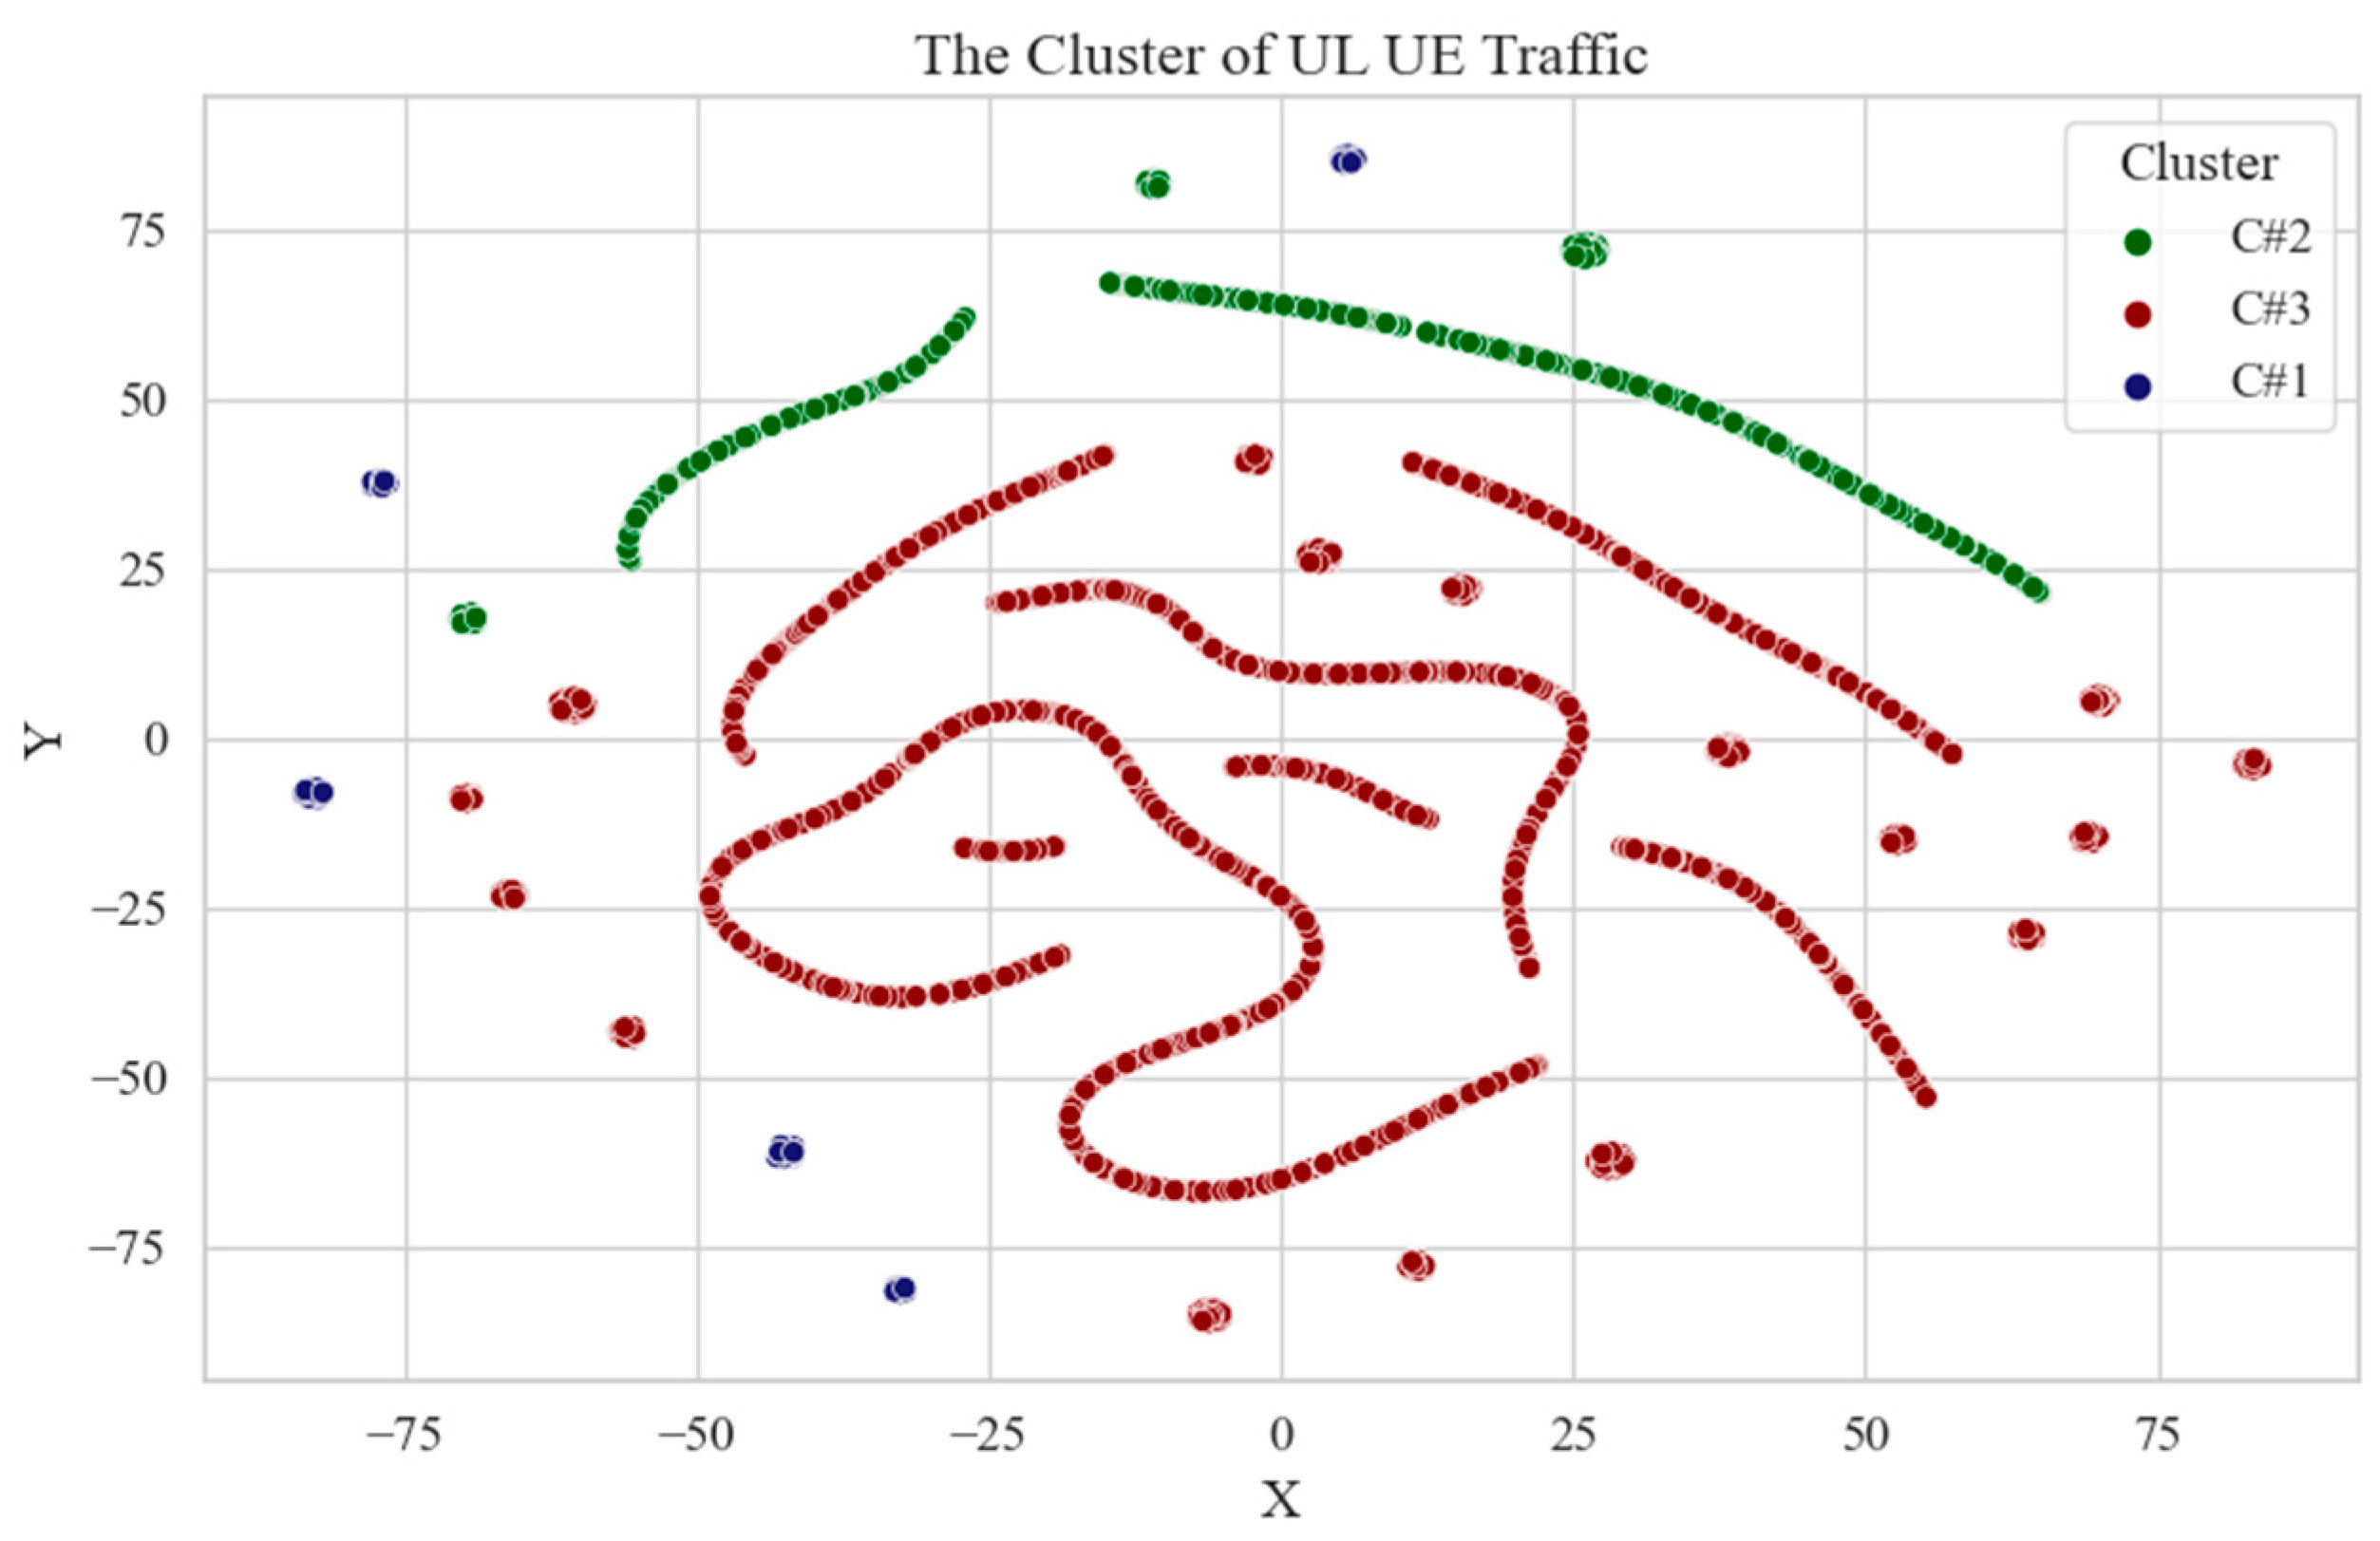
The unsupervised ML technique clustered the data into three groups. Thus, this study opted for a density-based clustering technique called Hierarchical Density-Based Spatial Clustering of Applications with Noise (HDBSCAN). Figure 6 and Figure 7 reveal that the HDBSCAN clustering technique produces the DL and UL traffic proportions generated by the UEs. The data displayed the traffic size in different clusters, highlighting the significance of traffic size compared to the total number of UEs. In addition, the number of UEs had no impact on the UE distribution in the cluster. This result observed a random distribution pattern of the number of UEs in the clusters (blue line). Nonetheless, traffic size produced increasing patterns along the increase of the traffic size (red bar). Each cluster also comprised several traffic classifications that were determined by similar attributes. The previous clustering process involved reducing the dimensions of a point or UE by representing its vector values and properties. Figure 8 and Figure 9 depict the clustering process output using dimensionality reduction, which transforms the DL and UL datasets.
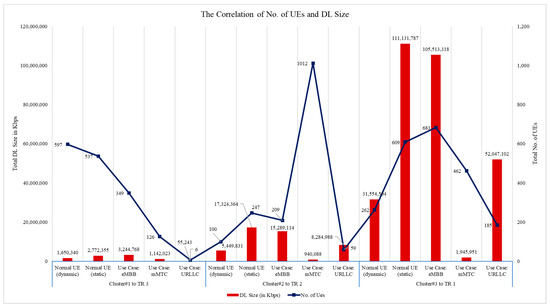
Figure 6.
The proportions of UE in the clusters for DL.
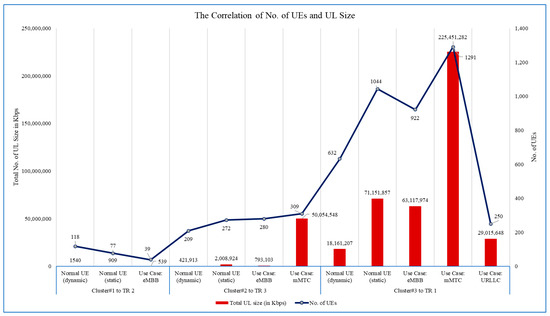
Figure 7.
The proportions of UE in the clusters for UL.

Figure 8.
The post-TSNE DL dataset of UEs for the clustering process.
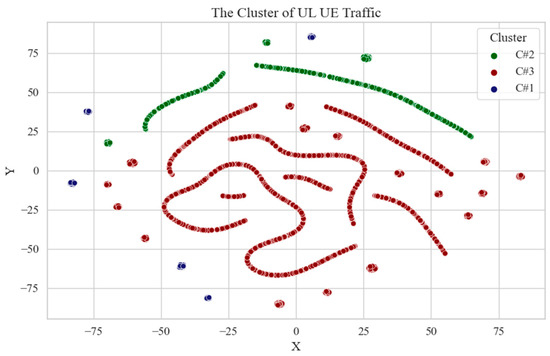
Figure 9.
The post-TSNE UL dataset of UEs for the clustering process.
5.2. DL and UL Cluster-Transport Assignment Process Results
This study clarified the matching process output between the clusters and transport network attributes in a vector value produced by the unsupervised dimensional reduction T-SNE method. A post-MILP process assigned a vector value of clusters to the transport types. The vector value was then reformed to the initial state, demonstrating the distinctive parameters of traffic size, time, and error rate.
5.2.1. The Performance of the Cluster-Transport Assignment in Scenario 1 (Dedicated Transport Network to a Single Node in a Service Area)
Table 3 indicates the total DL and UL results, indicating the performances of the clustering process based on machine learning techniques and assignments. The parameters for the assignment performance included the traffic size (DL and UL), time, and error rate. Moreover, the compatible assignment of the cluster was based on the computed parameters (see Table 1 and Table 2). Each cluster’s performance is measured by the total number of clusters, complying with the performance matrix in Table 3. The highest scoring percentage indicates the highest number of compliances for every instance and cluster formed. In each cluster, total traffic (DL or UL) is summed and matched with the available link capacity. Thus, both DL and UL traffic are within the set resources. Nonetheless, the PDB and PER show low scores because of the maximum value of PDB captured from UEs to represent the cluster, though many other UEs have lower values than the RTT of the transport link. The inverse proposition involves PER because the minimum PER value generated represents the cluster.
Table 3.
The performance of the clustering process: Scenario 1.
Each cluster was assigned to the appropriate transport type following the UL and DL parameters and transport type. Consequently, the values in each cluster against the designated transport network populating the high traffic usage were assigned to the optical network. This outcome was attributed to the high capacity of transport links (see Table 4). Table 4 indicates that at every instance, the maximum traffic size from every cluster formed is assigned to optical network because of the high-capacity link, whereas DOCSIS cable shows the adoption of handling 52% of the minimum traffic size captured from the clusters in each instance.
Table 4.
The composition of DL and UL traffic size to the transport network: Scenario 1.
5.2.2. The Performance of the Cluster-Transport Assignment in Scenario 2 (A Shared Transport Network in an Area with Multiple Service Nodes)
The following result showed a shared resources scenario that elucidated the selection mechanism behavior if the primary transport network (optical network) was shared and possessed low link capacity. Additionally, the cluster assignment to the transport network shifted by assigning high-traffic clusters with the highest capacity to the satellite transport network. This finding was similar to the output in Table 3, except that there are instances where the total traffic in DL and UL in the clusters computed higher than the available resources link, thus contributing to the two per cent drop in the score (see Table 5). The cluster assignment to the transport network revealed minor changes in the UL parameter. Notably, the UL capacity for DOCSIS cable was set to 6 Gbps per link instead of 10 Gbps of DL streams (see Table 1).
Table 5.
The performance of the clustering process: Scenario 2.
The assignment process in shared transport networks followed a similar pattern (inclination towards high-capacity link). Thus, the net available capacity in the optical network was low, shifting the high traffic size to satellite networks and minimum DL values in every instance proportionately shared among three transport links (see Table 6). The satellite network prevalently handles UL stream traffic, with 85% of the maximum traffic size in all 60 instances assigned to the satellite network (approximately for maximum DL in all 46 instances assigned to the satellite network). A total of 52% of the minimum traffic size for UL flows to DOCSIS cable.
Table 6.
The composition of DL and UL traffic size to the transport network: Scenario 2.
The simulation generated sixty instances, which comprised three clusters assigned to three transport network types (optical network, satellite network, and DOCSIS coaxial cable). Overall, in 60 instances, the composition of the clusters and assignment of the cluster to the transport network varied and showed no specific pattern or relations between the cluster and transport network. The assignment of a cluster to the transport network was performed unanimously across all recorded instances and was created based on the dynamic attributes of UEs.
5.3. DL and UL Use Case Results: Transport Assignment Process
5.3.1. The Performance of the Cluster-Transport Assignment in Scenario 1 (Dedicated Transport Network to a Single Node in a Service Area)
This study improved the traffic load proportioning process into multiple transport network types to determine the most efficient assignment. The process was achieved by clustering the traffic based on the UE type or use cases. A similar approach was also applied to this process (see Figure 5). Table 7 displays the proportions of use cases for the UL stream in the dedicated resources of the transport network. Each traffic was grouped based on its classifications and was then assigned using the MILP method. From Table 7, DL and UL traffic sizes are generated within the available link’s resources. Similar to the observation from Table 3, PDB and PER values produce values higher and lower than the link’s RTT and PER, respectively, thus producing very low scoring to the performance matrix.
Table 7.
The performance of the clustering process (use case): Scenario 1.
The high DL traffic is fully assigned to the optical network originating from the eMBB use case traffic type. In contrast, the maximum list of UL traffic from every instance is distributed to two transport network types (optical network and DOCSIS cable). The highly generated upload traffic based on the nature of the mMTC use case results in assignment to the optical network (48.33%), with satellite network handling a minimal percentage of mMTC traffic types (3.33%). On the other hand, the list of minimum UL traffic is assigned to the optical network (see Table 8).
Table 8.
The composition of DL and UL traffic size (use case) to the transport network: Scenario 1.
5.3.2. The Performance of the Cluster-Transport Assignment in Scenario 2 (A Shared Transport Network in an Area with Multiple Service Nodes)
Table 9 depicts the use case transport assignment for UL streams containing shared transport resources, in which the net available optical network is used to accommodate traffic from other nodes. Nonetheless, each cluster formed from the use cases shows traffic size within the available resources except in 13% of the total instances where clusters produced higher UL traffic size than the link’s capacity. The time parameters show full compliance within the full round-trip time of links.
Table 9.
The performance of the clustering process (use case): Scenario 2.
Notably, Table 10 explains the assignment of high DL traffic shifting towards the next highest link’s capacity because a low and exhaustive capacity of the optical network was observed in several instances. The eMBB and mMTC generated high and low UL traffic and the assignment to the satellite network and DOCSIS cable transport options, respectively. Elaborating on UL traffic from Table 10, a shift from assigning the mMTC and URLLC traffic across all available transport options can be observed. This finding was attributed to the satellite network capacity consumed by most of the UL traffic from both maximum and minimum lists of UL values.
Table 10.
The composition of DL and UL traffic size (use case) to the transport network: Scenario 2.
The assignment result exhibited an unpredictable correlation between time and error rate values in determining the UE traffic and transport network selection process. Comparable results were also noted for the output from the selection process implemented in the cluster-transport assignment in Section 5.1. This study provided additional findings, in which the outcome pattern only produced disputable assignments due to low transport network capacity. From the findings, DOCSIS cable was selected as one of the transport options because of its ability to handle low traffic.
6. Conclusions and Future Works
This study successfully constructed an intelligent mechanism to comprehend traffic load while assigning it to suitable transport networks. Unsupervised ML techniques were used to retrieve the optimal traffic cluster configurations. The result from clustering works shows the formation of cluster groups based on the density plots of the data. The cluster was then translated to numerical values representing the size of the traffic, delay, and packet loss. The cluster’s numerical result was then relayed to the decision-making process to determine the optimum match to transport network numerical values. An intelligent mechanism was effectively demonstrated in choosing the appropriate transport type based on the traffic and transport attributes. This observation was shown from the movement of cluster assignment on transport network type demonstrated in scenarios 1 and 2. Therefore, an intelligent mechanism using ML techniques and solver-based solutions was successfully introduced and demonstrated to achieve a high percentage (98%) of dynamic traffic steering capability based on resource links.
The decision-making process was assessed in this study by performing transport selection based on the standard use cases (scenario 2) defined in 5G (eMBB, mMTC, and URLLC). Thus, the UE clustering process (ML and use cases) observed a marginal performance difference with the same dataset. Moreover, using ML approaches in clustering yielded more definitive assignment outcomes for the selected transport network type. Nonetheless, this study identified the necessity for additional functionalities in traffic-transport assignment throughout the decision-making stage. Even though the assignment performed the selection based on the similarity attributes between the two sides, the UE traffic size and transport network capacity strongly influenced the assignment. Time and error rate attributes were not fully understood and demystified.
Future studies should determine newer approaches to reconfigure the entire process and replicate the cluster configuration. This process requires repeating the decision-making stages to guarantee an indisputable assignment of traffic-transport type and produce a highly efficient assignment. Consequently, a finer approach shall be explored in depth, considering parameters such as time and error rate to produce more influential decisions on the assignment process.
Author Contributions
Conceptualization, H.A.H.N. and T.M.; methodology, H.A.H.N.; validation, H.A.H.N. and T.M.; formal analysis, H.A.H.N.; investigation, H.A.H.N.; resources, H.A.H.N.; data curation, H.A.H.N.; writing—original draft preparation, H.A.H.N.; writing—review and editing, H.A.H.N.; visualization, T.M.; supervision, T.M. All authors have read and agreed to the published version of the manuscript.
Funding
This research received no external funding.
Data Availability Statement
Data are contained within the article.
Conflicts of Interest
The authors declare no conflicts of interest, and the funders had no role in the design of the study; in the collection, analyses, or interpretation of data; in the writing of the manuscript; or in the decision to publish the results.
References
- 5G Infrastructure Association. European Vision for the 6G Network Ecosystem. 2021. Available online: https://zenodo.org/records/5007671 (accessed on 7 March 2023).
- Li, N.; Xu, X.; Sun, Q.; Wu, J.; Zhang, Q.; Chi, G.; Sprecher, N. Transforming the 5G RAN with Innovation: The Confluence of Cloud Native and Intelligence. IEEE Access 2023, 11, 4443–4454. [Google Scholar] [CrossRef]
- Alhusein, A.; Dongyu, Q. The eNodeB Selection Using Channel Outcome with Machine Learning in Dense 5G Networks. In Proceedings of the 19th International Conference on Electrical Engineering/Electronic, Computer, Telecommunications and Information Technology (ECTI-CON), Prachuap Khiri Khan, Thailand, 24–27 May 2022. [Google Scholar]
- Jung, S.; Bahk, S. Online Control of Traffic Split and Distributed Cell Group State Decisions for Multi-Connectivity in 5G and Beyond. IEEE Trans. Veh. Technol. 2022, 71, 2843–2858. [Google Scholar] [CrossRef]
- Richard, L.; Mehmet, T.; Dirk, T.; David, H.; Viliam, S.; Sundeep, B.; Mostafa, E.; Donghee, S.; Alexander, C.; Network 5.0 Team; et al. Network 2030: A Blueprint of Technology, Applications and Market Drivers towards the Year 2030 and Beyond. Available online: https://www.itu.int/en/ITU-T/focusgroups/net2030/Documents/White_Paper.pdf (accessed on 7 March 2023).
- Giambene, G.; Kota, S.; Pillai, P. Satellite-5G Integration: A Network Perspective. IEEE Netw. 2018, 32, 25–31. [Google Scholar] [CrossRef]
- Acker, O.; Pötscher, F.; Lefort, T. Why Satellites Matter The Relevance of Commercial Satellites in the 21st Century—A Perspective 2012–2020. Esoa.Net. 2020, p. 96. Available online: https://esoa.net/wp-content/uploads/2012-09-boozco-Why-Satellites-Matter-Full-Report.pdf (accessed on 7 March 2023).
- Andreoli-Fang, J.; Chapman, J.T.; Liu, T.; Poltz, D. Blueprint for Mobile Xhaul over DOCSIS® How Low Latency Xhaul (LLX) and Other Technologies Make DOCSIS an Ideal Solution for Mobile Xhaul. Available online: https://www.nctatechnicalpapers.com/Paper/2019/2019-blueprint-for-mobile-xhaul-over-docsis/download (accessed on 7 March 2023).
- Xie, C.; Zhang, B. Scaling Optical Interconnects for Hyperscale Data Center Networks. Proc. IEEE 2022, 110, 1699–1713. [Google Scholar] [CrossRef]
- Ruffini, M.; Xie, C.; Wey, J.S. Connected OFCity Challenge: An updated perspective on technology for connected cities. In Proceedings of the Optical Fiber Communication Conference, San Diego, CA, USA, 5–9 March 2023; Optica Publishing Group: Washington, DC, USA, 2023. [Google Scholar]
- Mitra, P.; Bhattacharjee, R.; Chatterjee, T.; De, S.; Karmakar, R.; Ghosh, A.; Adhikari, T. Towards 6G Communications: Architecture, Challenges, and Future Directions. In Proceedings of the 2021 12th International Conference on Computing Communication and Networking Technologies (ICCCNT), Kharagpur, India, 6–8 July 2021; pp. 1–7. [Google Scholar] [CrossRef]
- Tirmizi, S.B.R.; Chen, Y.; Lakshminarayana, S.; Feng, W.; Khuwaja, A.A. Hybrid Satellite–Terrestrial Networks toward 6G: Key Technologies and Open Issues. Sensors 2022, 22, 8544. [Google Scholar] [CrossRef] [PubMed]
- Nakayama, Y.; Hisano, D.; Kubo, T.; Fukada, Y.; Terada, J.; Otaka, A. Low-Latency Routing Scheme for a Fronthaul Bridged Network. J. Opt. Commun. Netw. 2018, 10, 14–23. [Google Scholar] [CrossRef]
- Lubna, T.; Mahmud, I.; Cho, Y.-Z. Low Latency and High Data Rate (LLHD) Scheduler: A Multipath TCP Scheduler for Dynamic and Heterogeneous Networks. Sensors 2022, 22, 9869. [Google Scholar] [CrossRef] [PubMed]
- Giuliano, R.; Innocenti, E. Machine Learning Techniques for Non-Terrestrial Networks. Electronics 2023, 12, 652. [Google Scholar] [CrossRef]
- Alevizaki, V.-M.; Anastasopoulos, M.; Manolopoulos, A.-I.; Tzanakaki, A. Distributed Service Provisioning for Disaggregated 6G Network Infrastructures. IEEE Trans. Netw. Serv. Manag. 2023, 20, 120–137. [Google Scholar] [CrossRef]
- Tang, F.; Mao, B.; Kawamoto, Y.; Kato, N. Survey on Machine Learning for Intelligent End-to-End Communication Toward 6G: From Network Access, Routing to Traffic Control and Streaming Adaption. IEEE Commun. Surv. Tutor. 2021, 23, 1578–1598. [Google Scholar] [CrossRef]
- Oughton, E.J.; Lehr, W. Surveying 5G Techno-Economic Research to Inform the Evaluation of 6G Wireless Technologies. IEEE Access 2022, 10, 25237. [Google Scholar] [CrossRef]
- Jiang, W.; Han, B.; Habibi, M.A.; Schotten, H.D. The Road Towards 6G: A Comprehensive Survey. IEEE Open J. Commun. Soc. 2021, 2, 334–366. [Google Scholar] [CrossRef]
- Tahasin, Z.I. The 6G network prospects: How IT will transform the wireless communication landscape. Int. Res. J. Mod. Eng. Technol. Sci. 2021, 3, 2863–2868. [Google Scholar]
- Shen, L.-H.; Feng, K.-T.; Hanzo, L. Five Facets of 6G: Research Challenges and Opportunities. ACM Comput. Surv. 2023, 55, 1–39. [Google Scholar] [CrossRef]
- Goścień, R. Traffic-aware service relocation in software-defined and intent-based elastic optical networks. Comput. Netw. 2023, 225, 109660. [Google Scholar] [CrossRef]
- Fan, Z.; Liu, R. Investigation of machine learning based network traffic classification. In Proceedings of the 2017 International Symposium on Wireless Communication Systems (ISWCS), Bologna, Italy, 28–31 August 2017; pp. 1–6. [Google Scholar] [CrossRef]
- Mendoza, F.; Ferrus, R.; Sallent, O. Experimental proof of concept of an SDN-based traffic engineering solution for hybrid satellite-terrestrial mobile backhauling. Int. J. Satell. Commun. Netw. 2019, 37, 630–645. [Google Scholar] [CrossRef]
- Zhang, J.; Zhang, X.; Wang, P.; Liu, L.; Wang, Y. Double-Edge Intelligent Integrated Satellite Terrestrial Networks. China Commun. 2020, 17, 128–146. [Google Scholar] [CrossRef]
- Subramanya, T.; Harutyunyan, D.; Riggio, R. Machine learning-driven service function chain placement and scaling in MEC-enabled 5G networks. Comput. Netw. 2020, 166, 106980. [Google Scholar] [CrossRef]
- Pham, T.-M. Traffic Engineering Based on Reinforcement Learning for Service Function Chaining with Delay Guarantee. IEEE Access 2021, 9, 121583–121592. [Google Scholar] [CrossRef]
- Dai, B.; Huang, W.; Shi, X.; Lv, M.; Mo, Y. Towards AI-Driven on-Demand Routing in 6G Wide-Area Networks. In Proceedings of the IEEE INFOCOM 2023—IEEE Conference on Computer Communications Workshops (INFOCOM WKSHPS), Hoboken, NJ, USA, 20 May 2023; pp. 1–6. [Google Scholar] [CrossRef]
- Velasco, L.; Signorelli, M.; De Dios, O.G.; Papagianni, C.; Bifulco, R.; Olmos, J.J.V.; Pryor, S.; Carrozzo, G.; Schulz-Zander, J.; Bennis, M.; et al. End-to-End Intent-Based Networking. IEEE Commun. Mag. 2021, 59, 106–112. [Google Scholar] [CrossRef]
- Velasco, M.R.L.; Barzegar, S.; Tabatabaeimehr, F. Intent-based networking and its application to optical networks [Invited Tutorial]. Opt. Commun. Netw. 2022, 14, 11–22. [Google Scholar] [CrossRef]
Disclaimer/Publisher’s Note: The statements, opinions and data contained in all publications are solely those of the individual author(s) and contributor(s) and not of MDPI and/or the editor(s). MDPI and/or the editor(s) disclaim responsibility for any injury to people or property resulting from any ideas, methods, instructions or products referred to in the content. |
© 2024 by the authors. Licensee MDPI, Basel, Switzerland. This article is an open access article distributed under the terms and conditions of the Creative Commons Attribution (CC BY) license (https://creativecommons.org/licenses/by/4.0/).