
Comparison of Computed Tomography Scoring Systems in Patients with COVID-19 and Hematological Malignancies
 ,
,
Abstract
Simple Summary
Abstract
1. Introduction
2. Materials and Methods
2.1. Study Design and Patient Population
2.2. Chest Computed Tomography
- -
- GGO was defined as hazy increased attenuation of lung with preserved bronchial and vascular margins;
- -
- Consolidation was considered an increase in pulmonary parenchymal attenuation that obscures the airways and vessels;
- -
- Crazy paving was the area of GGO with coexisting thickening of interlobular septae;
- -
- Pleural effusion was described as a free fluid in the pleural cavity;
- -
- Septal thickening comprised abnormal widening of an interlobular septum or septae;
- -
- Subpleural lines comprised a thin curvilinear opacity of a few millimeters or less thickness usually less than 1 cm from pleural surface and paralleling the pleura.
- -
- Chest CT Severity Score (CT-SS): According to the anatomic structure, the 18 segments of both lungs were divided into 20 regions, in which the posterior apical segment of the left upper lobe was subdivided into apical and posterior segmental regions, whereas the anteromedial basal segment of the left lower lobe was subdivided into anterior and basal seg-mental regions. The lung opacities in all of the 20 lung regions were subjectively evaluated on chest CT images using a system attributing score of 0, 1, and 2 if parenchymal opacification involved 0%, less than 50%, or equal to or more than 50% of each region, respectively. The CT-SS was defined as the sum of the individual scores in the 20 lung segment regions, which may range from 0 to 40 points [6];
- -
- Chest CT Score (CT-S): Each of the five lung lobes was visually scored on a scale of 0 to 5, with 0 indicating no involvement; 1, less than 5% involvement; 2, 5–25% involvement; 3, 26–49% involvement; 4, 50–75% involvement; and 5, more than 75% involvement. The total CT score was the sum of the individual lobar scores and ranged from 0 (no involvement) to 25 (maximum involvement) [10,11];
- -
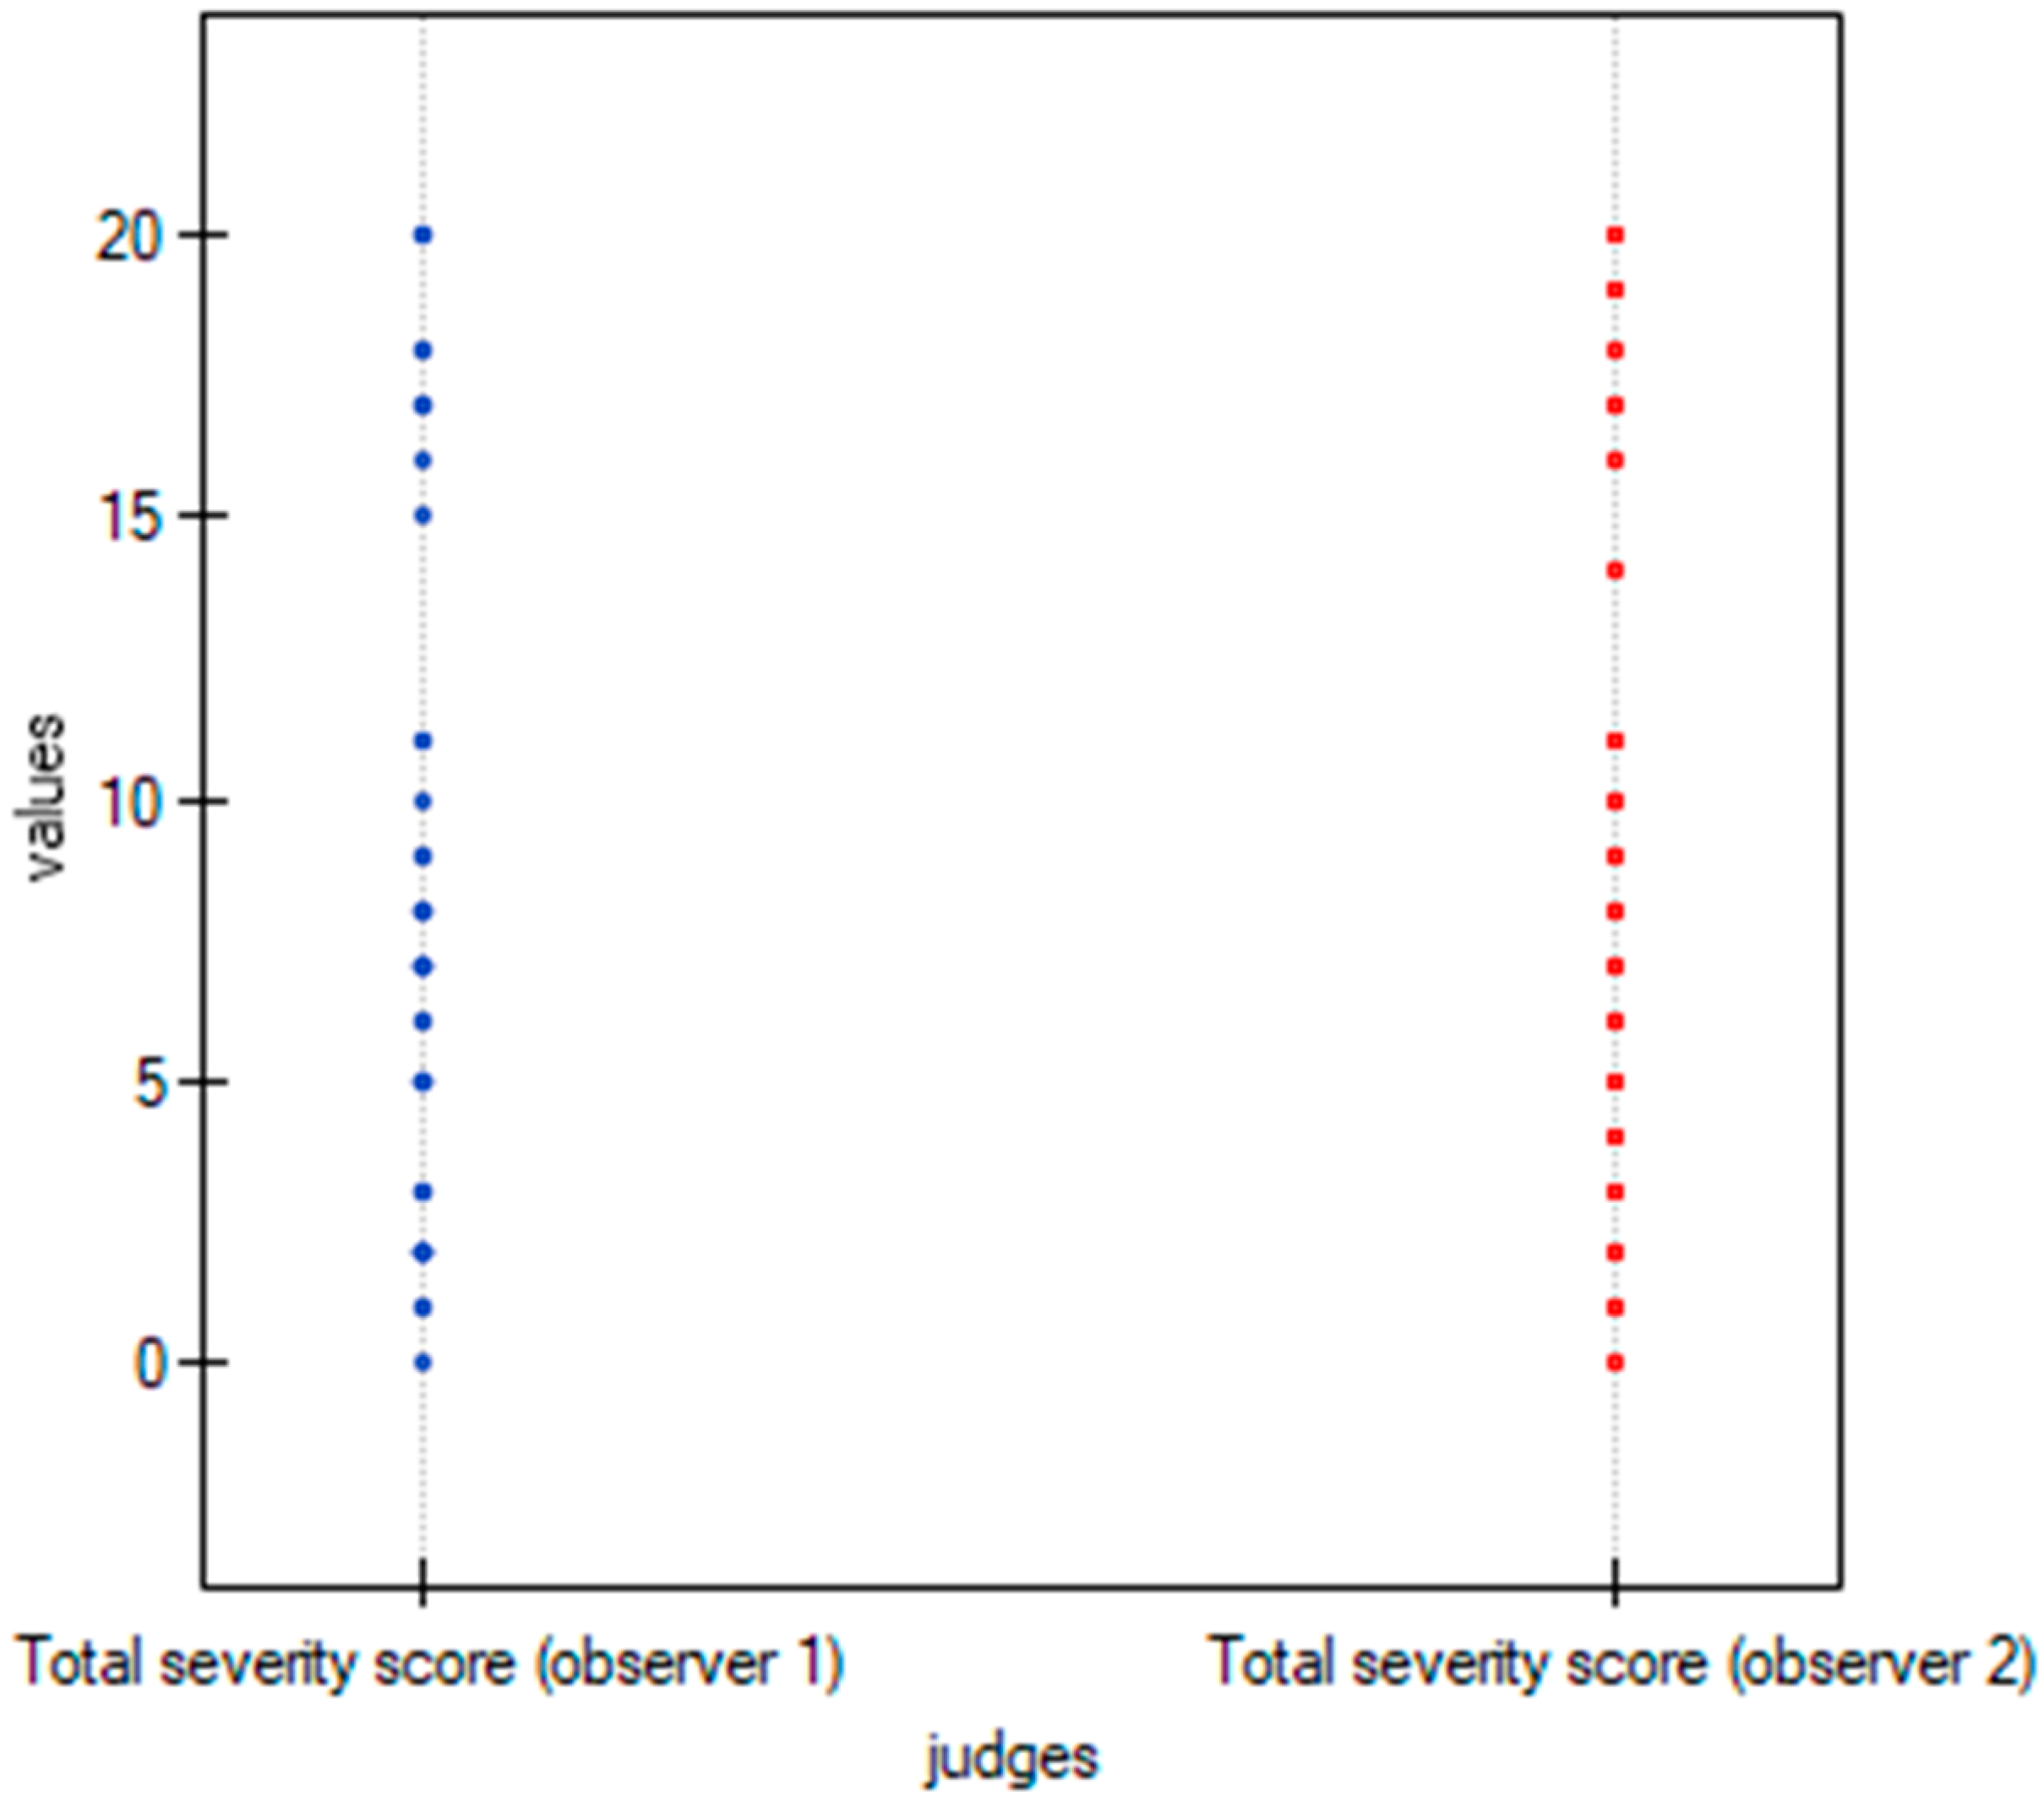
- Total severity score (TSS): The TSS was calculated for each of the 5 lobes in all patients. According to the extent of pulmonary involvement, each lobe could be scored from 0 to 4 points as the following: 0, no involvement; 1, from 1 to 25% involvement; 2, from 26 to 50% involvement; 3, from 51 to 75% involvement; and 4, more than 75% involvement. The sum of each individual lobar score resulted in the TSS, which ranged from 0 to 20 [12];
- -
- Modified Total Severity Score (m-TSS): m-TSS scale includes additional qualitative features of lung involvement: A—ground glass opacity, B—crazy-paving pattern, C—consolidations, and X—character other than enlisted [13].
2.3. Viral Analysis
2.4. Statistical Analysis
3. Results
3.1. Clinical and Radiological Characteristics of the Examined Patients According to COVID-19 Severity
3.2. Inter-Observer Agreement
3.3. Severity Scoring Systems
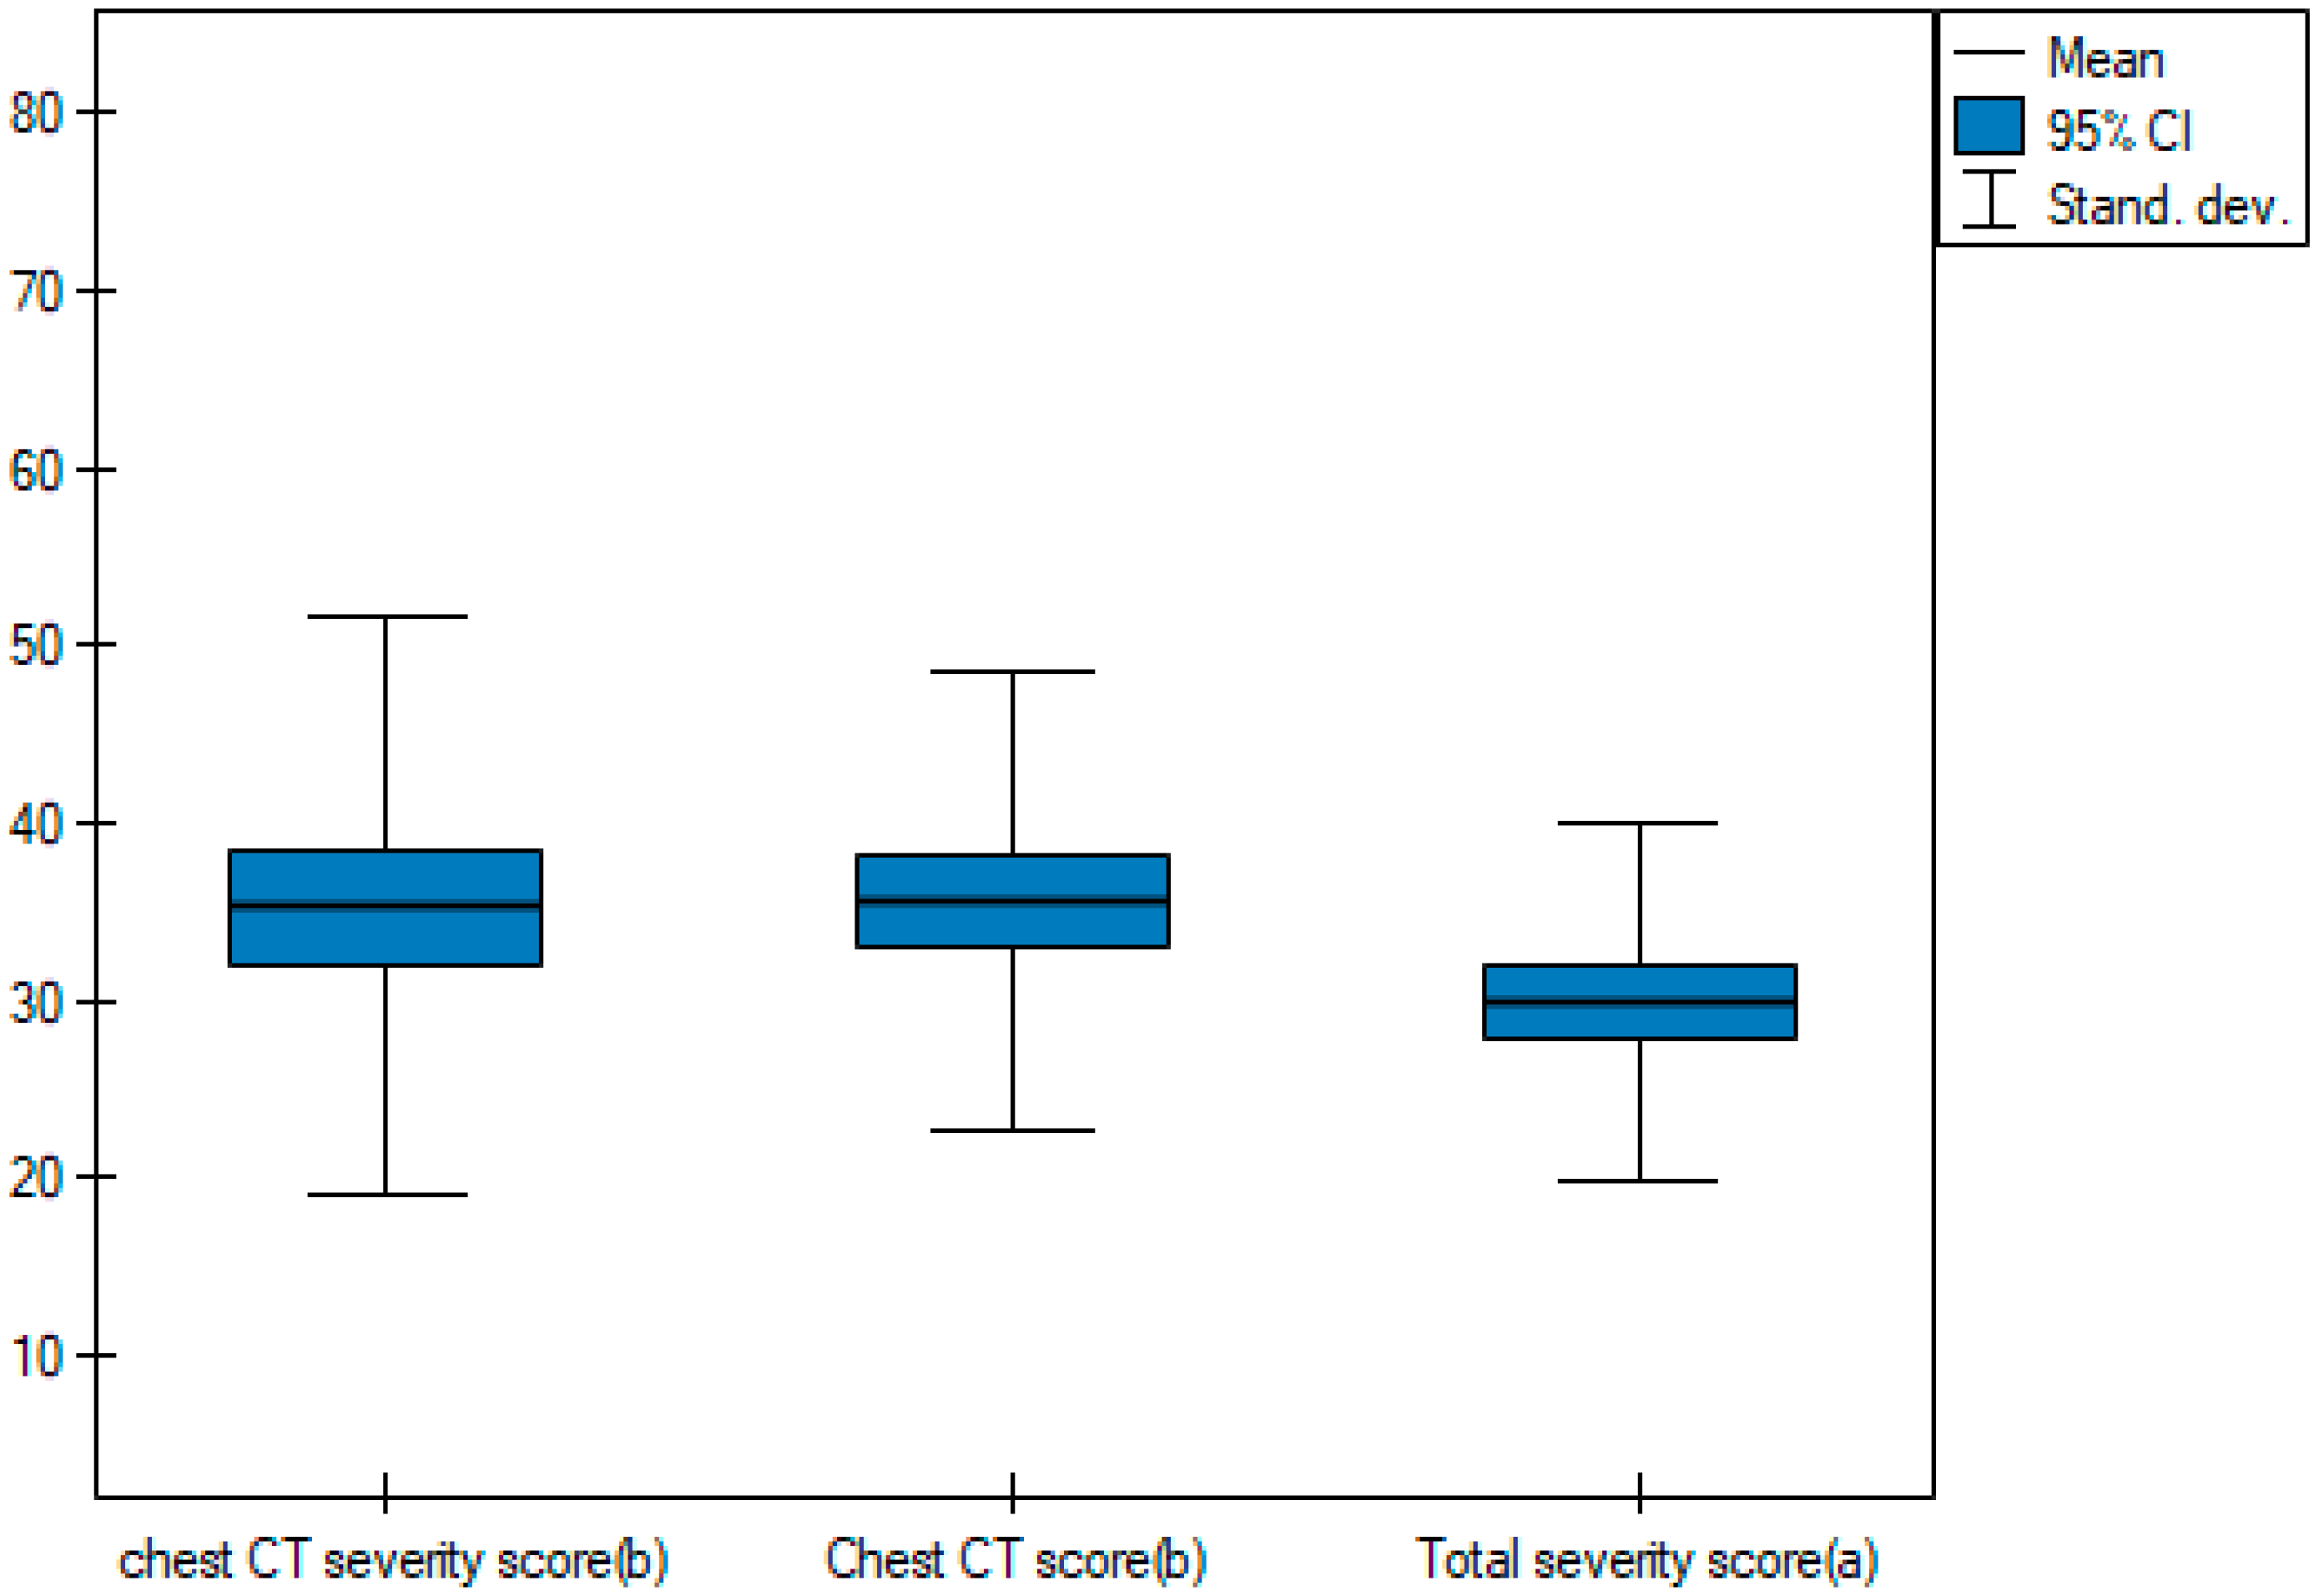
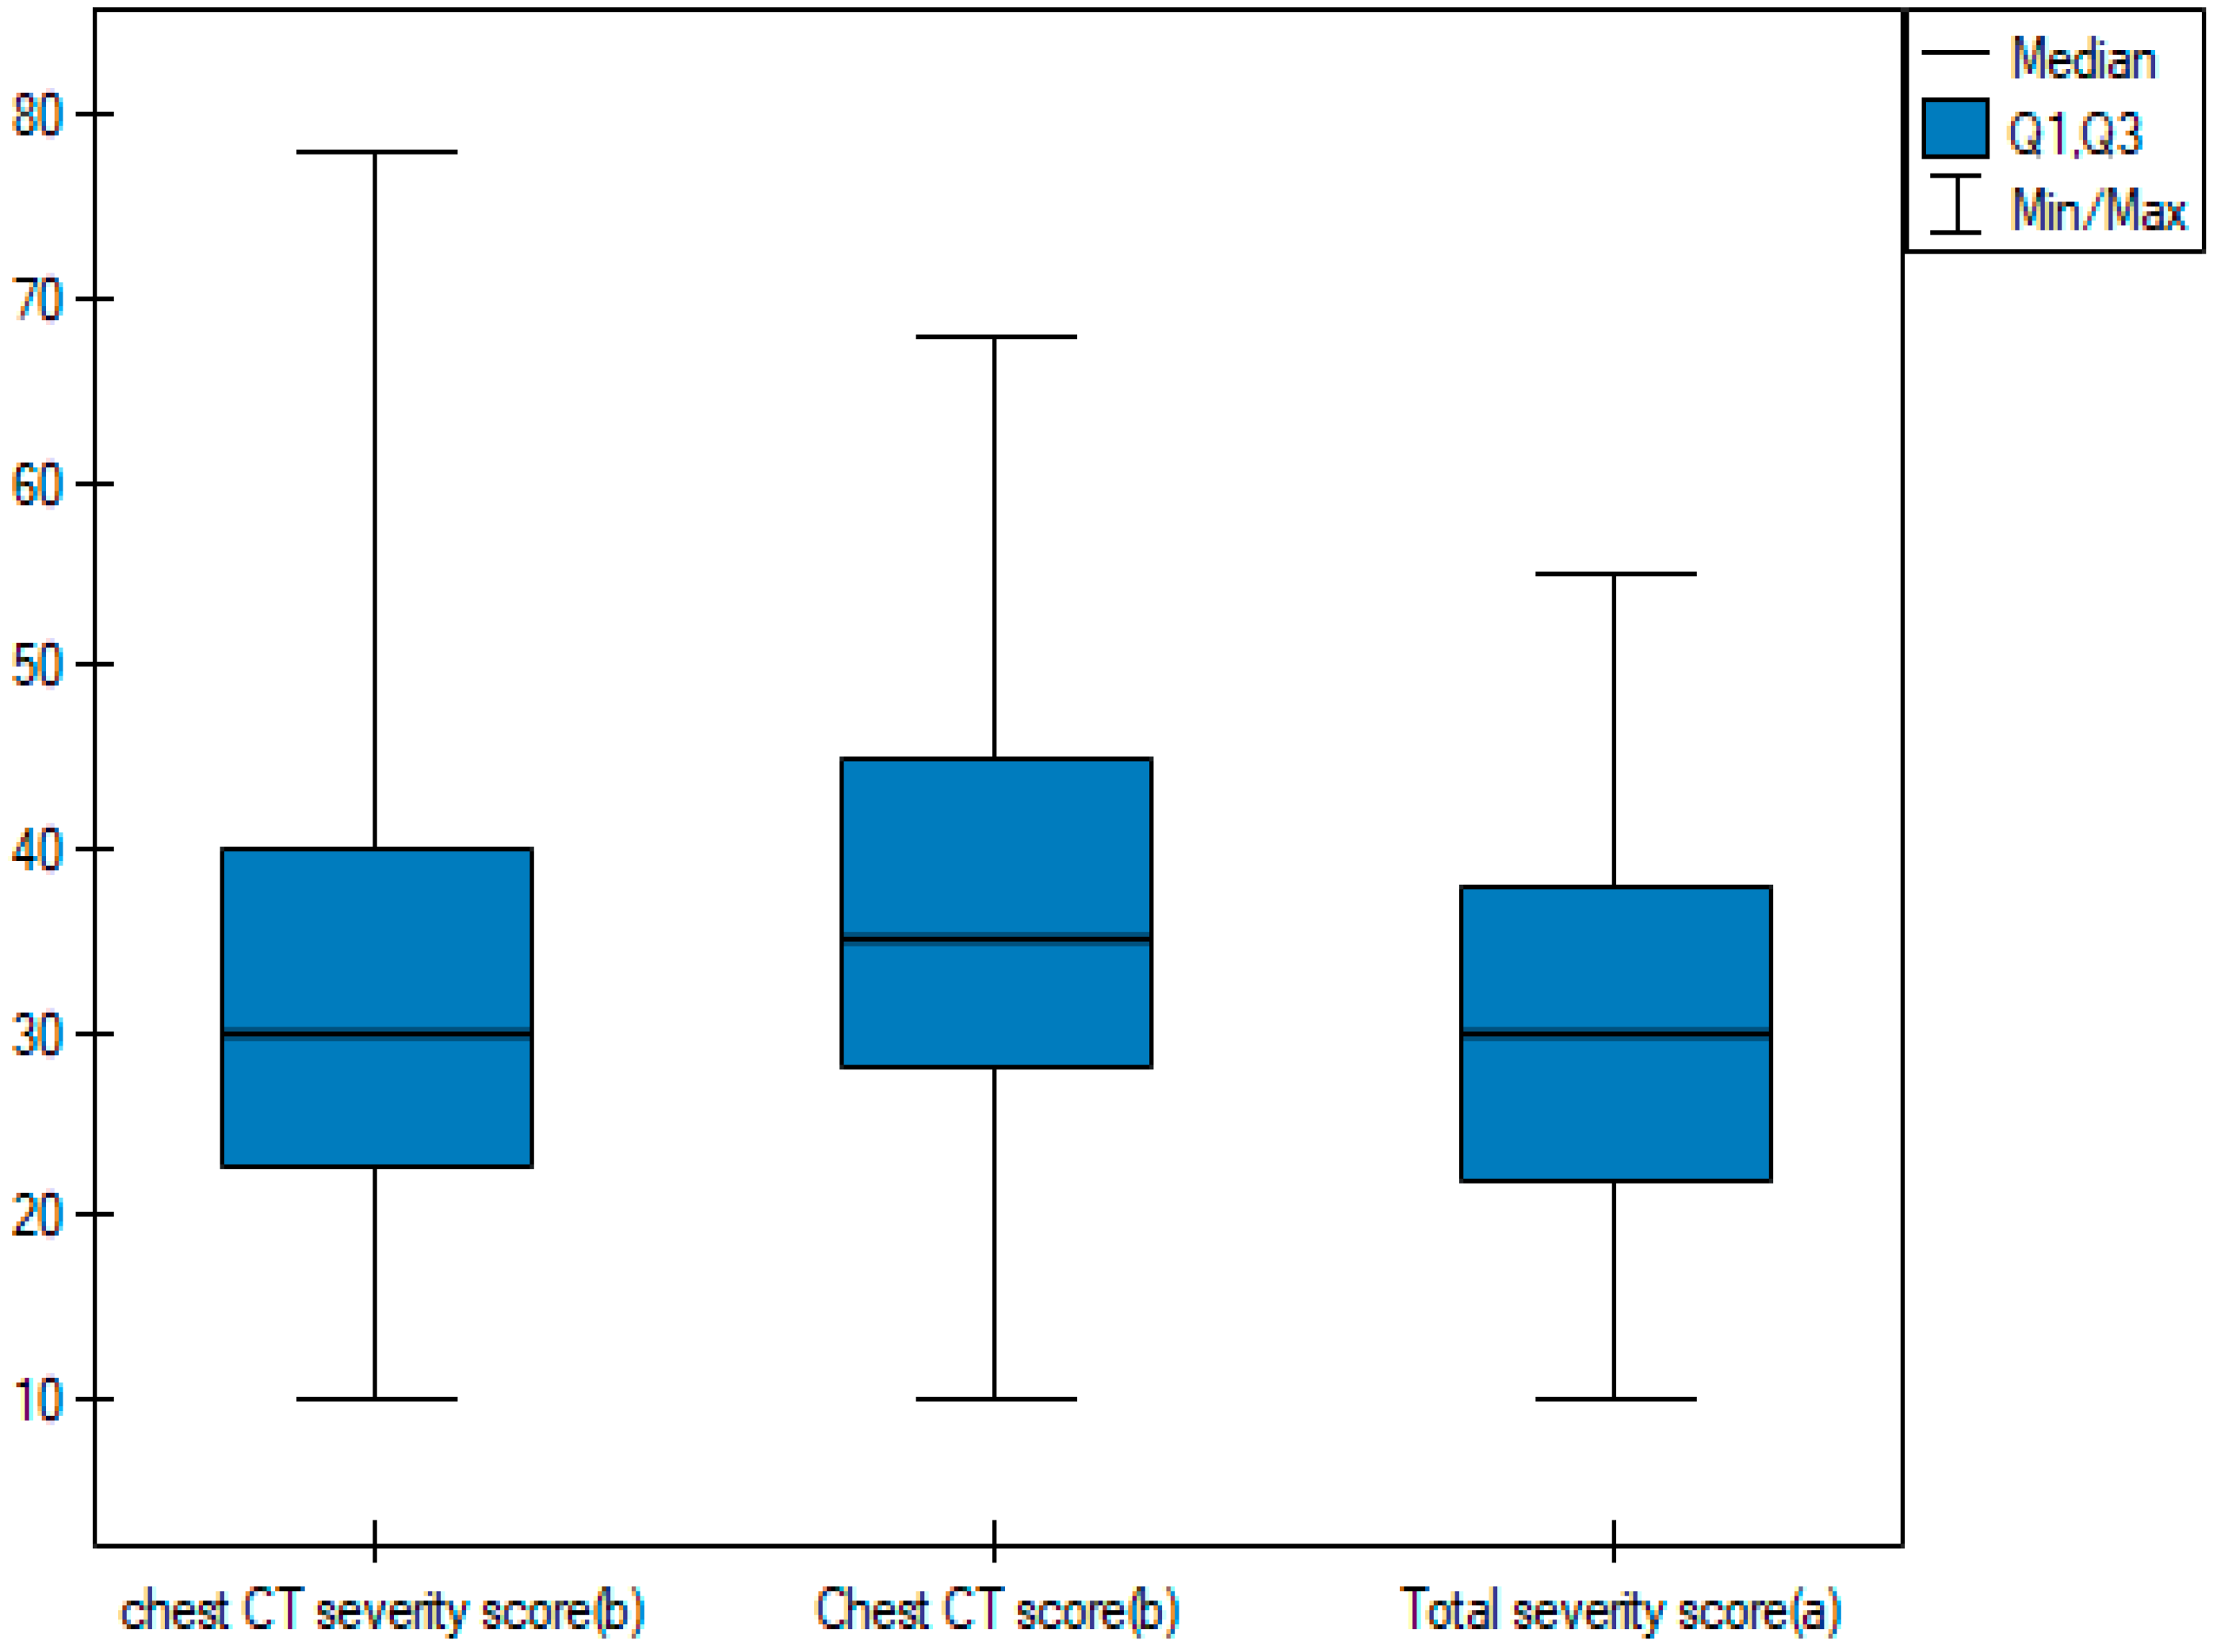
3.4. Time Consumption
4. Discussion
5. Conclusions
Author Contributions
Funding
Institutional Review Board Statement
Informed Consent Statement
Data Availability Statement
Conflicts of Interest
References
- Leung, C. Risk factors for predicting mortality in elderly patients with COVID-19: A review of clinical data in China. Mech. Ageing Dev. 2020, 188, 111255. [Google Scholar] [CrossRef]
- Tagliamento, M.; Agostinetto, E.; Bruzzone, M.; Ceppi, M.; Saini, K.S.; de Azambuja, E.; Punie, K.; Westphalen, C.B.; Morgan, G.; Pronzato, P.; et al. Mortality in adult patients with solid or hematological malignancies and SARS-CoV-2 infection with a specific focus on lung and breast cancers: A systematic review and meta-analysis. Crit. Rev. Oncol. Hematol. 2021, 163, 103365. [Google Scholar] [CrossRef]
- Mossa-Basha, M.; Meltzer, C.C.; Kim, D.C.; Tuite, M.J.; Kolli, K.P.; Tan, B.S. Radiology Department preparedness for COVID-19: Radiology Scientific Expert Panel. Radiology 2020, 296, E106–E112. [Google Scholar] [CrossRef]
- Cieszanowski, A.; Czekajska, E.; Giżycka, B.; Gruszczyńska, K.; Oronowicz-Jaśkowiak, A.S.; Podgórska, J.; Serafin, Z.; Szurowska, E.; Walecki, J. Indications for imaging studies in SARS-CoV-2 infected patients—Recommendations of the Polish Medical Society of Radiology. Pol. J. Radiol. 2022, 87, e63–e68. [Google Scholar] [CrossRef]
- Ai, T.; Yang, Z.; Hou, H.; Zhan, C.; Chen, C.; Lv, W.; Tao, Q.; Sun, Z.; Xia, L. Correlation of chest CT and RT-PCR testing in coronavirus disease 2019 (COVID-19) in China: A report of 1014 cases. Radiology 2020, 296, 200642. [Google Scholar] [CrossRef]
- Yang, R.; Li, X.; Liu, H.; Zhen, Y.; Zhang, X.; Xiong, Q.; Luo, Y.; Gao, C.; Zeng, W. Chest CT Severity Score: An Imaging Tool for Assessing Severe COVID-19. Radiol. Cardiothorac. Imaging 2020, 2, e200047. [Google Scholar] [CrossRef]
- Eshet, Y.; Avigdor, A.; Kedmi, M.; Tau, N. Imaging of Hematological Patients in the Era of COVID-19. Acta Haematol. 2022, 145, 267–274. [Google Scholar] [CrossRef]
- Flisiak, R.; Horban, A.; Jaroszewicz, J.; Kozielewicz, D.; Mastalerz-Migas, A.; Owczuk, R.; Parczewski, M.; Pawłowska, M.; Piekarska, A.; Simon, K.; et al. Management of SARS-CoV-2 infection: Recommendations of the Polish Association of Epidemiologists and Infectiologists as of April 26, 2021. Pol. Arch. Intern. Med. 2021, 131, 487–496. [Google Scholar] [CrossRef]
- Austin, J.H.; Muller, N.L.; Friedman, P.J.; Hansell, D.M.; Naidich, D.P.; Remy-Jardin, M.; Webb, W.R.; Zerhouni, E.A. Glossary of terms for CT of the lungs: Recommendations of the Nomenclature Committee of the Fleischner Society. Radiology 1996, 200, 327–331. [Google Scholar] [CrossRef]
- Pan, F.; Ye, T.; Sun, P.; Gui, S.; Liang, B.; Li, L.; Zheng, D.; Wang, J.; Hesketh, R.L.; Yang, L.; et al. Time course of lung changes on chest CT during recovery from 2019 novel coronavirus (COVID-19) pneumonia. Radiology 2020, 295, 715–721. [Google Scholar] [CrossRef]
- Francone, M.; Iafrate, F.; Masci, G.M.; Coco, S.; Cilia, F.; Manganaro, L.; Panebianco, V.; Andreoli, C.; Colaiacomo, M.C.; Zingaropoli, M.A.; et al. Chest CT score in COVID-19 patients: Correlation with disease severity and short-term prognosis. Eur. Radiol. 2020, 30, 6808–6817. [Google Scholar] [CrossRef]
- Li, K.; Fang, Y.; Li, W.; Pan, C.; Qin, P.; Zhong, Y.; Liu, X.; Huang, M.; Liao, Y.; Li, S. CT image visual quantitative evaluation and clinical classification of coronavirus disease (COVID-19). Eur. Radiol. 2020, 30, 4407–4416. [Google Scholar] [CrossRef]
- Wasilewski, P.G.; Mruk, B.; Mazur, S.; Półtorak-Szymczak, G.; Sklinda, K.; Walecki, J. COVID-19 severity scoring systems in radiological imaging—A review. Pol. J. Radiol. 2020, 85, e361. [Google Scholar] [CrossRef] [PubMed]
- Aziz-Ahari, A.; Keyhanian, M.; Mamishi, S.; Mahmoudi, S.; Bastani, E.E.; Asadi, F.; Khaleghi, M. Chest CT severity score: Assessment of COVID-19 severity and short-term prognosis in hospitalized Iranian patients. Wien. Med. Wochenschr. 2022, 172, 77–83. [Google Scholar] [CrossRef] [PubMed]
- Tharwat, S.; Saleh, G.A.; Saleh, M.; Mounir, A.M.; Abdelzaher, D.G.; Salah, A.M.; Nassar, M.K. Chest CT Total Severity Score on Admission to Predict In-Hospital Mortality in COVID-19 Patients with Acute and Chronic Renal Impairment. Diagnostics 2022, 12, 1529. [Google Scholar] [CrossRef]
- Cozzi, D.; Cavigli, E.; Moroni, C.; Smorchkova, O.; Zantonelli, G.; Pradella, S.; Miele, V. Ground-glass opacity (GGO): A review of the differential diagnosis in the era of COVID-19. Jpn. J. Radiol. 2021, 39, 721–732. [Google Scholar] [CrossRef] [PubMed]
- Zheng, Y.; Wang, L.; Ben, S. Meta-analysis of chest CT features of patients with COVID-19 pneumonia. J. Med. Virol. 2021, 93, 241–249. [Google Scholar] [CrossRef]
- Li, K.; Wu, J.; Wu, F.; Guo, D.; Chen, L.; Fang, Z.; Li, C. The Clinical and Chest CT Features Associated with Severe and Critical COVID-19 Pneumonia. Investig. Radiol. 2020, 55, 327–331. [Google Scholar] [CrossRef] [PubMed]
- Dilek, O.; Demirel, E.; Akkaya, H.; Belibagli, M.C.; Soker, G.; Gulek, B. Different chest CT scoring systems in patients with COVID-19: Could baseline CT be a helpful tool in predicting survival in patients with matched ages and co-morbid conditions? Acta Radiol. 2022, 63, 615–622. [Google Scholar] [CrossRef]
- Lai, A.G.; Pasea, L.; Banerjee, A.; Hall, G.; Denaxas, S.; Chang, W.H.; Katsoulis, M.; Williams, B.; Pillay, D.; Noursadeghi, M.; et al. Estimated Impact of the COVID-19 Pandemic on Cancer Services and Excess 1-Year Mortality in People with Cancer and Multimorbidity: Near Real-Time Data on Cancer Care, Cancer Deaths and a Population-Based Cohort Study. BMJ Open 2020, 10, e043828. [Google Scholar] [CrossRef]
- Ferrer, R. COVID-19 Pandemic: The Greatest Challenge in the History of Critical Care. Med. Intensiva 2020, 44, 323–324. [Google Scholar] [CrossRef] [PubMed]
- Rostami, M.; Mansouritorghabeh, H. D-dimer level in COVID-19 infection: A systematic review. Expert Rev. Hematol. 2020, 11, 1265–1275. [Google Scholar] [CrossRef]
- Tan, C.; Huang, Y.; Shi, F.; Tan, K.; Ma, Q.; Chen, Y.; Jiang, X.; Li, X. C-reactive protein correlates with CT findings and predicts severe COVID-19 early. J. Med. Virol. 2020, 92, 856–862. [Google Scholar] [CrossRef]
- Wang, C.; Horby, P.W.; Hayden, F.G.; Gao, G.F. A novel coronavirus outbreak of global health concern. Lancet 2020, 395, 470–473. [Google Scholar] [CrossRef] [PubMed]
- Bernheim, A.; Mei, X.; Huang, M.; Yang, Y.; Fayad, Z.A.; Zhang, N.; Diao, K.; Lin, B.; Zhu, X.; Li, K.; et al. ChestCTfindingsincoronavirusdisease-19 (COVID-19): Relationship to duration of infection. Radiology 2020, 295, 200463. [Google Scholar] [CrossRef] [PubMed]
- García-Suárez, J.; de la Cruz, J.; Cedillo, A.; Llamas, P.; Duarte, R.; Jiménez-Yuste, V.; Hernández-Rivas, J.Á.; Gil-Manso, R.; Kwon, M.; Sánchez-Godoy, P.; et al. Impact of hematologic malignancy and type of cancer therapy on COVID-19 severity and mortality: Lessons from a large population-based registry study. J. Hematol. Oncol. 2020, 13, 133. [Google Scholar] [CrossRef]
- Piñana, J.L.; Martino, R.; García-García, I.; Parody, R.; Morales, M.D.; Benzo, G.; Gómez-Catalan, I.; Coll, R.; De La Fuente, I.; Luna, A.; et al. Risk factors and outcome of COVID-19 in patients with hematological malignancies. Exp. Hematol. Oncol. 2020, 9, 21. [Google Scholar] [CrossRef]
- Passamonti, F.; Cattaneo, C.; Arcaini, L.; Bruna, R.; Cavo, M.; Merli, F.; Angelucci, E.; Krampera, M.; Cairoli, R.; Della Porta, M.G.; et al. Clinical characteristics and risk factors associated with COVID-19 severity in patients with hematological malignancies in Italy: A retrospective, multicentre, cohort study. Lancet Haematol. 2020, 7, e737–e745. [Google Scholar] [CrossRef]
- Di Lorenzo, G.; Buonerba, L.; Ingenito, C.; Crocetto, F.; Buonerba, C.; Libroia, A.; Sciarra, A.; Ragone, G.; Sanseverino, R.; Iaccarino, S.; et al. Clinical Characteristics of Metastatic Prostate Cancer Patients Infected with COVID-19 in South Italy. Oncology 2020, 98, 743–747. [Google Scholar] [CrossRef]
- Elmokadem, A.H.; Mounir, A.M.; Ramadan, Z.A.; Elsedeiq, M.; Saleh, G.A. Comparison of Chest CT Severity Scoring Systems for COVID-19. Eur. Radiol. 2022, 32, 3501–3512. [Google Scholar] [CrossRef]


| Characteristic | Total | Non-Severe COVID-19 | Severe COVID-19 | p Value |
|---|---|---|---|---|
| N | 50 | 28 | 22 | |
| Age [years] | 64.94 ± 17.45 | 61.32 ± 18.53 | 69.55 ± 15.16 | 0.096 U |
| Sex | 0.136 F | |||
| Male | 33 (66%) | 16 (57.14%) | 17 (77.27%) | |
| Female | 17 (34%) | 12 (42.86%) | 5 (22.73%) | |
| Mortality rate | 20 (40%) | 1 (3.57%) | 19 (86.36%) | <0.05 F |
| Associated comorbidities | 1.92 ± 1.44 | 1.61 ± 1.2 | 2.32 ± 1.64 | 0.1097 U |
| Arterial hypertension | 26 (52%) | 12 (42.86%) | 14 (63.64%) | 0.144 F |
| Diabetes | 9 (18%) | 2 (7.14%) | 7 (31.82%) | 0.024 F |
| Liver disease | 5 (10%) | 2 (7.14%) | 3 (13.64%) | 0.447 F |
| Hyperlipidemia | 18 (36%) | 9 (32.14%) | 9 (40.91%) | 0.522 F |
| Heart disease | 23 (46%) | 14 (50%) | 9 (40.91%) | 0.522 F |
| Kidney disease | 15 (30%) | 6 (21.43%) | 9 (40.91%) | 0.136 F |
| Blood pressure | ||||
| Systolic pressure [mmHg] | 120.22 ± 18.64 | 118.86 ± 16.19 | 121.95 ± 21.64 | 0.565 t |
| Systolic blood pressure out of the norm | 4 (8%) | 2 (7.14%) | 2 (9.09%) | 0.801 F |
| Diastolic pressure [mmHg] | 71.16 ± 11.14 | 72.25 ± 10.51 | 69.77 ± 12 | 0.441 t |
| Diastolic blood pressure out of the norm | 4 (8%) | 2 (7.14%) | 2 (9.09%) | 0.801 F |
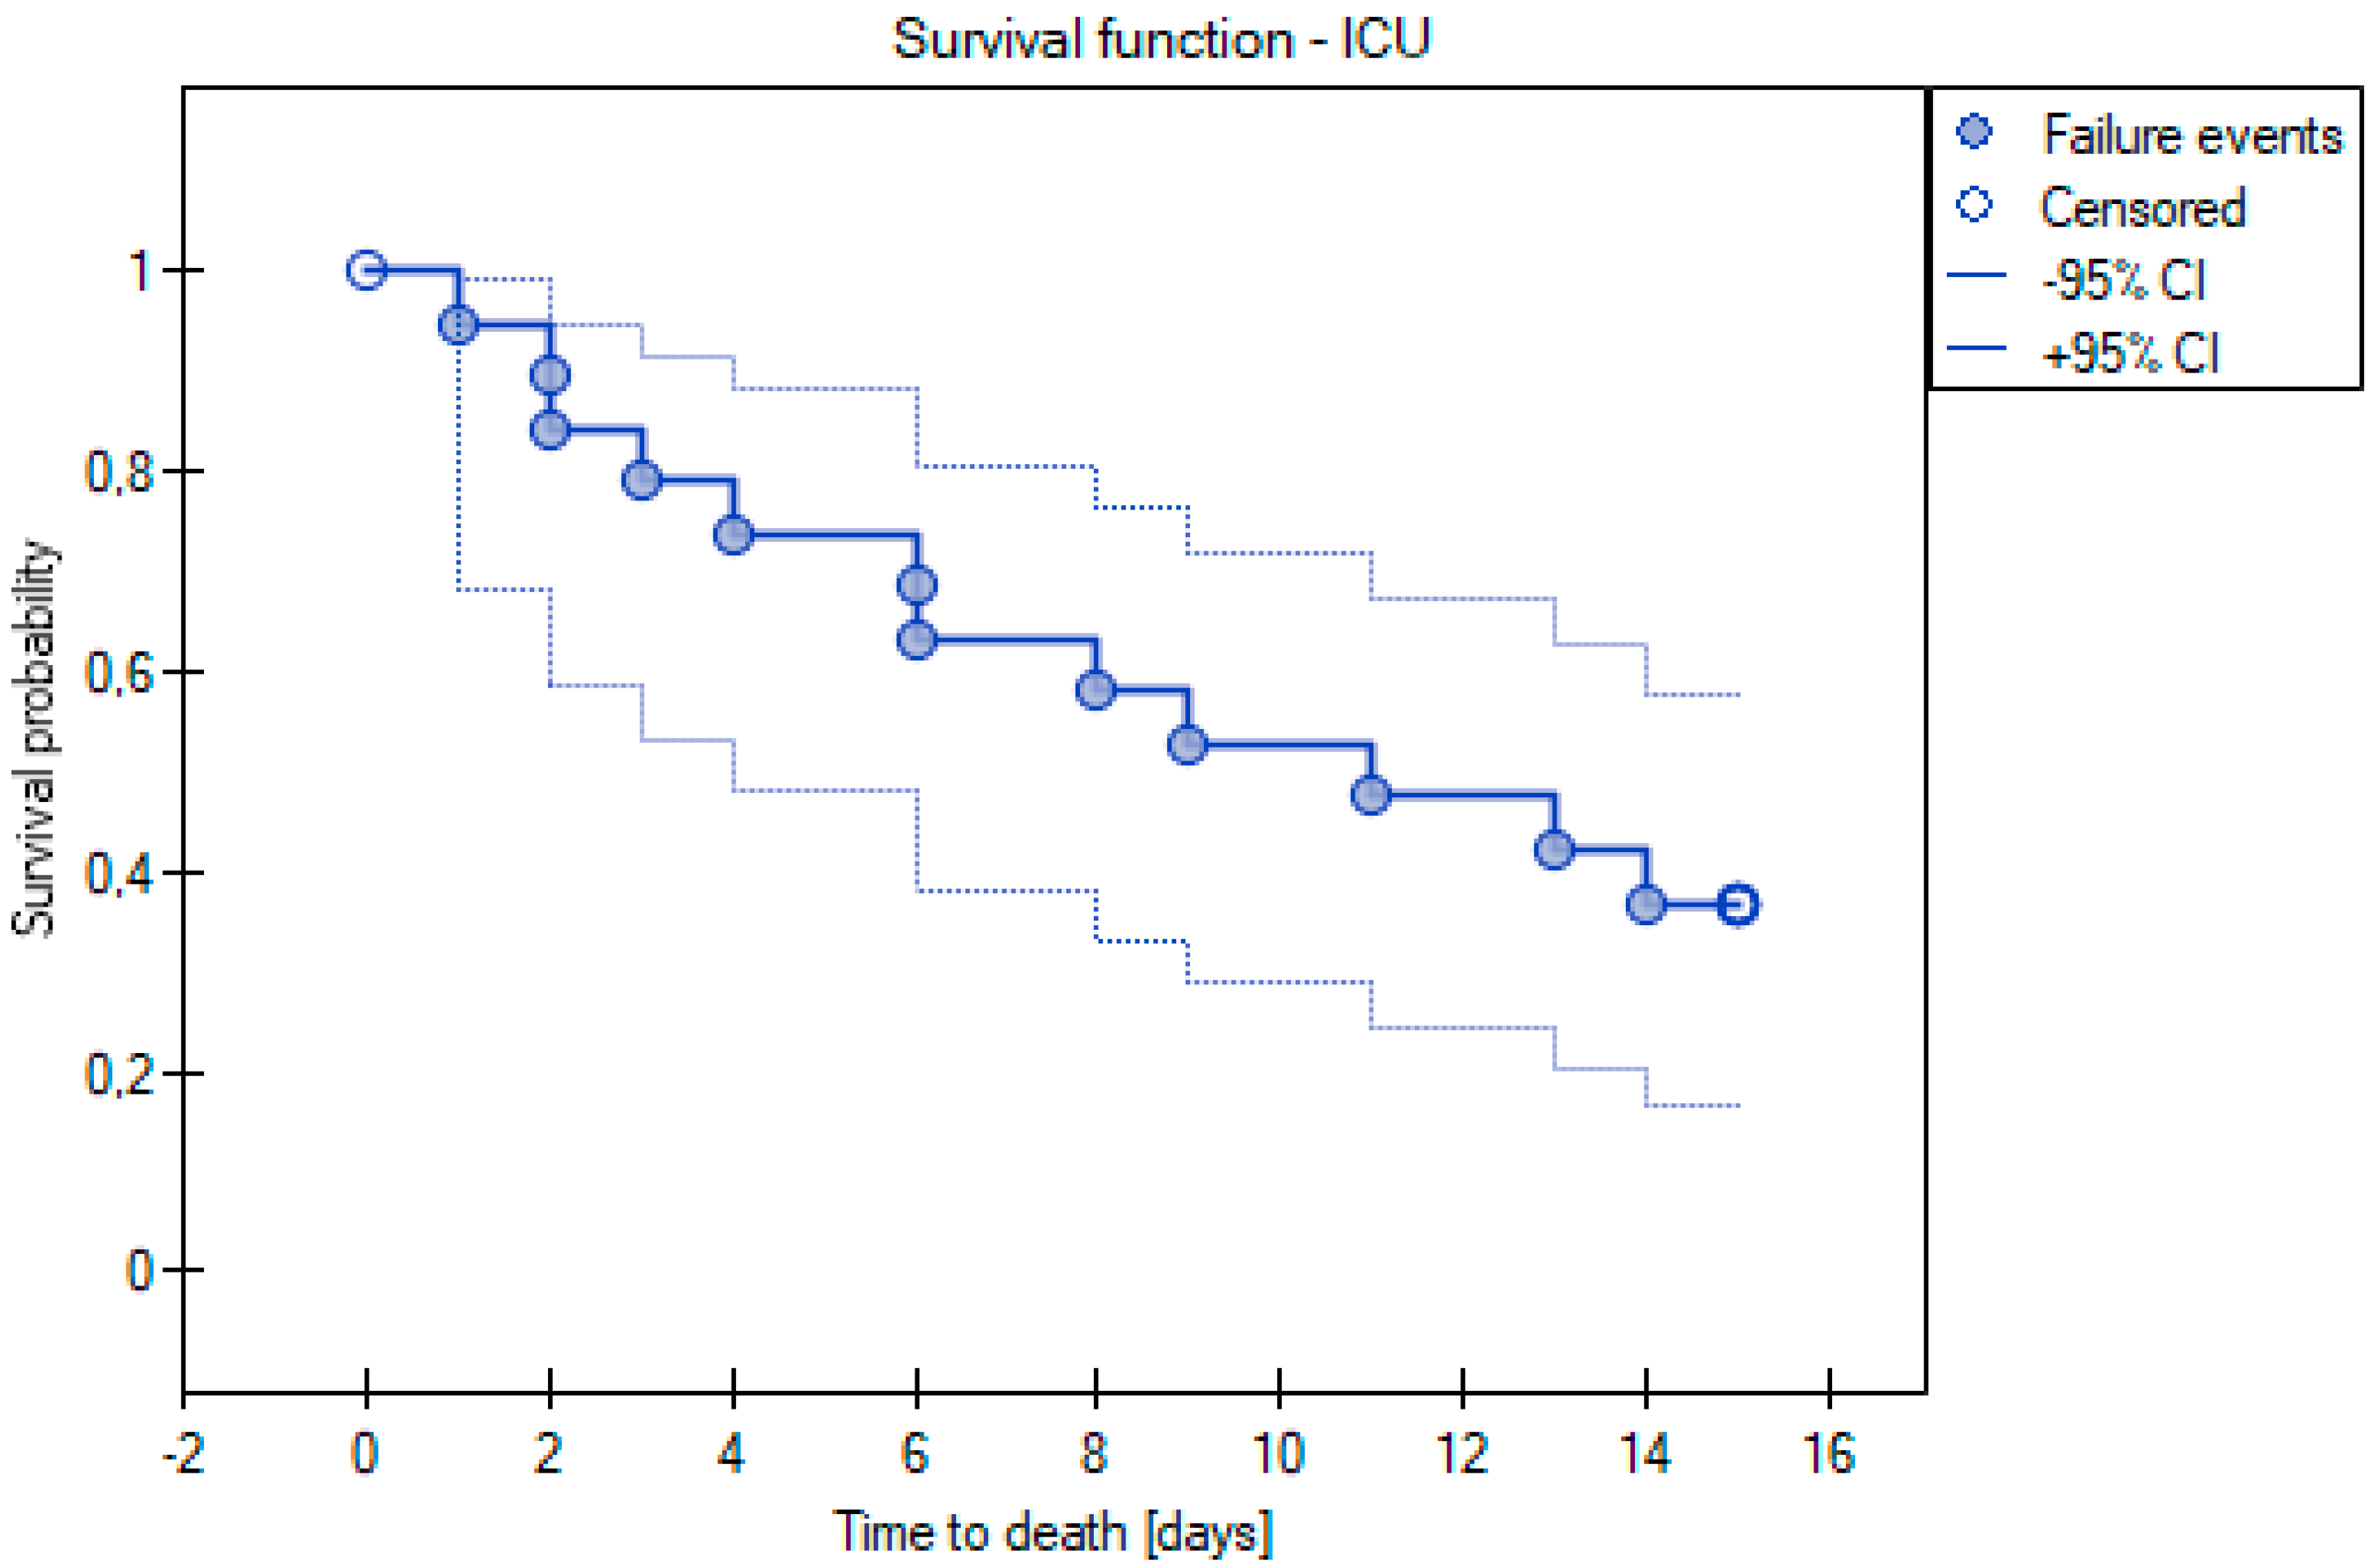
| Admitted to ICU | 19 (38%) | 3 (10.71%) | 16 (72.73%) | <0.05 F |
| Ventilated by a mask with high oxygen volumes | 21 (42%) | 2 (7.14%) | 19 (86.36%) | <0.05 F |
| Intubated | 13 (26%) | 1 (3.57%) | 12 (54.55%) | <0.05 F |
| Saturation [%] | 89.04 ± 13.72 | 94.11 ± 7.96 | 82.59 ± 16.72 | 0.001 U |
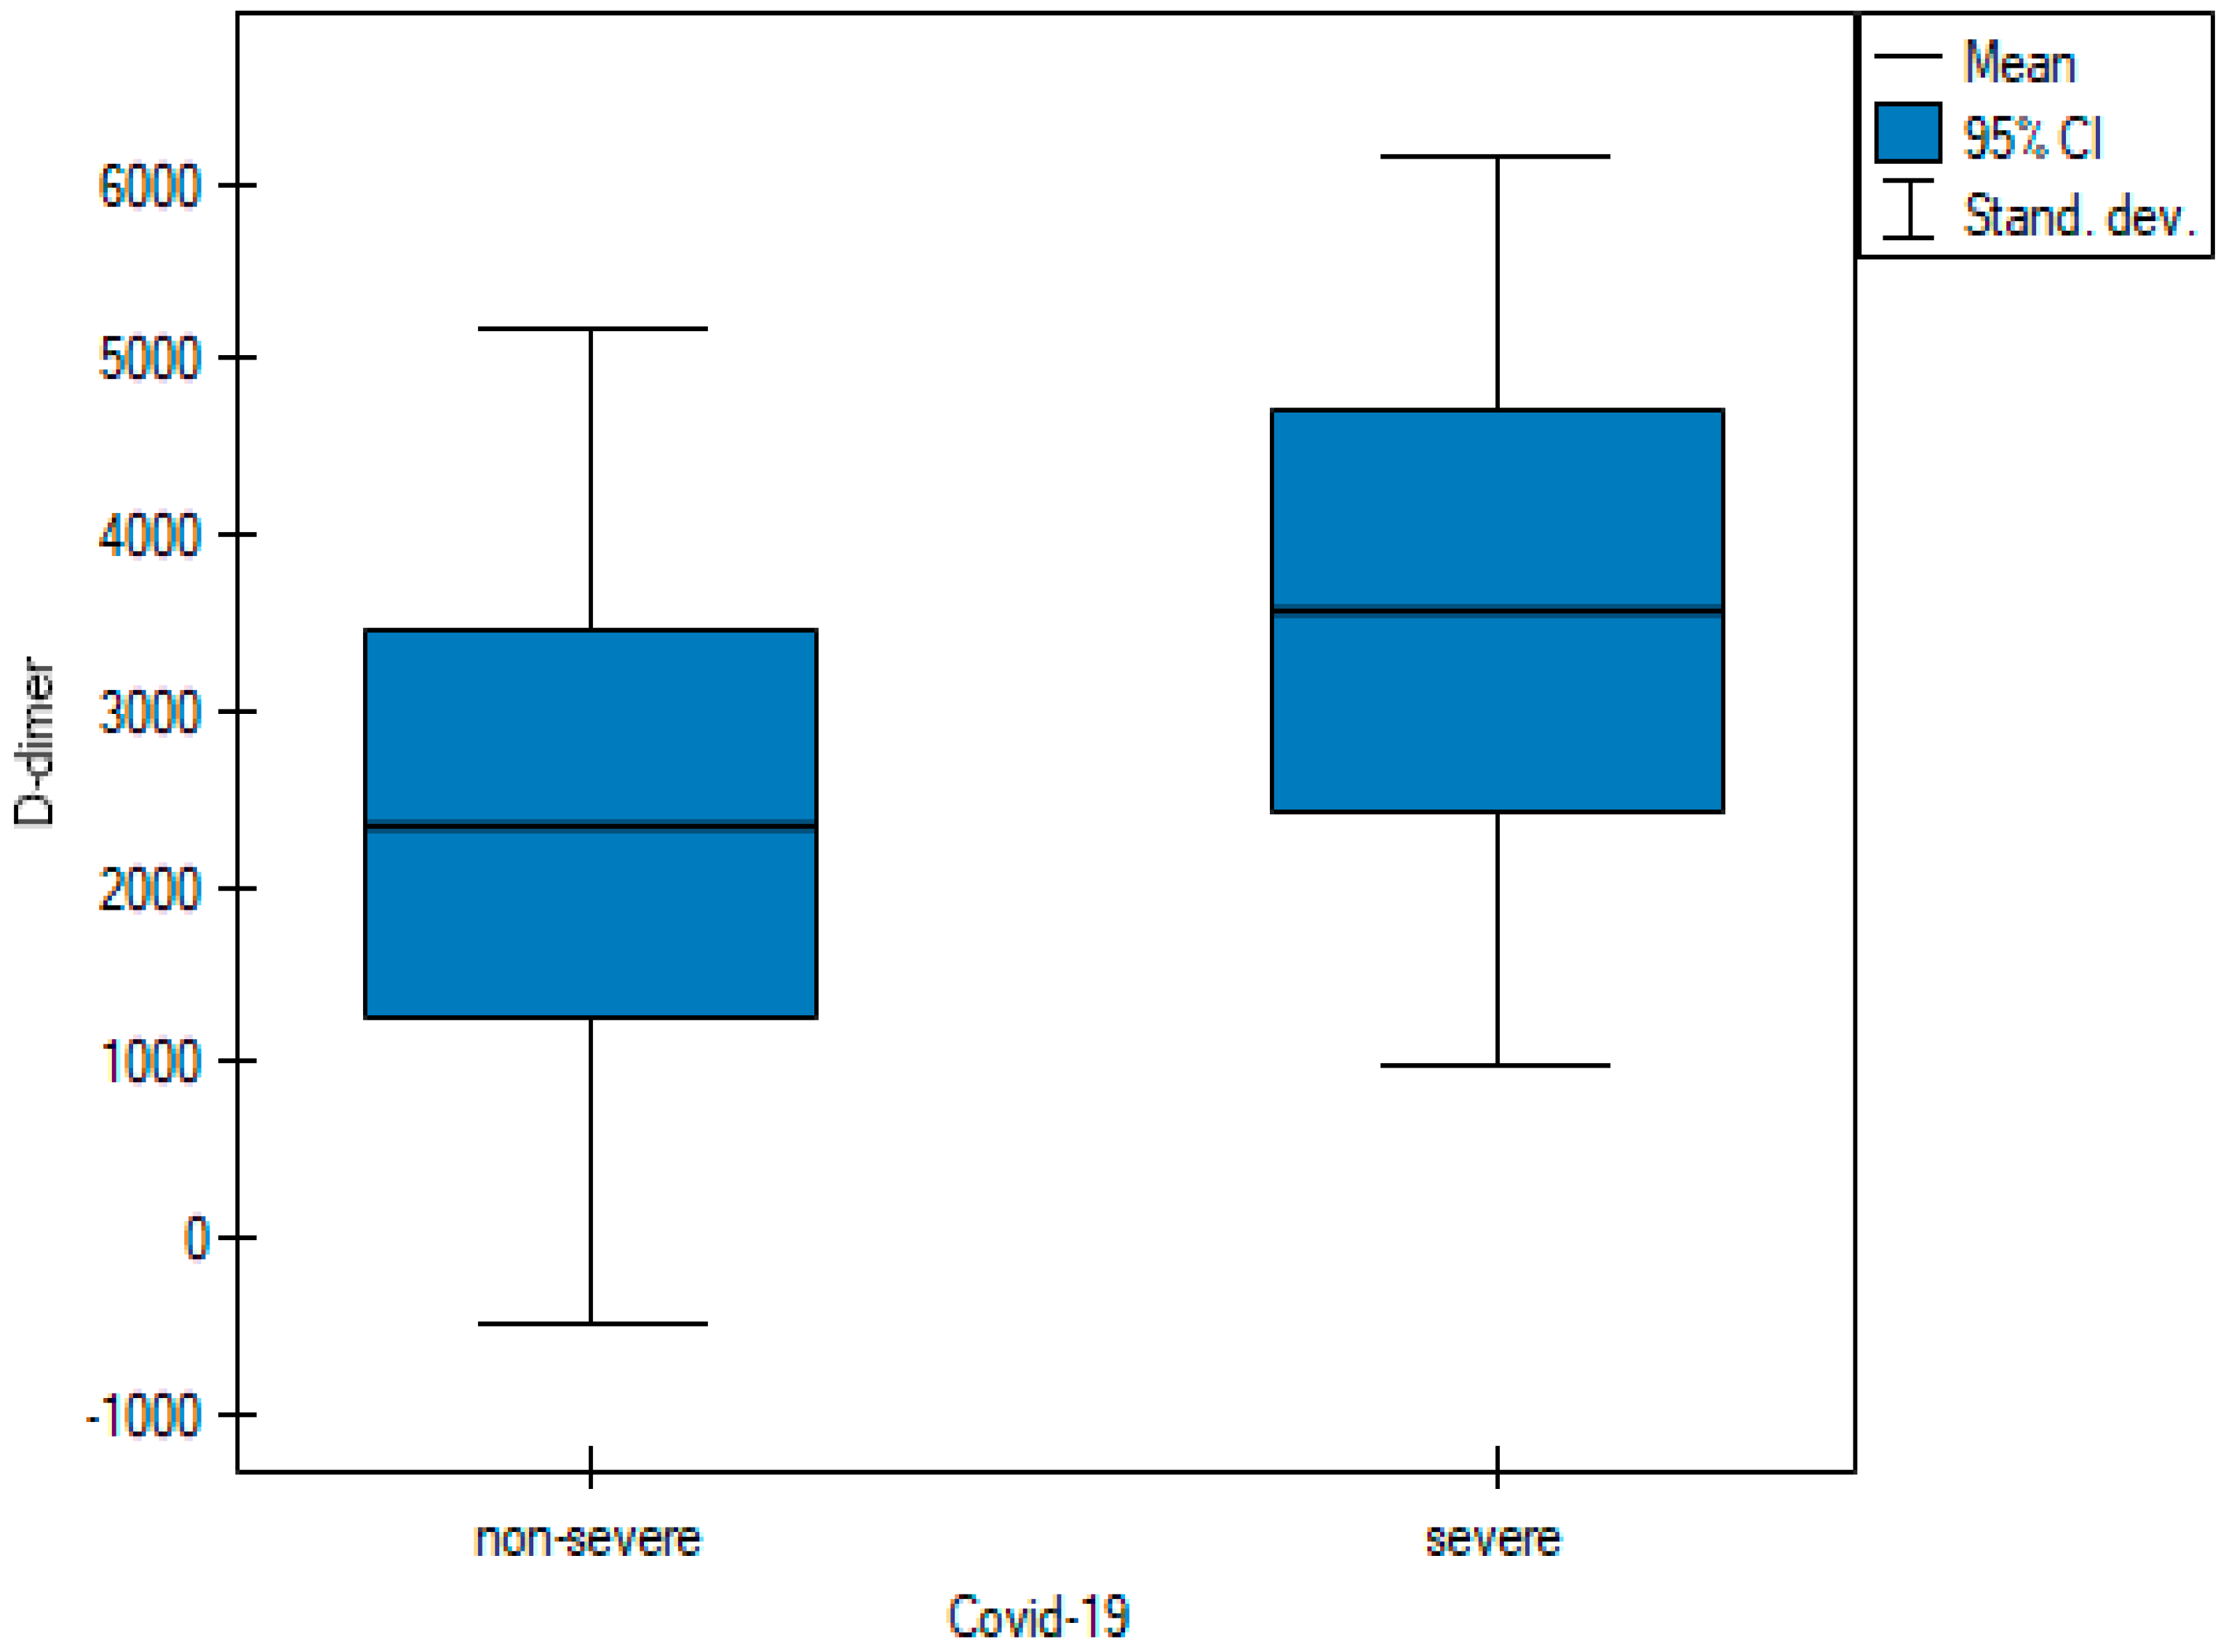
| D-dimer [μg/L] | 2882.42 ± 2771.56 | 2348.39 ± 2836.64 | 3562.09 ± 2591.12 | 0.005 U |
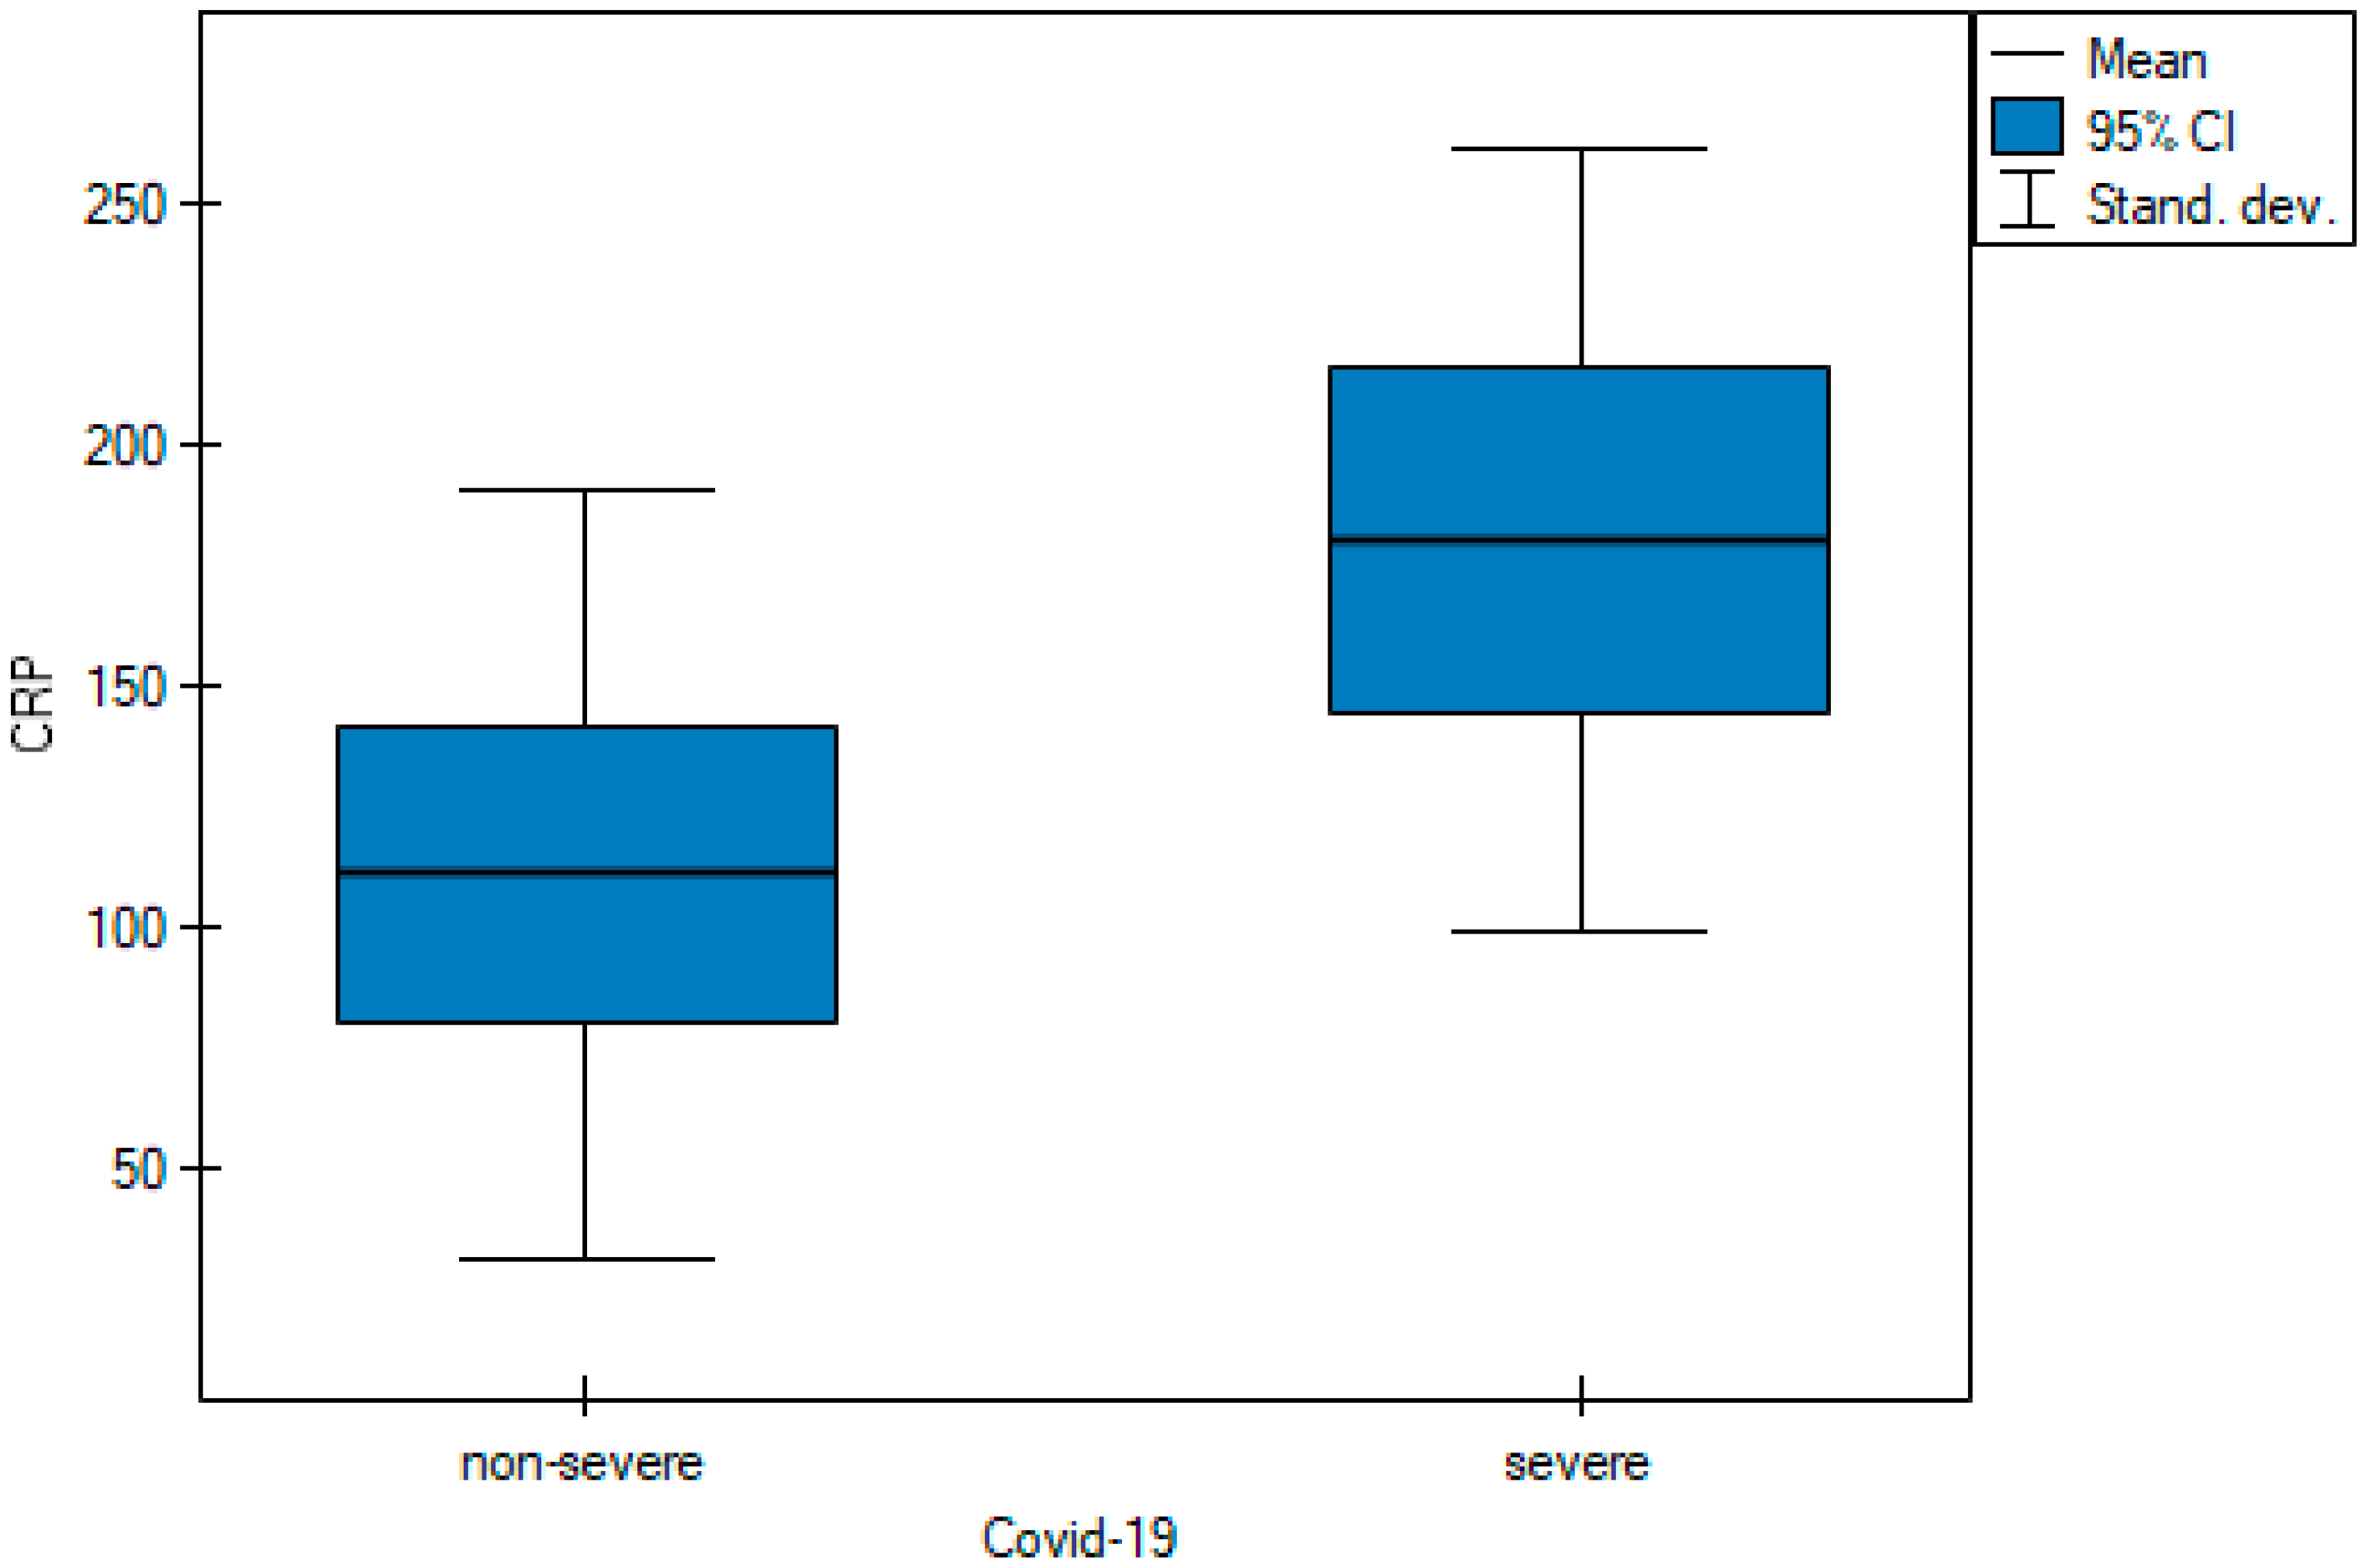
| CRP, C Reactive Protein [mg/L] | 141.58 ± 86.98 | 111.04 ± 79.96 | 180.45 ± 81.27 | 0.004 t |
| WBC, White blood cell count [tys/mm3] | 8.69 ± 11.34 | 9 ± 11.8 | 8.3 ± 10.99 | 0.71032 U |
| Neutrophil [tys/μL] | 3.9516 ± 5.79 | 5.17 ± 7.21 | 2.4 ± 2.61 | 0.186734 U |
| Category | Fleiss’ Kappa (κ) | 95% CI | SE | p Value |
|---|---|---|---|---|
| Overall | 1 | 0.796–1 | 0.104 | <0.001 |
| Nomal lungs | 1 | 0.723–1 | 0.141 | <0.001 |
| Ground glass opacities | 1 | 0.723–1 | 0.141 | <0.001 |
| Crazy paving | 1 | 0.723–1 | 0.141 | <0.001 |
| Consolidations | 1 | 0.723–1 | 0.141 | <0.001 |
| Scoring System | ICC | 95% CI | p Value |
|---|---|---|---|
| Chest CT severity score | 0.994 | 0.99–0.997 | <0.001 |
| Chest CT score | 0.994 | 0.99–0.997 | <0.001 |
| Total severity score | 0.992 | 0.987–0.996 | <0.001 |
| Scoring System | Range | Sensitivity | Specificity | Cutoff Value | AUC | p Value |
|---|---|---|---|---|---|---|
| Chest CT severity score | 0–40 | 72.7% | 98.2% | ≥14 | 0.902 | <0.001 |
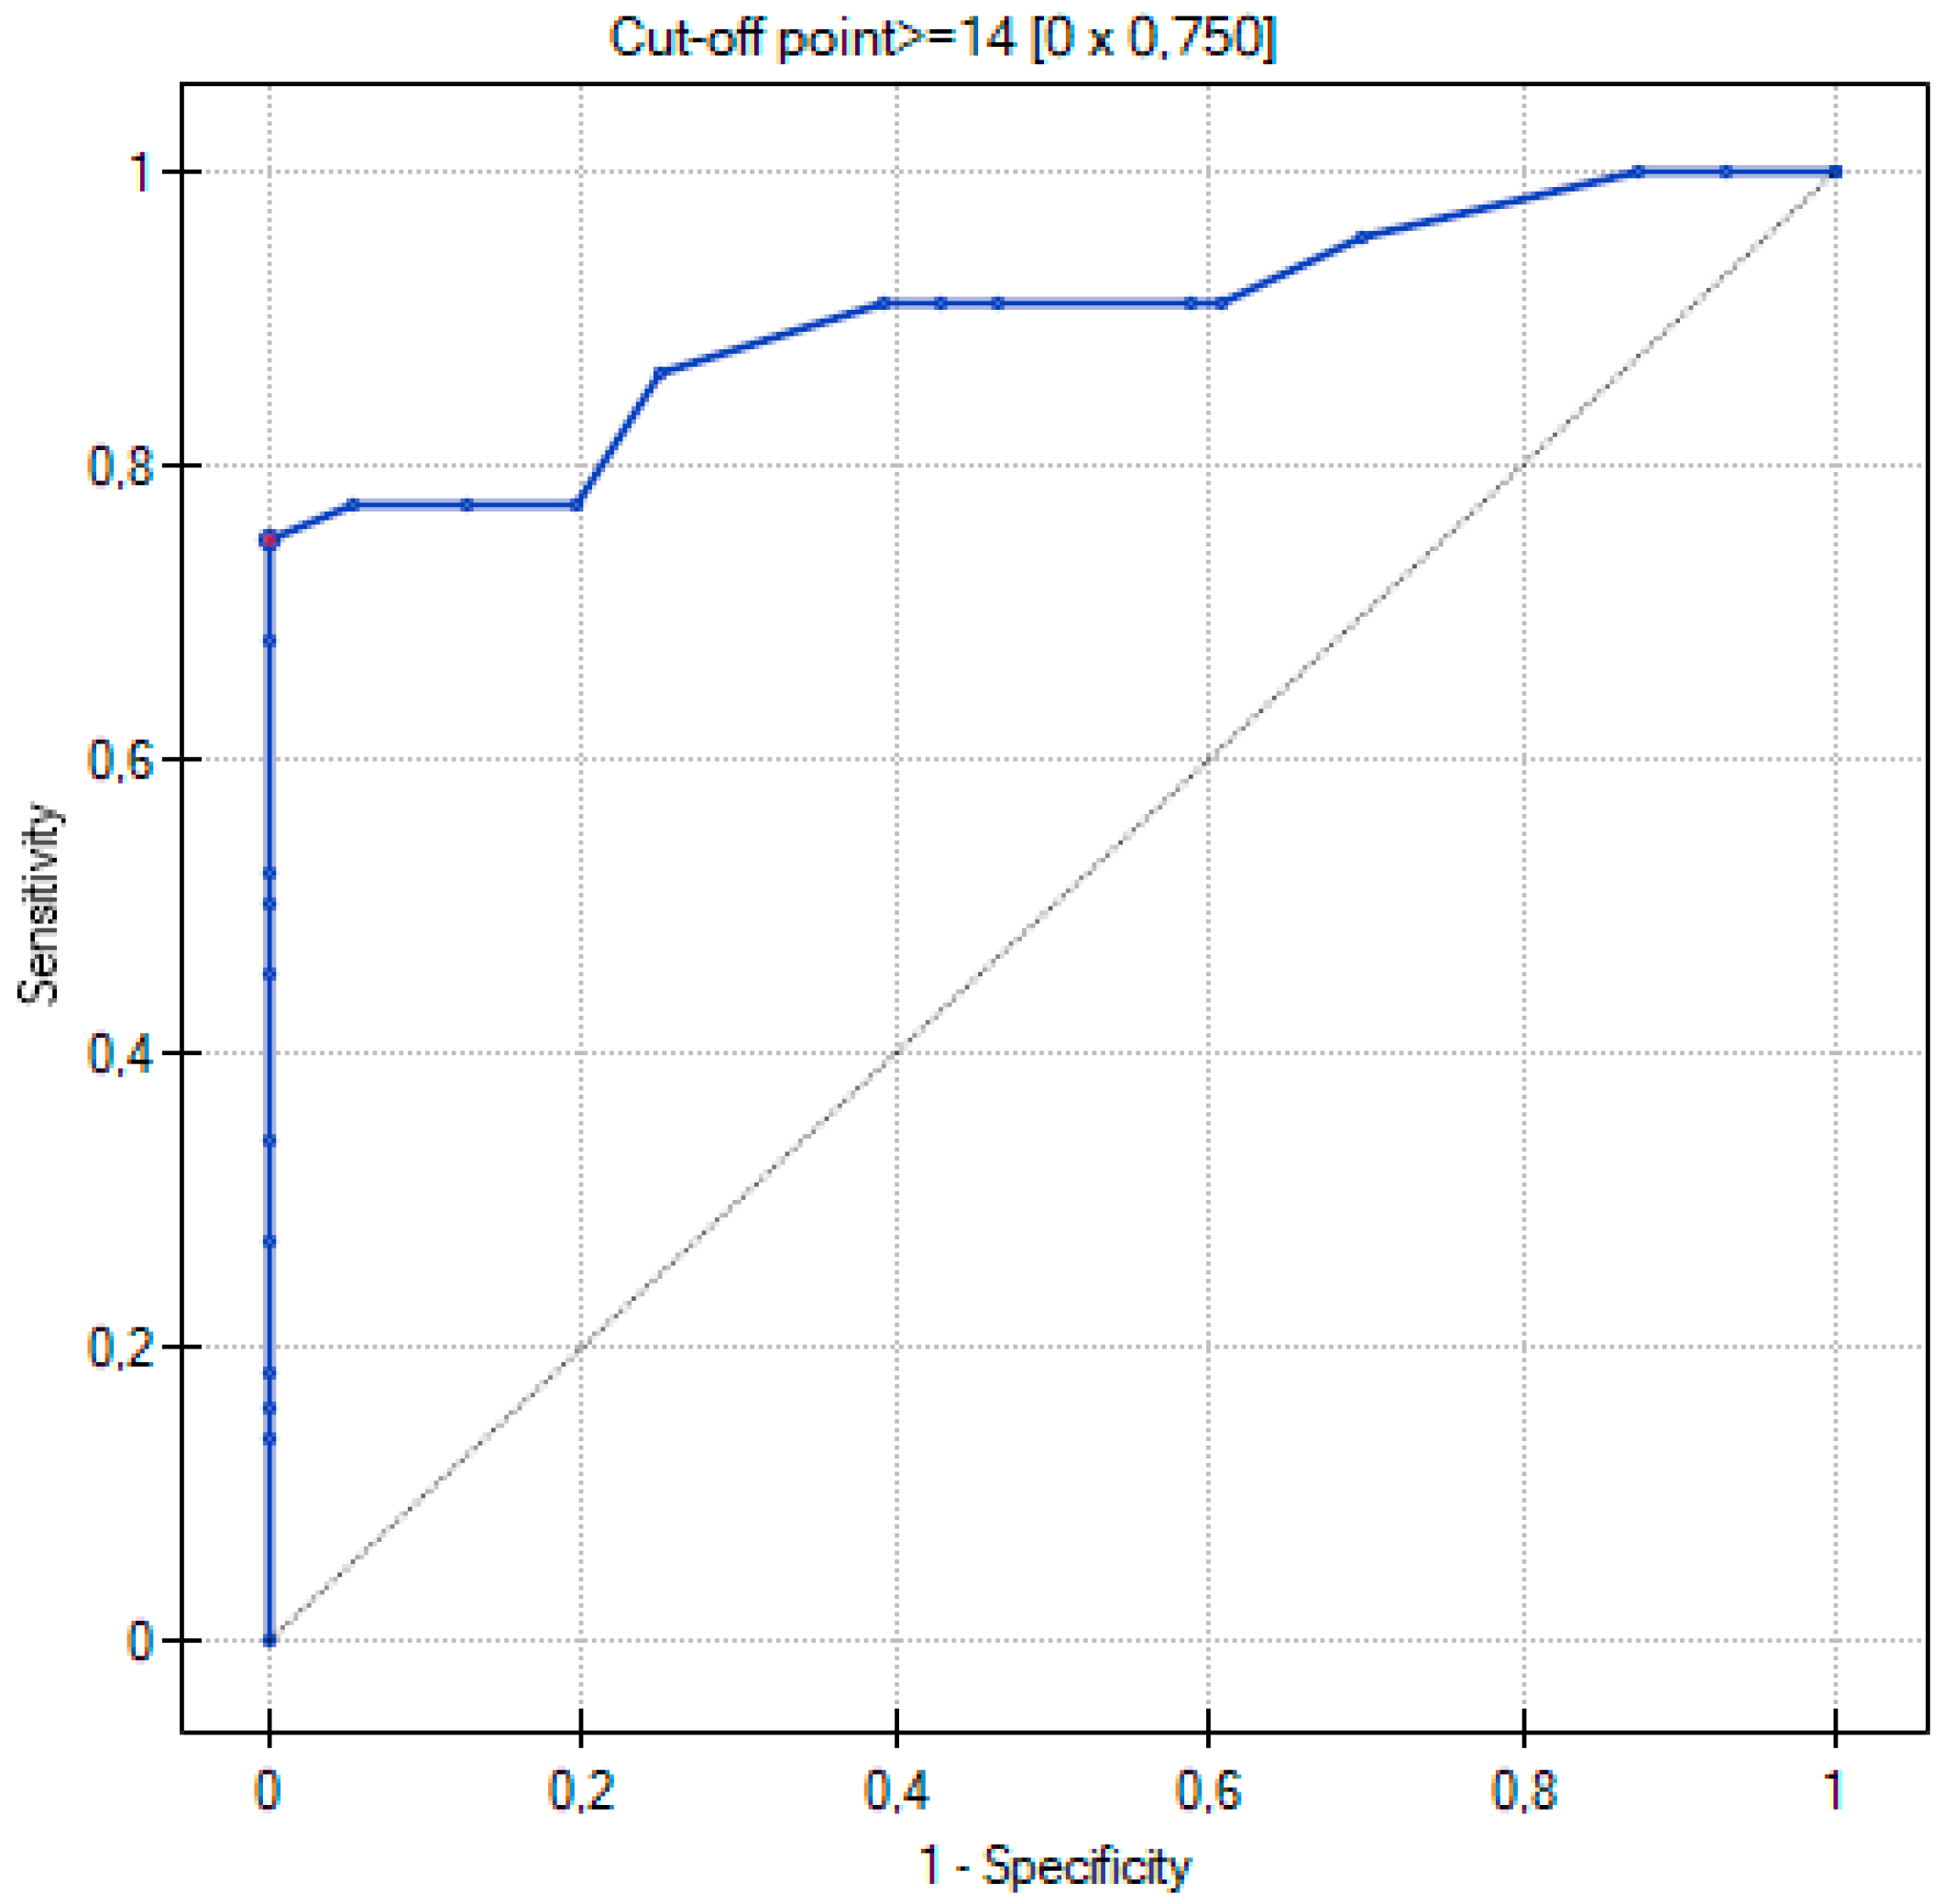
| Chest CT score | 0–25 | 75% | 100% | ≥14 | 0.899 | <0.001 |
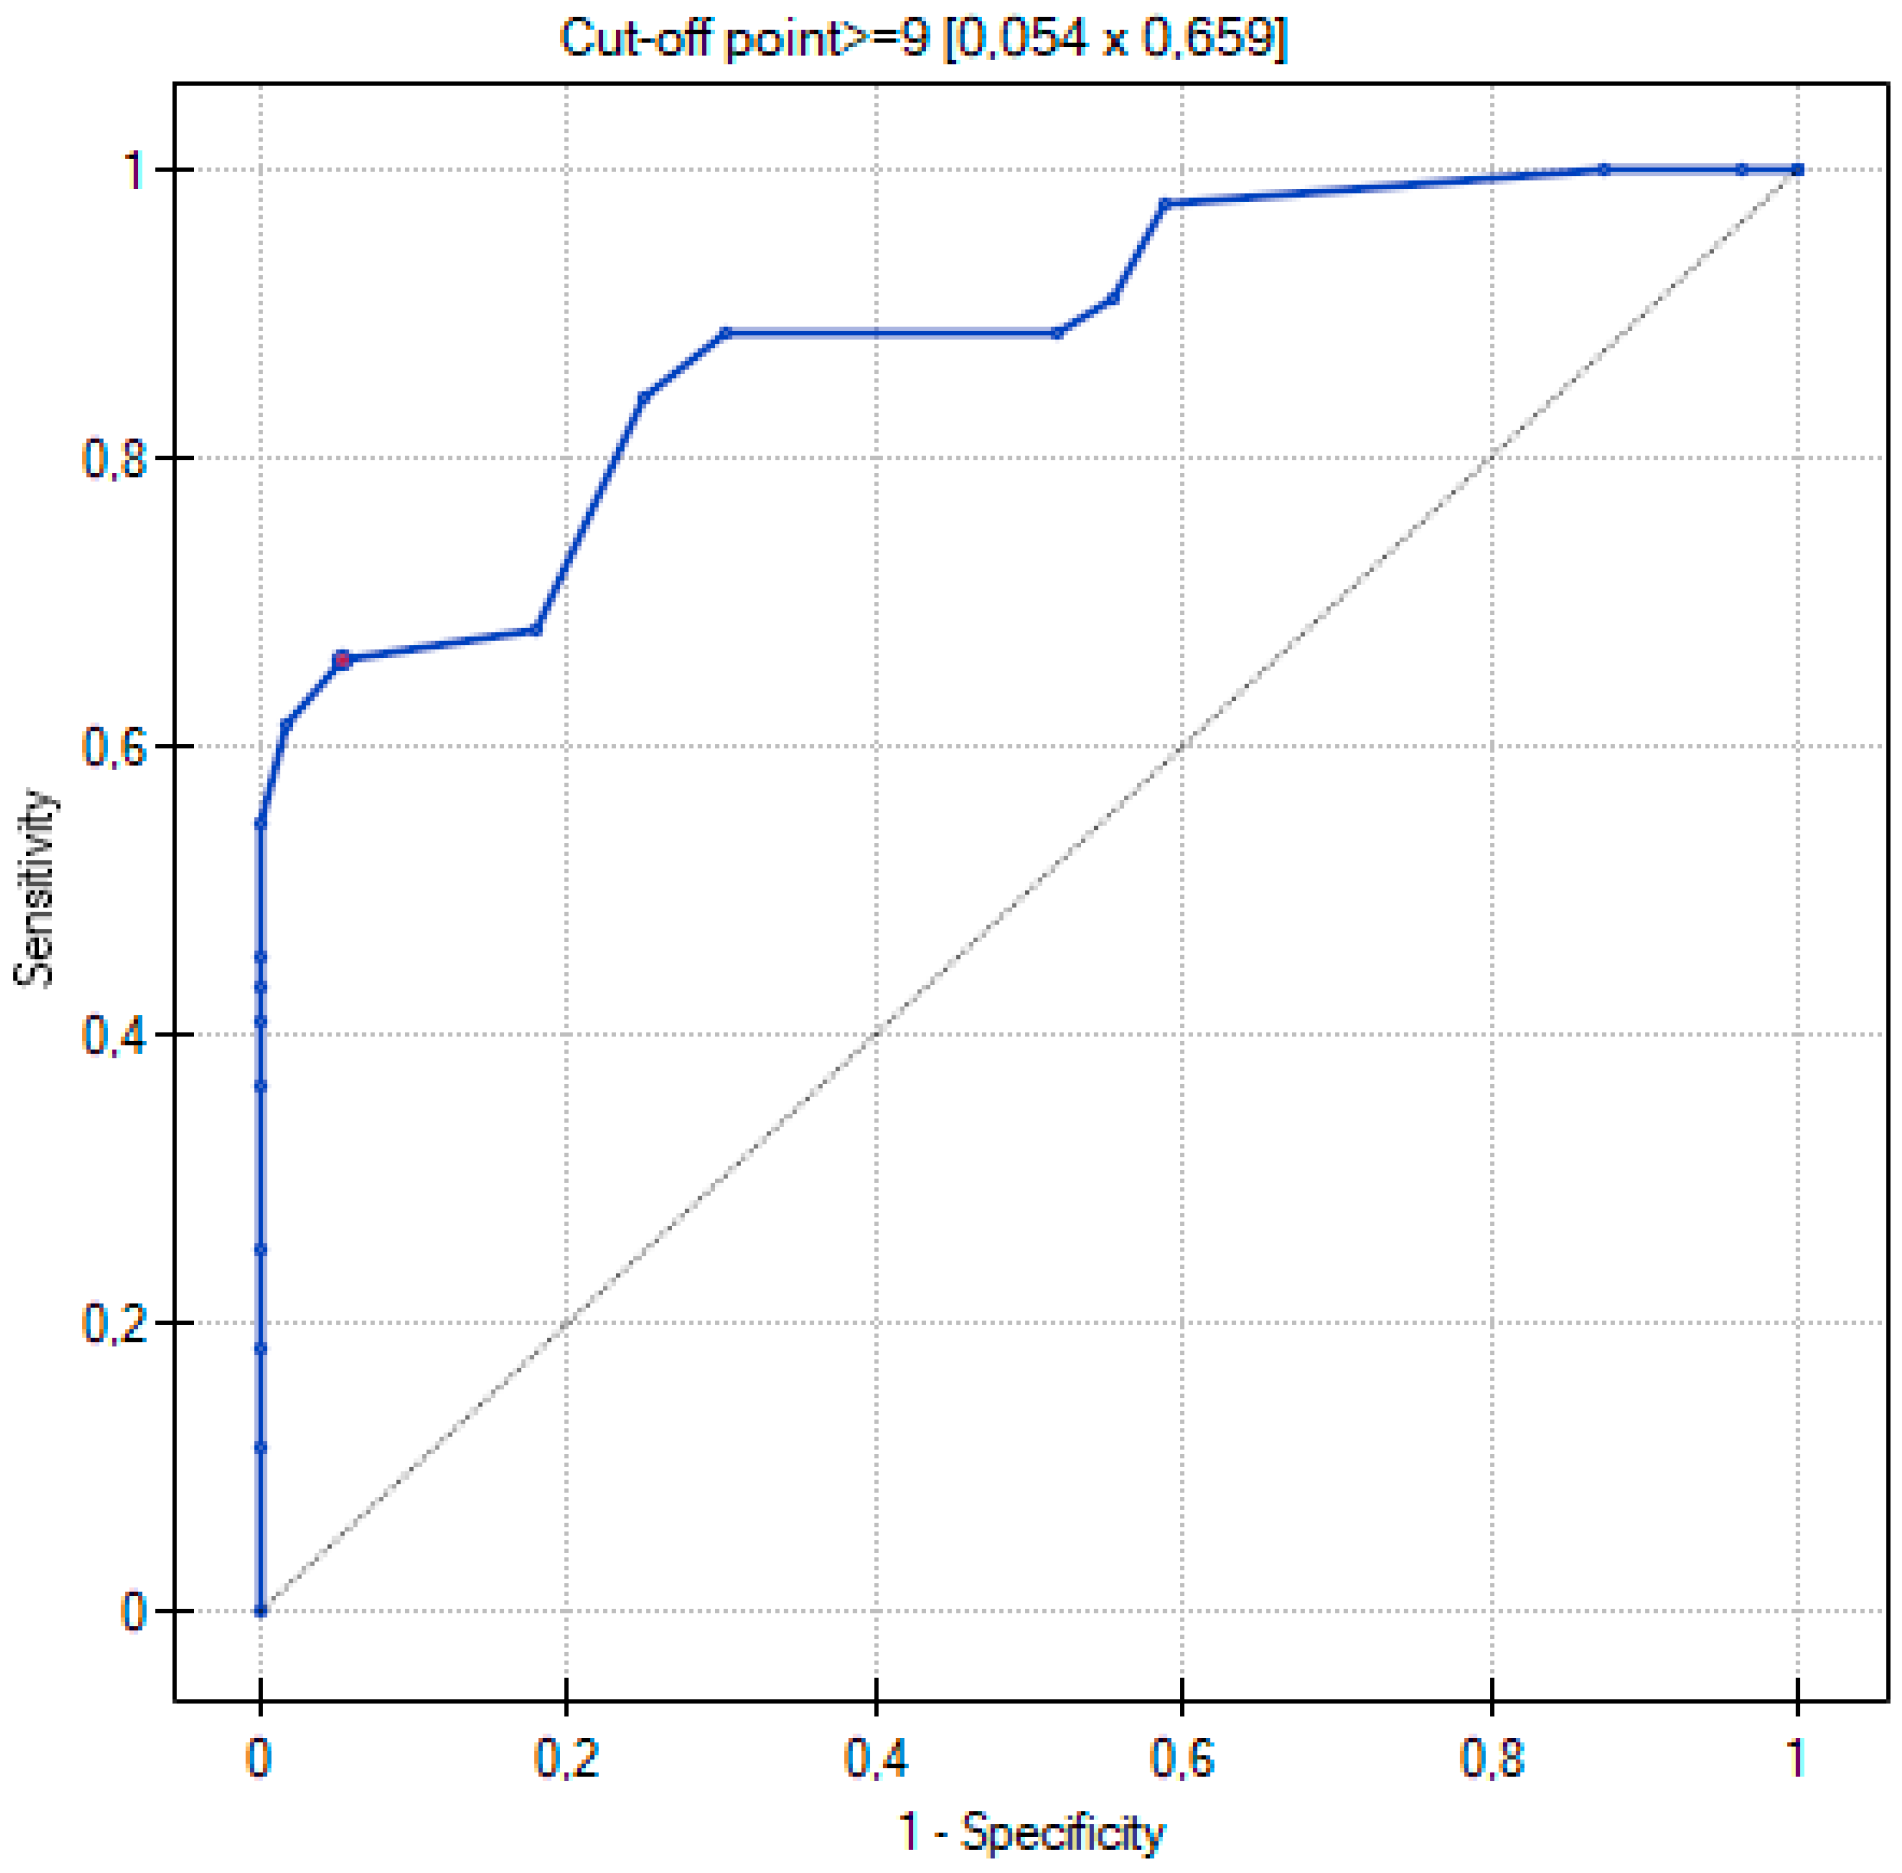
| Total severity score | 0–20 | 65.9% | 94.6% | ≥9 | 0.881 | <0.001 |
| Characteristic | Total | Non-Severe COVID-19 | Severe COVID-19 | p Value |
|---|---|---|---|---|
| Chest CT severity score | 11.6 ± 10.78 | 5.02 ± 4.53 | 19.98 ± 10.64 | <0.05 t |
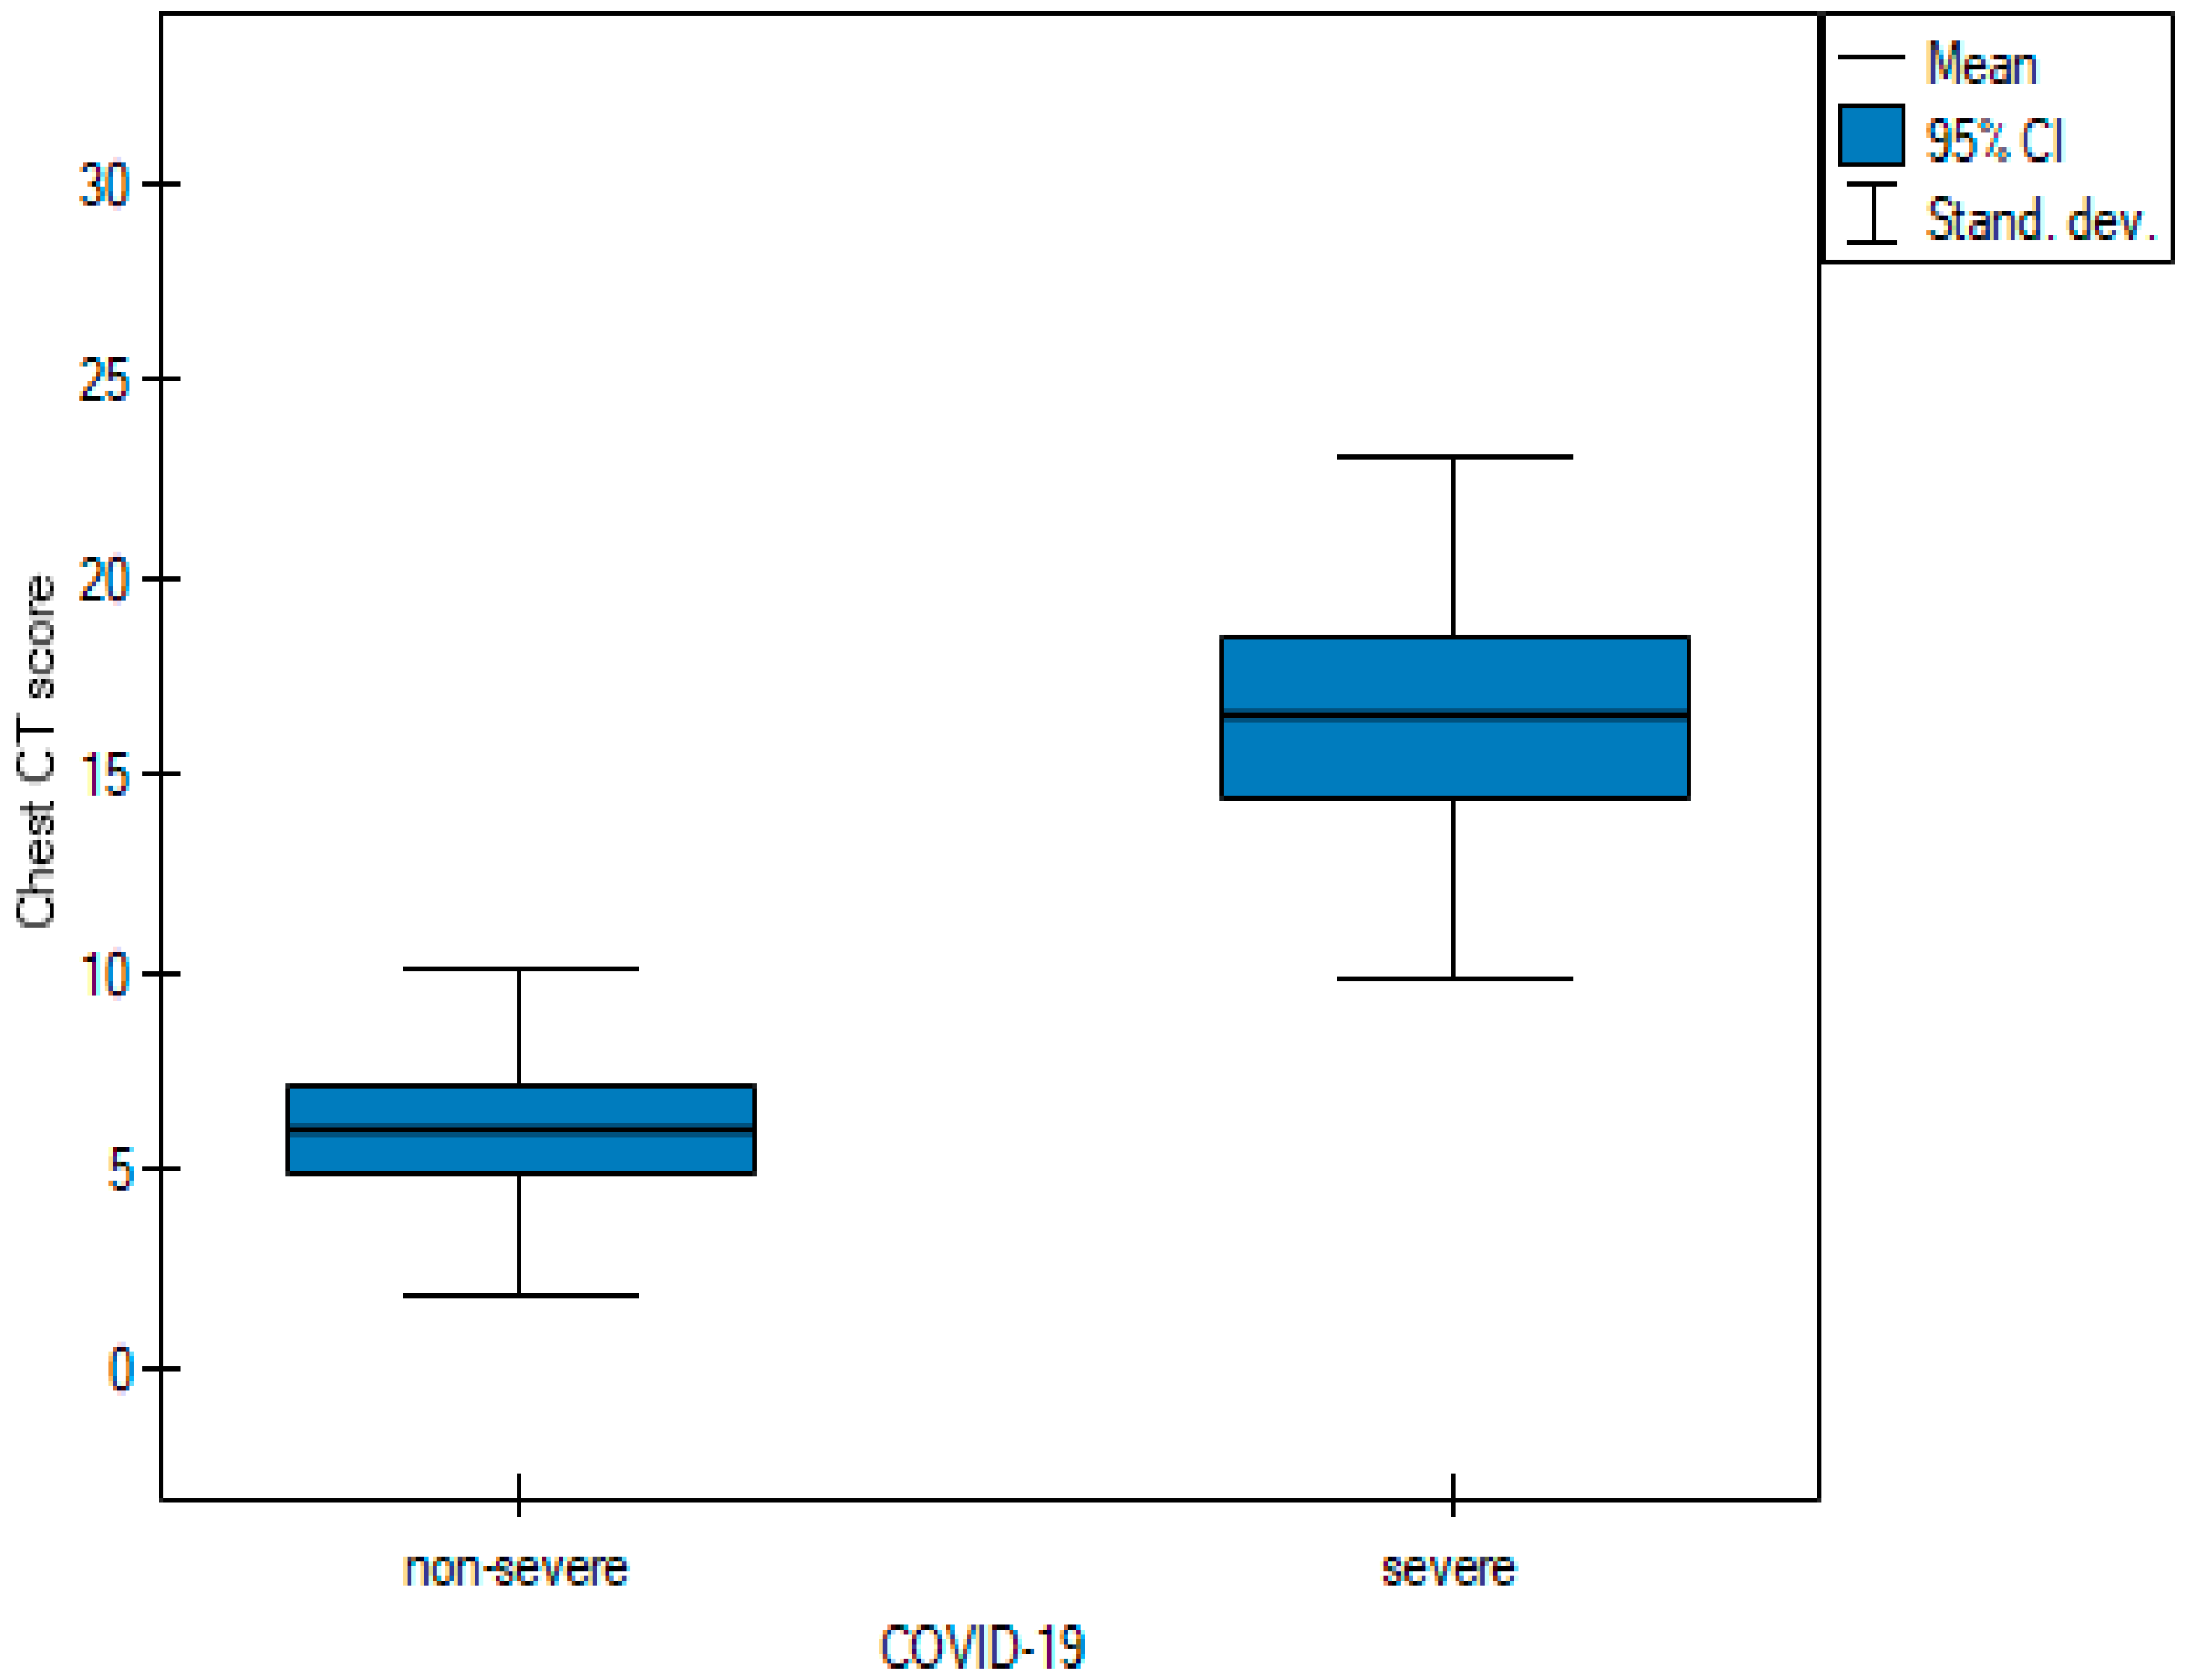
| Chest CT score | 10.62 ± 7.49 | 6 ± 4.15 | 16.5 ± 6.63 | <0.05 t |
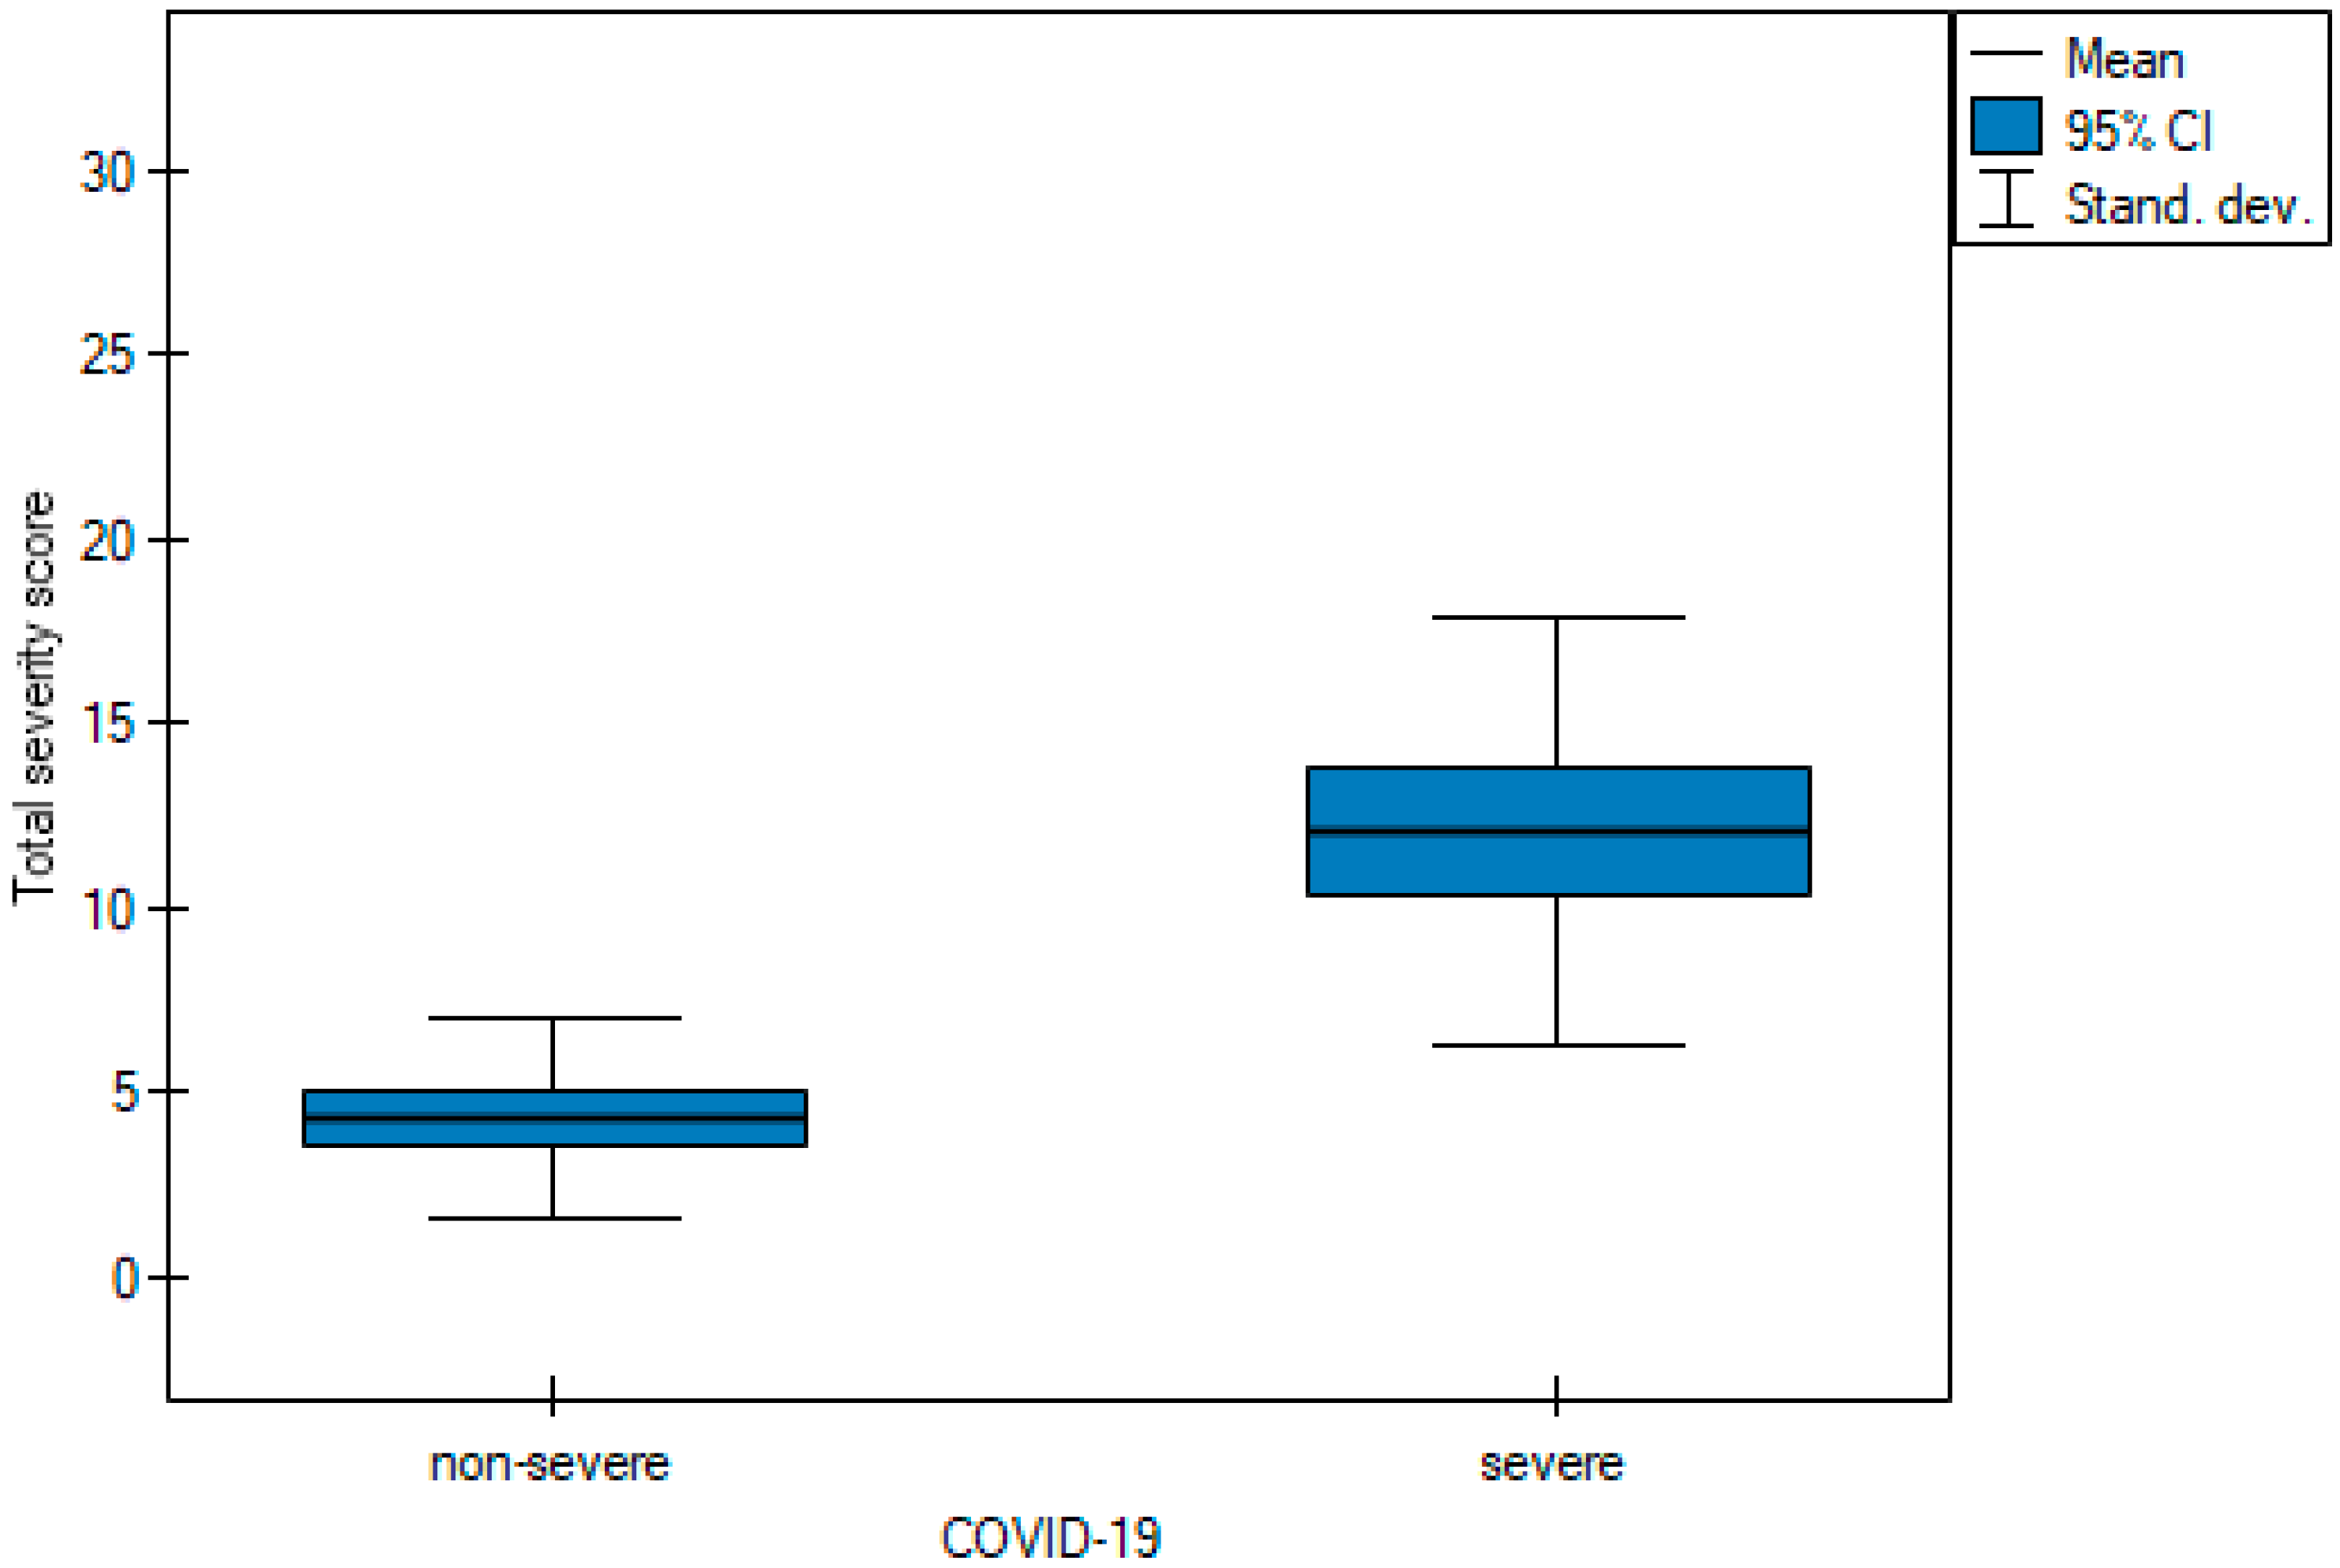
| Total severity score | 7.74 ± 5.81 | 4.3 ± 2.68 | 12.11 ± 5.8 | <0.05 t |
| Interpretation Time [seconds] | ||||
|---|---|---|---|---|
| Statistic | Chest CT Severity Score | Chest CT Score | Total Severity Score | p Value |
| Average | 35.32 | 35.62 | 29.86 | 0.002 |
| Median | 30 | 35 | 30 | 0.002 |
| Q1–Q3 | 22.75–40 | 28–45 | 22–38 | |
| Range | 10–78 | 10–68 | 10–55 | |
| Pairwise comparisons | B | B | A | |
Disclaimer/Publisher’s Note: The statements, opinions and data contained in all publications are solely those of the individual author(s) and contributor(s) and not of MDPI and/or the editor(s). MDPI and/or the editor(s) disclaim responsibility for any injury to people or property resulting from any ideas, methods, instructions or products referred to in the content. |
© 2023 by the authors. Licensee MDPI, Basel, Switzerland. This article is an open access article distributed under the terms and conditions of the Creative Commons Attribution (CC BY) license (https://creativecommons.org/licenses/by/4.0/).
Share and Cite
Hałaburda-Rola, M.; Drozd-Sokołowska, J.; Januszewicz, M.; Grabowska-Derlatka, L. Comparison of Computed Tomography Scoring Systems in Patients with COVID-19 and Hematological Malignancies. Cancers 2023, 15, 2417. https://doi.org/10.3390/cancers15092417
Hałaburda-Rola M, Drozd-Sokołowska J, Januszewicz M, Grabowska-Derlatka L. Comparison of Computed Tomography Scoring Systems in Patients with COVID-19 and Hematological Malignancies. Cancers. 2023; 15(9):2417. https://doi.org/10.3390/cancers15092417
Chicago/Turabian StyleHałaburda-Rola, Marta, Joanna Drozd-Sokołowska, Magdalena Januszewicz, and Laretta Grabowska-Derlatka. 2023. "Comparison of Computed Tomography Scoring Systems in Patients with COVID-19 and Hematological Malignancies" Cancers 15, no. 9: 2417. https://doi.org/10.3390/cancers15092417
APA StyleHałaburda-Rola, M., Drozd-Sokołowska, J., Januszewicz, M., & Grabowska-Derlatka, L. (2023). Comparison of Computed Tomography Scoring Systems in Patients with COVID-19 and Hematological Malignancies. Cancers, 15(9), 2417. https://doi.org/10.3390/cancers15092417