

Optical Genome Mapping in Routine Cytogenetic Diagnosis of Acute Leukemia
 , , , and
Abstract
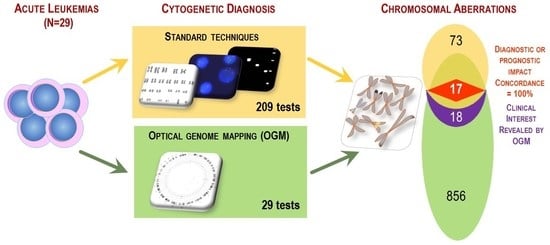
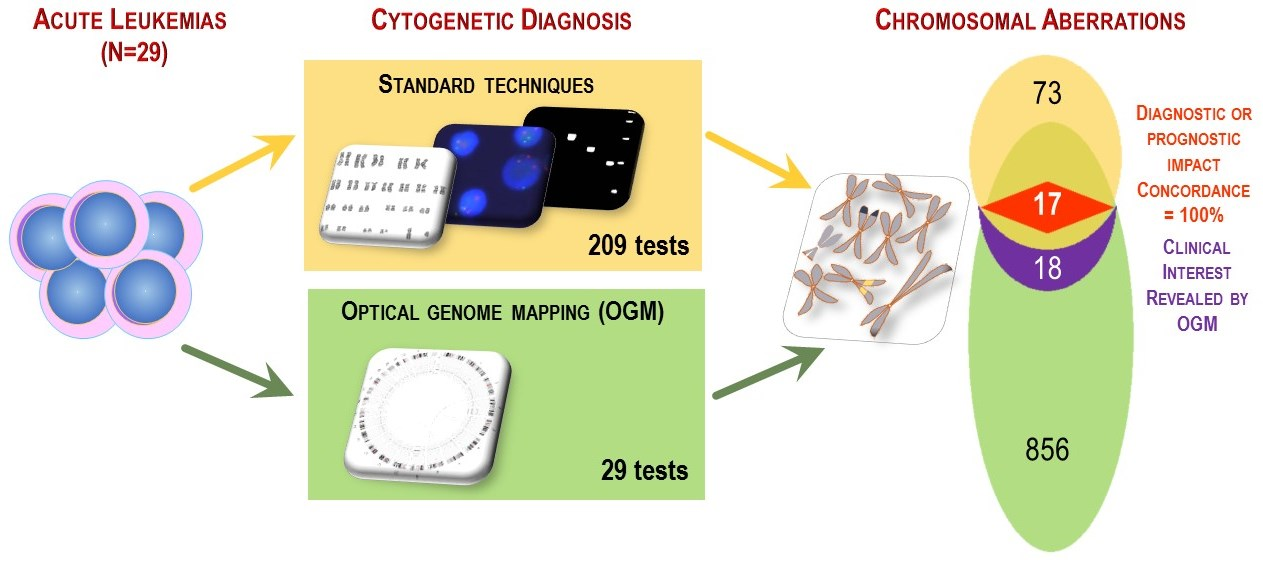
Simple Summary
Abstract
1. Introduction
2. Materials and Methods
2.1. Sample Selection
2.2. Cytogenetics and Molecular Analyzes
2.3. Ultra-High Molecular Weight DNA Extraction and Labeling
2.4. Data Collection, Rare Variant Analysis, Structural Variant Calling, and Filtering
3. Results
3.1. Patient Characteristics
3.2. OGM Quality Report and Results
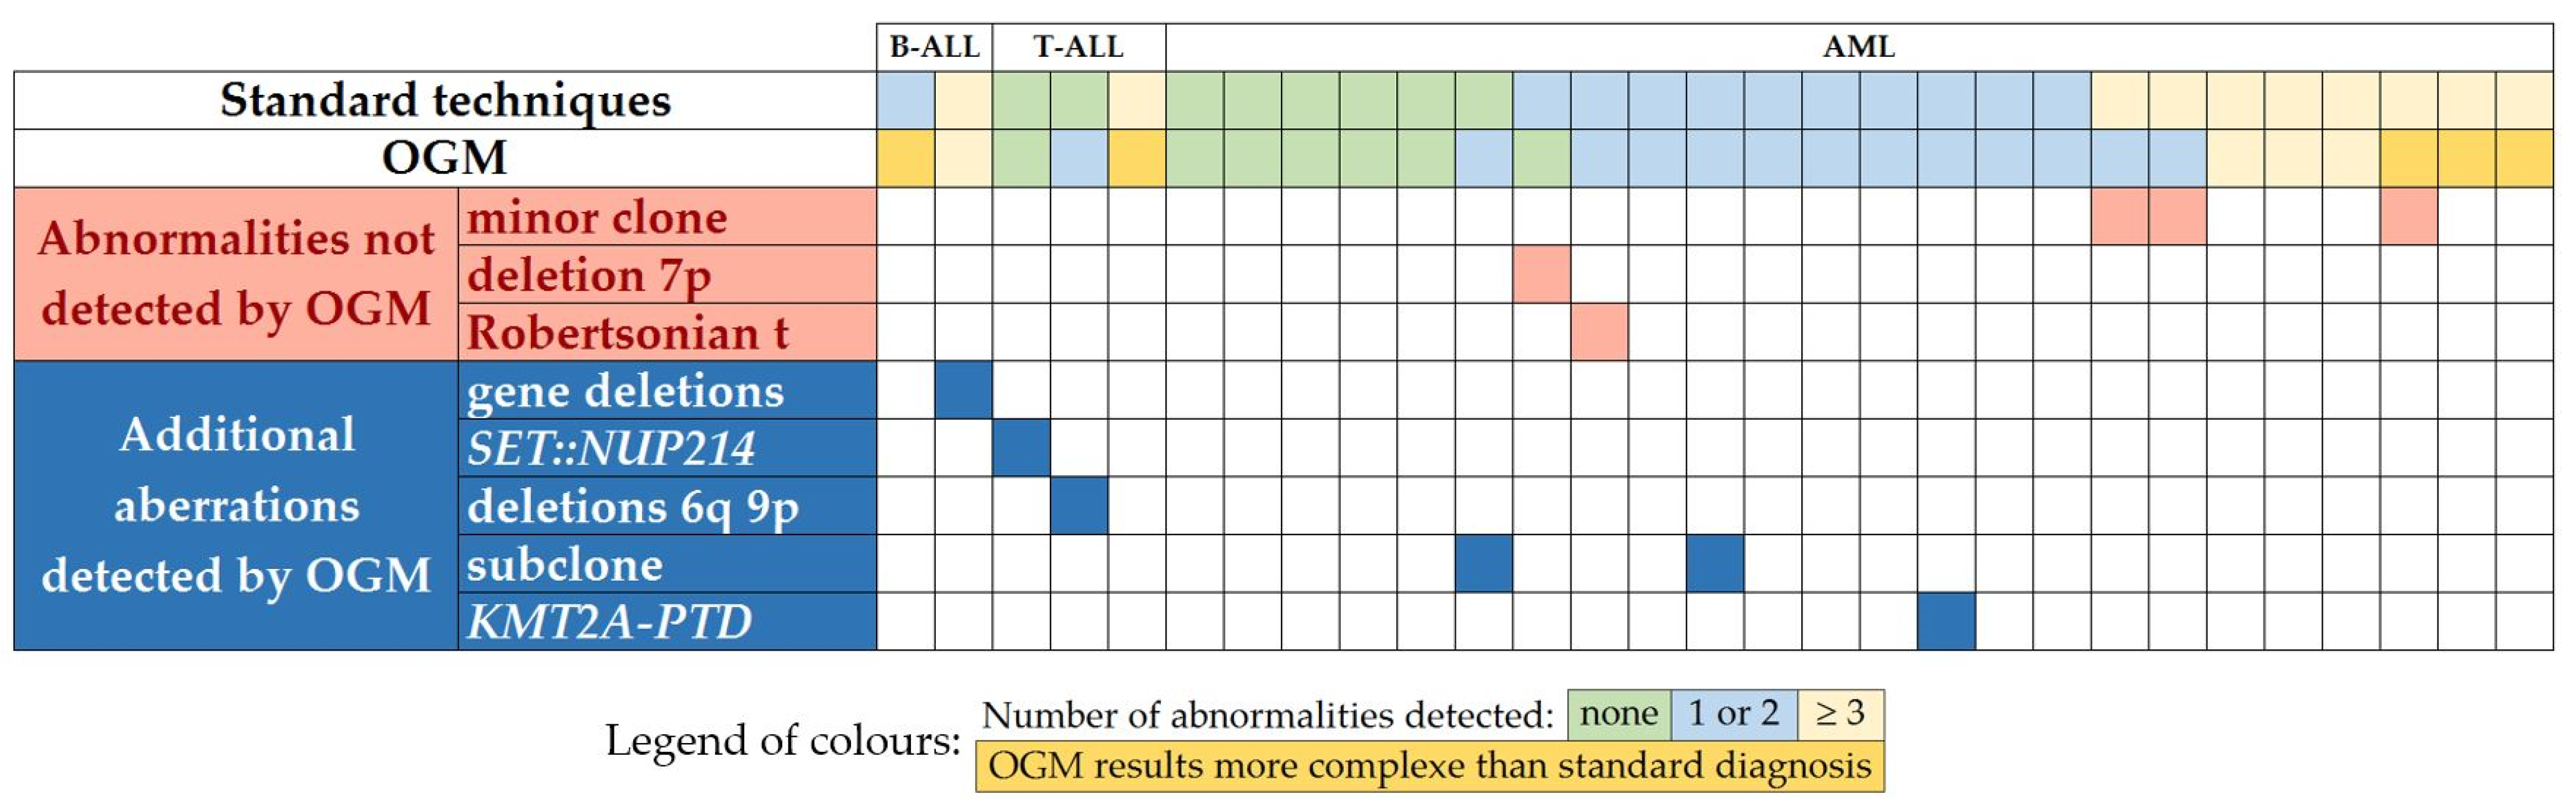
3.3. Comparison between OGM and Standard Procedure Results
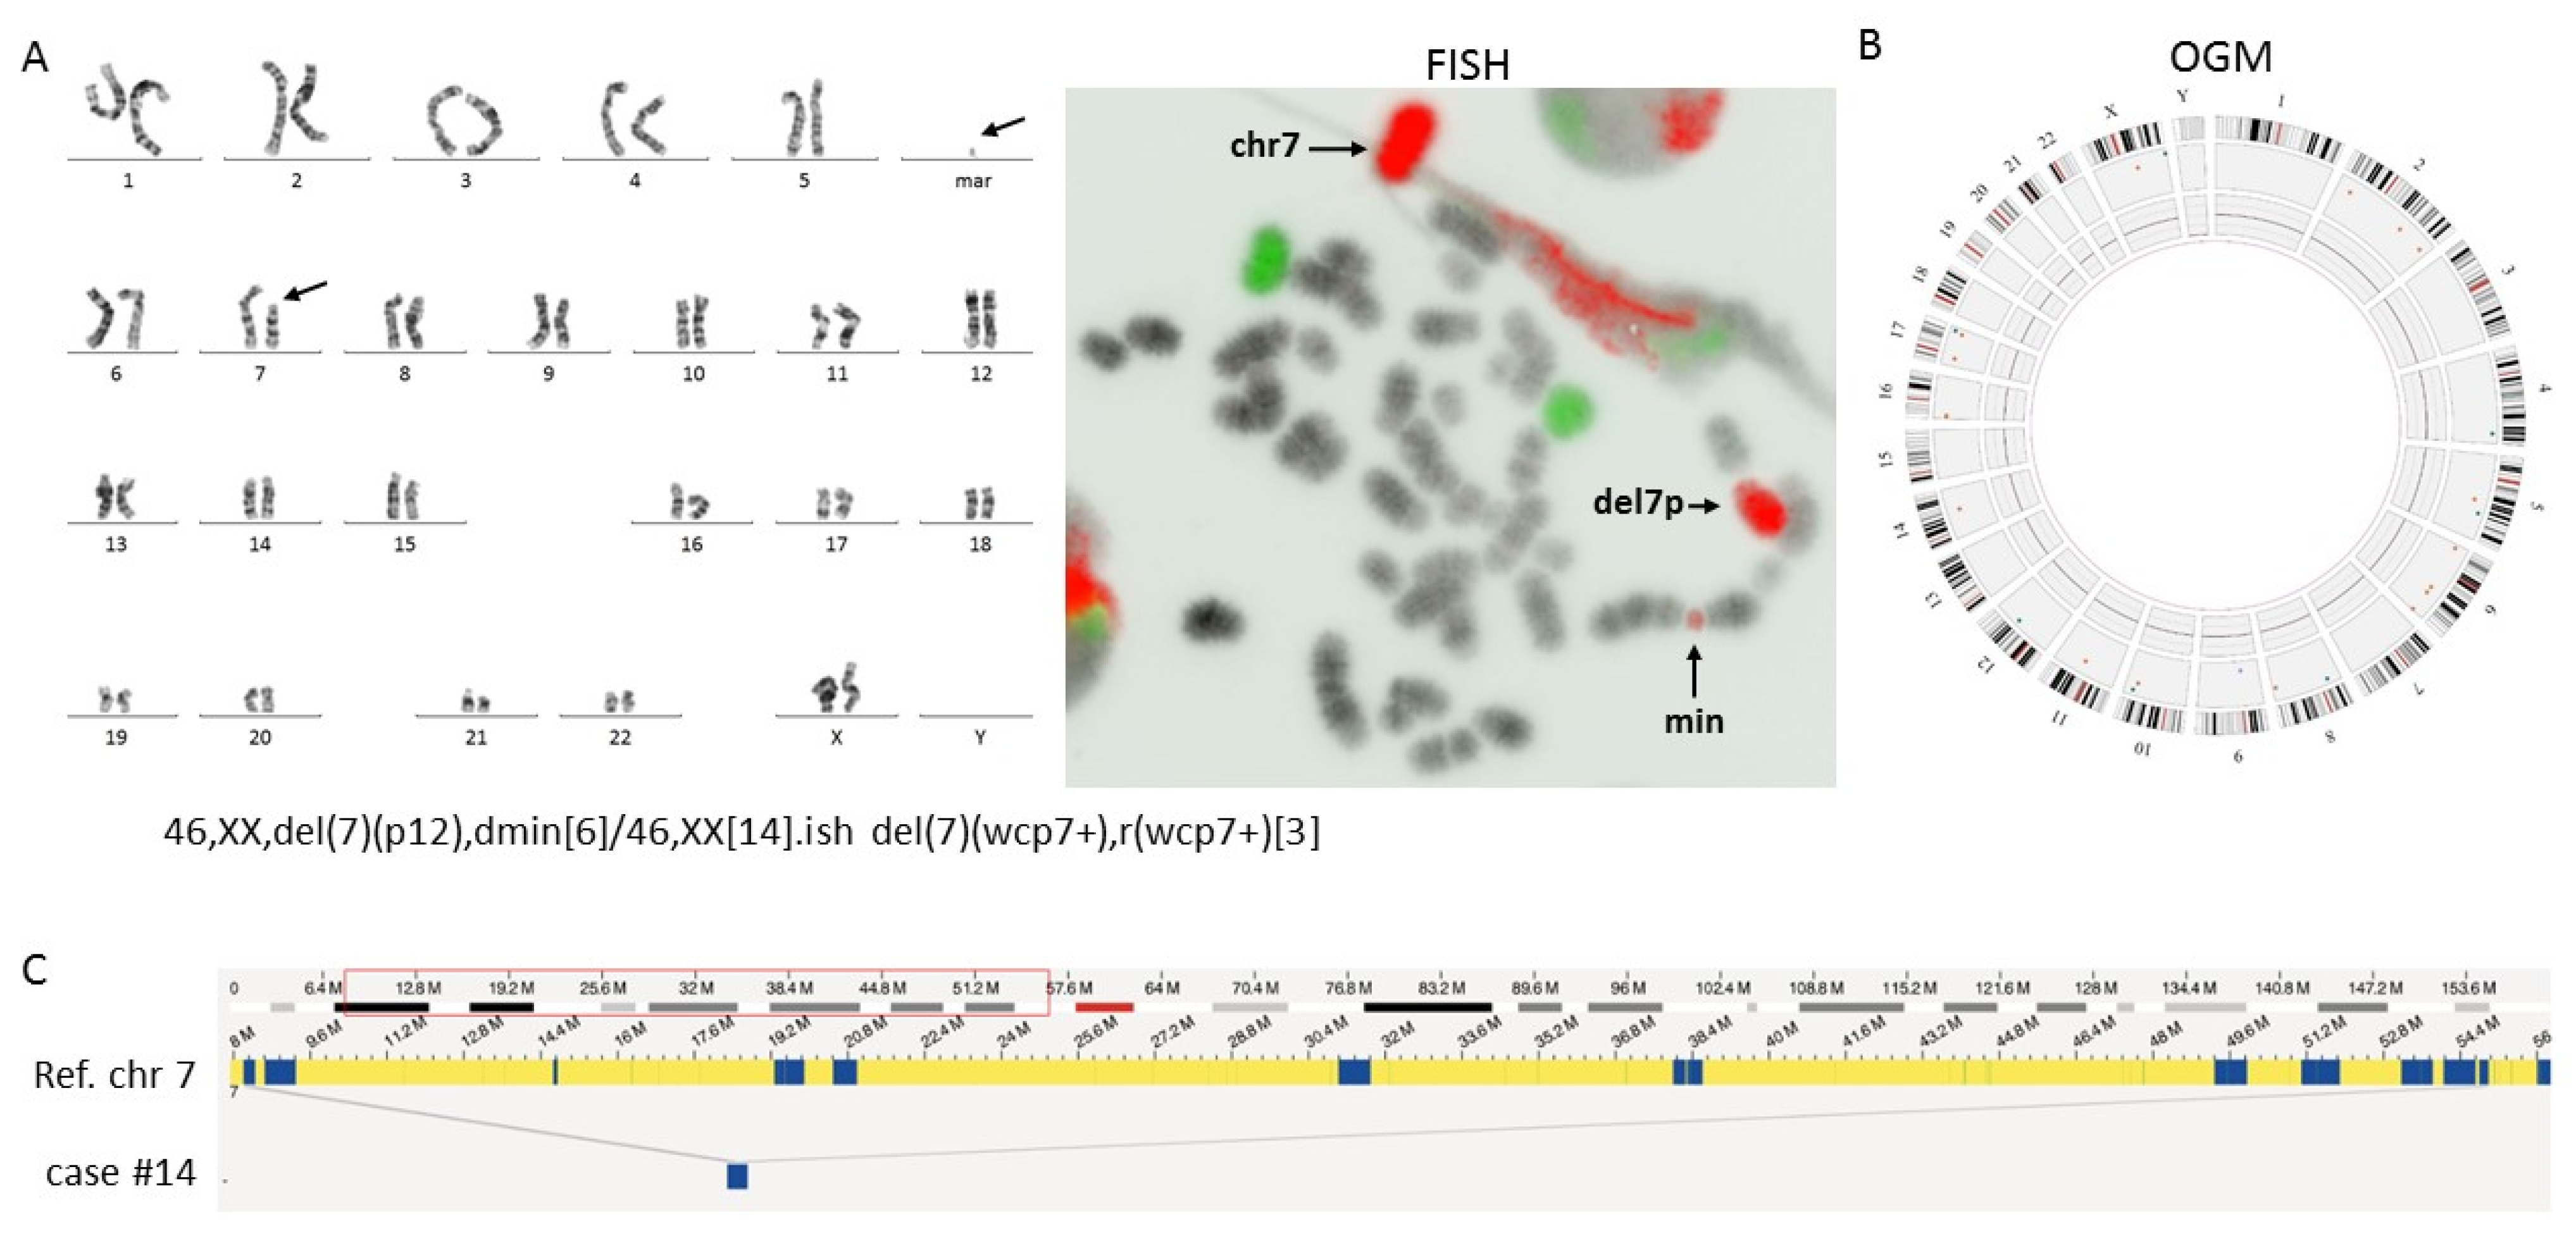
3.3.1. Leukemia without Abnormalities by Standard Techniques
3.3.2. Leukemia with One or Two Molecular/Genetic Abnormalities by Standard Techniques
3.3.3. Leukemia with Complex Karyotype
3.4. Additional Abnormalities of Clinical Interest Detected by OGM
3.5. Comparison of Implemented Resources of the Standard Procedure with OGM
4. Discussion
4.1. Impact of OGM Results on Patient Risk Stratification According to International Classifications
4.2. Confirmation of the Additional Value of OGM in the Diagnosis of Acute Leukemia
4.3. OGM as a Routine Tool
5. Conclusions
Supplementary Materials
Author Contributions
Funding
Institutional Review Board Statement
Informed Consent Statement
Data Availability Statement
Acknowledgments
Conflicts of Interest
References
- Mrózek, K.; Heerema, N.; Bloomfield, C.D. Cytogenetics in acute leukemia. Blood Rev. 2004, 18, 115–136. [Google Scholar] [CrossRef]
- Alaggio, R.; Amador, C.; Anagnostopoulos, I.; Attygalle, A.D.; Araujo, I.B.D.O.; Berti, E.; Bhagat, G.; Borges, A.M.; Boyer, D.; Calaminici, M.; et al. The 5th edition of the World Health Organization Classification of Haematolymphoid Tumours: Lymphoid Neoplasms. Leukemia 2022, 36, 1720–1748. [Google Scholar] [CrossRef]
- Khoury, J.D.; Solary, E.; Abla, O.; Akkari, Y.; Alaggio, R.; Apperley, J.F.; Bejar, R.; Berti, E.; Busque, L.; Chan, J.K.C.; et al. The 5th edition of the World Health Organization Classification of Haematolymphoid Tumours: Myeloid and Histiocytic/Dendritic Neoplasms. Leukemia 2022, 36, 1703–1719. [Google Scholar] [CrossRef] [PubMed]
- Döhner, H.; Wei, A.H.; Appelbaum, F.R.; Craddock, C.; DiNardo, C.D.; Dombret, H.; Ebert, B.L.; Fenaux, P.; Godley, L.A.; Hasserjian, R.P.; et al. Diagnosis and management of AML in adults: 2022 recommendations from an international expert panel on behalf of the ELN. Blood 2022, 140, 1345–1377. [Google Scholar] [CrossRef]
- Baranger, L.; Cuccuini, W.; Lefebvre, C.; Luquet, I.; Perot, C.; Radford, I.; Lafage-Pochitaloff, M. Cytogenetics in the management of children and adult acute lymphoblastic leukemia (ALL): An update by the Groupe francophone de cytogénétique hématologique (GFCH). Ann. Biol. Clin. 2016, 74, 547–560. [Google Scholar] [CrossRef]
- Luquet, I.; Bidet, A.; Cuccuini, W.; Lafage-Pochitaloff, M.; Mozziconacci, M.-J.; Terré, C. Cytogenetics in the management of acute myeloid leukemia: An update by the Groupe francophone de cytogénétique hématologique (GFCH). Ann. Biol. Clin. 2016, 74, 535–546. [Google Scholar] [CrossRef]
- Rack, K.A.; Van Den Berg, E.; Haferlach, C.; Beverloo, H.B.; Costa, D.; Espinet, B.; Foot, N.; Jeffries, S.; Martin, K.; O’Connor, S.; et al. European recommendations and quality assurance for cytogenomic analysis of haematological neoplasms. Leukemia 2019, 33, 1851–1867. [Google Scholar] [CrossRef]
- Chan, E.K.; Cameron, D.L.; Petersen, D.C.; Lyons, R.J.; Baldi, B.F.; Papenfuss, A.T.; Thomas, D.M.; Hayes, V.M. Optical mapping reveals a higher level of genomic architecture of chained fusions in cancer. Genome Res. 2018, 28, 726–738. [Google Scholar] [CrossRef] [PubMed]
- Levy, B.; Baughn, L.B.; Chartrand, S.; LaBarge, B.; Claxton, D.; Lennon, A.; Akkari, Y.; Cujar, C.; Kolhe, R.; Kroeger, K.; et al. A National Multicenter Evaluation of the Clinical Utility of Optical Genome Mapping for Assessment of Genomic Aberrations in Acute Myeloid Leukemia. medRxiv 2020. [Google Scholar] [CrossRef]
- Neveling, K.; Mantere, T.; Vermeulen, S.; Oorsprong, M.; van Beek, R.; Kater-Baats, E.; Pauper, M.; van der Zande, G.; Smeets, D.; Weghuis, D.O.; et al. Next-generation cytogenetics: Comprehensive assessment of 52 hematological malignancy genomes by optical genome mapping. Am. J. Hum. Genet. 2021, 108, 1423–1435. [Google Scholar] [CrossRef] [PubMed]
- Lestringant, V.; Duployez, N.; Penther, D.; Luquet, I.; Derrieux, C.; Lutun, A.; Preudhomme, C.; West, M.; Ouled-Haddou, H.; Devoldere, C.; et al. Optical genome mapping, a promising alternative to gold standard cytogenetic approaches in a series of acute lymphoblastic leukemias. Genes, Chromosom. Cancer 2021, 60, 657–667. [Google Scholar] [CrossRef]
- Rack, K.; Bie, J.; Ameye, G.; Gielen, O.; Demeyer, S.; Cools, J.; Keersmaecker, K.; Vermeesch, J.R.; Maertens, J.; Segers, H.; et al. Optimizing the diagnostic workflow for acute lymphoblastic leukemia by optical genome mapping. Am. J. Hematol. 2022, 97, 548–561. [Google Scholar] [CrossRef]
- Levy, B.; Baughn, L.B.; Akkari, Y.M.N.; Chartrand, S.; LaBarge, B.; Claxton, D.F.; Lennon, P.A.; Cujar, C.; Kolhe, R.; Kroeger, K.; et al. Optical Genome Mapping in Acute Myeloid Leukemia: A Multicenter Evaluation; Blood Adv: Washington, DC, USA, 2022. [Google Scholar] [CrossRef]
- International Standing Committee on Human Cytogenomic Nomenclature. ISCN 2020: An International System for Human Cytogenomic Nomenclature (2020); McGowan-Jordan, J., Hastings, R.J., Moore, S., Eds.; Karger: Basel, Switzerland; Hartford, CT, USA, 2020; ISBN 978-3-318-06706-4.
- van Dongen, J.J.M.; Macintyre, E.A.; Gabert, J.A.; Delabesse, E.; Rossi, V.; Saglio, G.; Gottardi, E.; Rambaldi, A.; Dotti, G.; Griesinger, F.; et al. Standardized RT-PCR analysis of fusion gene transcripts from chromosome aberrations in acute leukemia for detection of minimal residual disease. Report of the BIOMED-1 Concerted Action: Investigation of Minimal Residual Disease in Acute Leukemia. Leukemia 1999, 13, 1901–1928. [Google Scholar] [CrossRef]
- Gabert, J.; Beillard, E.; van der Velden, V.H.J.; Bi, W.; Grimwade, D.; Pallisgaard, N.; Barbany, G.; Cazzaniga, G.; Cayuela, J.M.; Cavé, H.; et al. Standardization and quality control studies of ‘real-time’ quantitative reverse transcriptase polymerase chain reaction of fusion gene transcripts for residual disease detection in leukemia—A Europe Against Cancer Program. Leukemia 2003, 17, 2318–2357. [Google Scholar] [CrossRef] [PubMed]
- Bionano Genomics. Bionano Solve Theory of Operation: Structural Variant Calling; Document Number: 30110 (Revision K); Bionano Genomics: San Diego, CA, USA, 2018. [Google Scholar]
- Bionano Genomics. Bionano Solve Theory of Operation: Variant Annotation Pipeline; Document Number: 30190 (Revision K); Bionano Genomics: San Diego, CA, USA, 2022. [Google Scholar]
- Melino, G.; De Laurenzi, V.; Vousden, K.H. p73: Friend or foe in tumorigenesis. Nat. Rev. Cancer 2002, 2, 605–615. [Google Scholar] [CrossRef]
- Stiewe, T.; Zimmermann, S.; Frilling, A.; Esche, H.; Pützer, B.M. Transactivation-Deficient DeltaTA-P73 Acts as an Oncogene. Cancer Res. 2002, 62, 3598–3602. [Google Scholar] [PubMed]
- Creasey, T.; Barretta, E.; Ryan, S.L.; Butler, E.; Kirkwood, A.A.; Leongamornlert, D.; Papaemmanuil, E.; Patrick, P.; Clifton-Hadley, L.; Patel, B.; et al. Genetic and genomic analysis of acute lymphoblastic leukemia in older adults reveals a distinct profile of abnormalities: Analysis of 210 patients from the UKALL14 and UKALL60+ clinical trials. Haematologica 2021, 107, 2051–2063. [Google Scholar] [CrossRef]
- Bluemn, T.; Schmitz, J.; Chen, Y.; Zheng, Y.; Zhang, Y.; Zheng, S.; Burns, R.; DeJong, J.; Christiansen, L.; Izaguirre-Carbonell, J.; et al. Arid2 regulates hematopoietic stem cell differentiation in normal hematopoiesis. Exp. Hematol. 2021, 94, 37–46. [Google Scholar] [CrossRef] [PubMed]
- Bluemn, T.; Schmitz, J.; Zheng, Y.; Burns, R.; Zheng, S.; DeJong, J.; Christiansen, L.; Arnold, O.; Izaguirre-Carbonell, J.; Wang, D.; et al. Differential roles of BAF and PBAF subunits, Arid1b and Arid2, in MLL-AF9 leukemogenesis. Leukemia 2022, 36, 946–955. [Google Scholar] [CrossRef]
- Stachelscheid, J.; Jiang, Q.; Herling, M. The Modes of Dysregulation of the Proto-Oncogene T-Cell Leukemia/Lymphoma 1A. Cancers 2021, 13, 5455. [Google Scholar] [CrossRef]
- Scheicher, R.; Hoelbl-Kovacic, A.; Bellutti, F.; Tigan, A.-S.; Prchal-Murphy, M.; Heller, G.; Schneckenleithner, C.; Salazar-Roa, M.; Zöchbauer-Müller, S.; Zuber, J.; et al. CDK6 as a key regulator of hematopoietic and leukemic stem cell activation. Blood 2015, 125, 90–101. [Google Scholar] [CrossRef]
- Duffield, A.S.; Mullighan, C.G.; Borowitz, M.J. International Consensus Classification of acute lymphoblastic leukemia/lymphoma. Virchows Arch. 2022, 482, 11–26. [Google Scholar] [CrossRef] [PubMed]
- Summerer, I.; Haferlach, C.; Meggendorfer, M.; Kern, W.; Haferlach, T.; Stengel, A. Prognosis of MECOM (EVI1)-rearranged MDS and AML patients rather depends on accompanying molecular mutations than on blast count. Leuk. Lymphoma 2020, 61, 1756–1759. [Google Scholar] [CrossRef] [PubMed]
- Naarmann-de Vries, I.S.; Sackmann, Y.; Klein, F.; Ostareck-Lederer, A.; Ostareck, D.H.; Jost, E.; Ehninger, G.; Brümmendorf, T.H.; Marx, G.; Röllig, C.; et al. Characterization of acute myeloid leukemia with del(9q)—Impact of the genes in the minimally deleted region. Leuk. Res. 2019, 76, 15–23. [Google Scholar] [CrossRef]
- Slayton, W.B.; Schultz, K.R.; Kairalla, J.A.; Devidas, M.; Mi, X.; Pulsipher, M.A.; Chang, B.H.; Mullighan, C.; Iacobucci, I.; Silverman, L.B.; et al. Dasatinib Plus Intensive Chemotherapy in Children, Adolescents, and Young Adults with Philadelphia Chromosome–Positive Acute Lymphoblastic Leukemia: Results of Children’s Oncology Group Trial AALL. J. Clin. Oncol. 2018, 36, 2306–2314. [Google Scholar] [CrossRef] [PubMed]
- Martinelli, G.; Iacobucci, I.; Storlazzi, C.T.; Vignetti, M.; Paoloni, F.; Cilloni, D.; Soverini, S.; Vitale, A.; Chiaretti, S.; Cimino, G.; et al. IKZF1 (Ikaros) Deletions in BCR-ABL1–Positive Acute Lymphoblastic Leukemia Are Associated with Short Disease-Free Survival and High Rate of Cumulative Incidence of Relapse: A GIMEMA AL WP Report. J. Clin. Oncol. 2009, 27, 5202–5207. [Google Scholar] [CrossRef]
- Zhu, Y.; Yan, C.; Wang, X.; Xu, Z.; Lv, J.; Xu, X.; Yu, W.; Zhou, M.; Yue, L. Pan-cancer analysis of ARID family members as novel biomarkers for immune checkpoint inhibitor therapy. Cancer Biol. Ther. 2022, 23, 104–111. [Google Scholar] [CrossRef]
- Steimlé, T.; Dourthe, M.-E.; Alcantara, M.; Touzart, A.; Simonin, M.; Mondesir, J.; Lhermitte, L.; Bond, J.; Graux, C.; Grardel, N.; et al. Clinico-biological features of T-cell acute lymphoblastic leukemia with fusion proteins. Blood Cancer J. 2022, 12, 14. [Google Scholar] [CrossRef] [PubMed]
- Van Vlierberghe, P.; Ambesi-Impiombato, A.; De Keersmaecker, K.; Hadler, M.; Paietta, E.; Tallman, M.S.; Rowe, J.M.; Forne, C.; Rue, M.; Ferrando, A.A. Prognostic relevance of integrated genetic profiling in adult T-cell acute lymphoblastic leukemia. Blood 2013, 122, 74–82. [Google Scholar] [CrossRef] [PubMed]
- Bonn, B.R.; Rohde, M.; Zimmermann, M.; Krieger, D.; Oschlies, I.; Niggli, F.; Wrobel, G.; Attarbaschi, A.; Escherich, G.; Klapper, W.; et al. Incidence and prognostic relevance of genetic variations in T-cell lymphoblastic lymphoma in childhood and adolescence. Blood 2013, 121, 3153–3160. [Google Scholar] [CrossRef]
- Uras, I.Z.; Sexl, V.; Kollmann, K. CDK6 Inhibition: A Novel Approach in AML Management. Int. J. Mol. Sci. 2020, 21, 2528. [Google Scholar] [CrossRef]
- Döhner, K.; Tobis, K.; Ulrich, R.; Fröhling, S.; Benner, A.; Schlenk, R.F.; Döhner, H. Prognostic Significance of Partial Tandem Duplications of the MLL Gene in Adult Patients 16 to 60 Years Old with Acute Myeloid Leukemia and Normal Cytogenetics: A Study of the Acute Myeloid Leukemia Study Group Ulm. J. Clin. Oncol. 2002, 20, 3254–3261. [Google Scholar] [CrossRef]
- Kong, J.; Gao, M.-G.; Qin, Y.-Z.; Wang, Y.; Yan, C.-H.; Sun, Y.-Q.; Chang, Y.-J.; Xu, L.-P.; Zhang, X.-H.; Liu, K.-Y.; et al. Monitoring of post-transplant MLL-PTD as minimal residual disease can predict relapse after allogeneic HSCT in patients with acute myeloid leukemia and myelodysplastic syndrome. BMC Cancer 2022, 22, 11. [Google Scholar] [CrossRef]
- Kong, J.; Zhao, X.-S.; Qin, Y.-Z.; Zhu, H.-H.; Jia, J.-S.; Jiang, Q.; Wang, J.; Zhao, T.; Huang, X.-J.; Jiang, H. The initial level of MLL-partial tandem duplication affects the clinical outcomes in patients with acute myeloid leukemia. Leuk. Lymphoma 2017, 59, 967–972. [Google Scholar] [CrossRef]
- Dzama, M.M.; Steiner, M.; Rausch, J.; Sasca, D.; Schönfeld, J.; Kunz, K.; Taubert, M.C.; McGeehan, G.M.; Chen, C.-W.; Mupo, A.; et al. Synergistic targeting of FLT3 mutations in AML via combined menin-MLL and FLT3 inhibition. Blood 2020, 136, 2442–2456. [Google Scholar] [CrossRef] [PubMed]
- Yang, H.; Garcia-Manero, G.; Sasaki, K.; Montalban-Bravo, G.; Tang, Z.; Wei, Y.; Kadia, T.; Chien, K.; Rush, D.; Nguyen, H.; et al. High-resolution structural variant profiling of myelodysplastic syndromes by optical genome mapping uncovers cryptic aberrations of prognostic and therapeutic significance. Leukemia 2022, 36, 2306–2316. [Google Scholar] [CrossRef] [PubMed]
- Nguyen-Khac, F.; Bidet, A.; Daudignon, A.; Lafage-Pochitaloff, M.; Ameye, G.; Bilhou-Nabéra, C.; Chapiro, E.; Collonge-Rame, M.A.; Cuccuini, W.; Douet-Guilbert, N.; et al. The complex karyotype in hematological malignancies: A comprehensive overview by the Francophone Group of Hematological Cytogenetics (GFCH). Leukemia 2022, 36, 1451–1466. [Google Scholar] [CrossRef] [PubMed]
- Puiggros, A.; Ramos-Campoy, S.; Kamaso, J.; de la Rosa, M.; Salido, M.; Melero, C.; Rodríguez-Rivera, M.; Bougeon, S.; Collado, R.; Gimeno, E.; et al. Optical Genome Mapping: A Promising New Tool to Assess Genomic Complexity in Chronic Lymphocytic Leukemia (CLL). Cancers 2022, 14, 3376. [Google Scholar] [CrossRef] [PubMed]


| #ID | Age (Years) | Sex | Sample Type | Sample Blast Count (%) | Diagnosis * | AML FAB- Subtype | Risk Category |
|---|---|---|---|---|---|---|---|
| 01 | 52 | F | BM | 97 | AML | M1 | Intermediate |
| 02 | 70 | F | BM | 49 | AML-MR | M1 | Adverse |
| 03 | 56 | F | PB | 70 | B-ALL with BCR::ABL1 fusion | n/a | n/a |
| 04 | 19 | M | BM | 76 | AML-MR | M4 | Adverse |
| 05 | 21 | F | BM | 89 | T-ALL | n/a | n/a |
| 06 | 74 | M | BM | 83 | AML with CBFB::MYH11 fusion | M4Eo | Favorable |
| 07 | 63 | M | BM | 57 | AML with MECOM rearrangement | sec. AML | Adverse |
| 08 | 64 | M | PB | 51 | AML | sec. AML | Intermediate |
| 09 | 61 | M | BM | 87 | APL with PML::RARA fusion | M3 | n/a |
| 10 | 49 | F | BM | 94 | AML | M5 | Adverse |
| 11 | 14 | M | BM | 82 | T-ALL | n/a | n/a |
| 12 | 63 | M | PB | 86 | AML with KMT2A rearrangement | M4 | Adverse |
| 13 | 84 | M | BM | 70 | AML-MR | M5 | Adverse |
| 14 | 56 | F | BM | 62 | AML | M1 | Intermediate |
| 15 | 61 | F | BM | 37 | AML-MR | sec. AML | Adverse |
| 16 | 64 | M | BM | 35 | AML with BCR::ABL1 fusion | sec. AML | Adverse |
| 17 | 81 | M | BM | 79 | AML | M0 | Intermediate |
| 18 | 8 | F | BM | 95 | B-ALL with ETV6::RUNX1 fusion | n/a | n/a |
| 19 | 80 | M | PB | 79 | AML | M4 | Intermediate |
| 20 | 23 | F | BM | 38 | AML | M4 | Intermediate |
| 21 | 81 | F | BM | 82 | AML | M1 | Intermediate |
| 22 | 60 | M | BM | 27 | AML | M5 | Favorable |
| 23 | 34 | F | BM | 58 | AML with RUNX1::RUNX1T1 fusion | M2 | Favorable |
| 24 | 64 | F | BM | 76 | AML | M4 | Intermediate |
| 25 | 66 | F | BM | 99 | AML | M0 | Intermediate |
| 26 | 80 | M | BM | 88 | AML | M4 | Intermediate |
| 27 | 60 | M | BM | 63 | AML with RUNX1::RUNX1T1 fusion | M2 | Favorable |
| 28 | 75 | M | BM | 87 | AML | M4 | Favorable |
| 29 | 50 | M | BM | 100 | T-ALL | n/a | n/a |
| #ID | Leukemia Type | Standard Karyotype 1 | FISH | Fusion Transcripts | Karyotype Description Based on OGM 2 |
|---|---|---|---|---|---|
| 18 | B-ALL | 46,XX[20] | ish t(12;21)(RUNX1+,ETV6+; RUNX1+,ETV6+)[6] | ETV6: :RUNX1 | complex karyotype with t(12;21) |
| 20 | AML | 46,XX[20] | nuc ish(KMT2A×2)[200],(CBFB×2)[200] | 46,XX | |
| 21 | AML | 46,XX[28] | nuc ish(KMT2A×2)[200],(PML, RARA)×2[200],(CBFB×2)[200] | 46,XX | |
| 22 | AML | 46,XY[22] | nuc ish(KMT2A×2)[200],(CBFB×2)[200] | 46,XY | |
| 24 | AML | 46,XX[20] | nuc ish(KMT2A×2)[200],(CBFB×2)[200] | 46,XX | |
| 28 | AML | 46,XY[20] | nuc ish(KMT2A×2)[200],(CBFB×2)[200] | 46,XY | |
| 10 | AML | 46,XX[8] * | nuc ish(KMT2A×2)[200],(CBFB×2)[200] | 47,XX,+13 | |
| 14 | AML | 46,XX,del(7)(p12),dmin[6]/ 46,XX[15] | ish del(7)(wcp7+),r(7)(wcp7+)[3].nuc ish (KMT2A×2)[200],(CBFB×2)[200] | 46,XX | |
| 19 | AML | 46,XY,+i(8)(q10),der(13;14) (q10;q10)?c[23] | nuc ish(KMT2A×2)[200],(CBFB×2)[200] | 47,XY,+der(8)i(8)(q10) del(8)(q24.3q24.3) | |
| 06 | AML | 46,XY,inv(16)(p13q22)[18]/ 46,XY[2] | ish inv(16)(p13)(5′CBFB+) (q22)(3′CBFB+)[19].nuc ish(KMT2A×2) [200],(CBFB×2)(5′CBFB sep 3′CBFB×1) [66/100] | CBFB: :MYH11 | 46,XY,inv(16)(p13q22)/45,sl,-Y |
| 08 | AML | 47,XY,+8[16]/46,XY[4] | nuc ish(KMT2Ax2)[200],(CBFBx2)[200] | 47,XY,+8 | |
| 09 | AML | 46,XY,t(15;17)(q24;q21)[17]/ 46,XY[3] | ish t(15;17)(PML+,RARA+;RARA+, PML+)[20].nuc ish(KMT2A×2)[200], (PML,RARA)×3(PML con RARA×2) [93/100] | PML::RARA | 46,XY,t(15;17)(q24;q21) |
| 16 | AML | 46,XY,t(9;22)(q34;q11)[20] | nuc ish(KMT2A×2)[200], (PML,RARA)×2[200],(CBFB×2)[200] | BCR::ABL1 | 46,XY,t(9;22)(q34;q11) |
| 17 | AML | 47,XY,+22[11]/46,XY[10] | nuc ish(KMT2A×2)[200],(CBFB×2)[200] | 47,XY,+22 | |
| 25 | AML | 46,XX,del(9)(q13q22), inv(14)(q13q24)[20] | ish del(9)(ABL1+),22q11.2(BCR×2)[20]. nuc ish(ABL1,BCR)×2[200],(KMT2A×2) [198/200],(TCRA/D×2)[195/200], (CBFB×2)[198/200] | 46,XX,del(9)(q21.11q31.1), inv(14)(q13.2q32.13) | |
| 26 | AML | 45,X,-Y[30] | nuc ish(KMT2A×2)[200],(CBFB×2)[200], (RARA×2)[50] | 45,X,-Y | |
| 07 | AML | 40~45,X,-Y,add(7)(q21), t(9;12)(p?21;?q12),add(16) (q2?1),+mar,2dmin,inc[3]/ 46,XY,t(3;8)(q26;q21)[2]/47, XY,+der(1;19)(q10;p10)[1]/ 46,XY[21] | ish t(3;8)(3′MECOM+;5′MECOM+)[17]. nuc ish(MECOM×2)(3′MECOM sep 5′MECOM×1)[172/200] | 46,XY,t(3;8)(q26;q21) | |
| 23 | AML | 46,XX,t(8;21)(q21;q22), del(9)(q13q22)[18]/47,sl, +del(9)(q13q22)[2] | nuc ish(KMT2A×2)[200],(CBFB×2)[200] | RUNX1: :RUNX1T1 | 46,XX,t(8;21)(q21;q22), del(9)(q21.11q31.1) |
| 12 | AML | 47,XY,del(1)(q41q42),t(9;11) (p21;q23),+21[20] | ish t(9;11)(3′KMT2A+;5′KMT2A+)[40]. nuc ish(KMT2A×2)(5′KMT2A sep 3′KMT2A×1)[192/200],(CBFB×2)[200] | KMT2A: :MLLT3 | 47,XY,del(1)(q41q42),t(9;11) (p21;q23),+21[20] |
| 13 | AML | 48,XY,del(1)(p36p34), +del(1)(p36p34),+8, t(9;15)(p22;q24)[19]/ 46,XY[1] | ish t(9;15)(JAK2-;JAK2+)[20].nuc ish(JAK2×2)[200],(KMT2A×2)[200], (CBFB×2)[199/200] | 48,XY,del(1)(p36.32p35.1), +del(1)(p36.32p35.1),+8, t(9;15)(p21.3;q23) | |
| 27 | AML | 45,X,-Y,der(8)ins(8) (p23q21.3q24)t(8;21) (q21.3;q22), der(12)t(8;12)(q24;q13), der(21)t(12;21)(q13;q22)[20] | ish der(8)ins(8)(D8S504+, RUNX1T1+) t(8;21)(RUNX1T1+,RUNX1+),der(12) t(8;12)(VIJyRM2053+),der(21)t(8;21) (RUNX1+, RUNX1T1+)[5].nuc ish (KMT2A×2)[200],(CBFB×2)[200] | RUNX1: :RUNX1T1 | 45,X,-Y, der(8)ins(8)(p21.3q21.3q24.13) t(8;21)(q21.3;q22.12), der(12)t(8;12)(q24.13;q13.13), der(21)t(12;21)(q13.13;q22.12) |
| 15 | AML | 46,XX,dic(5;10)(q12;q21),+21[18]/52,sl,+1,+2,+9,+11,+20, +21[2] | ish dic(5;10)(wcp5+,D5S23+,EGR1-; wcp10+)[19] | 46,XX,der(5)t(5;10) (q11.2q12.3;q11.21q21.1), dic(5;10)(q13.3;q11.21),+21 | |
| 02 | AML | 44~47,XX,del(5)(q1?3q3?3), der(7)t(7;17)(p14;q12), i(8)(q10),del(9)(p1?3p1?5), del(12)(p11),-15,-16,-17, +mar[20] | ish del(5)(EGR1-)[20],der(7)(TP53-, D7Z1+,D7S486+) [20].nuc ish (D5S23×2,EGR1×1)[95/100],(D7Z1, D7S486)×2[200],(ETV6×1)[100],(TP53×1, D17Z1×2)[100] | 45,XX,del(5)(q14.3q34), der(7)t(7;17)(p22.3;q12) del(7)(p21.3p15.2)del(7)(p14p11.2), idic(8)(p11.21),del(12)(p11.21),del(15) (q11.2q22.2),del(16)(q11.2),-17 | |
| 04 | AML | 46,XY,der(4)t(4;13) (q21;q3?3),t(7;14)(q21;q32), add(8)(p21), der(13)inv(13)(p11q?13) t(4;13)(q21;q21)[12]/ 46,XY[3] | ish der(4)t(4;13)(wcp4+,FIP1L1+, CHIC2+,wcp13+)[7],t(7;14)(wcp7+, D7Z1+; wcp7+,D7S486+)[7],add(8) (wcp8+,FGFR1+)[7],der(13)inv(13) (wcp13+)t(4;13)(wcp4+)[7].nuc ish (FIP1L1,CHIC2,PDGFRA)×2 [200],(FGFR1×2)[200], (KMT2A×2)[200],(CBFB×2)[200] | 46,XY,t(3;17)(p22.1;p13.1), der(4)t(4;13)(q22.1;q34), del(6)(q14.1q14.2),t(7;14)(q21.2;q32.2),er(8)t(8;17)(p21.2;q21.2), der(13)del(13)(q14q31.3)t(4;13), der(13)t(13;13)(q22.1;q31.3) |
| #ID | Leukemia Type | Standard Karyotype 1 | FISH | Fusion Transcripts | Karyotype Description Based on OGM 2 | Cryptic Clinically-Relevant Aberrations Detected by OGM 3 | ||
|---|---|---|---|---|---|---|---|---|
| SV Type | Region (Coordinates) | Genes of Interest | ||||||
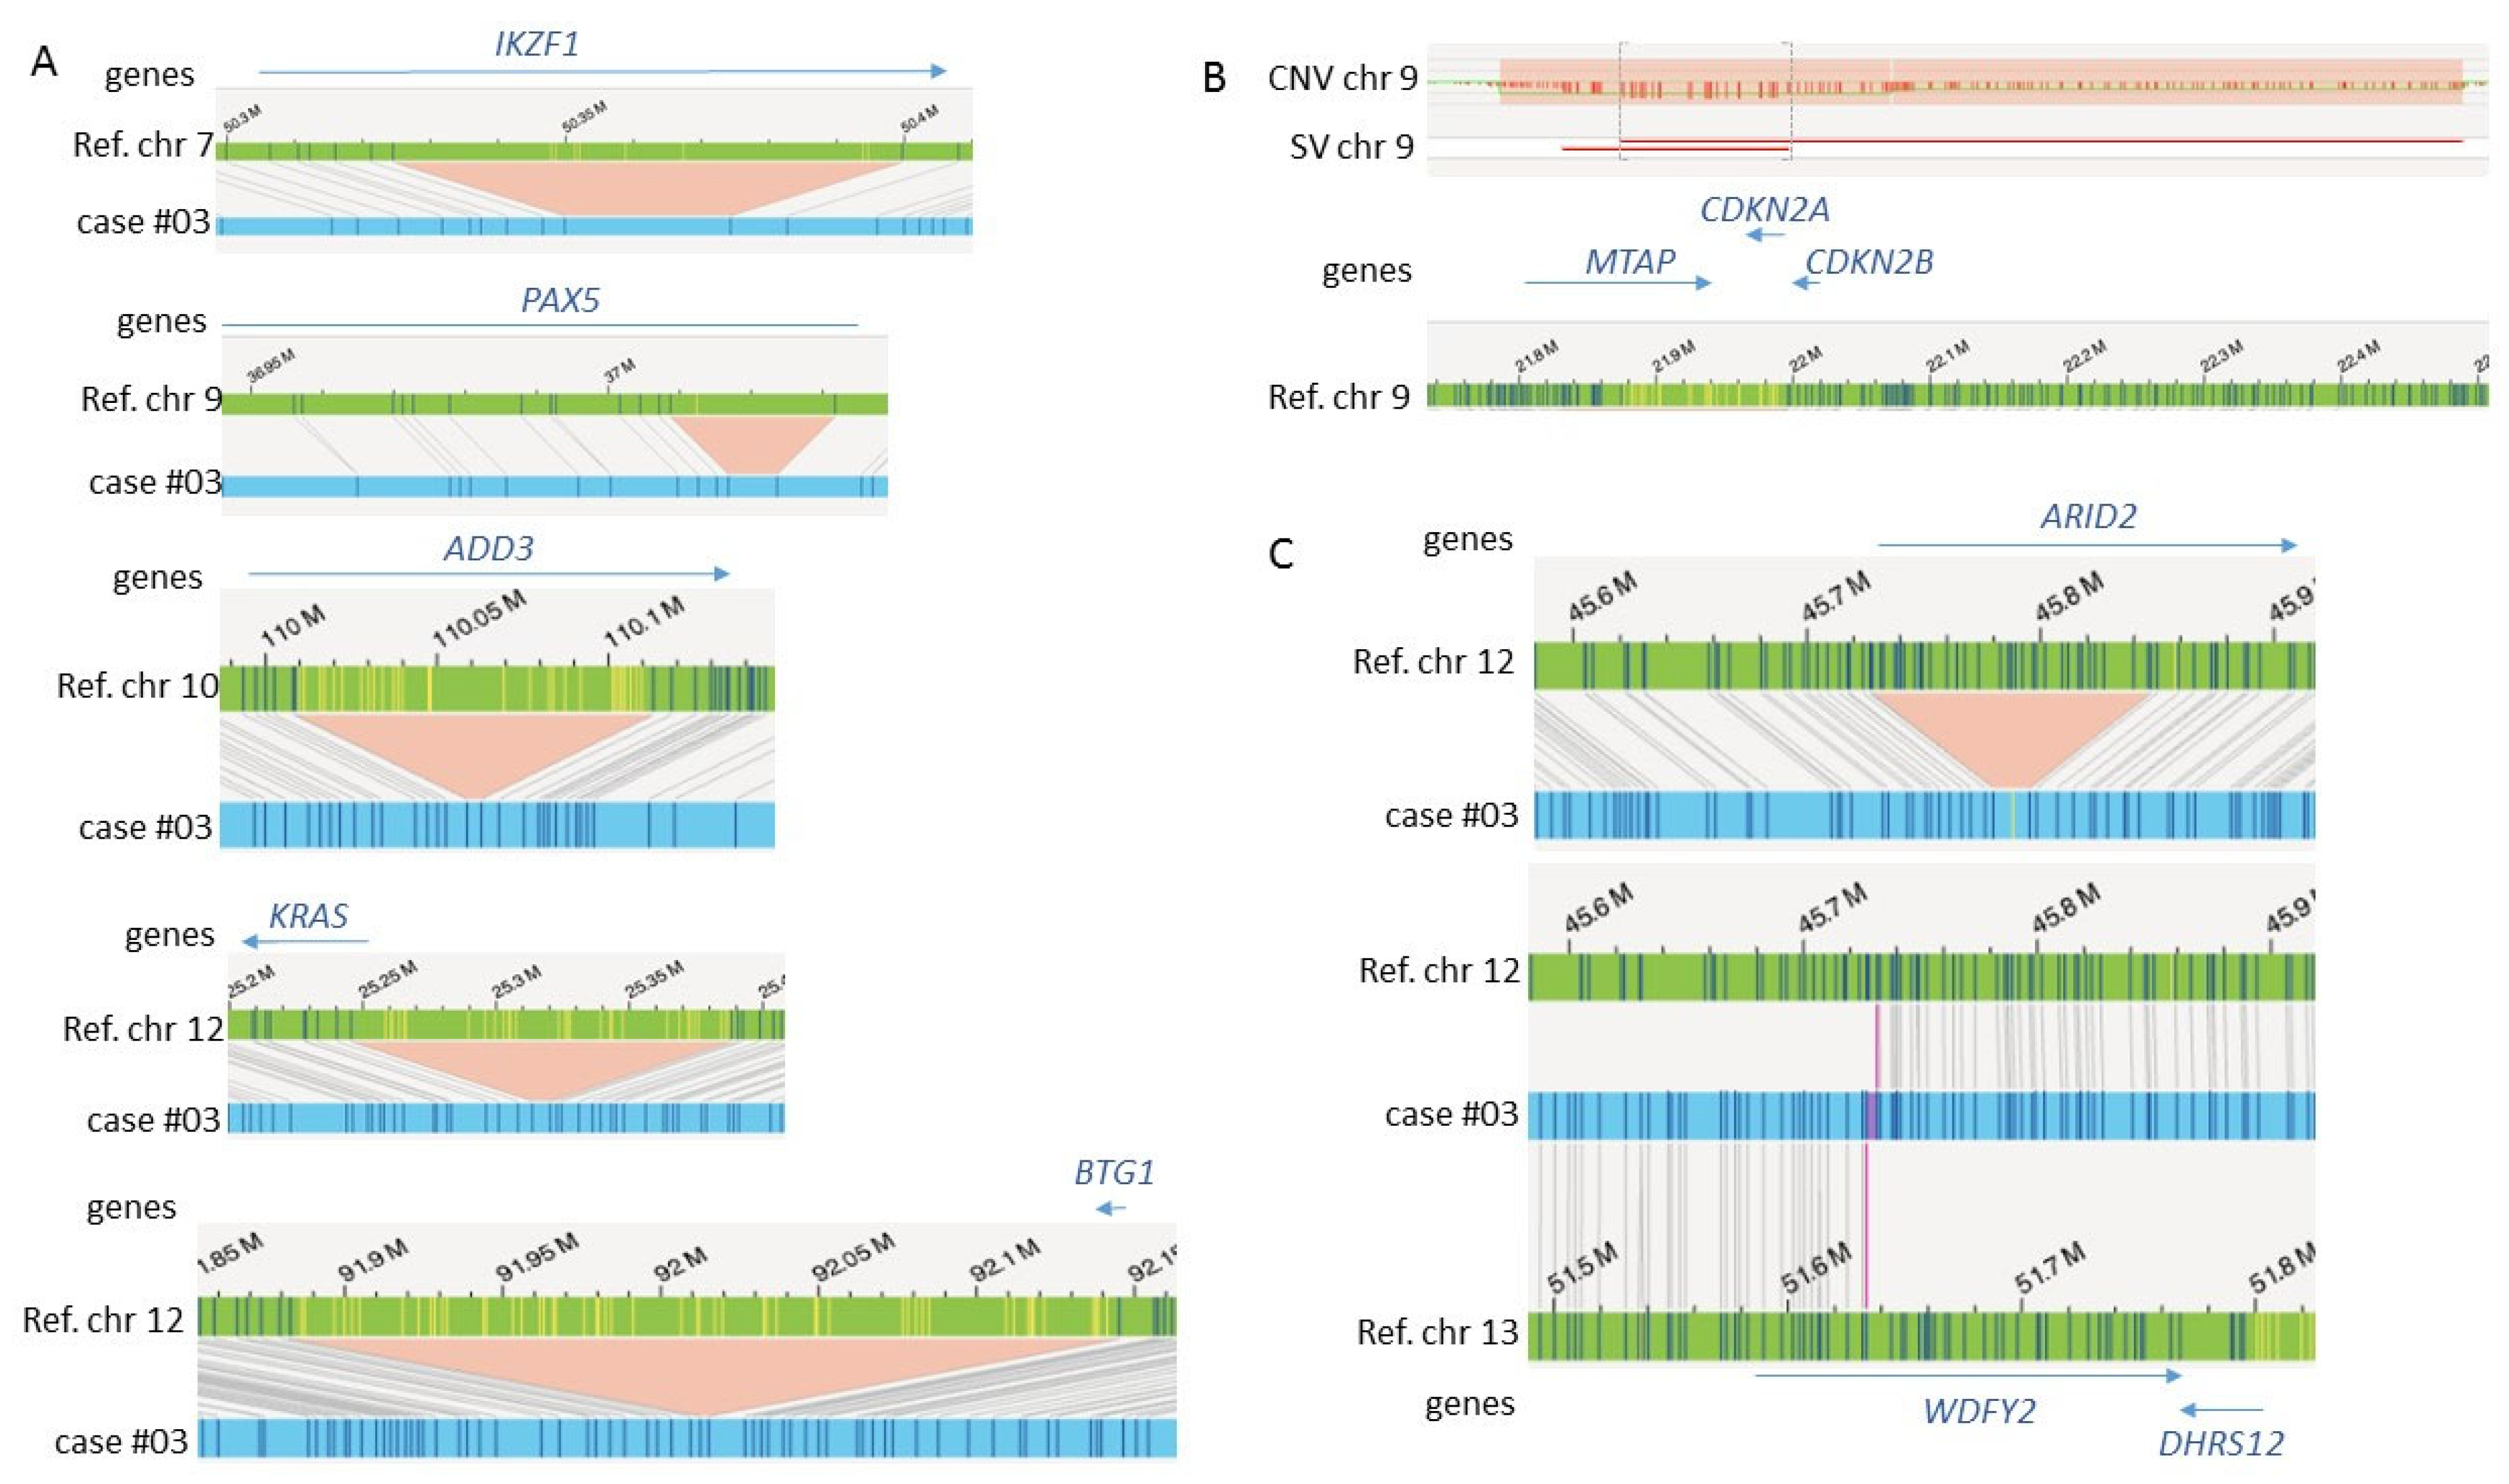
| 03 | B-ALL | 49,XX,+6,+8, t(9;22)(q34;q11), t(12;13)(q12;q?21), +der(22)t(9;22)[8]/ 46,XX[12] | ish der(12)t(12;13)(ETV6+)[20]. nuc ish(KMT2A×2)[200], (ETV6,RUNX1)×2[200], (TCF3×2)[200] | BCR: :ABL1 | 49,XX,+6,+8,t(9;22)(q34;q11), t(12;13)(q12;q14.3), +der(22)t(9;22)[8]/46,XX[12] | deletion deletion deletion deletion deletion deletion deletion translocation interchr | 7p12.2(50324504_50399656) 9p21.3(21831433_21996139) 9p21.3(21874513_22488706) 9p13.2(37008719_37031741) 10q25.1q25.2(110008672_110113010) 12p12.1(25245614_25388171) 12q21.33(91882647_92145130) t(12;13)(q12;q14.3) | IKZF1 MTAP, CDKN2A CDKN2A, CDKN2B PAX5 ADD3 KRAS BTG1 ARID2;WDFY2 |
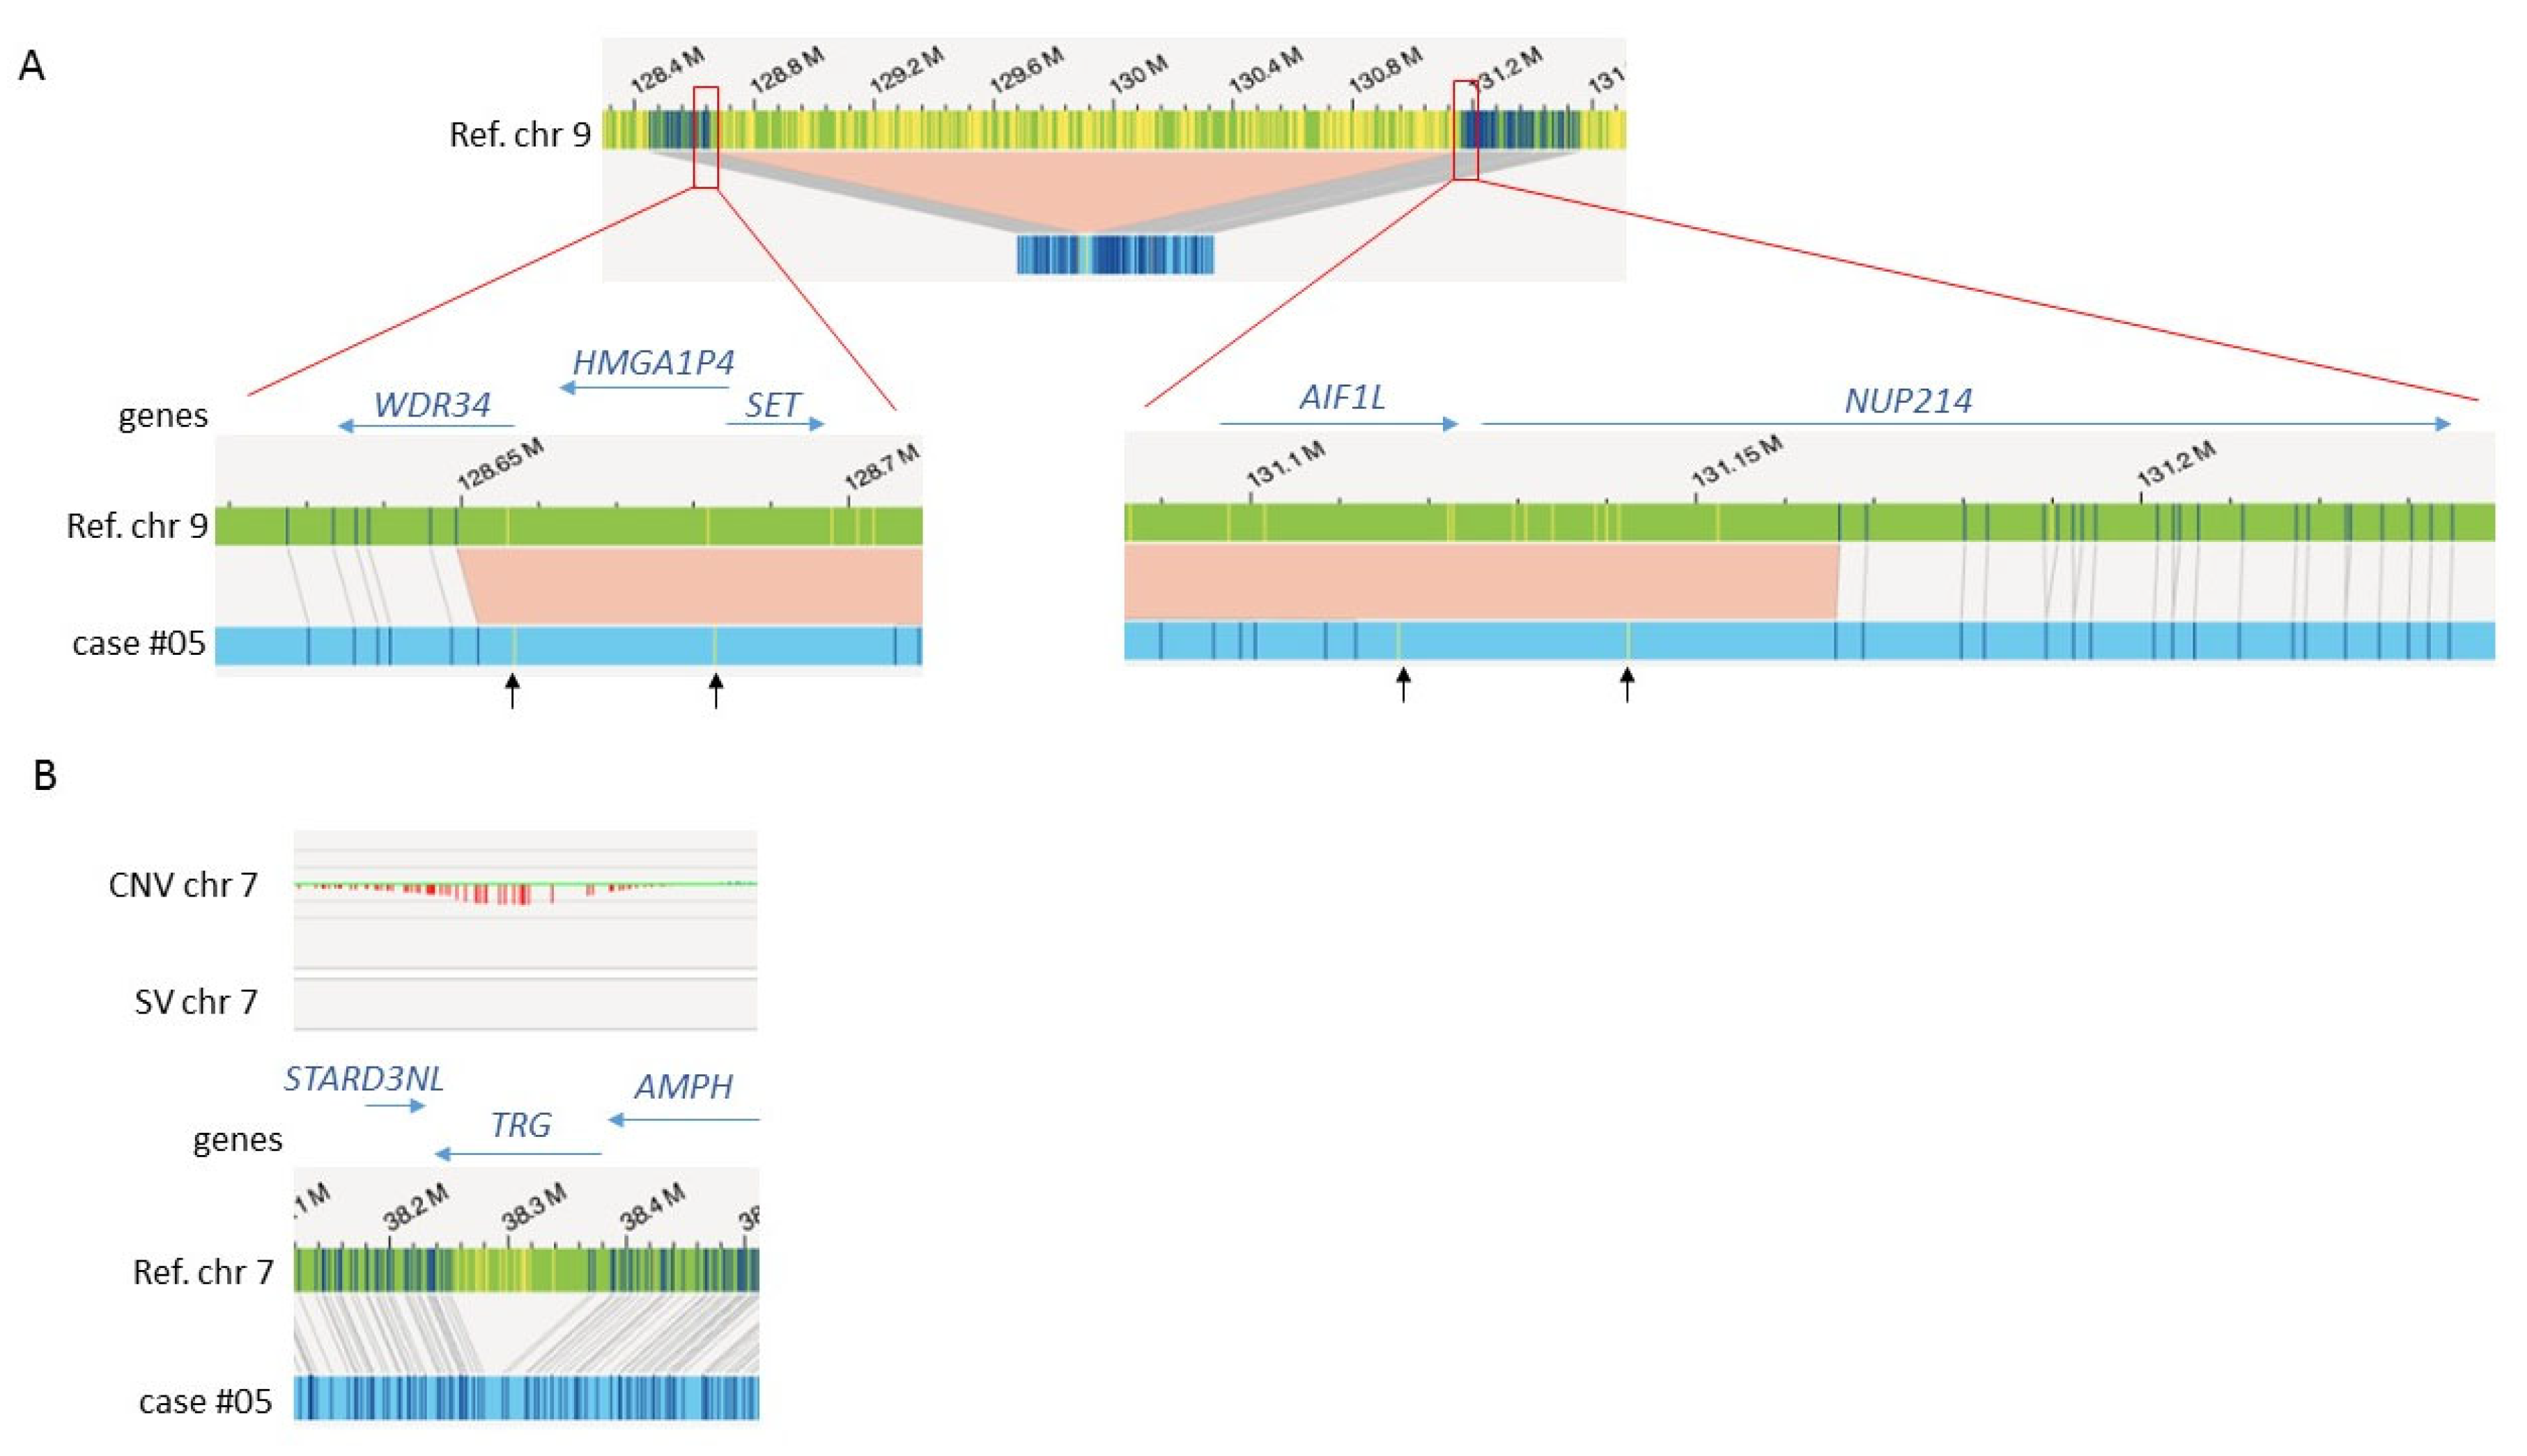
| 05 | T-ALL | 46,XX[20] | nuc ish(TLX3×2)[200],(ABL1×1, BCR×2)[105/200],(KMT2A×2) [200],(TLX1×2)[200] | 46,XX | bi-allelic deletion deletion deletion deletion | 9p21.3(21903070_23549634) 9q34.11q34.13(128649360_131166096) 12p13.2p12.3(10511129_15366319) 12p13.2p13.1(11475434_12738020) | CDKN2A,CDKN2B SET::NUP214 ETV6,CDKN1B ETV6,CDKN1B | |
| 11 | T-ALL | 46,XY[22] | nuc ish(TLX3×2)[200],(ABL1, BCR)×2[198/200],(TLX1×2)[200], (KMT2A×2)[196/200] | 46,XY,del(6)(q13q22.1) | deletion deletion deletion | 9p22.1p21.3(19614301_22695036) 9p21.3(20527876_23828989) 14q11.2(22234858_22563632) | CDKN2A,CDKN2B CDKN2A,CDKN2B TCRA/D locus | |
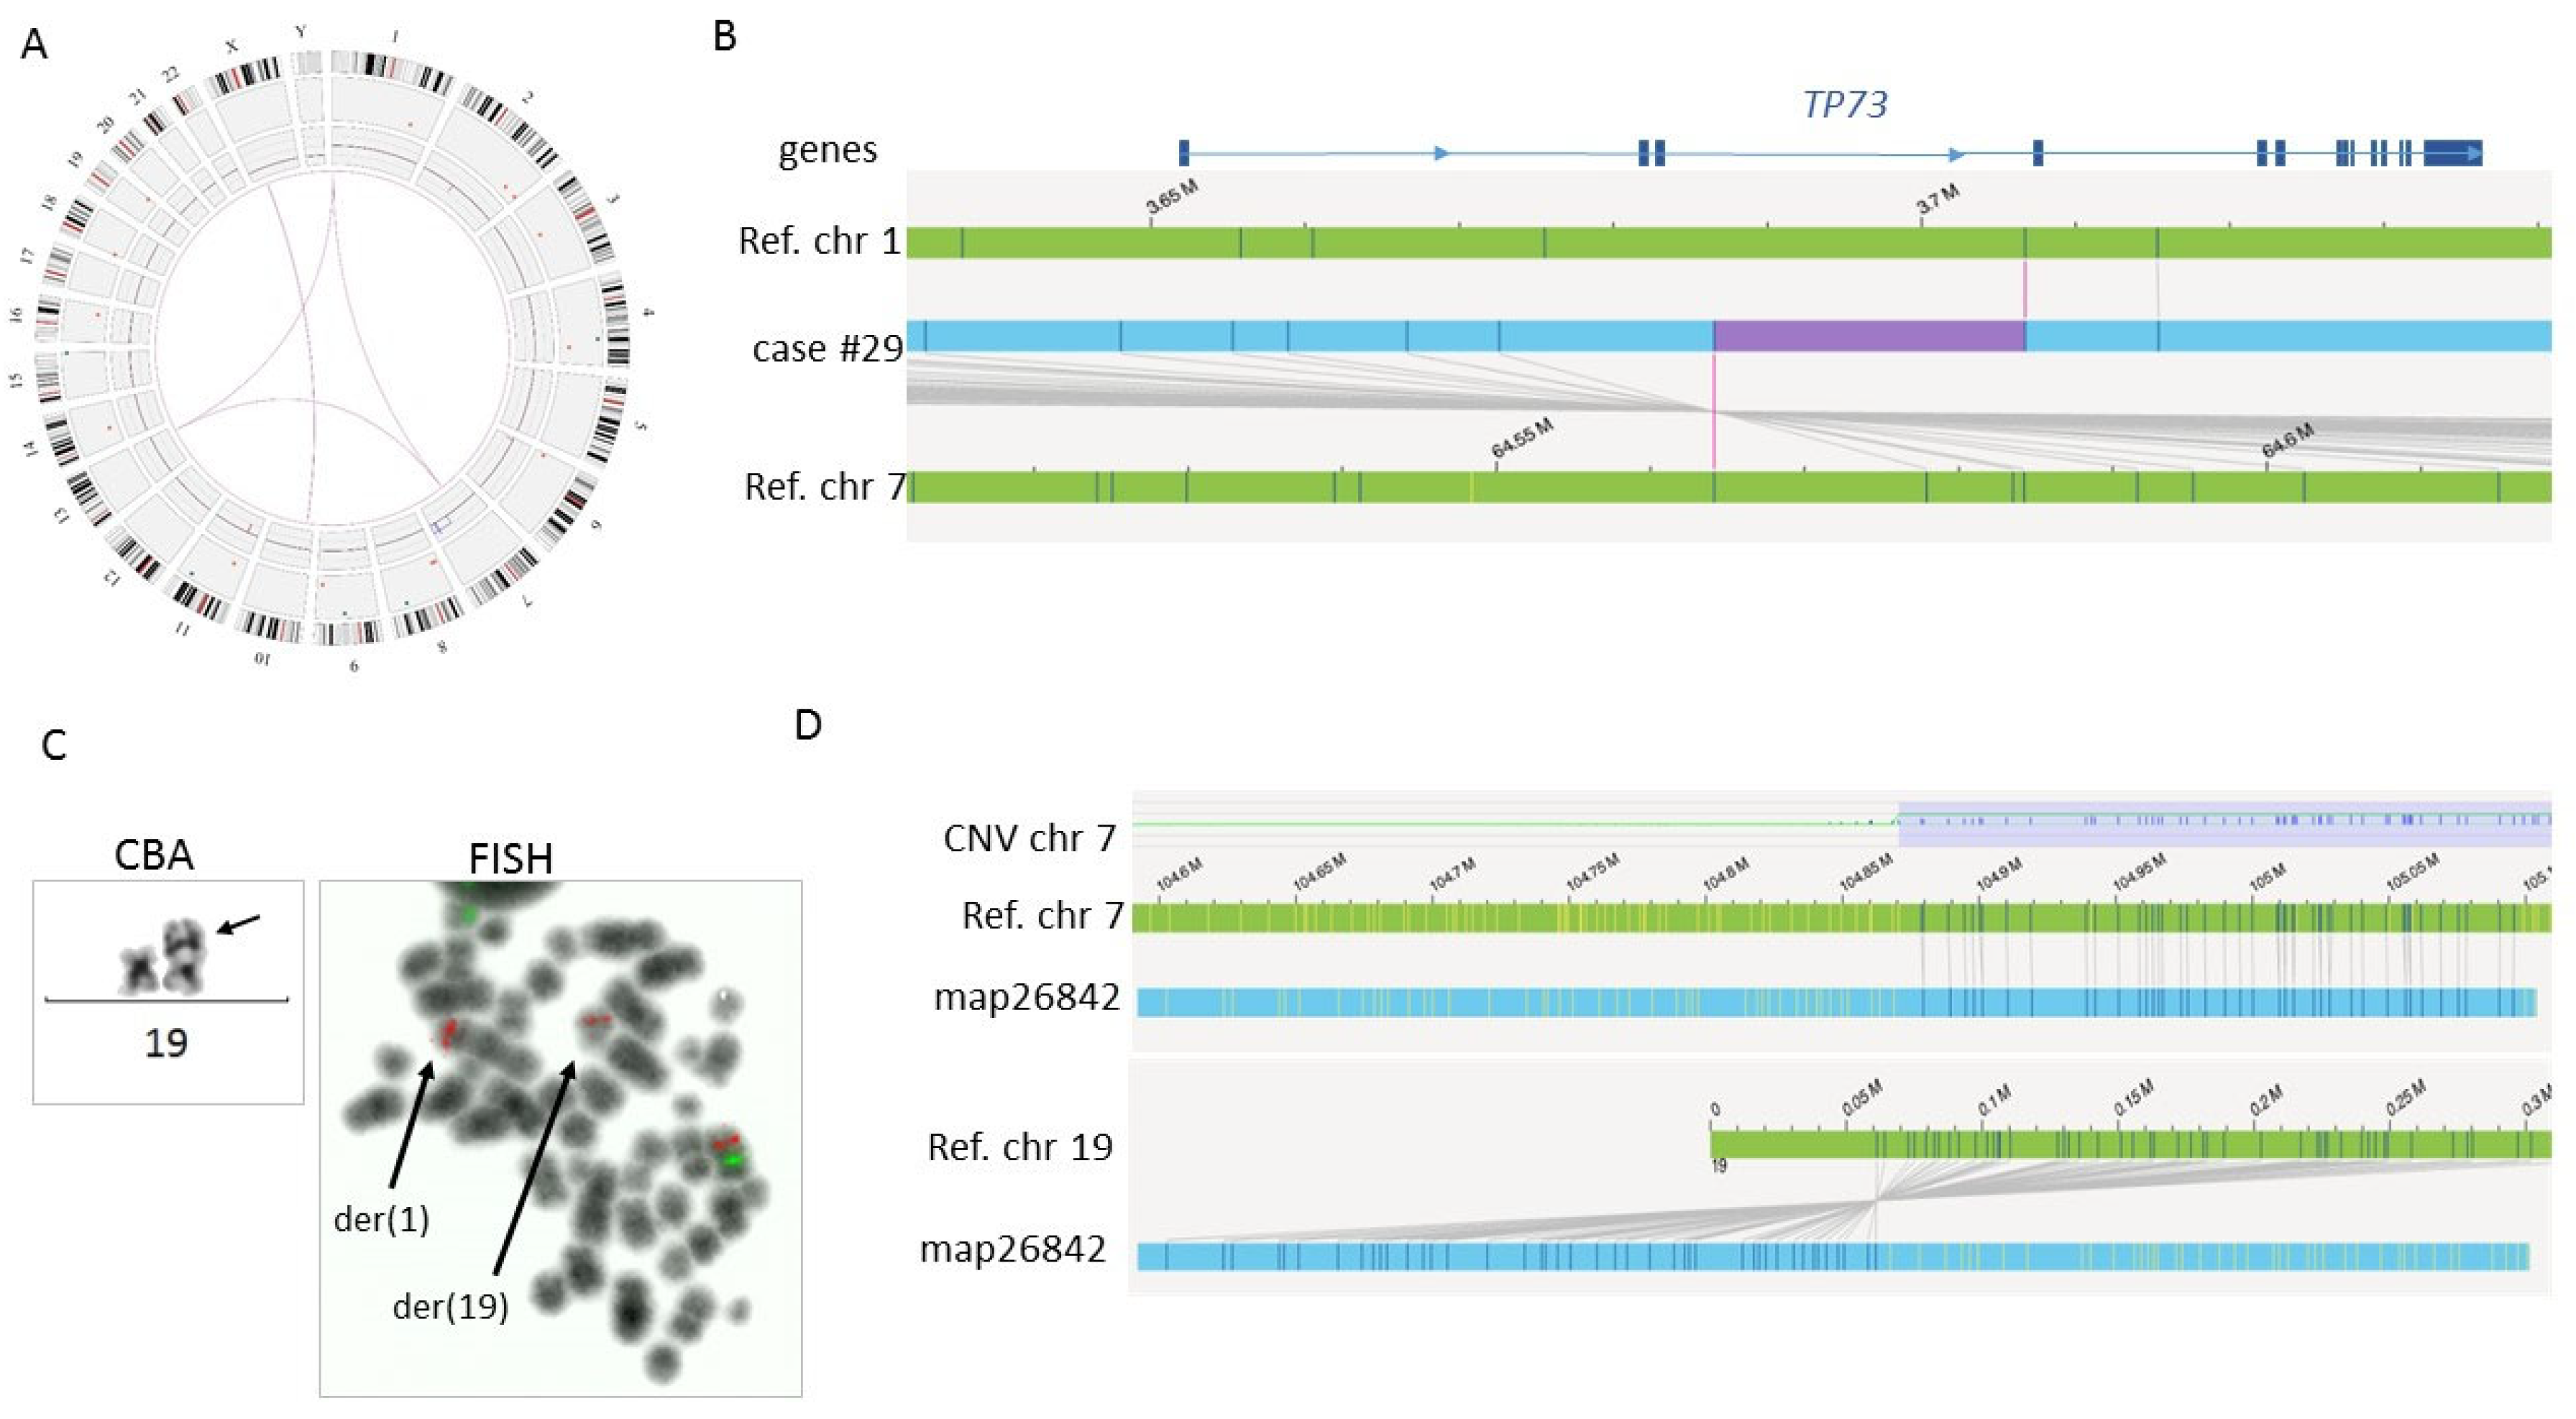
| 29 | T-ALL | 46,Y,t(X;10)(p11;p12), t(1;7)(p36;q12),der(19) ins(19;7)(p13;q3?4q22)[13]/46,XY[4] | ish t(X;10)(wcpX+;wcpX+, TLX1+)[10],t(1;7)(D7S486+; D7Z1+)[19],der(19)ins(19;7) (D7S486+)[19].nuc ish(TLX3×2) [200],(D7Z1×2,D7S486×3) [182/200],(TLX1×2)[200] | 46,Y,t(X;10)(p11;p12),t(1;13;7) (p36.32;q32.3;q11.21), dup(7)(q22.27q36.3) | translocation interchr translocation interchr | t(1;7)(p36.32;q11.21) t(1;13)(p36.32;q32.3) | TP73 TP73 | |
| 01 | AML | 47,XX,+mar[17]/46,XX[3] | ish der(?8)(?cen::8q24.?2→ 8q22::8q22→8qter) (wcp8+,RUNX1T1-,MYC++)[18] | 47,XX,+der(?)(?cen::8q24.3→ 8q22.1::8q22.1→8qter) | duplication | 11q23.3(118461867-118479068) | KMT2A | |
Disclaimer/Publisher’s Note: The statements, opinions and data contained in all publications are solely those of the individual author(s) and contributor(s) and not of MDPI and/or the editor(s). MDPI and/or the editor(s) disclaim responsibility for any injury to people or property resulting from any ideas, methods, instructions or products referred to in the content. |
© 2023 by the authors. Licensee MDPI, Basel, Switzerland. This article is an open access article distributed under the terms and conditions of the Creative Commons Attribution (CC BY) license (https://creativecommons.org/licenses/by/4.0/).
Share and Cite
Soler, G.; Ouedraogo, Z.G.; Goumy, C.; Lebecque, B.; Aspas Requena, G.; Ravinet, A.; Kanold, J.; Véronèse, L.; Tchirkov, A. Optical Genome Mapping in Routine Cytogenetic Diagnosis of Acute Leukemia. Cancers 2023, 15, 2131. https://doi.org/10.3390/cancers15072131
Soler G, Ouedraogo ZG, Goumy C, Lebecque B, Aspas Requena G, Ravinet A, Kanold J, Véronèse L, Tchirkov A. Optical Genome Mapping in Routine Cytogenetic Diagnosis of Acute Leukemia. Cancers. 2023; 15(7):2131. https://doi.org/10.3390/cancers15072131
Chicago/Turabian StyleSoler, Gwendoline, Zangbéwendé Guy Ouedraogo, Carole Goumy, Benjamin Lebecque, Gaspar Aspas Requena, Aurélie Ravinet, Justyna Kanold, Lauren Véronèse, and Andrei Tchirkov. 2023. "Optical Genome Mapping in Routine Cytogenetic Diagnosis of Acute Leukemia" Cancers 15, no. 7: 2131. https://doi.org/10.3390/cancers15072131
APA StyleSoler, G., Ouedraogo, Z. G., Goumy, C., Lebecque, B., Aspas Requena, G., Ravinet, A., Kanold, J., Véronèse, L., & Tchirkov, A. (2023). Optical Genome Mapping in Routine Cytogenetic Diagnosis of Acute Leukemia. Cancers, 15(7), 2131. https://doi.org/10.3390/cancers15072131