The authors wish to make the following corrections to this paper [1]:
In the original article, there were mistakes in Figure 3A, Figure 5B and Table 1 as published.
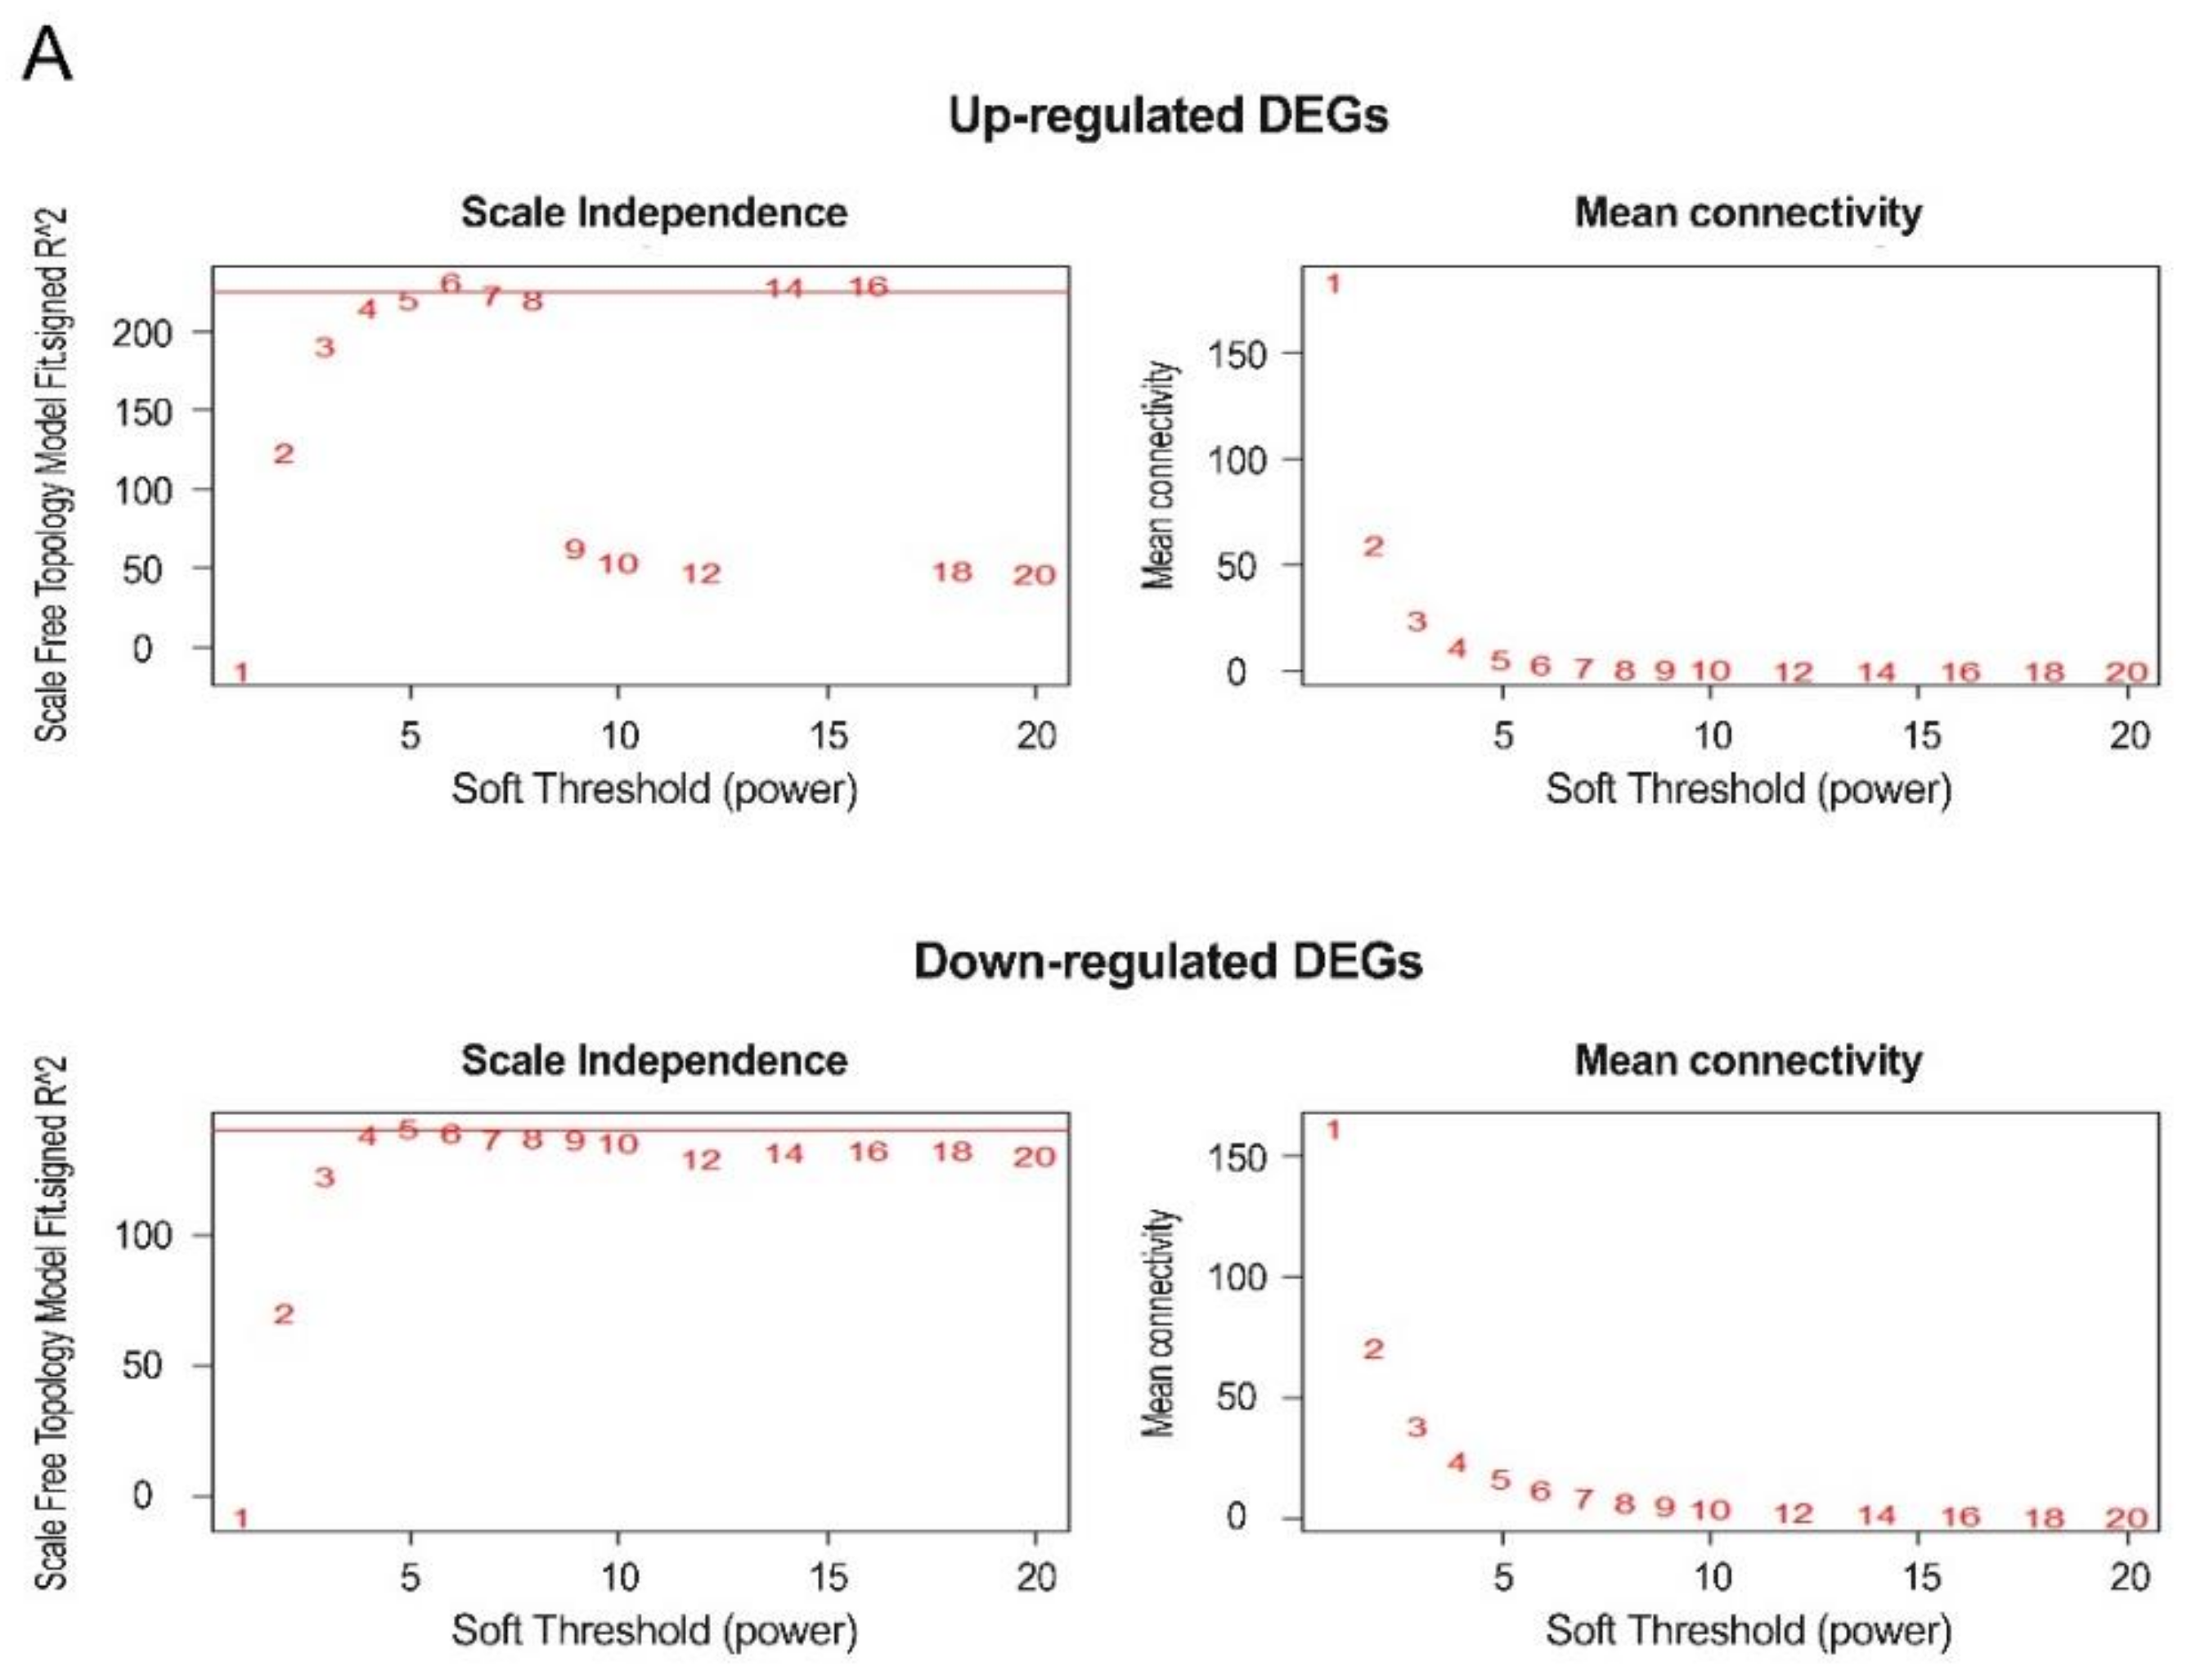
Firstly, the authors wrote incorrect units on the Y axis in Figure 3A. This was due to a mistake in the figure editing.
Thus, the original Figure 3A listed below:
should be replaced with the following version:
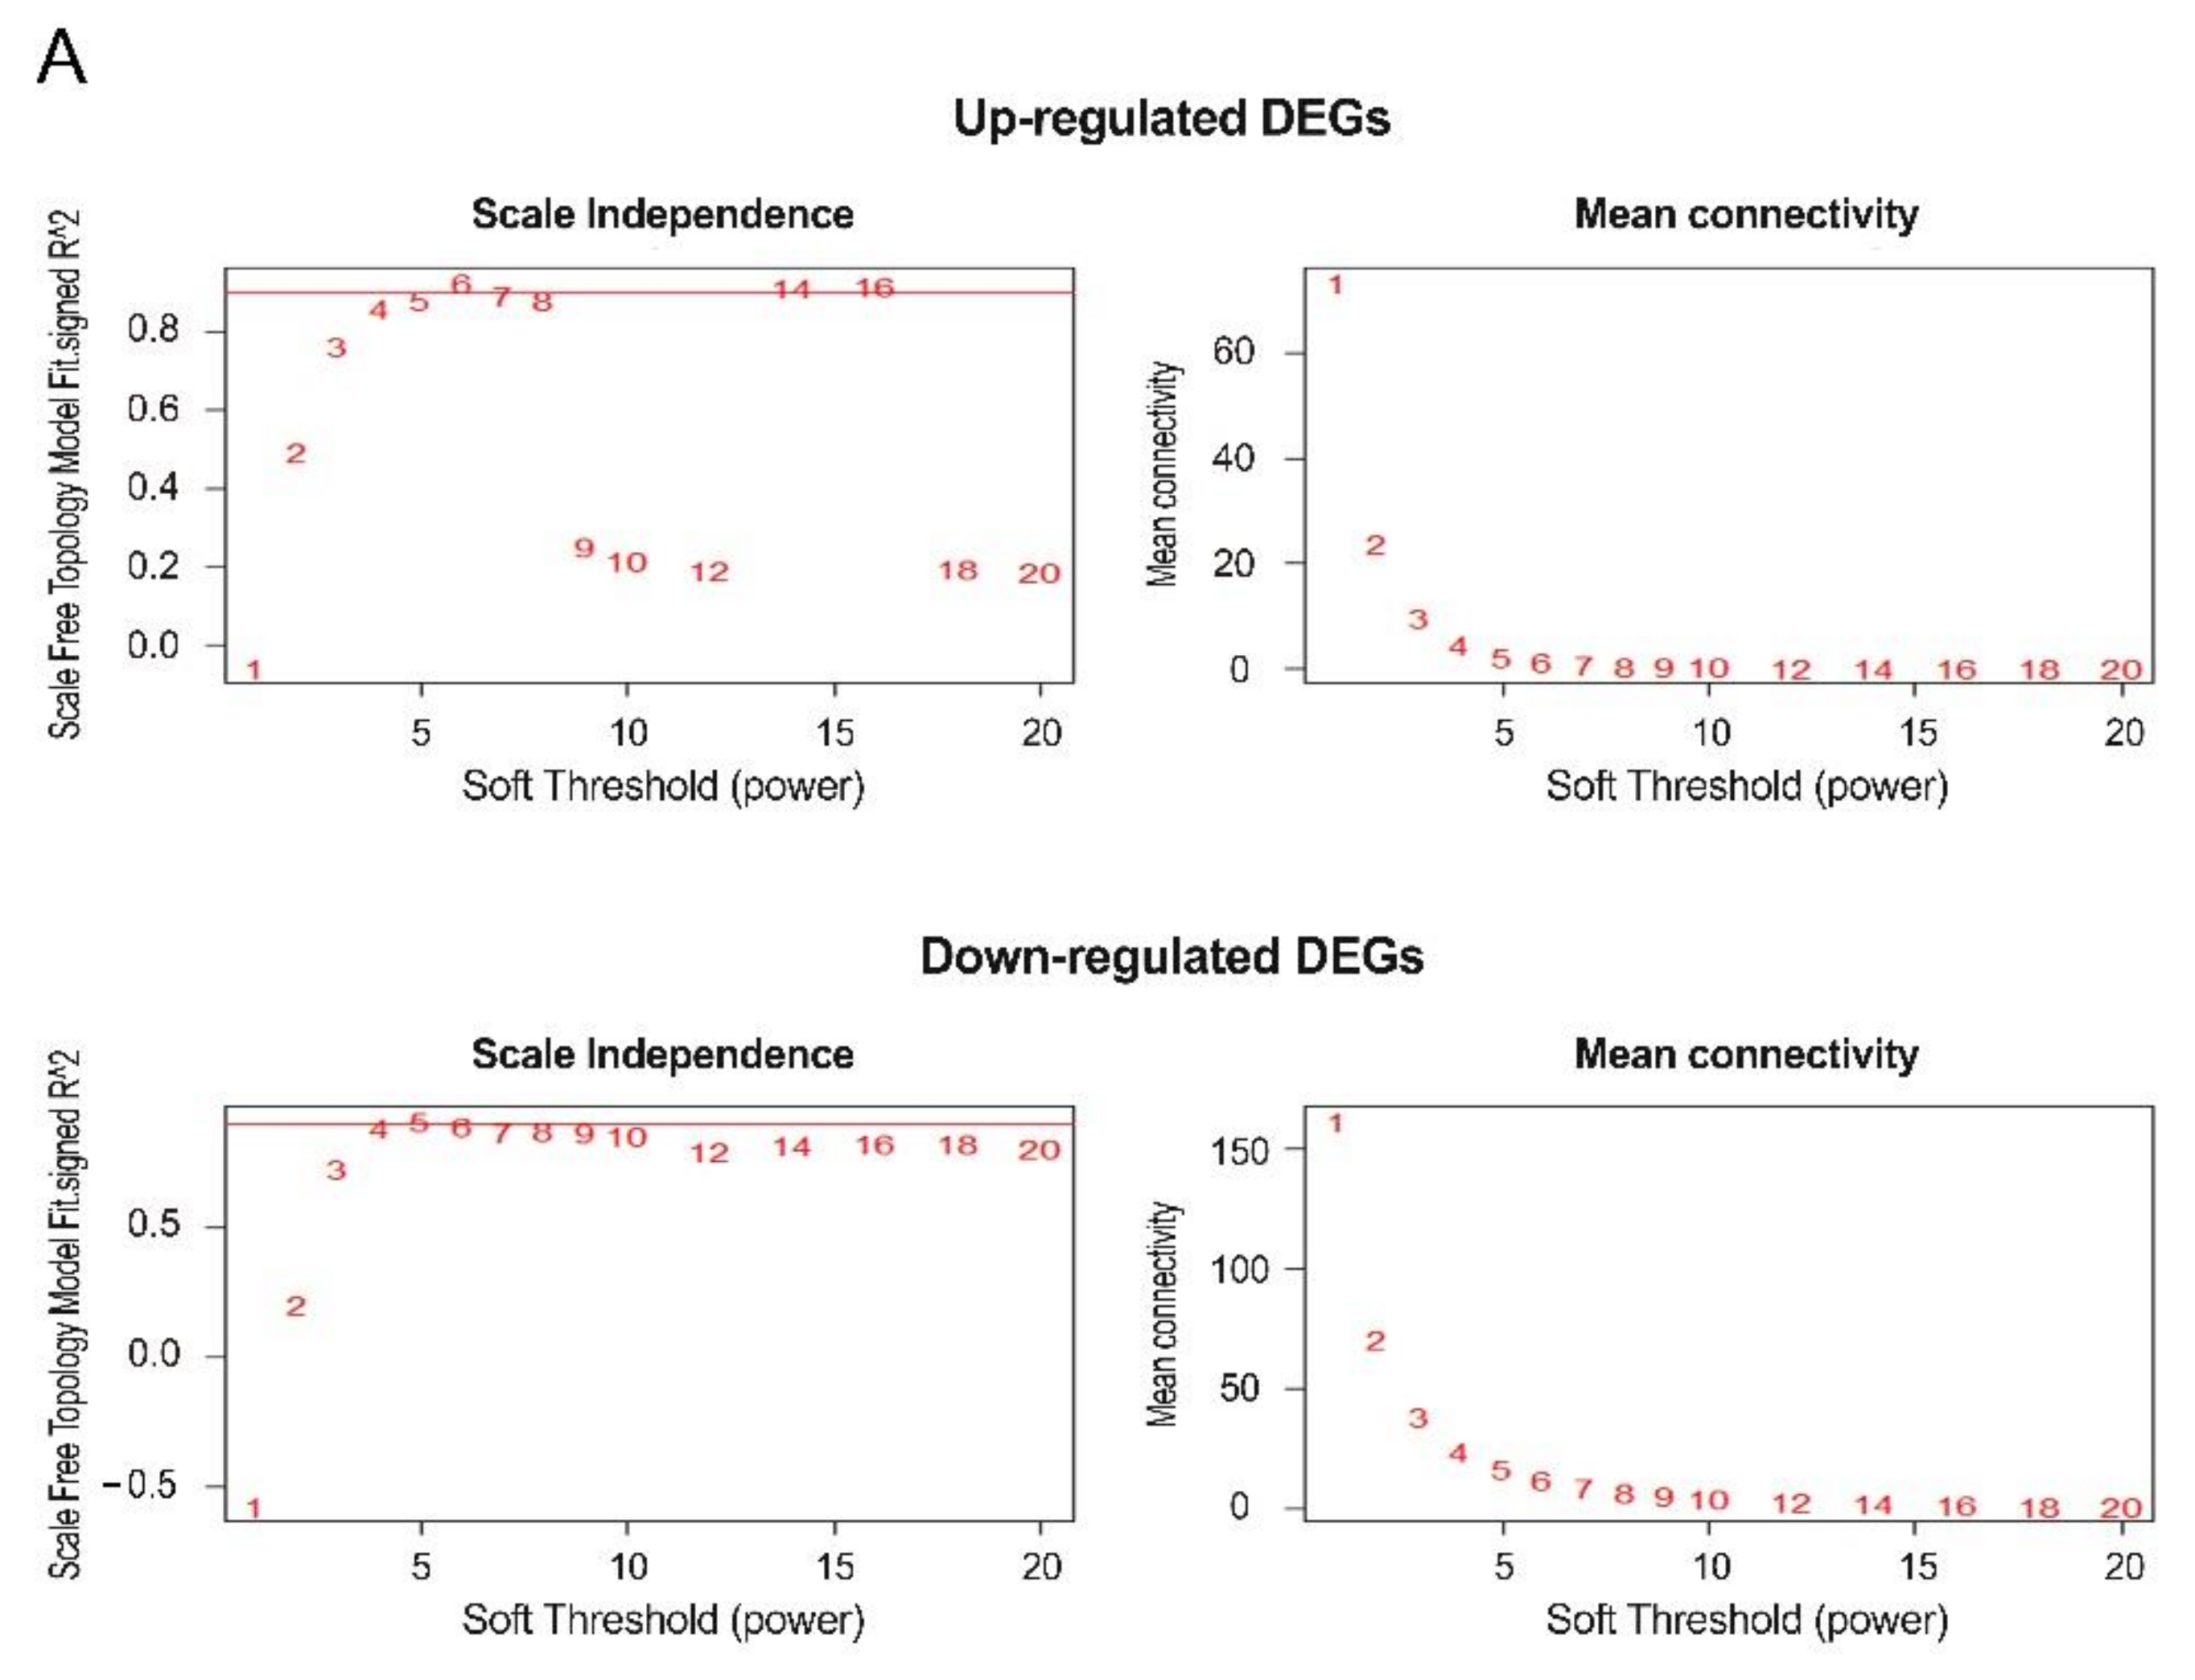
Secondly, the authors wrote p-value incorrectly in Figure 5B. This was also due to a mistake in the figure editing. Additionally, we would like to add the corresponding indication (“Table 2”) in result Section 3.4 and to replace the corresponding indication (“Figures 5B” to “Figure 5”) in discussion section to help our readers understand better.
The following sentence in result Section 3.4:
“In addition, in the data of patients extended to lower grade glioma, a higher number of non-coding RNAs in the ceRNA network showed a difference in OS rate according to the expression level.”
should be replaced with:
“In addition, in the data of patients extended to lower grade glioma, a higher number of non-coding RNAs in the ceRNA network showed a difference in OS rate according to the expression level (Table 2).”
The following sentence in the discussion section:
“Characteristically, the difference in survival rate among patients according to actual 1p/19q codeletion subtypes in the OD data of TCGA was not statistically significantly separated, but a difference of survival rate in the group as per the expression level of ceRNA was divided (Figure 5B).”
should be replaced with:
“Characteristically, the difference in survival rate among patients according to actual 1p/19q codeletion subtypes in the OD data of TCGA was not statistically significantly separated, but a difference of survival rate in the group as per the expression level of ceRNA was divided (Figure 5).”
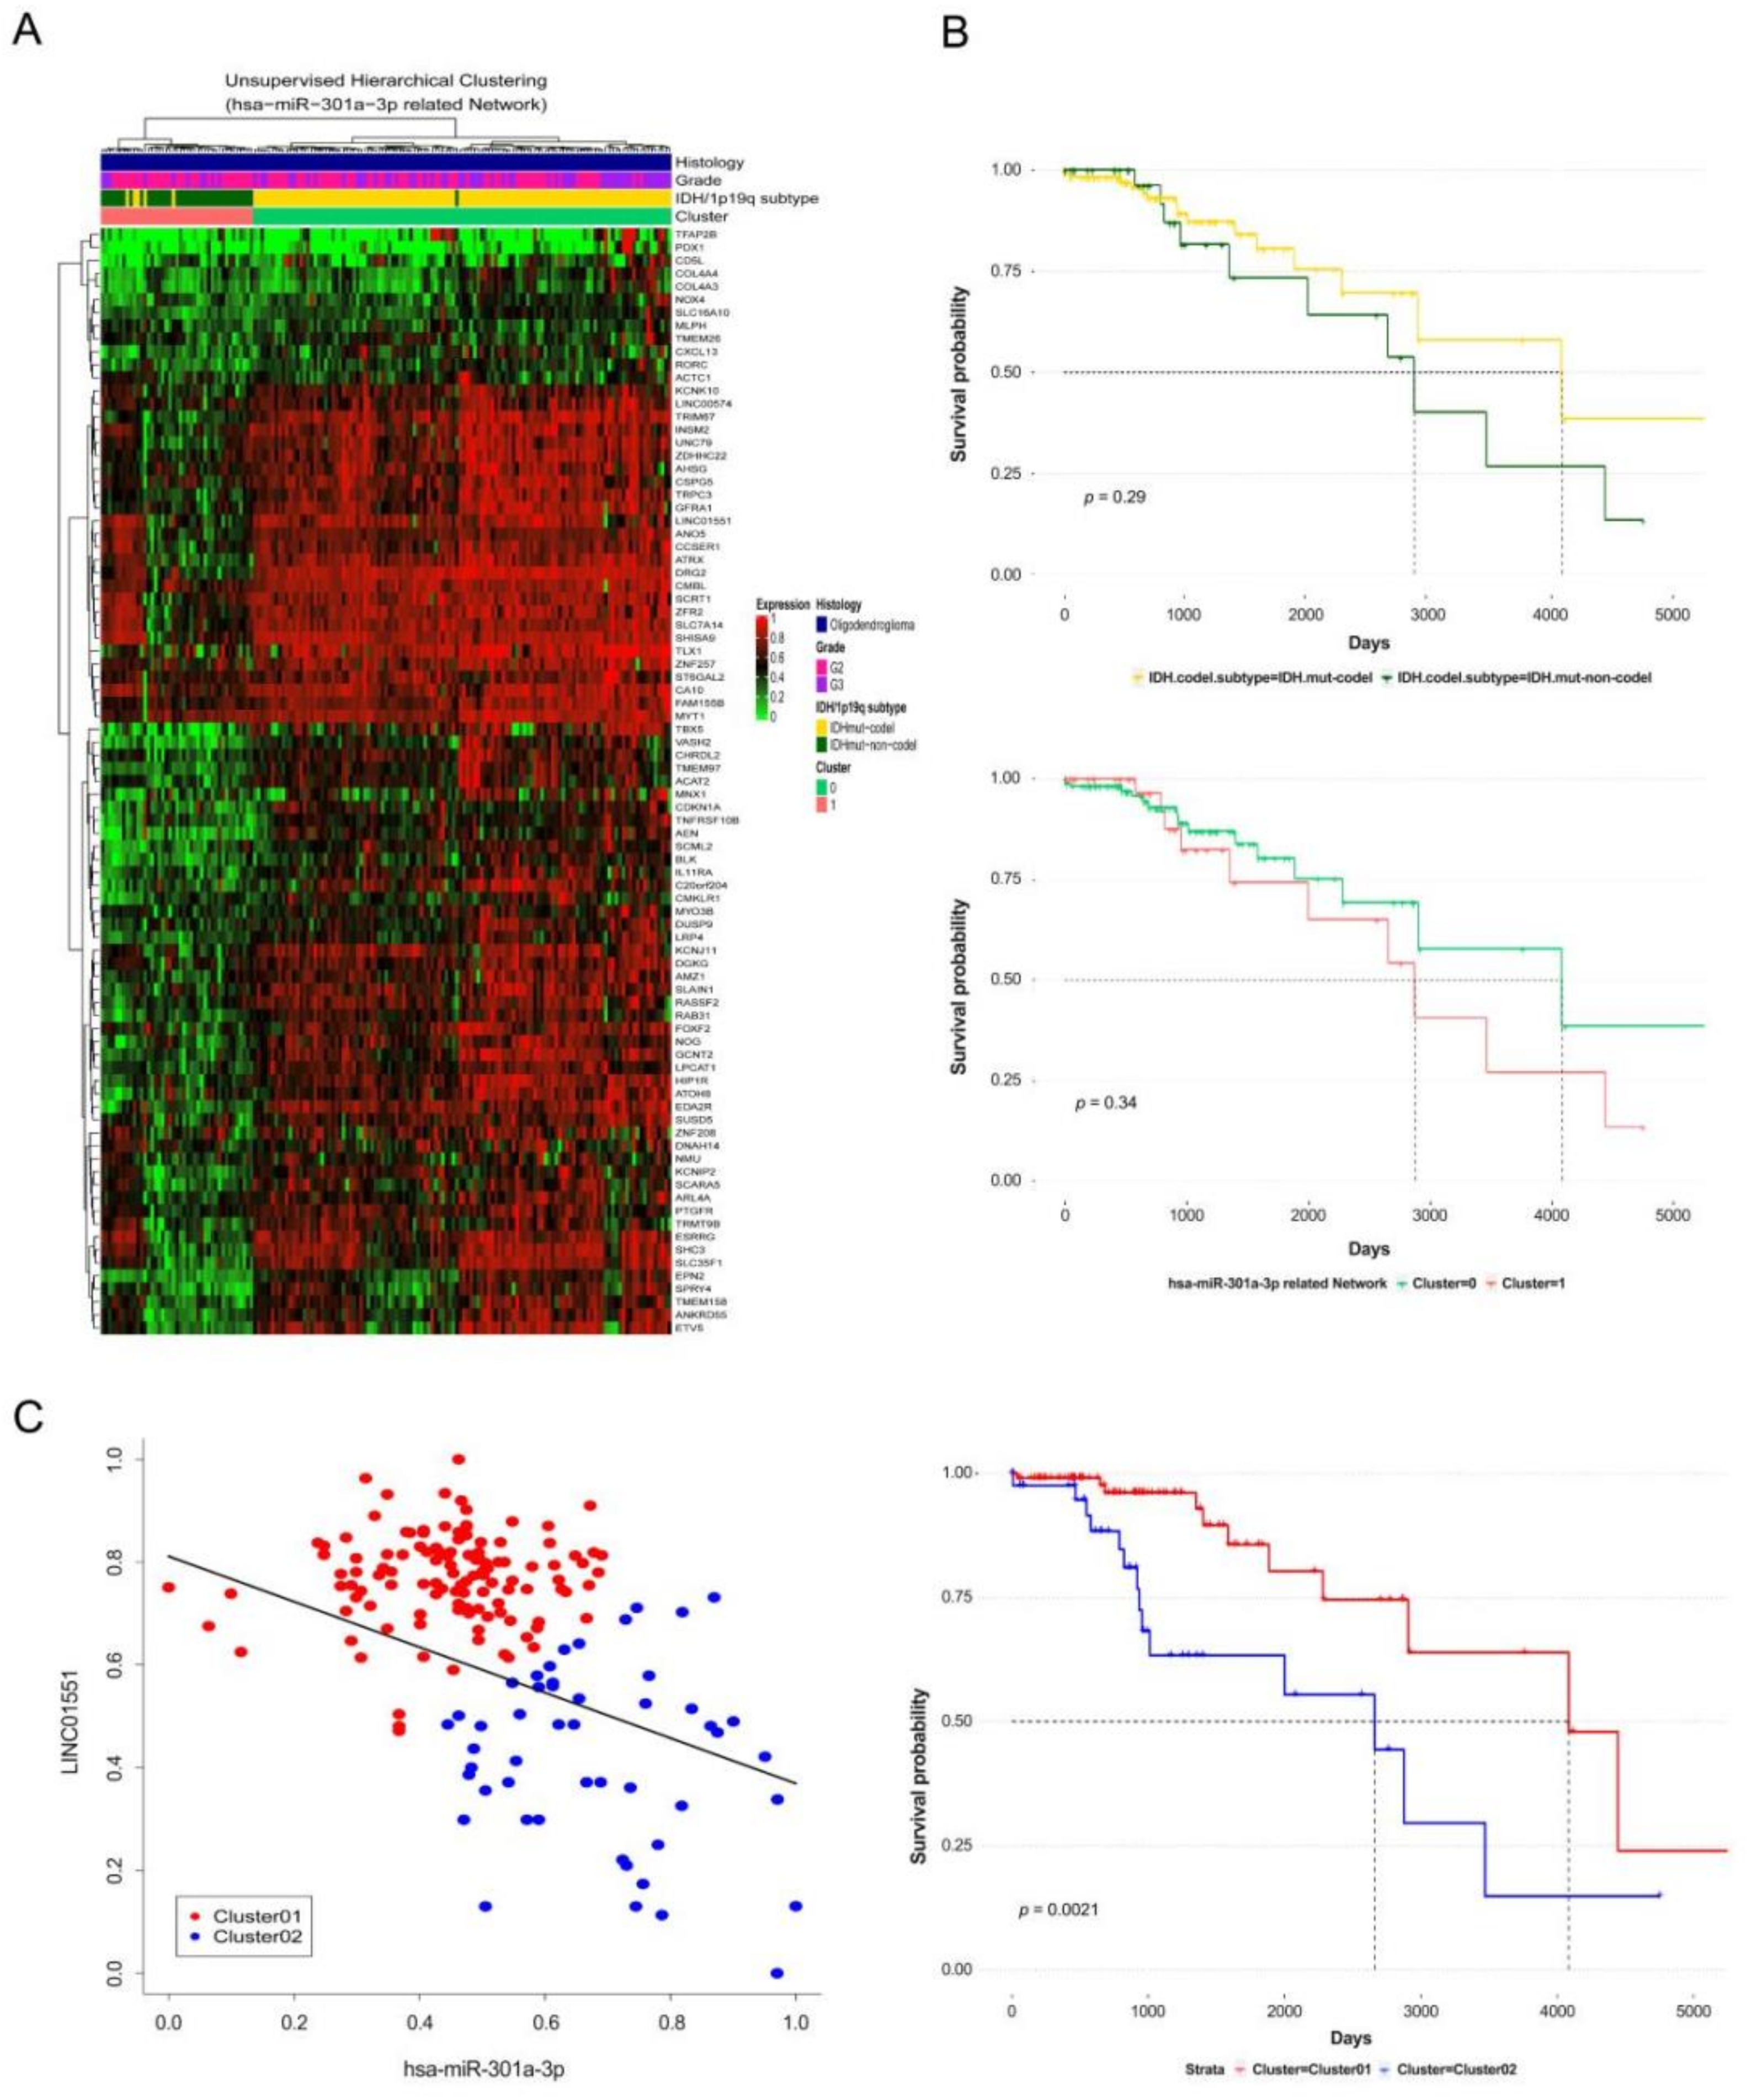
Furthermore, the original Figure 5 listed below:

should be replaced with the following version:
Finally, there was an alignment error in the results in Table 1, which was corrected. The values in Table 1 were misaligned; however, every network listed in Table 1 is the result of passing the threshold of the adjusted rand index (ARI), and since the correct information was already included in Table S1, the misaligned results do not affect our research results.
The original version of Table 1 is:

Table 1.
Compare with Oligodenroglioma and Lower grade glioma using by adjusted rand index (ARI) evaluation of ceRNA network.
Table 1.
Compare with Oligodenroglioma and Lower grade glioma using by adjusted rand index (ARI) evaluation of ceRNA network.
| Network | Source miRNAs | No. Target Coding Gene | No. Target Non-Coding Gene | ARI | |
|---|---|---|---|---|---|
| Oligodenroglioma (k* = 2) | Lower Grade Glioma (k* = 3) | ||||
| Network01 | hsa-miR-296-5p | 78 | 6 | 0.872 | 0.724 |
| Network02 | hsa-miR-455-3p | 68 | 1 | 0.692 | 0.671 |
| Network03 | hsa-miR-760 | 92 | 1 | 0.896 | 0.761 |
| Network04 | hsa-miR-1298-5p | 43 | 4 | 0.871 | 0.747 |
| Network05 | hsa-miR-197-3p | 78 | 5 | 0.872 | 0.770 |
| Network06 | hsa-miR-301a-5p | 25 | 2 | 0.801 | 0.756 |
| Network07 | hsa-miR-1262 | 62 | 2 | 0.801 | 0.497 |
| Network08 | hsa-miR-186-5p | 99 | 9 | 0.921 | 0.806 |
| Network09 | hsa-miR-301a-3p | 83 | 2 | 0.847 | 0.834 |
| Network10 | hsa-miR-383-5p | 97 | 1 | 0.872 | 0.728 |
| Network11 | hsa-miR-2114-3p | 30 | 2 | 0.778 | 0.637 |
| Network12 | hsa-miR-204-5p | 138 | 7 | 0.824 | 0.714 |
| Network13 | hsa-miR-7156-5p | 31 | 6 | 0.896 | 0.888 |
| Network14 | hsa-miR-92b-3p | 76 | 4 | 0.800 | 0.594 |
| Network15 | hsa-miR-3074-5p | 31 | 9 | 0.896 | 0.789 |
| Network16 | hsa-miR-1298-3p | 30 | 2 | 0.778 | 0.704 |
k*; Number of agglomerative cluster using for ARI.
should be replaced with the following Table 1:
Table 1.
Comparison of oligodenroglioma and lower grade glioma using the adjusted rand index (ARI) evaluation of the ceRNA network.
The authors apologize for any inconvenience caused and state that the scientific conclusions are unaffected. The original article has been updated.
Conflicts of Interest
The authors declare no conflict of interest.
Reference
- Ahn, J.W.; Park, Y.; Kang, S.J.; Hwang, S.J.; Cho, K.G.; Lim, J.; Kwack, K. CeRNA Network Analysis Representing Characteristics of Different Tumor Environments Based on 1p/19q Codeletion in Oligodendrogliomas. Cancers 2020, 12, 2543. [Google Scholar] [CrossRef]
Publisher’s Note: MDPI stays neutral with regard to jurisdictional claims in published maps and institutional affiliations. |
© 2021 by the authors. Licensee MDPI, Basel, Switzerland. This article is an open access article distributed under the terms and conditions of the Creative Commons Attribution (CC BY) license (http://creativecommons.org/licenses/by/4.0/).