Article

Cancer Cell Acid Adaptation Gene Expression Response Is Correlated to Tumor-Specific Tissue Expression Profiles and Patient Survival

1
The Bioinformatics Centre, Department of Biology, University of Copenhagen, DK2200 Copenhagen, Denmark
2
Biotech Research and Innovation Centre, University of Copenhagen, DK2200 Copenhagen, Denmark
3
Section for Cell Biology and Physiology, Department of Biology, University of Copenhagen, DK2100 Copenhagen, Denmark
4
Cell Death and Metabolism, Center for Autophagy, Recycling and Disease, Danish Cancer Society Research Center, DK2100 Copenhagen, Denmark
*
Authors to whom correspondence should be addressed.
These authors contributed equally to this work.
Cancers 2020, 12(8), 2183; https://doi.org/10.3390/cancers12082183
Submission received: 17 June 2020 / Revised: 21 July 2020 / Accepted: 31 July 2020 / Published: 5 August 2020
(This article belongs to the Special Issue New Insights into Tumour pH Regulation)

Abstract

:
The acidic pH of the tumor microenvironment plays a critical role in driving cancer development toward a more aggressive phenotype, but the underlying mechanisms are unclear. To this end, phenotypic and genotypic changes induced by adaptation of cancer cells to chronic acidosis have been studied. However, the generality of acid adaptation patterns across cell models and their correlation to the molecular phenotypes and aggressiveness of human cancers are essentially unknown. Here, we define an acid adaptation expression response shared across three cancer cell models, dominated by metabolic rewiring, extracellular matrix remodeling, and altered cell cycle regulation and DNA damage response. We find that many genes which are upregulated by acid adaptation are significantly correlated to patient survival, and more generally, that there are clear correlations between acid adaptation expression response and gene expression change between normal and tumor tissues, for a large subset of cancer patients. Our data support the notion that tumor microenvironment acidity is one of the key factors driving the selection of aggressive cancer cells in human patient tumors, yet it also induces a growth-limiting genotype that likely limits cancer cell growth until the cells are released from acidosis, for instance during invasion.

1. Introduction

Invasive cancers, regardless of their origin, acquire characteristic phenotypic traits during their development, including self-sufficiency with respect to growth signals, apoptosis evasion, profound metabolic changes, chemotherapy resistance, and the ability to invade and spread to secondary niches [1]. These changes are the result of a clonal evolution process, in which the combination of somatic mutations and evolutionary selection pressure leads to the preferential expansion of clones of cells that are particularly fit for survival and expansion in the harsh tumor microenvironment [2,3,4].
The microenvironmental conditions in solid tumors are a result of rapid cancer cell proliferation and growth which, in combination with insufficient vascularization, leads to hypoxia, glucose depletion, accumulation of lactate and other metabolites, and profound acidosis. While serum pH is around 7.4, corresponding to a H+ concentration ([H+]) of ~40 nM, the extracellular pH (pHe) in tumors can reach 6.2–6.8, i.e., [H+] ~630–160 nM [5,6,7,8,9]. A plethora of studies have investigated the impact of hypoxia on cancer development and the therapeutic potential of targeting hypoxia-inducible factors (reviewed in, e.g., [10]). In contrast, the role of extracellular acidosis in this process remains incompletely understood. Recent studies, mostly employing the acid adaptation of cultured cancer cells, have supported the hypothesis that extracellular acidosis is a driver of cancer aggressiveness. Thus, adaptation to acidosis was shown to favor epithelial-to-mesenchymal transition (EMT) [11,12], invasiveness and metastasis in cell culture and xenograft models of melanoma, cervical cancer, and breast and colon cancer [13,14,15,16]. Accordingly, studies of mouse breast tumors in vivo showed that acidosis (detected by pH (low) insertion peptide (pHLIP) labeling), carbonic anhydrase (CA9) expression and plasma membrane-localized LAMP2 correlated with invasive features such as the absence of laminin and the expression of matrix metalloproteinase (MMP)-9 and -14 [17]. Other phenotypic changes induced by the adaptation of cancer cells to acidosis include a shift from glycolytic metabolism toward increased glutaminolysis, fatty acids uptake and β-oxidation [9,15,18,19,20]. Cancer cell proliferation and growth are, however, generally reduced, or unaltered, as long as acidic pHe is maintained [12,13].
The molecular mechanisms through which growth under chronic extracellular acidosis leads to this profound rewiring of cancer cells are poorly understood. While several studies have examined global changes in gene expression upon acidosis or lactic acidosis [15,21,22], the overlap between the changes induced by acidosis and those found in patient tumors, and the correlation of acidosis-responsive gene expression to overall patient survival, have to our knowledge never been comprehensively examined. Because acidic growth seems to drive at least some phenotypes akin to those found in highly aggressive cancers, an important question is whether there is a generic response to acid adaptation that is shared between cancer cells, and whether this response reflects the expression changes observed between tumors and normal tissues in patient samples. Such correlations may indicate that an acidic microenvironment can increase cancer aggressiveness, which in turn should be correlated to patient survival.
In the present study, by applying RNA-seq to three acid-adapted cancer cell lines we identify a shared acid adaptation response gene signature, which we compare with rich expression data from human tumors and normal tissue across many cancers, and overall survival data from the same patients. Our results reveal significant overlaps between gene signatures of acid-adapted cells and tumor tissues for subsets of patients, and we identify sets of shared genes from these signatures that correlate significantly—positively as well as negatively—with patient survival.

2. Results

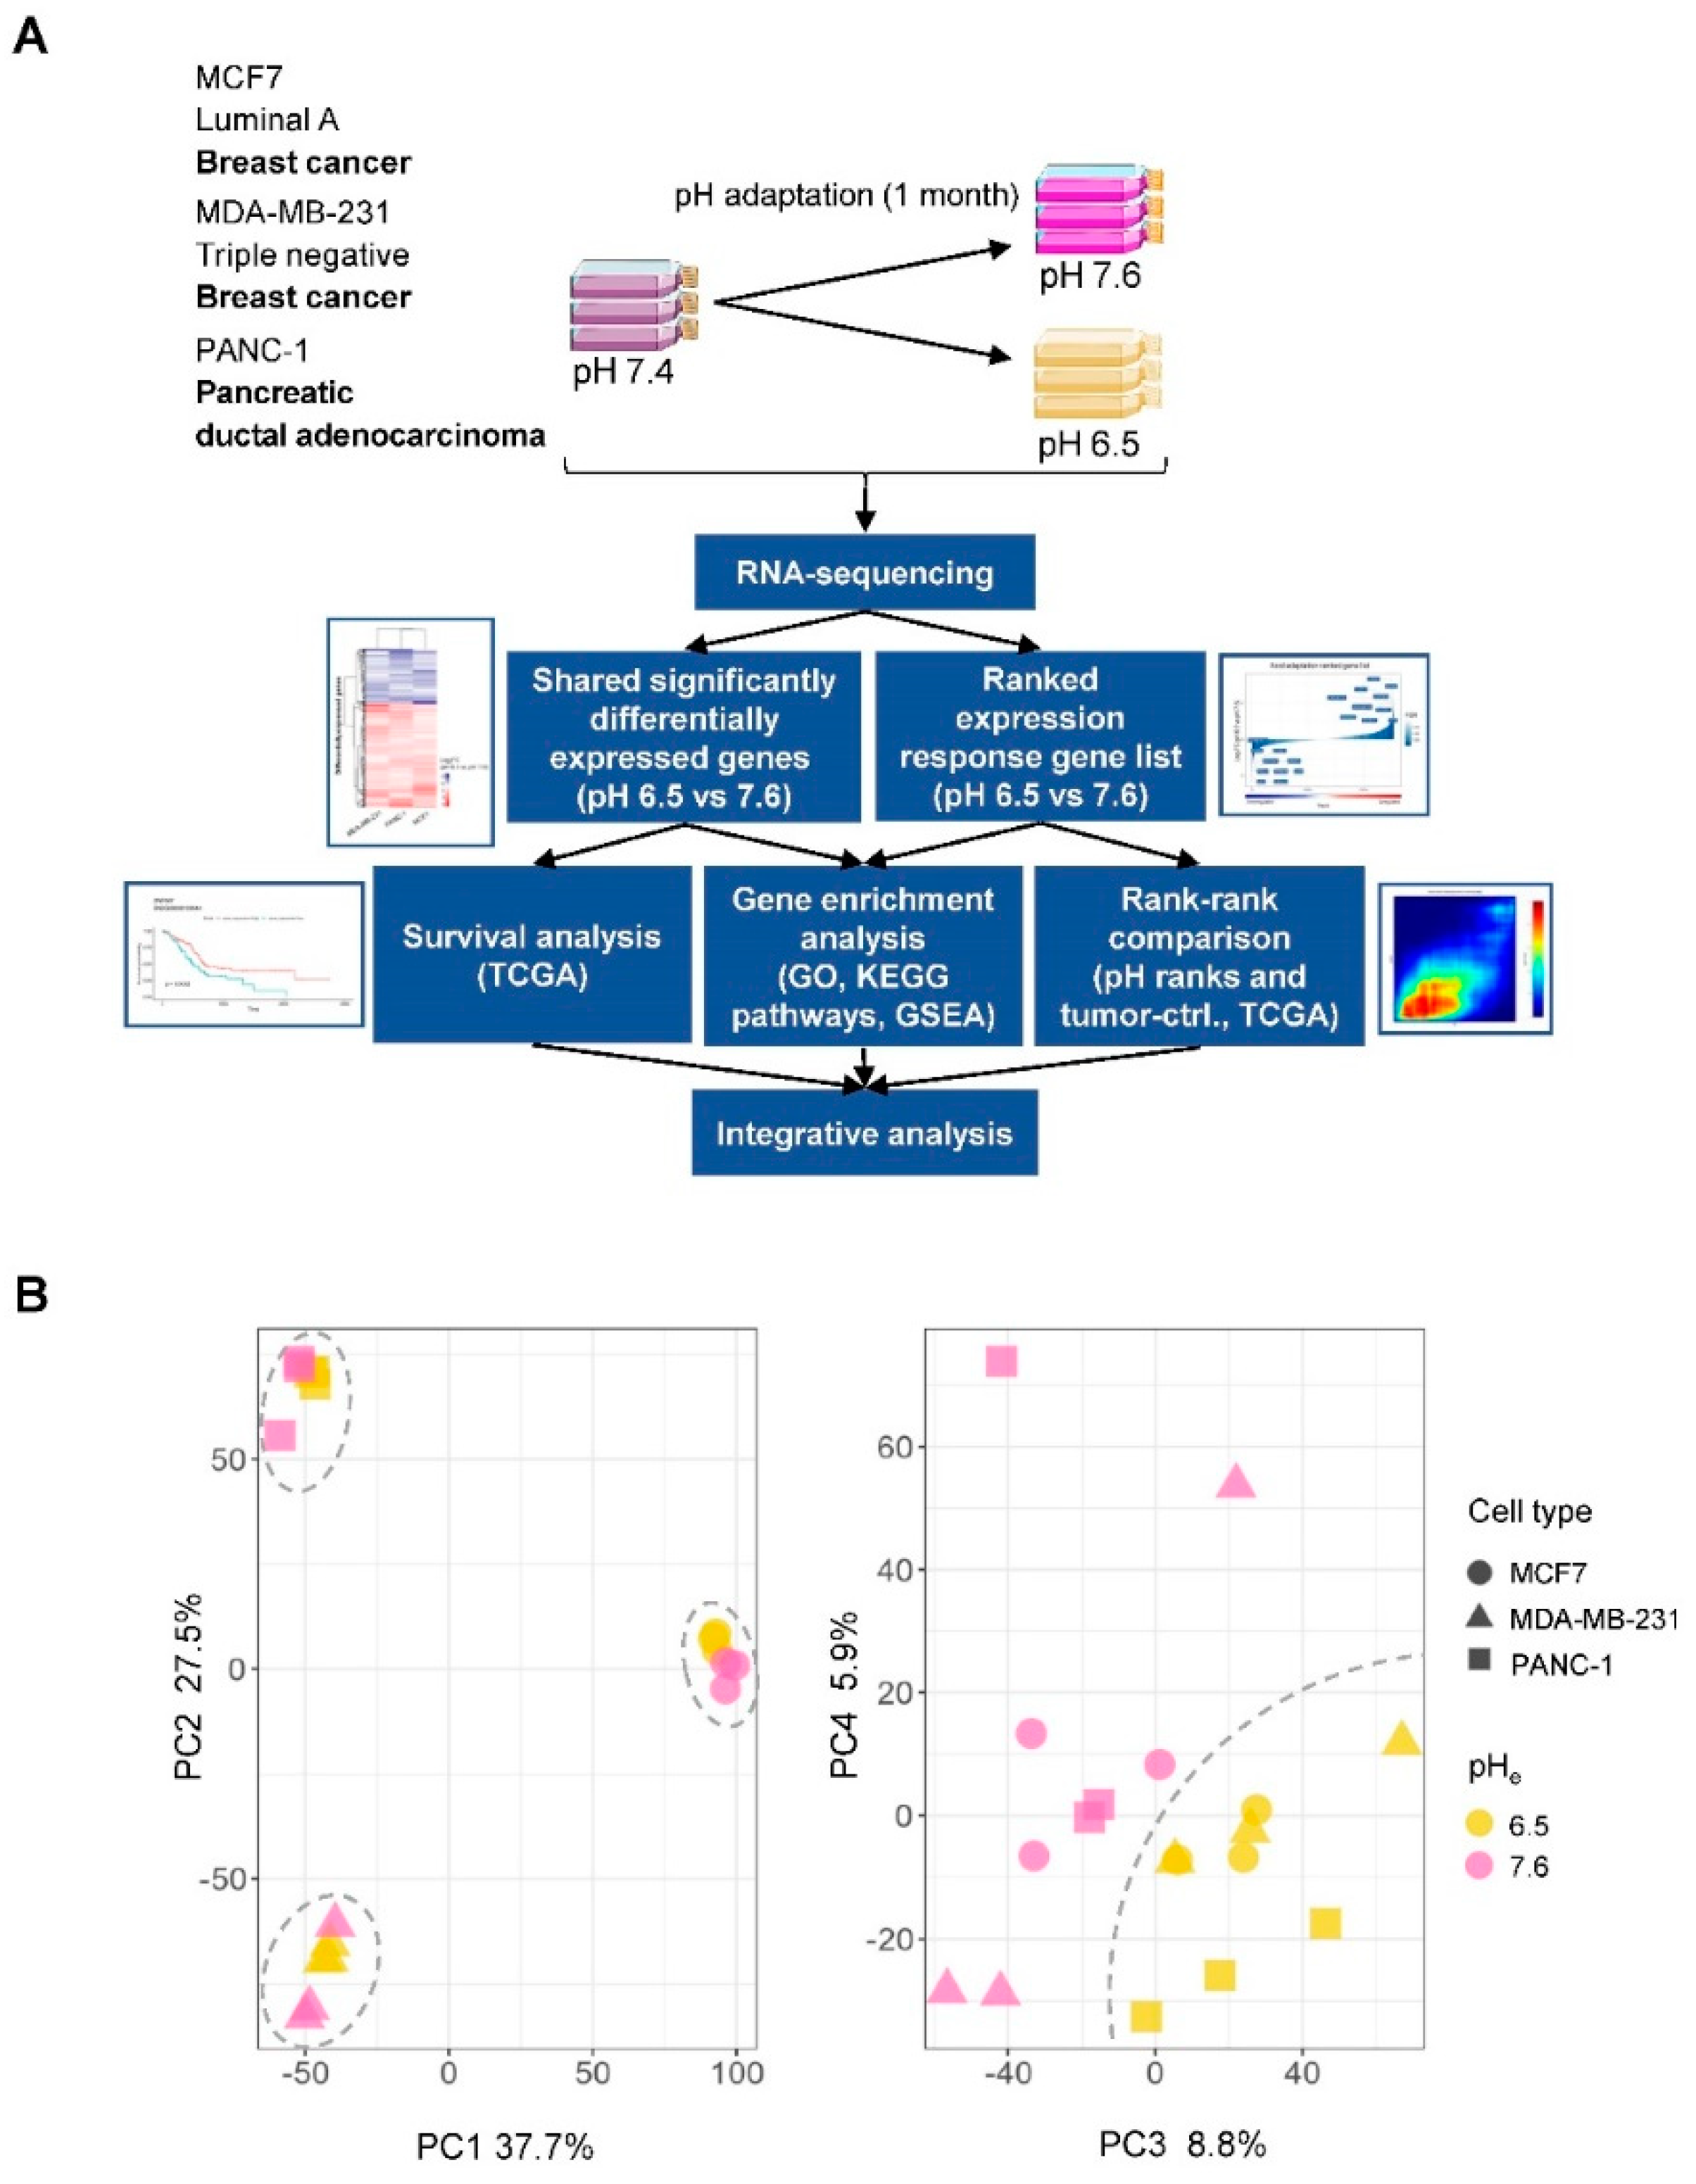
2.1. Gene Expression Changes Induced by Chronic Adaptation of Cancer Cells to Acidosis

To understand the changes in gene expression profile induced by changes in environmental pH (pHe) across multiple cancer cell types, rather than in a single cancer cell type, we adapted three different cancer cell lines to growth at either pH 7.6 or 6.5 by adjusting the HCO3 concentration of the medium [23], followed by culturing at the respective pH for at least 1 month at 5% CO2. Cells were lysed, and RNA was isolated and subjected to global RNA-seq in triplicates (Figure 1A, top). Principal component (PC) analysis of gene expression estimates from RNA-seq libraries showed that PC1 and PC2 separated the three cell lines, while PC3 and PC4 separated acid-adapted cells from control cells, indicating a shared acid adaptation response across the three cell lines (Figure 1B). Given this, we set out to analyze the shared acid adaptation response, and compared it to tumor-specific expression profiles and patient survival using a strategy outlined in Figure 1A.

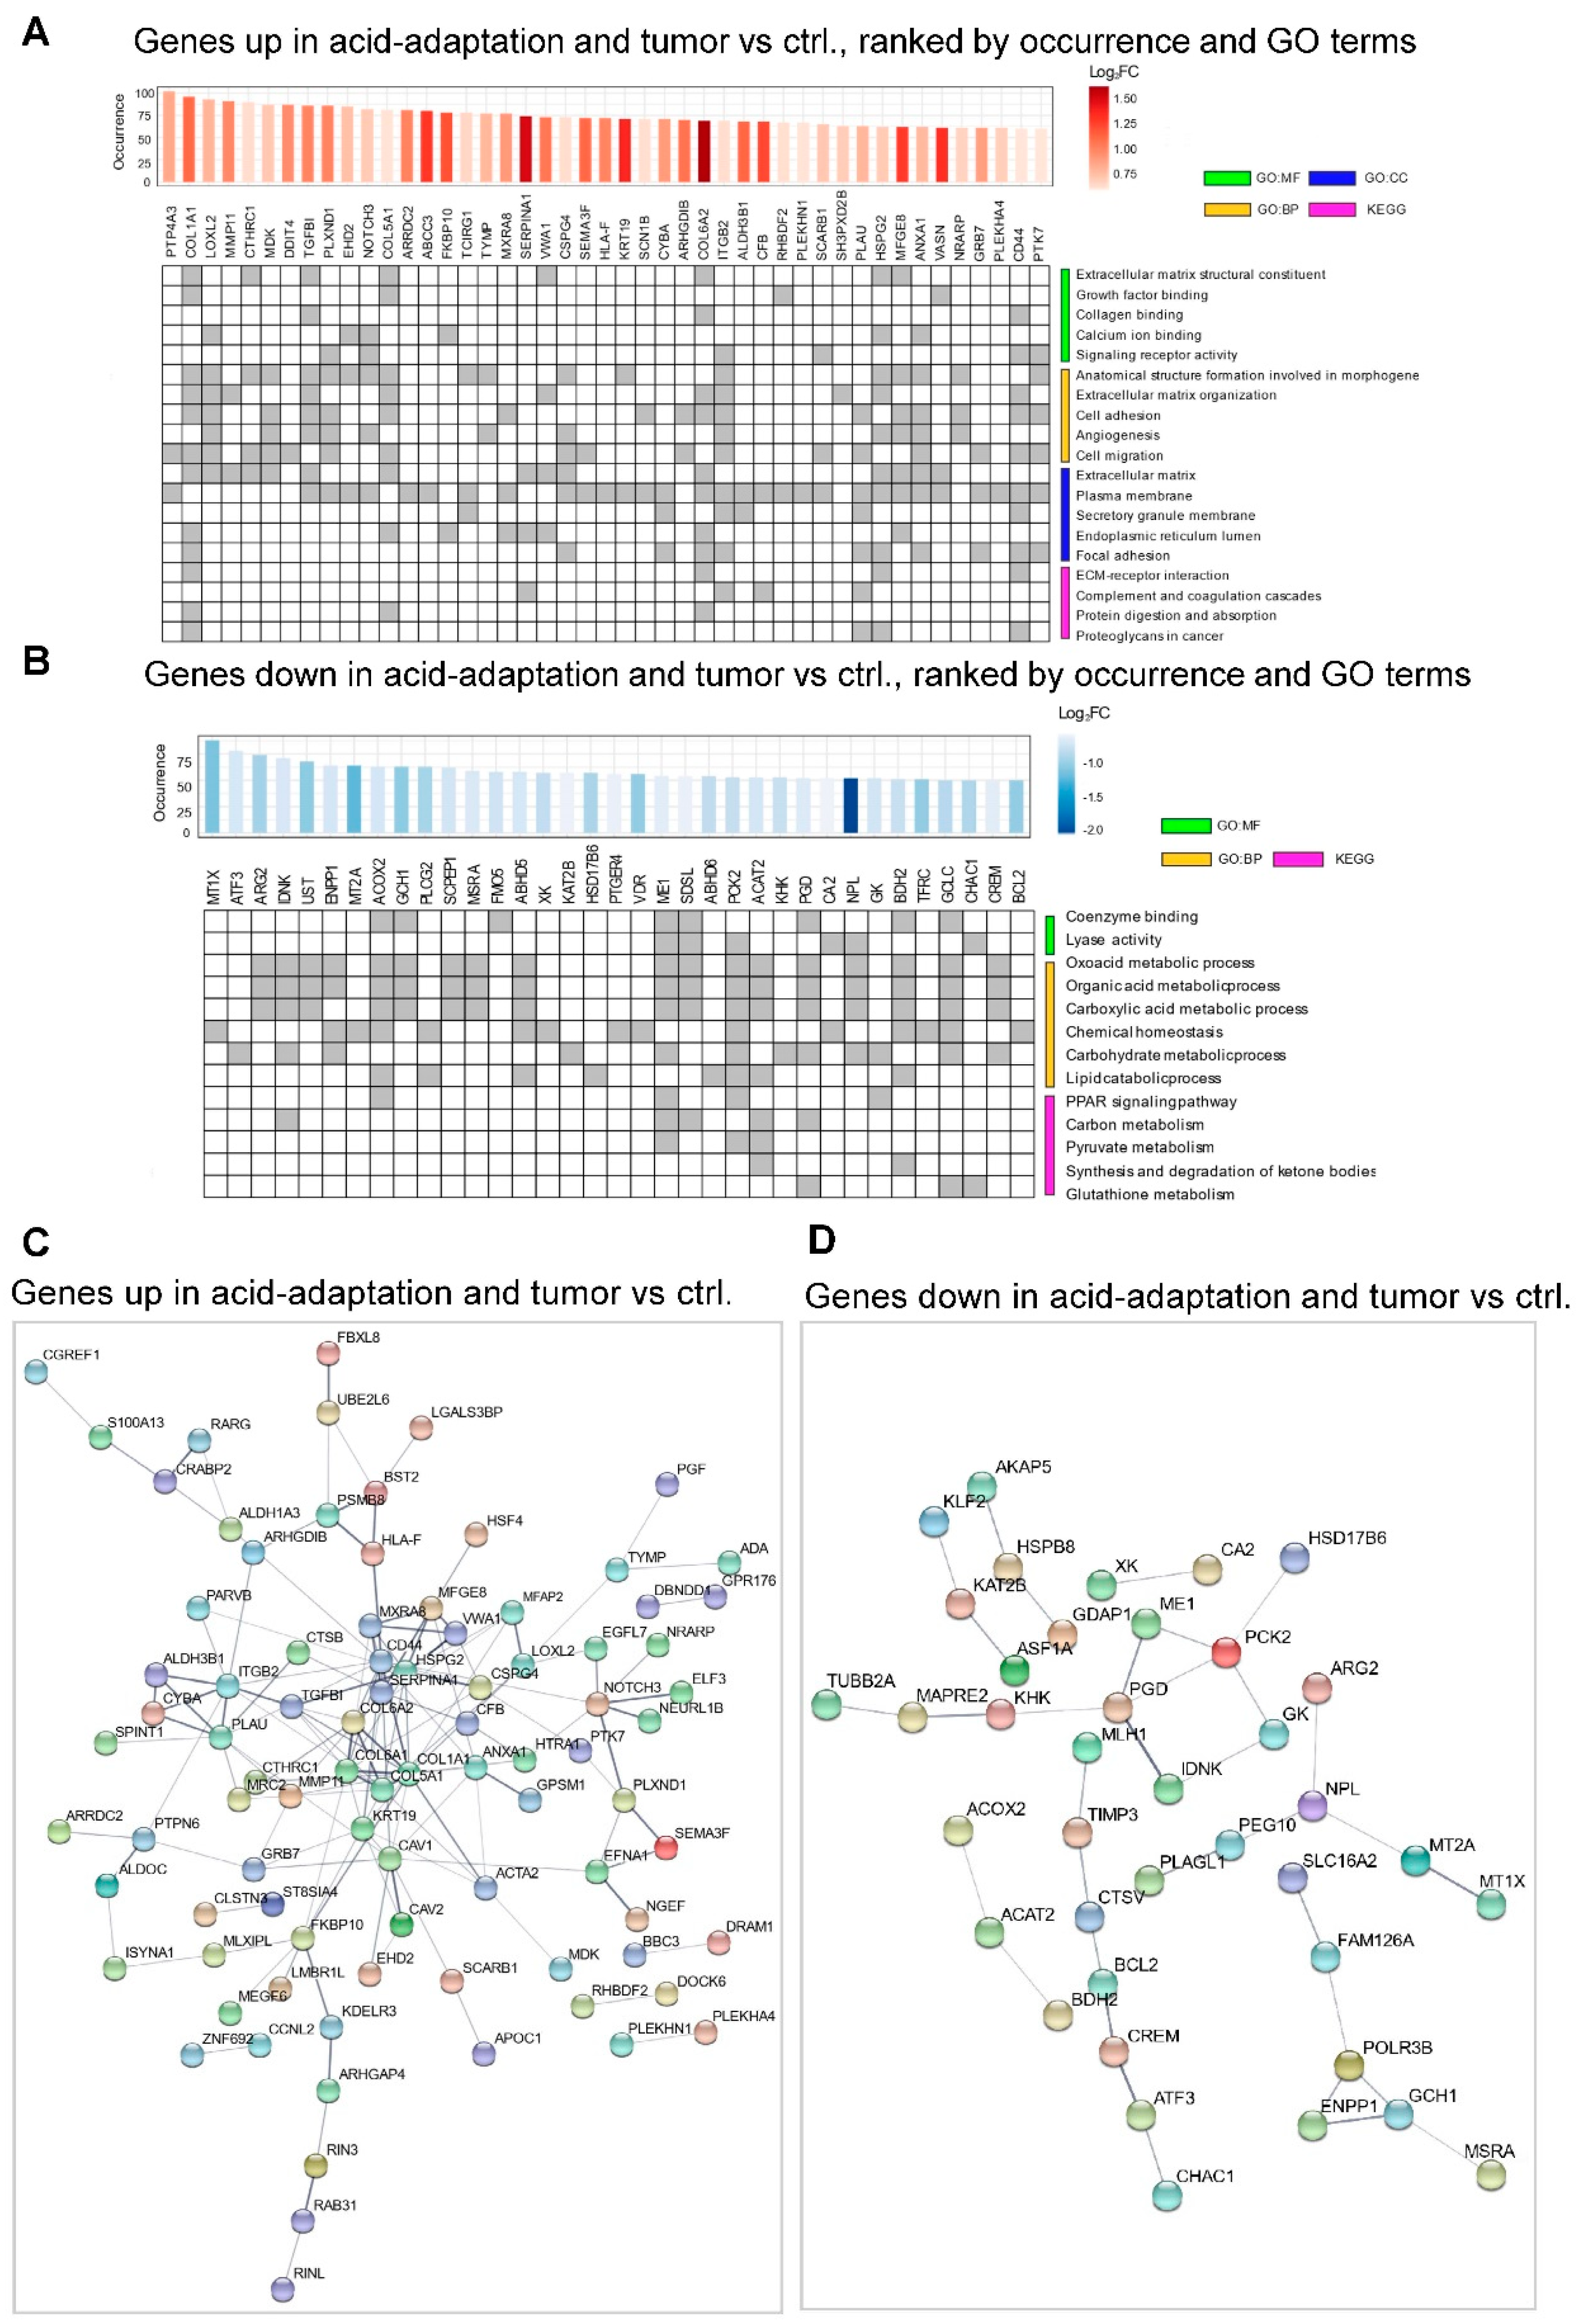
2.2. Identification of a Shared Acid Adaptation Gene Response Profile

The Limma method was used to identify genes with a significant and shared expression response to acid adaptation using a linear model (See Materials and Methods). Out of the 12,750 expressed genes, 478 were significantly upregulated, and 255 were downregulated across all three cell lines (abs (log2 fold change, log2FC) > 0.5, False Discovery Rate (FDR) < 0.05). Figure 2A shows a shared log2FC-ranked list of all expressed genes, colored by significance, while Figure 2B shows the mean log2FC in each cell line across triplicates for differentially expressed genes. Tables S1 and S2 list all significantly up- and downregulated genes, respectively. The response to pH was overall highly similar between the three cancer cell lines, although the magnitude of change in the expressions of specific genes differed between cell lines (Figure 2B). Among the top 10 upregulated genes was thioredoxin-interacting protein (TXNIP, also known as Vitamin D3-upregulated protein 1, VDUP1), previously reported to be upregulated in response to extracellular acidosis [22,24] (Figure 2A). The TXNIP protein has several important physiological roles: it is a potent negative regulator of glycolysis, and involved in redox homeostasis, differentiation and growth. TXNIP is generally downregulated in cancers, at least in part because it is negatively regulated by oncogenes such as Myc and ErbB2, and low TXNIP expression is associated with poor prognosis [25,26,27]. Confirming the relevance of this pathway, the TXNIP paralogs ARRDC2 and ARRDC4 were also among the significantly upregulated genes (Table S1).
Interestingly, several cation channels previously implicated in cancer development were significantly upregulated. For example, the α subunit of the epithelial sodium channel ENaC (SCNN1A) and the γ4 subunit of the voltage-dependent calcium channel (CACNG4) (Figure 2A) were among the 10 most upregulated genes. The genes encoding the acid-stimulated ion channel-1 (ASIC1), and the β1 subunit of the voltage-gated sodium channel (SCN1B), were also significantly upregulated in acid-adapted cells (Table S1). In accordance with our findings, ASIC1 and ASIC2 are upregulated in colorectal cancer cells subjected to acidosis [28]. ASICs and ENaC belong to the same channel family, and both ASIC1 [29] and ENaC [30] are acutely activated by acidic pH, and both channels are implicated in cancer development [11,31]. Similarly, both CACNG4 [32] and SCN1B [33] are upregulated in cancer tissue and their gene products have been assigned a role in cancer progression.
Other highly upregulated genes included interferon-induced transmembrane protein 1 (IFITM1), which, together with other interferon-regulated genes, are highly upregulated in several cancers and assigned key roles in driving aggressiveness and chemotherapy resistance [34,35]. In addition, the genes encoding Sushi-containing Domain-3 (SUSD3), an estrogen-regulated membrane-localized protein previously found to be upregulated by chronic acidosis [15] and to play a key role in breast cancer cell migration [36], and LARGE2, a bifunctional glycosyltransferase involved in proteoglycan modification and hence in cell–extracellular matrix (ECM) interaction [37], were among the 10 most upregulated genes (Figure 2A).
The 10 most downregulated genes across all three acid-adapted cell lines included, firstly, the gene encoding the multidomain scaffold protein A-kinase anchoring protein-5 (AKAP5, a.k.a. AKAP79/150). AKAP5 is a key regulator of cellular cAMP and Ca2+ signaling and, downstream from this, a plethora of physiological processes, including glucose metabolism [38]. AKAP5 is not widely linked to cancer in the literature, yet low AKAP5 expression was correlated with poor prognosis in some stomach adenocarcinomas [39]. NIBAN1, a.k.a. FAM129A, which was also downregulated by acidic growth, is frequently upregulated in cancers, favoring cell motility yet decreasing autophagy [40,41]. Furthermore, mucolipin-3 (MCOLN3) was strongly downregulated upon acidosis-induced selection. Interestingly, MCOLN3 codes for a predominantly endosomal Ca2+ channel of the TRP channel family, which is inhibited by acidic pH and plays important roles in endosomal Ca2+ and pH homeostasis [42]. Other genes strongly downregulated across all three cell lines included those coding for the tight junction protein cingulin (CGN), the E3 ubiquitin ligase TRIM36, and SYNE1 (a.k.a. Nesprin-1), a nuclear envelope protein.
Gene Ontology (GO) terms associated to ECM composition and remodeling, and lipid and carboxylic acid metabolism, were over-represented in the upregulated genes, while GO terms associated with cell proliferation, replication fork function and DNA repair were over-represented in the downregulated genes (Figure 2C). Furthermore, the upregulation of cation channels (Figure 2A and above) was reflected in GO term analysis (Table S3, while Table S4 shows the GO terms for downregulated genes). KEGG pathway analysis showed an over-representation of cytochrome P450-drug and xenobiotic metabolism, chemical carcinogenesis, propanoate metabolism and glutaminergic synapse pathways in the upregulated genes, while downregulated genes were over-represented in the cell cycle, DNA replication, homologous recombination, glutathione metabolism and Fanconi anemia pathways. Notably, a downregulated glutathione metabolism was previously reported in acid-adapted cells, and shown to reflect a shift from glutathione production towards utilization of glutamine as a metabolic fuel [18]. The ranked acid adaptation gene set from Figure 2A was used to complement the above GO analysis with gene set enrichment analysis (GSEA) using the SigDb database of gene sets (Figure 2D). This revealed a clear gene rank enrichment of several oncological gene sets: acid adaptation-upregulated genes were enriched for gene sets associated with increased migration and invasiveness, gene sets upregulated after expression of CyclinD1 (CCND1) (a key regulator of G1-S phase transition), and genes downregulated after mTOR inhibition (Figure 2D). The link to mTOR signaling is notable, given the key role of mTOR in metabolic control. The pH sensitivity of mTOR signaling has previously been assigned a role in the impact of acidosis on metabolism, albeit in a short-term study (i.e., not long enough for acid-induced selection) where cytoplasmic acidosis was found to inhibit mTOR signaling [43,44]. Acid adaptation-downregulated genes were, correspondingly, enriched in gene sets upregulated by mTOR inhibition, or by overexpression of the transcription factor E2F1, a key player in the control of cell cycle progression.
Taken together, these analyses show that across multiple cancer cell types, chronic acidosis is associated with gene expression changes expected to reflect a profound metabolic shift, including the downregulation of fermentative glycolysis and upregulation of glutamine- and lipid-based metabolism, and the downregulation of cell division and DNA repair, as well as changes in ECM remodeling and ion channel activity.

2.3. In Vivo Expression of Genes Reacting to Chronic Acidosis Is Predictive of Cancer Patient Survival

The above analysis indicated that there was an overlap between cancer-regulated and acid adaptation-regulated gene sets, motivating a global investigation into whether the expression of acid adaptation-induced genes in patient tumors is correlated to patient overall survival (OS). To do this, RNA-seq data for multiple cancer types from the TCGA database were used. For each gene differentially expressed in all cell lines in the acid adaptation experiment above, patients were classified based on their mRNA expression of the specific genes into a high and low expression group, respectively, using the median expression of genes as the cut-off value.
Kaplan–Meier analysis showed that 267 genes upregulated by chronic acidosis and 138 genes downregulated by chronic acidosis were significantly associated with OS. Specifically, expression of 114 genes upregulated by chronic acidosis in all cell lines was significantly correlated with OS of pancreatic cancer patients. In luminal B breast cancer, 56 acid adaptation-upregulated genes correlated significantly with OS, followed by lung cancer (adenocarcinoma), glioblastoma, colon cancer, ovarian cancer, thyroid cancer and stomach cancer (44, 36, 35, 32, 30 and 29 genes, respectively; Figure 3A). In pancreatic, lung and thyroid cancer, a high expression of the majority of acid adaptation-upregulated genes correlated with better OS. Breast, glioblastoma, colon, ovarian and stomach cancer cohorts shared the reverse pattern: for the majority of acid adaptation-upregulated genes, high expression correlated with poor OS outcome (Figure 3A). Additionally, we found 70 acid adaptation-downregulated genes whose expression correlated with OS of lung adenocarcinoma patients. The counts in descending order for other types of cancer were: Pancreatic cancer—59, stomach cancer—24, ovarian cancer—23, luminal B breast cancer—21, thyroid cancer—17, colon cancer—15 and glioblastoma—11 (Figure 3B). High expressions of the majority of acid adaptation-downregulated genes in lung adenocarcinoma, pancreatic cancer, breast cancer and glioblastoma correlated with poor OS. On the contrary, high expressions of the majority of acid adaptation-downregulated genes in stomach, ovarian, thyroid and colon cancers were associated with better OS (Figure 3B).
The data in Figure 3A,B are collectively consistent with the hypothesis that in stomach, ovarian and colon cancers, acidosis-related changes in gene expression may be more likely to be linked to worse OS, whereas in pancreatic and lung cancer, they are more likely to be linked to better OS. A necessary caveat is that these analyses are only correlative (see also Discussion), and the statistical power of the OS analysis is limited by the number of patient datasets available.
Two genes stood out in terms of their high correlation with OS in multiple cancers. Among the acid adaptation-upregulated genes, high expression of the gene encoding the transcription regulator SMAD9 (a.k.a. SMAD8) showed correlation with good OS in four types of cancer (pancreatic, lung, colon and glioblastoma; Figure 3C, Table 1). SMAD9, a receptor-SMAD activated by Bone Morphogenetic Protein (BMP) receptors, was also upregulated by acidosis in colon cancer cells [45]. Although the link of high expression to better OS makes SMAD9 upregulation an unlikely driver of acidosis-induced pro-tumorigenic effects, activating SMAD9 mutations were linked to some gastric cancers [46]. We also identified 5 genes (LGR4, RARG, PNISR, PCOLCE2, RALGDS) that shared the same patterns across three types of cancer, and 39 genes with two overlaps across eight cancer types (Table 1). As high expression of LGR4, RARG and PCOLCE2 correlated with poor OS, these are interesting candidates for genes selected for in acidosis and linked to poor OS. The most common gene classes (based on the UniProt database) among genes with significant OS analysis results in at least two types of cancer were transcription regulators (9 genes), followed by genes involved in transport processes (8 genes), differentiation/morphogenesis (5 genes) and metabolism (4 genes) (Table 1).
Another gene with multiple cancer OS associations was the transcription factor ZNF557, which was downregulated by acid adaptation. Its low expression was associated with a worse OS outcome in five types of cancer (pancreatic, breast luminal B, lung adenocarcinoma, stomach and glioblastoma) (Figure 3D, Table 2). This supports that upregulation of ZNF557, an essentially unstudied member of the KRAB-ZNF family of zinc finger transcription factors and a transcriptional target of STAT3 [47], may be particularly relevant to the pro-tumorigenic effects of the acidic microenvironment, a possibility to be addressed in future studies. We furthermore discovered 5 genes (MDGA1, VEGFC, MCM10, CTBP1-DT, CHMP4A) with three OS correlations, and 22 genes with two OS correlations, across eight cancer types (Table 2). Of these, low expressions of CTBP1-DT and CHMP4A correlated with poor OS, making them possible candidates for acidosis-stimulated cancer aggressiveness. Among the acid adaptation-downregulated genes significant in OS analysis in at least two types of cancer, we found 17 genes associated with DNA replication/repair/cell cycle, 5 involved in transcription regulation and 4 playing key roles in differentiation and morphogenesis (Table 2).
All 182 acid adaptation-upregulated, and 84 acid adaptation-downregulated, genes that were significant in OS analysis in only one type of cancer are listed in Tables S5 and S6, respectively. Genes that showed contradictory OS results across cancer types (i.e., high and low expression was significantly associated with poor OS in different cancers) are listed in Table S7 (acid adaptation-upregulated) and Table S8 (acid adaptation-downregulated). Figures S1–S16 show plots for all genes with statistically significant OS results.
Taken together, these results show that a large fraction of acid adaptation-responsive genes correlate with patient survival across multiple cancers. Importantly, these genes fall into four major groups: acid adaptation-upregulated genes correlating with either good or poor OS, and acid adaptation-downregulated genes correlating with either better or worse OS across several types of cancers.

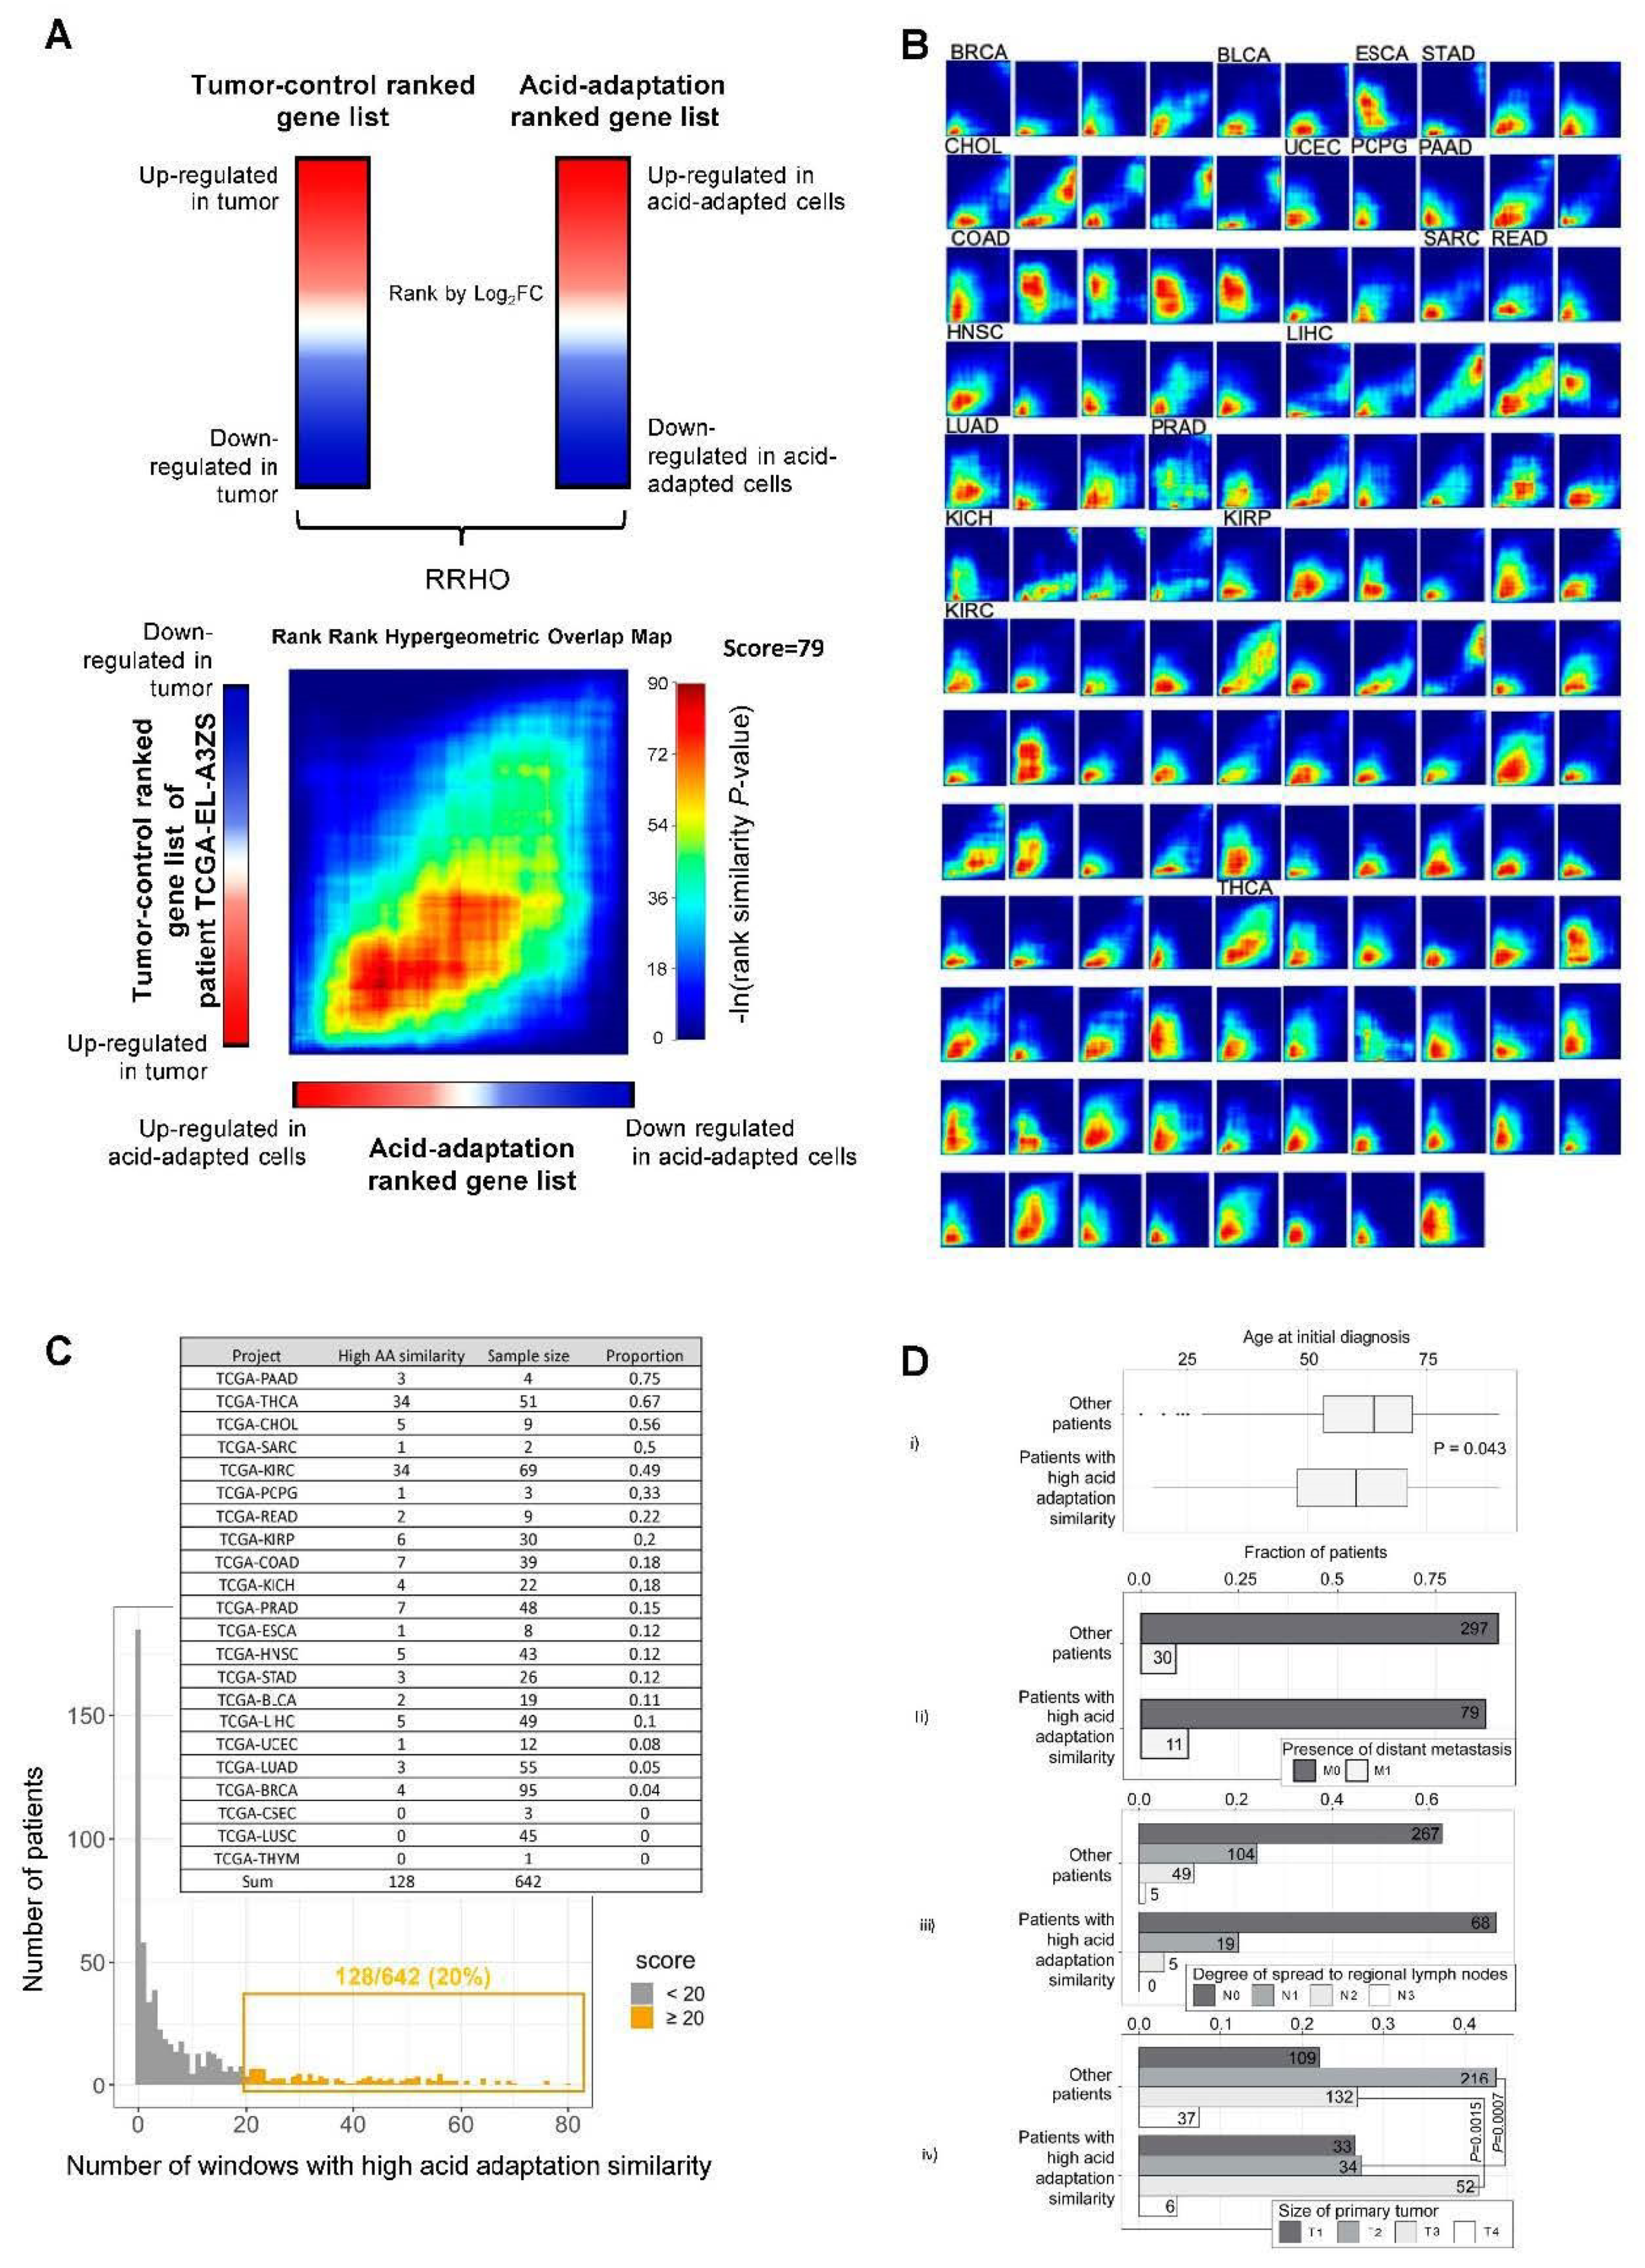
2.4. RRHO Analysis Identifies Substantial Overlap between Genes Upregulated in Acid Adapted Cells and Patient Tumor Tissue

Given that the expression level in vivo of a substantial number of acidosis-induced genes was correlated with overall patient survival, we reasoned that it would be informative to directly compare the acid adaptation gene expression response and the gene expression change between tumor and ctrl. tissue. This requires paired normal and tumor tissue data from the same patient, and we therefore downloaded TCGA RNA-seq data for 642 patients for which such paired data was available. For each patient, we ranked genes according to the tumor vs. ctrl. tissue RNA-seq log2FC. We will refer to such lists as “tumor–ctrl. ranked gene lists”. Each such ranked list was compared to a ranked gene list based on the pH 6.5 vs. 7.6, log2FC, as shown in Figure 2A, referred to as the “acid adaptation ranked gene list”. Using the rank–rank hypergeometric test method (RRHO) (Figure 4A), we sought to identify patients whose tumor–ctrl. ranked gene lists had a significantly similar gene order to that of the acid adaptation ranked gene list, and the set of genes that had similar orders in many such pairwise comparisons. In brief, RRHO analysis identifies windows of the two rank gene lists which have higher rank similarities than expected, and assigns p-values for each such window based on hypergeometric tests, which can be visualized as a heat map. For example, the heat map in Figure 4A shows an RRHO comparison between the patient TCGA-EL-A3ZS tumor–ctrl. ranked gene list (y-axis) vs. the acid adaptation ranked gene list (x-axis), where color intensity in the heat map indicates the gene rank similarity significance in a given window across respective ranked lists. In this example, we observed a high overlap in the upregulated genes between the tumor–ctrl. ranked gene list of the TCGA-EL-A3ZS patient and the acid adaptation ranked gene list (red areas), and a less strong but still substantial rank similarity between modestly downregulated genes in both sets (yellow–green areas). To identify clear cases of substantial rank similarity between patient tumor–ctrl. ranked lists and the acid adaptation ranked lists, we counted the fraction of windows in the heat map matrix which had a p-value < 0.05, and defined this number as the “acid adaptation similarity”. If >20% of windows had p < 0.05, we considered the patient tumor–ctrl. rank gene list to be highly similar to the acid adaptation ranked gene list. The group of 128/642 (~20%) tumor–ctrl. ranked gene lists satisfying this criterion were defined as the ‘high acid adaptation similarity group” (Figure 4C).
Within this group, in most cases, the genes with highest rank similarity were upregulated in pH 6.5 vs. 7.4 and upregulated in tumor vs. ctrl. Figure 4B shows all heat maps from patients in the high acid adaptation similarity group, while Figure 4C shows the distribution of patient ranked gene lists having a given fraction of windows with p < 0.05. Interestingly, some cancer types had particularly high proportions of patients within the high acid adaptation similarity group; for example, 34/51 (~63%) of thyroid cancer patients (TCGA-THCA), 34/69 (~49%) of kidney renal clear cell carcinoma (TCGA-KIRC) patients, and 3/4 (75%) of pancreatic adenocarcinoma (TCGA-PAAD) patients exhibited this pattern. The insert in Figure 4C shows the numbers of patients in each cancer type in the high acid adaptation similarity group. Notably, for some cancer types only small paired tumor–ctrl. sample sets were available; hence, for these cancers, the calculated fractions are less certain.
Next, we investigated if patients in the high acid similarity group had specific clinical characteristics. We observed that patients in the high acid adaptation similarity group had a weakly significant average lower age than remaining patients (two-sided t-test, p = 0.043, means 58.99 and 62.15) (Figure 4D(i)). To investigate metastasis status, we obtained tumor–normal–metastasis (TNM) staging system data from the TCGA database and filtered for M0–M1 stages (presence or not of distant metastasis, 417 patients), N0–N3 stages (degree of spread to regional lymph nodes, 517 patients), and T1–T4 stages (size of the primary tumor, 619 patients) (Figure 4D(ii–iv)). We found no significant relation between acid adaptation similarity groups and metastasis or node status, but patients in the high acid adaptation similarity group were less likely to be classified as T2 (two-sided Fisher’s exact test, p = 0.0007, odds ratio = 0.48), and more likely to be classified as T3 (two-sided Fisher’s exact test, p = 0.0015, odds ratio = 1.95). This is in congruence with the notion that an acidic gene signature is more likely to correlate with a more advanced primary tumor stage than with earlier stages.
Overall, the RRHO analysis strongly indicates high similarity in acid adaptation response and tumor–ctrl. expression profiles for a subset of patients spread across many cancers, in particular for the upregulated genes. To investigate the overlap on a gene, rather than patient, basis for each tumor–ctrl. and acid adaptation RRHO analysis, we extracted the set of genes that had significant rank similarities. We then sorted these genes via how many times they were identified in the overlap sets among all 128 comparisons. Figure 5A,B show significant GO term and KEGG pathway annotation of such genes occurring in ≥50 comparisons. STRING [49] protein–protein interaction plots for the up- and downregulated genes with occurrence ≥50 are shown in Figure 5D,E. The GO/KEGG analyses show that the upregulated overlapping genes were significantly associated with ECM remodeling and cell migration and invasion, whereas the downregulated overlapping genes were generally associated with metabolic processes. STRING analysis confirmed this pattern, with upregulated overlapping genes showing a predominant clustering of genes related to ECM components and remodeling (Figure 5C). Downregulated overlapping genes were less clearly clustered, but a cluster of metabolism-related genes including ME1, PCK2, PGD, GK, IDNK and KHK was evident (Figure 5D).
Collectively, these analyses show that there is a substantial overlap between gene sets up/downregulated by acid adaptation and genes up/downregulated in tumor vs. matched normal tissue, respectively. Furthermore, they indicate that the upregulated overlapping gene sets are strongly dominated by genes involved in cell motility, invasiveness and ECM remodeling, consistent with the notion that these are key processes through which microenvironmental acidosis favors cancer development.

2.5. Integration of Survival Data and Rank–Rank Analysis

Above, we have shown that (i) the in vivo expression of many genes selected for during acid adaptation is correlated to overall survival, and (ii) for around 20% of cancer patients investigated, there is a clear correlation in ranked gene expression (tumor–ctrl. vs. acid adaptation response). Seeking to identify a set of genes that both correlated in ranked gene expression between adapted cells and tumors, and was linked to survival, we plotted the overlap of acid adaptation-up- and downregulated genes identified in the respective analyses as Venn diagrams (Figure 6). For survival-related genes, we chose a conservative approach where only genes that were significantly related to survival in at least two cancer types were included. Remarkably, the large majority of such genes overlapped with genes identified by the RRHO analysis, resulting in two consensus gene lists of 36 and 34 genes, respectively (Figure 6A,B), which could be further split based on whether their in vivo expression correlated with higher or lower patient survival.
As expected, the acid adaptation and tumor-upregulated genes that were associated with poor prognosis (Figure 6A, top list) included multiple genes related to ECM and cell motility in various cancers, such as those encoding sperm-associated antigen-4 (SPAG4) [50], microfibril-associated protein-2 (MFAP2) [51], the ADAM protease ADAMTSL4 [52], and ECM components heparan-sulfate proteoglycan-2 (HSPG2) and Procollagen C-Endopeptidase Enhancer 2 (PCOLCE2). Thioredoxin reductase-3 (TXNRD3), likely important for alleviating oxidative stress, the transcription factors HOXA11 and OTX1, as well as the ENaC subunit SCNN1A, discussed above, were also found in this gene set. The upregulated genes for which high expression correlated with good prognosis in the cancers studied (Figure 6A, lower list) included SMAD9, discussed above, as well as genes coding for two transport proteins, the Ca2+ channel ORAI3 and the TMEM16 family member ANO7, which is a lipid transporter and/or ion channel. It should, however, be noted that although ANO7 upregulation is associated with good prognosis in breast and colon cancer (Table 1), it is in fact associated with poor prognosis in prostate cancer [53].
The acid adaptation-downregulated genes overlapping with genes downregulated in patient cancers, and for which high expression was associated with good prognosis (i.e., potential candidates for pro-tumorigenic effects of acid adaptation, Figure 6B, lower list) included AKAP5 and ZNF557, described above, as well as several DNA replication- and repair-related genes, including the genes encoding the DNA repair protein MMS22L, the DNA replication licensing factor MCM3, and the replication fork complex protein GINS2. Conversely, the downregulated genes for which high expression correlates with poor prognosis (Figure 6B, top list) were dominated by other genes involved in DNA replication, repair and cell cycle control, such as BRCA2, CDC6, CDCA4, CDCA5 and EIF6.
Collectively, these results reveal that genes regulated similarly in acid-adapted cells and in tumor tissue can be linked to both poor and good prognosis, consistent with the notion that tumor acidosis may be both a driver and a repressor of cancer progression. This indicates that while acidosis is likely to favor cancer progression through the upregulation of ECM/motility related genes, it limits it through the downregulation of DNA replication pathways.

3. Discussion

Acidosis is one of the key characteristics of the microenvironment of solid tumors [3,9,20,54]. Agreeing with the idea that cancer is largely an evolutionary disease driven by selection pressure, it has been proposed that chronic acidosis selects for changes in cancer cell genotype and phenotype that increase their “fitness”, and hence aggressiveness [3,55,56]. Such adaptations would potentially render the cells resistant not only to sustained acidosis, but also to other stress stimuli, such as nutrient limitations, hypoxia and chemotherapy, as well as to anti-tumor immunity [9,57,58]. Although individual genes and pathways have previously been compared between acid-adapted cells and patient tumors (e.g., [15,24,59]), a comprehensive integrative analysis comparing genes upregulated by acidosis, genes upregulated in patient tumors and their relation to patient survival is lacking. This was the aim of the work presented here.
Our analyses show that hundreds of genes are similarly regulated by chronic acidosis, in three cancer cell lines from human breast and pancreatic cancers, allowing for the identification of a characteristic gene set shared between cancer cells selected for growth in an acidic microenvironment. Both the up- and downregulated genes show significant overlaps with genes up- and downregulated in patient tumor tissue, compared to normal tissue, for subsets of patients across multiple cancers. Finally, numerous acid-regulated genes correlate with overall patient survival in at least one cancer type, and many in two or more cancers, pointing to a possible functional role. Importantly, survival correlations were both positive and negative, i.e., some genes selected for by acidosis and in patient tissue correlate with increased, and some with decreased, overall survival; furthermore, the effect on survival is often cancer-specific.
It is important to note that although the overlap between acid adaptation and tumor-specific expression was strong, the overall causality is unclear. Extracellular acidosis within tumors may causally lead to cancer aggression in vivo or potentiate an existing aggressive tumor behavior, or the correlations we observe may be caused by an unobserved factor. To detangle these questions and understand their true relevance to tumor growth and metastasis, it will be necessary to measure and manipulate extracellular acidity in tumors in vivo or in advanced in vitro models, that can mimic not only acidosis but other physicochemical, as well as cellular, components of the tumor microenvironment.
A limitation of this work is that a given gene may favor the development of one cancer type and counteract another (Tables S7 and S8), and hence correlations demonstrated here will not apply to all cancers. This notwithstanding, clear patterns were observed.
A number of specific observations deserve special attention with respect to their relation to cancer biology. Firstly, our findings are fully in line with the existing studies proposing that tumor acidosis can promote cancer invasiveness. This includes the prominent pattern of upregulation by acidosis of genes involved in ECM remodeling and invasiveness, as well as the striking extent of upregulation of ASIC1, the ENAC α subunit, and other cation channel genes, many of which have been assigned important roles in cell–cell adhesion and invasion [60,61]. Second, our analyses also support several existing studies that clearly show that adaptation to acidosis is not associated with increased growth of the cancer cells [13,15]. The strong upregulation of TXNIP and its paralogs ARRD2 and ARRD4 by chronic acidosis is consistent with previous reports of the effect of acidosis [18,24] and lactic acidosis [22] on this family of proteins, which are key negative regulators of glycolytic metabolism. In previous work, TXNIP upregulation in acidosis has been shown to involve MondoA [22,24]. The metabolic signature induced by chronic acidosis in this and previous reports is characterized by the downregulation of fermentative glycolysis and the upregulation of glutamine- and lipid-based metabolism [18,62]. In contrast to this, cancer cells are often highly glycolytic, and accordingly, frequently exhibit TXNIP downregulation [25,26,27]. Interestingly, combined inhibition of mTOR and histone deacetylases strongly upregulated TXNIP, triggering oxidative stress-induced cell death in KRAS-driven tumors [63]. This makes it tempting to speculate that TXNIP could be responsible not only for the metabolic shift away from fermentative glycolysis, but also for oxidative stress and growth restriction in acid-adapted cells.
Other mechanisms from those discussed in this work are likely to contribute to the effect of microenvironmental acidosis on cancer aggressiveness. For instance, extracellular acidosis may impact genomic instability and cause epigenetic changes in cancer cells, in line with the substantial downregulation of DNA damage response mechanisms observed in this work [9,17]. Numerous studies have established the strong inhibitory effect of acidosis on cell cycle progression [64]. After several weeks to a few months of culture in acidic medium, cancer cells attain a growth rate similar to that of normal cells grown at pH 7.4, yet not higher [13,15]. This is in itself remarkable, given the acidosis-induced downregulation of pathways associated with cell cycle progression and DNA replication observed in this study. It is, however, consistent with the notion that the acidic TME is likely to act as a brake on proliferation, and may be seen as a niche favoring cells with limited growth but high growth potential [56,65], such as cancer stem cells. Such cells would be growth-limited in an acidic environment, but could have the capacity for extremely rapid growth when encountering regions of normal pHe [9]. In this regard, therapeutic strategies targeting pathways selected for by chronic acidosis, yet functionally limited by these conditions, may be particularly interesting. Similarly, otherwise highly successful strategies of limiting tumor growth by counteracting acidosis [66,67] could carry the risk of exacerbating aggressiveness if applied at a stage when pH normalization might unleash aggressive growth.

4. Materials and Methods

4.1. Cell Culture and Acid Adaptation

Human breast cancer cell lines MDA-MB-231, MCF7 and human pancreatic adenocarcinoma cell line PANC-1 were cultured in RPMI-1640 Medium (Sigma Aldrich, Catalog No. R1383, Saint Louis, MO, USA) supplemented with 10% Fetal Bovine Serum (Sigma Aldrich, Cat. No. F9665, Saint Louis, MO, USA) and 1% Penicillin/Streptomycin (Sigma Aldrich, Cat. No. P0781, Saint Louis, MO, USA). Medium pH was adapted by adjusting the HCO3 concentration by adding the appropriate amount of NaHCO3, ensuring equal osmolarity by adjusting [NaCl]. Cells were adapted to pH 7.6 and 6.5 by adding the appropriately pH-adjusted medium to freshly split cells, and maintaining cells in this medium, splitting or adding fresh medium twice per week for 1 month, until approximately equal growth rates were observed.

4.2. RNA Isolation and RNA Sequencing

Cells were grown to 70–90% confluence in 10 cm2 Petri dishes. RNA isolation was performed using a Nucleospin RNA purification kit (Macherey-Nagel, Cat. # NC0707522, Düren, Germany) and following the manufacturer’s instructions. RNA library preparation and sequencing were done as a paid service by BGI (Hongkong), producing 100 bp paired-end non-stranded libraries with ~20 M reads per library, using the BGI-seq platform. Three replicate libraries were made for each cell type and condition (in total 18 libraries).

4.3. Analyses of RNA-Seq Data

RNA-seq reads were pseudoaligned to Gencode transcriptome release 34 and quantified using Salmon v1.1.0 with flags–validateMappings for selective alignment and −l A for automatic library type inference [68]; Trimmed Mean of M values (TMM) normalization [69] and pre-filtering for low counts were performed using calcNormFactors and filterByExpr function in edgeR package [70,71]. Voom transformation [29] was then applied with a design matrix that used pH treatment as coefficient. To perform differential expression analyses in shared response to pH, inter-subject correlation within three cell lines was performed by duplicateCorrelation function, and was put into the linear model fit using Limma R package [72]. Differential expression, given the above settings, was defined as Benjamini–Hochberg FDR < 0.05 and an absolute log2 FC > 0.5. Validation of key up/downregulated genes by qPCR and immunoblotting is provided in a manuscript in preparation and confirms the RNA-seq results.

4.4. GO Enrichment Analysis and Gene Set Enrichment Analysis (GSEA)

Enrichment tests for GO-terms were performed on differentially expressed genes sets as defined above using gProfiler [73]. The background gene set was set to all expressed genes in the experiment. Significance threshold was set to Benjamini–Hochberg FDR < 0.05. The Gene Set Enrichment Analysis (GSEA) pre-ranked function was performed on the fold change ranked acid adaptation gene list using the Broad Institute GSEA java tool version 4.0.3. C6: Oncogenic signatures database v7.1, gene sets WU_CELL_MIGRATION (M2001) and ANASTASSIOU_MULTICANCER_INVASIVENESS_SIGNATURE (M2572) were used and the number of permutations was set to 1000 [74].

4.5. RRHO Analysis

First, using Limma and Voom as above, we ranked all expressed genes from the RNA-seq experiments by their shared acid adaptation response across cells (log2 fold change pH 6.5 vs. pH 7.4). We will refer to this ranked gene list as the ‘acid adaptation ranked gene list’. To be able to compare this to human data, we extracted processed patient RNA-seq data from Cancer Genome Atlas (TCGA) [75] using the University of California Santa Cruz Xena portal [76]. For every patient and cancer where expression data from paired tumor and control tissue were available, and for each such case, we ranked genes according to their log2 fold change (tumor vs. control (ctrl.) tissue). Next, we compared the acid adaptation ranked list to each ranked patient gene lists in a pairwise fashion, using the Rank–Rank Hypergeometric Overlap (RRHO) method [77], as implemented in R [78]. For each comparison, we obtained heat maps showing rank–rank correlations, colored by log-transformed hypergeometric P-value of local rank overlaps between sets, and the identifiers of genes in each overlap.

4.6. Patient Survival Analysis

TCGA cancer patient data was downloaded from the University of California Santa Cruz Xena portal [76]. The following datasets containing gene expression RNAseq counts, survival data and phenotype information were analyzed: GDC TCGA Pancreatic Cancer (PAAD), GDC TCGA Breast Cancer (BRCA), GDC TCGA Lung Adenocarcinoma (LUAD), GDC TCGA Glioblastoma (GBM), GDC TCGA Colon Cancer (COAD), GDC TCGA Ovarian Cancer (OV), GDC TCGA Thyroid Cancer (THCA) and GDC TCGA Stomach Cancer (STAD).
Kaplan–Meier analysis was performed to estimate the overall survival of patients. Patients were categorized into high and low gene expression groups according to the cut-off value determined by median gene expression. p-values for significance of difference between the two groups were calculated using the log-rank test. Statistical analyses were performed using R’s “survival” and “survminer” packages. p-values < 0.05 were considered statistically significant.

4.7. Data Availability

RNA-sequencing data from this study has been deposited in GEO database under accession number GSE152345.

5. Conclusions

We have defined a shared acid adaptation expression response across three cancer cell models, dominated by ECM remodeling, metabolic rewiring and altered cell cycle regulation. Many genes which are upregulated by acid adaption are significantly correlated to patient survival, and there are clear correlations between acid adaptation expression response and expression change between normal and tumor tissues for a large subset of cancer patients. Importantly, our analyses reveal that genes whose expressions are changed by acid adaptation are linked both to increased and decreased overall patient survival. Thus, in conclusion, our data support the notion that adaptation to microenvironmental acidosis can drive the selection of highly invasive cancer cells and ECM remodeling in human patient tumors. However, consistent with existing experimental data, they also show that acid adaptation exerts inherently growth-limiting effects, which could be important for cancer stem cell maintenance but may per se limit full-blown cancer development, until selected against or otherwise eliminated. Future studies should address what dictates the balance between these effects, and hence the net effects of acid adaptation on cancer development in vivo.

Supplementary Materials

The following are available online at https://www.mdpi.com/2072-6694/12/8/2183/s1, Figures S1–S16: Kaplan–Meier overall survival analysis of cancer patients stratified by acidosis up- and downregulated gene expression levels, Table S1: Upregulated genes in pH 6.5 vs. pH 7.6, Table S2: Downregulated genes in pH 6.5 vs. pH 7.6, Table S3: GO and KEGG analysis of upregulated genes in pH 6.5 vs. pH 7.6, Table S4: GO and KEGG analysis of downregulated genes in pH 6.5 vs. pH 7.6, Table S5: Acidosis-upregulated genes significant in overall survival analysis in one type of cancer, Table S6: Acidosis-downregulated genes significant in overall survival analysis in one type of cancer; Table S7: Acidosis-upregulated genes, which showed contradictory survival analysis results across cancer types, Table S8: Acid adaptation-downregulated genes, which showed contradictory survival analysis results across cancer types.

Author Contributions

Conceived and designed the study: J.Y., D.C., R.I., A.S., and S.F.P., Designed and executed experimental work for RNA sequencing: J.S., B.L., Analyzed the data: J.Y., D.C., and R.I., with inputs and supervision from A.S. and S.F.P., Prepared the figures: J.Y., D.C., and R.I., Wrote the paper: J.Y., D.C., R.I., A.S., and S.F.P., with inputs from all co-authors. All authors have read and agreed to the published version of the manuscript.

Funding

This study was supported by funds from the Danish Cancer society (A.S. and S.F.P.), the Novo Nordisk Foundation (A.S. and S.F.P.), the European Union (H2020-MSCA-ITN-2018, grant 813834, A.S. and S.F.P.) and the Carlsberg Foundation (A.S.).

Acknowledgments

The authors thank Kristoffer Vitting Seerup, Jens Waaben and Kasper Haldrup Björnsson for help with exploratory RNA-seq analyses.

Conflicts of Interest

The authors declare no conflicts of interest.

References

  1. Hanahan, D.; Weinberg, R.A. Hallmarks of cancer: The next generation 1. Cell 2011, 144, 646–674. [Google Scholar] [CrossRef] [PubMed] [Green Version]
  2. Nowell, P.C. The clonal evolution of tumor cell populations. Science 1976, 194, 23–28. [Google Scholar] [CrossRef] [PubMed]
  3. Gatenby, R.A.; Gillies, R.J. A microenvironmental model of carcinogenesis. Nat. Rev. Cancer 2008, 8, 56–61. [Google Scholar] [CrossRef] [PubMed]
  4. Merlo, L.M.; Pepper, J.W.; Reid, B.J.; Maley, C.C. Cancer as an evolutionary and ecological process. Nat. Rev. Cancer 2006, 6, 924–935. [Google Scholar] [CrossRef] [PubMed]
  5. Hashim, A.I.; Zhang, X.; Wojtkowiak, J.W.; Martinez, G.V.; Gillies, R.J. Imaging pH and metastasis. NMR Biomed. 2011, 24, 582–591. [Google Scholar] [CrossRef]
  6. Vaupel, P.; Kallinowski, F.; Okunieff, P. Blood flow, oxygen and nutrient supply, and metabolic microenvironment of human tumors: A review. Cancer Res. 1989, 49, 6449–6465. [Google Scholar]
  7. Webb, B.A.; Chimenti, M.; Jacobson, M.P.; Barber, D.L. Dysregulated pH: A perfect storm for cancer progression. Nat. Rev. Cancer 2011, 11, 671–677. [Google Scholar] [CrossRef]
  8. Elingaard-Larsen, L.O.; Rolver, M.G.; Sorensen, E.E.; Pedersen, S.F. How reciprocal interactions between the tumor microenvironment and ion transport proteins drive cancer progression. In Reviews of Physiology, Biochemistry and Pharmacology; Springer: Berlin/Heidelberg, Germany, 2020. [Google Scholar]
  9. Boedtkjer, E.; Pedersen, S.F. The Acidic Tumor Microenvironment as a Driver of Cancer. Annu. Rev. Physiol. 2020, 82, 103–126. [Google Scholar] [CrossRef] [Green Version]
  10. Semenza, G.L. Hypoxia-inducible factors: Mediators of cancer progression and targets for cancer therapy 12. Trends Pharmacol. Sci. 2012, 33, 207–214. [Google Scholar] [CrossRef] [Green Version]
  11. Zhu, S.; Zhou, H.Y.; Deng, S.C.; Deng, S.J.; He, C.; Li, X.; Chen, J.Y.; Jin, Y.; Hu, Z.L.; Wang, F.; et al. ASIC1 and ASIC3 contribute to acidity-induced EMT of pancreatic cancer through activating Ca2+/RhoA pathway. Cell Death Dis. 2017, 8, e2806. [Google Scholar] [CrossRef]
  12. Peppicelli, S.; Bianchini, F.; Torre, E.; Calorini, L. Contribution of acidic melanoma cells undergoing epithelial-to-mesenchymal transition to aggressiveness of non-acidic melanoma cells. Clin. Exp. Metastasis 2014, 31, 423–433. [Google Scholar] [CrossRef] [PubMed]
  13. Moellering, R.E.; Black, K.C.; Krishnamurty, C.; Baggett, B.K.; Stafford, P.; Rain, M.; Gatenby, R.A.; Gillies, R.J. Acid treatment of melanoma cells selects for invasive phenotypes. Clin. Exp. Metastasis 2008, 25, 411–425. [Google Scholar] [CrossRef] [PubMed]
  14. Estrella, V.; Chen, T.; Lloyd, M.; Wojtkowiak, J.; Cornnell, H.H.; Ibrahim-Hashim, A.; Bailey, K.; Balagurunathan, Y.; Rothberg, J.M.; Sloane, B.F.; et al. Acidity generated by the tumor microenvironment drives local invasion. Cancer Res. 2013, 73, 1524–1535. [Google Scholar] [CrossRef] [PubMed] [Green Version]
  15. Corbet, C.; Bastien, E.; de Jesus, J.P.S.; Dierge, E.; Martherus, R.; Vander Linden, C.; Doix, B.; Degavre, C.; Guilbaud, C.; Petit, L.; et al. TGFβ2-induced formation of lipid droplets supports acidosis-driven EMT and the metastatic spreading of cancer cells. Nat. Commun. 2020, 11, 454. [Google Scholar] [CrossRef] [PubMed] [Green Version]
  16. Martínez-Zaguilán, R.; Seftor, E.A.; Seftor, R.E.; Chu, Y.W.; Gillies, R.J.; Hendrix, M.J. Acidic pH enhances the invasive behavior of human melanoma cells. Clin. Exp. Metastasis 1996, 14, 176–186. [Google Scholar] [CrossRef] [PubMed]
  17. Rohani, N.; Hao, L.; Alexis, M.S.; Joughin, B.A.; Krismer, K.; Moufarrej, M.N.; Soltis, A.R.; Lauffenburger, D.A.; Yaffe, M.B.; Burge, C.B.; et al. Acidification of Tumor at Stromal Boundaries Drives Transcriptome Alterations Associated with Aggressive Phenotypes. Cancer Res. 2019, 79, 1952–1966. [Google Scholar] [CrossRef] [Green Version]
  18. LaMonte, G.; Tang, X.; Chen, J.L.; Wu, J.; Ding, C.K.; Keenan, M.M.; Sangokoya, C.; Kung, H.N.; Ilkayeva, O.; Boros, L.G.; et al. Acidosis induces reprogramming of cellular metabolism to mitigate oxidative stress. Cancer Metab. 2013, 1, 23. [Google Scholar] [CrossRef] [Green Version]
  19. Corbet, C.; Draoui, N.; Polet, F.; Pinto, A.; Drozak, X.; Riant, O.; Feron, O. The SIRT1/HIF2alpha axis drives reductive glutamine metabolism under chronic acidosis and alters tumor response to therapy. Cancer Res. 2014, 74, 5507–5519. [Google Scholar] [CrossRef] [Green Version]
  20. Corbet, C.; Feron, O. Tumour acidosis: From the passenger to the driver’s seat. Nat. Rev. Cancer 2017, 17, 577–593. [Google Scholar] [CrossRef]
  21. Pellegrini, P.; Serviss, J.T.; Lundbäck, T.; Bancaro, N.; Mazurkiewicz, M.; Kolosenko, I.; Yu, D.; Haraldsson, M.; D’Arcy, P.; Linder, S.; et al. A drug screening assay on cancer cells chronically adapted to acidosis. Cancer Cell Int. 2018, 18, 147. [Google Scholar] [CrossRef]
  22. Chen, J.L.; Merl, D.; Peterson, C.W.; Wu, J.; Liu, P.Y.; Yin, H.; Muoio, D.M.; Ayer, D.E.; West, M.; Chi, J.T. Lactic acidosis triggers starvation response with paradoxical induction of TXNIP through MondoA. PLoS Genet 2010, 6, e1001093. [Google Scholar] [CrossRef] [PubMed] [Green Version]
  23. Michl, J.; Park, K.C.; Swietach, P. Evidence-based guidelines for controlling pH in mammalian live-cell culture systems. Commun. Biol. 2019, 2, 144. [Google Scholar] [CrossRef] [PubMed]
  24. Wilde, B.R.; Ye, Z.; Lim, T.Y.; Ayer, D.E. Cellular acidosis triggers human MondoA transcriptional activity by driving mitochondrial ATP production. Elife 2019, 8, e40199. [Google Scholar] [CrossRef] [PubMed]
  25. Jia, J.J.; Geng, W.S.; Wang, Z.Q.; Chen, L.; Zeng, X.S. The role of thioredoxin system in cancer: Strategy for cancer therapy. Cancer Chemother. Pharmacol. 2019, 84, 453–470. [Google Scholar] [CrossRef]
  26. Cadenas, C.; Franckenstein, D.; Schmidt, M.; Gehrmann, M.; Hermes, M.; Geppert, B.; Schormann, W.; Maccoux, L.J.; Schug, M.; Schumann, A.; et al. Role of thioredoxin reductase 1 and thioredoxin interacting protein in prognosis of breast cancer. Breast Cancer Res. 2010, 12, R44. [Google Scholar] [CrossRef] [Green Version]
  27. Shen, L.; O’Shea, J.M.; Kaadige, M.R.; Cunha, S.; Wilde, B.R.; Cohen, A.L.; Welm, A.L.; Ayer, D.E. Metabolic reprogramming in triple-negative breast cancer through Myc suppression of TXNIP. Proc. Natl. Acad. Sci. USA 2015, 112, 5425–5430. [Google Scholar] [CrossRef] [Green Version]
  28. Zhou, Z.H.; Song, J.W.; Li, W.; Liu, X.; Cao, L.; Wan, L.M.; Tan, Y.X.; Ji, S.P.; Liang, Y.M.; Gong, F. The acid-sensing ion channel, ASIC2, promotes invasion and metastasis of colorectal cancer under acidosis by activating the calcineurin/NFAT1 axis. J. Exp. Clin. Cancer Res. 2017, 36, 130. [Google Scholar] [CrossRef]
  29. Waldmann, R.; Champigny, G.; Bassilana, F.; Heurteaux, C.; Lazdunski, M. A proton-gated cation channel involved in acid-sensing. Nature 1997, 386, 173–177. [Google Scholar] [CrossRef]
  30. Collier, D.M.; Snyder, P.M. Extracellular protons regulate human ENaC by modulating Na+ self-inhibition. J. Biol. Chem. 2009, 284, 792–798. [Google Scholar] [CrossRef] [Green Version]
  31. Wu, L.; Ling, Z.H.; Wang, H.; Wang, X.Y.; Gui, J. Upregulation of SCNN1A Promotes Cell Proliferation, Migration, and Predicts Poor Prognosis in Ovarian Cancer Through Regulating Epithelial-Mesenchymal Transformation. Cancer Biother. Radiopharm. 2019, 34, 642–649. [Google Scholar] [CrossRef]
  32. Kanwar, N.; Carmine-Simmen, K.; Nair, R.; Wang, C.; Moghadas-Jafari, S.; Blaser, H.; Tran-Thanh, D.; Wang, D.; Wang, P.; Wang, J.; et al. Amplification of a calcium channel subunit CACNG4 increases breast cancer metastasis. EBioMedicine 2020, 52, 102646. [Google Scholar] [CrossRef] [PubMed] [Green Version]
  33. Nelson, M.; Millican-Slater, R.; Forrest, L.C.; Brackenbury, W.J. The sodium channel β1 subunit mediates outgrowth of neurite-like processes on breast cancer cells and promotes tumour growth and metastasis. Int. J. Cancer 2014, 135, 2338–2351. [Google Scholar] [CrossRef] [PubMed]
  34. Lui, A.J.; Geanes, E.S.; Ogony, J.; Behbod, F.; Marquess, J.; Valdez, K.; Jewell, W.; Tawfik, O.; Lewis-Wambi, J. IFITM1 suppression blocks proliferation and invasion of aromatase inhibitor-resistant breast cancer in vivo by JAK/STAT-mediated induction of p21. Cancer Lett. 2017, 399, 29–43. [Google Scholar] [CrossRef] [PubMed] [Green Version]
  35. Sari, I.N.; Yang, Y.G.; Phi, L.T.; Kim, H.; Baek, M.J.; Jeong, D.; Kwon, H.Y. Interferon-induced transmembrane protein 1 (IFITM1) is required for the progression of colorectal cancer. Oncotarget 2016, 7, 86039–86050. [Google Scholar] [CrossRef] [PubMed]
  36. Moy, I.; Todorovic, V.; Dubash, A.D.; Coon, J.S.; Parker, J.B.; Buranapramest, M.; Huang, C.C.; Zhao, H.; Green, K.J.; Bulun, S.E. Estrogen-dependent sushi domain containing 3 regulates cytoskeleton organization and migration in breast cancer cells. Oncogene 2015, 34, 323–333. [Google Scholar] [CrossRef] [PubMed] [Green Version]
  37. Inamori, K.I.; Beedle, A.M.; de Bernabe, D.B.; Wright, M.E.; Campbell, K.P. LARGE2-dependent glycosylation confers laminin-binding ability on proteoglycans. Glycobiology 2016, 26, 1284–1296. [Google Scholar] [CrossRef] [Green Version]
  38. Hinke, S.A.; Navedo, M.F.; Ulman, A.; Whiting, J.L.; Nygren, P.J.; Tian, G.; Jimenez-Caliani, A.J.; Langeberg, L.K.; Cirulli, V.; Tengholm, A.; et al. Anchored phosphatases modulate glucose homeostasis. EMBO J. 2012, 31, 3991–4004. [Google Scholar] [CrossRef]
  39. Zhong, Z.; Ye, Z.; He, G.; Zhang, W.; Wang, J.; Huang, S. Low expression of A-kinase anchor protein 5 predicts poor prognosis in non-mucin producing stomach adenocarcinoma based on TCGA data. Ann. Transl. Med. 2020, 8, 115. [Google Scholar] [CrossRef]
  40. Feng, X.; Yan, N.; Sun, W.; Zheng, S.; Jiang, S.; Wang, J.; Guo, C.; Hao, L.; Tian, Y.; Liu, S.; et al. miR-4521-FAM129A axial regulation on ccRCC progression through TIMP-1/MMP2/MMP9 and MDM2/p53/Bcl2/Bax pathways. Cell Death Discov. 2019, 5, 89. [Google Scholar] [CrossRef] [Green Version]
  41. Nozima, B.H.; Mendes, T.B.; Pereira, G.; Araldi, R.P.; Iwamura, E.S.M.; Smaili, S.S.; Carvalheira, G.M.G.; Cerutti, J.M. FAM129A regulates autophagy in thyroid carcinomas in an oncogene-dependent manner. Endocr. Relat. Cancer 2019, 26, 227–238. [Google Scholar] [CrossRef] [Green Version]
  42. Lelouvier, B.; Puertollano, R. Mucolipin-3 regulates luminal calcium, acidification, and membrane fusion in the endosomal pathway. J. Biol. Chem. 2011, 286, 9826–9832. [Google Scholar] [CrossRef] [PubMed] [Green Version]
  43. Walton, Z.E.; Patel, C.H.; Brooks, R.C.; Yu, Y.; Ibrahim-Hashim, A.; Riddle, M.; Porcu, A.; Jiang, T.; Ecker, B.L.; Tameire, F.; et al. Acid Suspends the Circadian Clock in Hypoxia through Inhibition of mTOR. Cell 2018, 174, 72–87.e32. [Google Scholar] [CrossRef] [PubMed] [Green Version]
  44. Walton, Z.E.; Brooks, R.C.; Dang, C.V. mTOR Senses Intracellular pH through Lysosome Dispersion from RHEB. Bioessays 2019, 41, e1800265. [Google Scholar] [CrossRef]
  45. Zhou, Z.H.; Wang, Q.L.; Mao, L.H.; Li, X.Q.; Liu, P.; Song, J.W.; Liu, X.; Xu, F.; Lei, J.; He, S. Chromatin accessibility changes are associated with enhanced growth and liver metastasis capacity of acid-adapted colorectal cancer cells. Cell Cycle 2019, 18, 511–522. [Google Scholar] [CrossRef] [PubMed] [Green Version]
  46. Ngeow, J.; Yu, W.; Yehia, L.; Niazi, F.; Chen, J.; Tang, X.; Heald, B.; Lei, J.; Romigh, T.; Tucker-Kellogg, L.; et al. Exome Sequencing Reveals Germline SMAD9 Mutation That Reduces Phosphatase and Tensin Homolog Expression and Is Associated With Hamartomatous Polyposis and Gastrointestinal Ganglioneuromas. Gastroenterology 2015, 149, 886–889.e5. [Google Scholar] [CrossRef] [PubMed] [Green Version]
  47. Li, X.; Burton, E.M.; Koganti, S.; Zhi, J.; Doyle, F.; Tenenbaum, S.A.; Horn, B.; Bhaduri-McIntosh, S. KRAB-ZFP Repressors Enforce Quiescence of Oncogenic Human Herpesviruses. J. Virol. 2018, 92, e00298-18. [Google Scholar] [CrossRef] [Green Version]
  48. The Universal Protein Resource (UniProt). Available online: https://www.uniprot.org/ (accessed on 3 June 2020).
  49. Szklarczyk, D.; Gable, A.L.; Lyon, D.; Junge, A.; Wyder, S.; Huerta-Cepas, J.; Simonovic, M.; Doncheva, N.T.; Morris, J.H.; Bork, P.; et al. STRING v11: Protein-protein association networks with increased coverage, supporting functional discovery in genome-wide experimental datasets. Nucleic Acids Res. 2019, 47, D607–D613. [Google Scholar] [CrossRef] [Green Version]
  50. Ji, Y.; Jiang, J.; Huang, L.; Feng, W.; Zhang, Z.; Jin, L.; Xing, X. Sperm associated antigen 4 (SPAG4) as a new cancer marker interacts with Nesprin3 to regulate cell migration in lung carcinoma. Oncol. Rep. 2018, 40, 783–792. [Google Scholar] [CrossRef] [Green Version]
  51. Wang, J.K.; Wang, W.J.; Cai, H.Y.; Du, B.B.; Mai, P.; Zhang, L.J.; Ma, W.; Hu, Y.G.; Feng, S.F.; Miao, G.Y. MFAP2 promotes epithelial-mesenchymal transition in gastric cancer cells by activating TGF-beta/SMAD2/3 signaling pathway. Onco. Targets Ther. 2018, 11, 4001–4017. [Google Scholar] [CrossRef] [Green Version]
  52. Zhao, Z.; Zhang, K.N.; Chai, R.C.; Wang, K.Y.; Huang, R.Y.; Li, G.Z.; Wang, Y.Z.; Chen, J.; Jiang, T. ADAMTSL4, a Secreted Glycoprotein, Is a Novel Immune-Related Biomarker for Primary Glioblastoma Multiforme. Dis. Markers 2019, 2019, 1802620. [Google Scholar] [CrossRef] [Green Version]
  53. Kaikkonen, E.; Rantapero, T.; Zhang, Q.; Taimen, P.; Laitinen, V.; Kallajoki, M.; Jambulingam, D.; Ettala, O.; Knaapila, J.; Bostrom, P.J.; et al. ANO7 is associated with aggressive prostate cancer. Int. J. Cancer 2018, 143, 2479–2487. [Google Scholar] [CrossRef] [PubMed]
  54. Swietach, P.; Vaughan-Jones, R.D.; Harris, A.L.; Hulikova, A. The chemistry, physiology and pathology of pH in cancer. Philos. Trans. R. Soc. Lond. B Biol. Sci. 2014, 369, 20130099. [Google Scholar] [CrossRef] [PubMed] [Green Version]
  55. Damaghi, M.; Gillies, R. Phenotypic changes of acid adapted cancer cells push them toward aggressiveness in their evolution in the tumor microenvironment. Cell Cycle 2016, 16, 1739–1743. [Google Scholar] [CrossRef] [PubMed] [Green Version]
  56. Pedersen, S.F.; Novak, I.; Alves, F.; Schwab, A.; Pardo, L.A. Alternating pH landscapes shape epithelial cancer initiation and progression: Focus on pancreatic cancer. Bioessays 2017, 39, 1600253. [Google Scholar] [CrossRef] [PubMed]
  57. Wojtkowiak, J.W.; Verduzco, D.; Schramm, K.J.; Gillies, R.J. Drug resistance and cellular adaptation to tumor acidic pH microenvironment. Mol. Pharm. 2011, 8, 2032–2038. [Google Scholar] [CrossRef] [PubMed]
  58. Pilon-Thomas, S.; Kodumudi, K.N.; El-Kenawi, A.E.; Russell, S.; Weber, A.M.; Luddy, K.; Damaghi, M.; Wojtkowiak, J.W.; Mule, J.J.; Ibrahim-Hashim, A.; et al. Neutralization of Tumor Acidity Improves Antitumor Responses to Immunotherapy. Cancer Res. 2016, 76, 1381–1390. [Google Scholar] [CrossRef] [PubMed] [Green Version]
  59. Damaghi, M.; Tafreshi, N.K.; Lloyd, M.C.; Sprung, R.; Estrella, V.; Wojtkowiak, J.W.; Morse, D.L.; Koomen, J.M.; Bui, M.M.; Gatenby, R.A.; et al. Chronic acidosis in the tumour microenvironment selects for overexpression of LAMP2 in the plasma membrane. Nat. Commun. 2015, 6, 8752. [Google Scholar] [CrossRef] [Green Version]
  60. Bon, E.; Driffort, V.; Gradek, F.; Martinez-Caceres, C.; Anchelin, M.; Pelegrin, P.; Cayuela, M.L.; Marionneau-Lambot, S.; Oullier, T.; Guibon, R.; et al. SCN4B acts as a metastasis-suppressor gene preventing hyperactivation of cell migration in breast cancer. Nat. Commun. 2016, 7, 13648. [Google Scholar] [CrossRef] [Green Version]
  61. Haworth, A.S.; Brackenbury, W.J. Emerging roles for multifunctional ion channel auxiliary subunits in cancer. Cell Calcium 2019, 80, 125–140. [Google Scholar] [CrossRef]
  62. Corbet, C.; Pinto, A.; Martherus, R.; de Jesus, J.P.S.; Polet, F.; Feron, O. Acidosis Drives the Reprogramming of Fatty Acid Metabolism in Cancer Cells through Changes in Mitochondrial and Histone Acetylation. Cell Metab. 2018, 24, 311–323. [Google Scholar] [CrossRef] [Green Version]
  63. Malone, C.F.; Emerson, C.; Ingraham, R.; Barbosa, W.; Guerra, S.; Yoon, H.; Liu, L.L.; Michor, F.; Haigis, M.; Macleod, K.F.; et al. mTOR and HDAC Inhibitors Converge on the TXNIP/Thioredoxin Pathway to Cause Catastrophic Oxidative Stress and Regression of RAS-Driven Tumors. Cancer Discov. 2017, 7, 1450–1463. [Google Scholar] [CrossRef] [PubMed] [Green Version]
  64. Flinck, M.; Kramer, S.H.; Pedersen, S.F. Roles of pH in control of cell proliferation. Acta Physiol. (Oxf.) 2018, 223, e13068. [Google Scholar] [CrossRef] [PubMed]
  65. Peppicelli, S.; Andreucci, E.; Ruzzolini, J.; Laurenzana, A.; Margheri, F.; Fibbi, G.; Del Rosso, M.; Bianchini, F.; Calorini, L. The acidic microenvironment as a possible niche of dormant tumor cells. Cell Mol. Life Sci. 2017, 74, 2761–2771. [Google Scholar] [CrossRef] [PubMed]
  66. Robey, I.F.; Baggett, B.K.; Kirkpatrick, N.D.; Roe, D.J.; Dosescu, J.; Sloane, B.F.; Hashim, A.I.; Morse, D.L.; Raghunand, N.; Gatenby, R.A.; et al. Bicarbonate increases tumor pH and inhibits spontaneous metastases. Cancer Res. 2009, 69, 2260–2268. [Google Scholar] [CrossRef] [PubMed] [Green Version]
  67. Ibrahim-Hashim, A.; Cornnell, H.H.; Abrahams, D.; Lloyd, M.; Bui, M.; Gillies, R.J.; Gatenby, R.A. Systemic buffers inhibit carcinogenesis in TRAMP mice. J. Urol. 2012, 188, 624–631. [Google Scholar] [CrossRef] [PubMed] [Green Version]
  68. Patro, R.; Duggal, G.; Love, M.I.; Irizarry, R.A.; Kingsford, C. Salmon provides fast and bias-aware quantification of transcript expression. Nat. Methods 2017, 14, 417–419. [Google Scholar] [CrossRef] [Green Version]
  69. Robinson, M.D.; Oshlack, A. A scaling normalization method for differential expression analysis of RNA-seq data. Genome Biol. 2010, 11, R25. [Google Scholar] [CrossRef] [Green Version]
  70. McCarthy, D.J.; Chen, Y.; Smyth, G.K. Differential expression analysis of multifactor RNA-Seq experiments with respect to biological variation. Nucleic Acids Res. 2012, 40, 4288–4297. [Google Scholar] [CrossRef] [Green Version]
  71. Robinson, M.D.; McCarthy, D.J.; Smyth, G.K. edgeR: A Bioconductor package for differential expression analysis of digital gene expression data. Bioinformatics 2009, 26, 139–140. [Google Scholar] [CrossRef] [Green Version]
  72. Ritchie, M.E.; Phipson, B.; Wu, D.; Hu, Y.; Law, C.W.; Shi, W.; Smyth, G.K. limma powers differential expression analyses for RNA-sequencing and microarray studies. Nucleic Acids Res. 2015, 43, e47. [Google Scholar] [CrossRef]
  73. Raudvere, U.; Kolberg, L.; Kuzmin, I.; Arak, T.; Adler, P.; Peterson, H.; Vilo, J. g:Profiler: A web server for functional enrichment analysis and conversions of gene lists (2019 update). Nucleic Acids Res. 2019, 47, W191–W198. [Google Scholar] [CrossRef] [PubMed] [Green Version]
  74. Subramanian, A.; Tamayo, P.; Mootha, V.K.; Mukherjee, S.; Ebert, B.L.; Gillette, M.A.; Paulovich, A.; Pomeroy, S.L.; Golub, T.R.; Lander, E.S.; et al. Gene set enrichment analysis: A knowledge-based approach for interpreting genome-wide expression profiles. Proc. Natl. Acad. Sci. USA 2005, 102, 15545–15550. [Google Scholar] [CrossRef] [PubMed] [Green Version]
  75. The Cancer Genome Atlas (TCGA). Available online: http://cancergenome.nih.gov/ (accessed on 3 June 2020).
  76. University of California Santa Cruz (UCSC) Xena Functional Genomic Browser. Available online: https://xenabrowser.net/ (accessed on 3 June 2020).
  77. R Package (Version 1.28.0) for Rank-Rank Hypergeometric Overlap (RRHO) Test. Available online: https://bioconductor.org/packages/release/bioc/html/RRHO.html (accessed on 3 June 2020).
  78. Plaisier, S.B.; Taschereau, R.; Wong, J.A.; Graeber, T.G. Rank-rank hypergeometric overlap: Identification of statistically significant overlap between gene-expression signatures. Nucleic Acids Res. 2010, 38, e169. [Google Scholar] [CrossRef] [PubMed] [Green Version]
Figure 1. Overview of study procedures and analyses. (A) Overview of the experimental design, and individual and integrative analyses performed. Three cancer cell lines in triplicates (MDA-MB-231, MCF7 and PANC-1) were acid-adapted to pH 6.5 and 7.6 over a period of 1 month and subjected to RNA-sequencing analysis (RNA-seq). Below this, an overview of computational analyses performed is shown. Briefly, we used two strategies to define a shared acid adaptation gene expression profile: by defining sets of statistically significant genes, or by ranking genes by their expression fold change (pH 6.5 vs. 7.6; Figure 2). These lists were then subject to over-representation analyses (Figure 2), survival analysis in multiple cancers (Figure 3), and comparison to tumor-control tissue (ctrl.) RNA-seq experiments from patient samples (Figure 4 and Figure 5), to identify a final list of genes that are up-/downregulated in acid adaptation as well as in tumor vs. ctrl. experiments, and whose in vivo expression is associated with overall patient survival (Figure 6). (B) Principle component analysis (PCA) based on gene expression. The x- and y-axes show principle components (PCs) 1 and 2 in left panel, 3 and 4 in right panel. Percentage explained variance is shown at each axis. Each dot corresponds to one RNA-seq library. Symbol shapes correspond to cell lines and color corresponds to pH treatment. In the left panel, dashed circles show three groups corresponding to cell lines. In the right panel, the dashed line divides samples by pH treatment.
Cancers 12 02183 g001
Figure 2. Identification of a shared acid adaptation expression response. (A) Fold change-based ranking of all genes differentially expressed in chronically acid-adapted cancer cells. The x-axis corresponds to the rank assigned to each gene from 1 to N based on gene expression fold change (pH 6.5 vs. pH 7.6) in log2 scale (y-axis), also illustrated by blue–red gradient below. Bar color intensity indicates differential expression significance, expressed as false discovery rate (FDR). Genes with the largest absolute fold change are labelled on the plot. (B) Heatmap visualization of differential expression change in chronically acid-adapted cells. Rows correspond to significantly differentially expressed genes (480 upregulated and 256 downregulated), and columns correspond to three cancer cell lines (MDA-MB-231, PANC-1 and MCF7). Color indicates average log2 fold change of gene expression (pH 6.5 vs. pH 7.6) across three replicates per condition. (C) Gene Ontology (GO) term analysis of differentially expressed genes in chronically acid-adapted cells. The x-axis shows GO term enrichment FDR values in −log10 scale for differentially expressed genes defined above. The y-axis shows the top 5 GO terms from three categories (BP—Biological process, MF—Molecular function, CC—Cellular Component) and pathways from the KEGG (Kyoto Encyclopedia of Genes and Genomes) database, ordered by FDR. Bar colors correspond to up- or downregulated gene sets as in (B,D) Gene set enrichment analyses (GSEA) based on acid adaptation-ranked gene list from A to gene lists in the SigDB database. A subset of comparisons is shown as GSEA plots: the SigDB gene list identifier is shown on top of each plot. The y-axis in subplot shows the enrichment score, reflecting how much the chosen gene set is over-represented at the top or bottom of the ranked acid adaptation gene list. In the x-axis, red indicates upregulation at pH 6.5, and blue downregulation, as in Figure 2A. Vertical lines in the lower part of the plot show where in the ranked acid adaptation gene list the genes in the selected SigDB gene list occurred.
Cancers 12 02183 g002
Figure 3. Correlation of genes differentially regulated in chronically acid adaptation cancer cells with patients’ overall survival. (A) Summary of patient overall survival (OS) analysis based on acid adaptation-upregulated genes. Bars show the number of genes significantly associated with overall survival (x-axis), stratified by whether high patient gene expression correlates with poorer or better OS (indicated by bar color). The y-axis shows cancer type, where N is the number of patients analyzed. PAAD—pancreatic cancer, BRCA—breast cancer (luminal B), LUAD—lung cancer (adenocarcinoma), GBM—glioblastoma, COAD—colon cancer, OV—ovarian cancer, THCA—thyroid cancer, STAD—stomach cancer. (B) Summary of patient OS analysis based on acid adaptation-downregulated genes. Arranged as in (A,C) Survival analysis based on SMAD9 expression levels. Kaplan–Meier overall survival analysis in pancreatic cancer, lung adenocarcinoma, glioblastoma and colon cancer patients, respectively, based on SMAD9 expression levels (GDC TCGA datasets). The y-axis shows survival probability, the x-axis shows time in days. Red line: patient group with high expression of the analyzed gene. Blue line: patient group with low expression of the analyzed gene. Survival analysis p-value is shown. (D) Survival analysis based on ZNF557 expression levels. Kaplan–Meier overall survival analysis in pancreatic cancer, breast cancer (luminal B), lung adenocarcinoma, glioblastoma and stomach cancer patients respectively, based on ZNF557 expression levels, arranged as in (C).
Cancers 12 02183 g003
Figure 4. Rank–rank analysis of acid adaptation and patient tumor–ctrl. ranked gene lists. (A) Conceptual overview of rank–rank hypergeometric overlap (RRHO) analysis. Genes are ranked by their log2 fold expression change based on either tumor–ctrl. comparison for a given patient (left) or by acid adaptation response (pH 6.5 vs. 7.6). These ranked gene lists are compared in the rank–rank heat map below (exemplified by the comparison of data from the TCGA patient TCGA-EL-A3ZS and the acid adaptation gene list), identifying windows of genes with correlated ranks in respective gene lists and the significance of such correlated ranks, as indicated by color (based on ln(hypergeometric p-values) as shown). (B) Heat maps resulting from patient tumor–ctrl. vs. acid adaption gene list RRHO analyses showing high gene rank similarity. Each heat map corresponds to patient tumor–ctrl. vs. acid adaptation gene list analysis as in (A), where the acid adaptation gene list is always at the x-axis and the color scale is as in (A). Cancer types are indicated on top of heat maps: consecutive heat maps to the right have the same cancer type unless otherwise indicated (BRCA—breast cancer (luminal B), BLCA—bladder urothelial carcinoma, ESCA—esophageal carcinoma, STAD—stomach cancer, CHOL—cholangiocarcinoma, UCEC—uterine corpus endometrial carcinoma, PCPG—pheochromocytoma and paraganglioma, PAAD—pancreatic cancer, COAD—colon cancer, SARC—sarcoma, READ—renal adenocarcinoma, HNSC—head and neck squamous cell carcinoma, LIHC—liver hepatocellular carcinoma, LUAD—lung cancer (adenocarcinoma), PRAD—prostate adenocarcinoma, KICH—kidney chromophobe, KIRP—kidney renal papillary cell carcinoma, KIRC—kidney renal clear cell carcinoma, THCA—thyroid cancer). (C) Distribution of RRHO similarity scores across TCGA patients. The y-axis shows the number of patients with a given RRHO similarity score (x-axis) calculated as the fraction of windows with a p < 0.05 in rank–rank heat maps (out of a total of 100 windows). Analyses resulting in >20 windows with p < 0.05 (highlighted in yellow) were considered “high acid adaptation similarity”. The number of analyzed patients and the number of analyses resulting in high acid adaptation similarity scores are shown as an insert table. (D) Relation between high acid adaptation similarity score and patient metadata. Subpanel i shows the distribution of age of diagnosis split by whether patients are in the “high acid adaptation similarity” group, visualized as box plots. p-value is from two-sided t test. Subpanel ii–iv shows fraction of patients classified by TNM staging system. T: size of the primary tumor. T1, T2, T3, T4—size and/or extension of the primary tumor. N: degree of spread to regional lymph nodes. N0—no regional lymph nodes metastasis; N1—regional lymph node metastasis present (at some sites, tumor spread to closest or small number of regional lymph nodes); N2 —tumor spreads to an extent between N1 and N3; N3—tumor spread to more distant or numerous regional lymph nodes. M: presence of distant metastasis. M0—no distant metastasis; M1—metastasis to distant organs (beyond regional lymph nodes). Bars are split by whether patients are in the “high acid adaptation similarity” group. p-values from Fisher exact tests are shown, testing the decrease in T1 and increase in T2 in the “high acid adaptation similarity” group vs. remaining patients. Numbers on bars show patient counts.
Cancers 12 02183 g004
Figure 5. Analysis of overlapping genes between pH ranks and tumor–ctrl. ranks with high similarity. (A) Gene ontology (GO) and KEGG pathway analysis of genes upregulated in acid adaptation and correlated in gene expression rank in tumor–ctrl. comparisons in ≥50 patients. The upper bar plot shows the number of tumor–ctrl. vs. acid adaptation RRHO analyses in which the gene was identified as significant. Bar color indicates log2 expression FC in the acid adaptation experiment (pH 6.5 vs. 7.6). Gene identifiers are shown below. Rows in the bottom panel correspond to selected GO terms with high significance from three sources (BP—Biological process, MF—Molecular function, CC—Cellular Component) and pathways from the KEGG database. Columns are genes as indicated above. Grey cells indicate that a given gene is labelled with a given GO term or pathway. (B) Gene ontology (GO) analysis of genes downregulated in acid adaptation correlated in gene expression rank in tumor–ctrl. comparisons in ≥50 patients, arranged as in (A). (C) STRING database analysis of genes from panel (A). Nodes are genes. Connections indicate STRING database evidence of protein interaction. Fully unconnected genes are not shown. (D) STRING database analysis of genes from panel (B), arranged as in (C).
Cancers 12 02183 g005
Figure 6. Integrative analysis. (A) Overlaps between upregulated genes, OS and RRHO analyses. Venn diagrams show overlaps between acid adaptation-upregulated genes (from Figure 2B), of genes significant in overall survival (OS) analysis in at least two types of cancer (based on TCGA data, Figure 4), and genes identified as having significant rank correlations between acid adaptation and tumor-control gene rank lists (RRHO analysis, Figure 4 and Figure 5). (B) Overlaps between downregulated genes, OS and RRHO analyses Venn diagrams arranged as in (A) but focused on acid adaptation-downregulated genes.
Cancers 12 02183 g006
Table 1. Acid adaptation-upregulated genes significant in OS analysis in at least two types of cancers.
Types of Cancer
Gene NameLog2FCFDRCorrelation with Poor OSPAADBRCALUADGBMCOADOVTHCASTADMolecular Function/Biological Process (UniProt)
4 OVERLAPS
SMAD91.17230.0091Low expression DNA-binding, transcription regulation
3 OVERLAPS
LGR40.78490.0127High expression Differentiation, immunity
RARG0.68400.0117High expression DNA-binding, transcription regulation
PNISR0.58900.0258Low expression RNA-binding
PCOLCE20.55380.0408High expression Collagen biosynthesis
RALGDS0.51280.0249Low expression GTPase regulator, signal transduction
2 OVERLAPS
SCNN1A2.04900.0100High expression Ion transport
PLA2R11.63610.0249High expression Endocytosis
PDK41.60880.0351High expression Ser/Thr protein kinase, metabolism
SNED11.55740.0302High expression Cell-matrix adhesion
ADAMTSL41.50830.0176High expression Peptidase, apoptosis
RAMP11.47240.0169High expression Transport, angiogenesis
MFAP21.37700.0154High expression Embryonic morphogenesis
HSPG21.28330.0073High expression Angiogenesis, morphogenesis,
GNG71.22390.0142Low expression GTPase activity
HOXA111.15690.0346High expression DNA-binding, transcription regulation
ALDH3B11.10610.0081High expression Oxidoreductase, metabolism
CORO2A1.07080.0321High expression Actin-binding, signal transduction
LRP11.04030.0380High expression Endocytosis
TMEM8B0.98970.0045Low expression Cell adhesion, growth regulation
ZNF710-AS10.94130.0330Low expression lncRNA
PYGL0.88560.0251High expression Transferase, metabolism
TMED7-TICAM20.86340.0325High expression Golgi organization, protein transport
NPEPL10.87640.0117Low expression Aminopeptidase
SMARCD30.87430.0058Low expression Chromatin regulator, neurogenesis
RHOBTB10.86840.0234Low expression GTPase activity, actin organization
UNC13D0.85870.0368High expression Exocytosis
DBP0.80340.0249Low expression DNA-binding, transcription regulation
PDCD40.73300.0077Low expression RNA-binding, apoptosis
MTMR70.72730.0329Low expression Phosphatase
OTX10.67970.0091High expression DNA-binding, morphogenesis
TXNRD30.65840.0125High expression Differentiation, electron transport
PPOX0.63990.0279Low expression Oxidoreductase, heme biosynthesis
SPAG40.63920.0404High expression Differentiation, spermatogenesis
ANO70.62600.0329Low expression Lipid transport
FAHD2B0.61640.0069High expression Hydrolase
ORAI30.60630.0224Low expression Calcium channel
NOP530.59380.0156High expression Host-virus interaction, ribosome biogenesis
C17orf490.59100.0081Low expression Chromatin regulator, DNA-binding
VAMP20.59010.0073Low expression Exocytosis, protein transport
ZNF4870.58720.0377Low expression DNA-binding, transcription regulation
TDRD30.58320.0058Low expression Chromatin regulator, RNA-binding
FRG1HP0.53020.0376Low expression Pseudogene
PLD20.52260.0306High expression Hydrolase, lipid metabolism, motility
MLLT60.51180.0038Low expression Histone-binding, metal ion-binding
PAAD—pancreatic cancer (dark blue), BRCA—breast cancer–luminal B (pink), LUAD—lung cancer–adenocarcinoma (turquoise), GBM—glioblastoma (orange), COAD—colon cancer (red), OV—ovarian cancer (purple), THCA—thyroid cancer (grey), STAD—stomach cancer (green). Molecular function and/or biological processes according to UniProt database [48].
Table 2. Acid adaptation-upregulated genes significant in OS analysis in at least two types of cancers.
Types of Cancer
Gene NameLog2FCFDRCorrelation with Poor OSPAADBRCA LUADGBMCOADOVTHCASTADMolecular Function/Biological Process (UniProt)
5 OVERLAPS
ZNF557−0.59990.0069Low expression DNA-binding, transcription factor, metal on binding
3 OVERLAPS
MDGA1−1.20030.0153High expression Differentiation, neurogenesis
VEGFC−0.89630.0345High expression Growth factor, angiogenesis, differentiation
MCM10−0.84860.0249High expression DNA-binding, DNA replication, DNA damage
CTBP1-DT−0.54900.0098Low expression Oxidoreductase, differentiation, transcription
CHMP4A−0.51820.0247Low expression Protein transport
2 OVERLAPS
CGN−1.56610.0112High expression Tight junction regulation
AKAP5−1.46710.0408Low expression Calmodulin-binding
HIST1H4H−1.31430.0276High expression DNA-binding
STYK1−1.08440.0290High expression Protein tyrosine kinase
CDC25A−1.00230.0182Low expression Protein phosphatase, cell cycle, cell division
RRM2−0.99250.0325High expression Oxidoreductase, DNA replication
VDR−0.99010.0131High expression Vitamin D3 receptor, DNA-binding, transcription
CDC6−0.88050.0110High expression Cell cycle, cell division, DNA replication
GINS4−0.85740.0376High expression DNA replication
AC019069.1−0.81180.0467High expression lncRNA
TCF19−0.78350.0296High expression DNA-binding, transcription factor
GINS2−0.77840.0182Low expression DNA replication
SOWAHC−0.76530.0201High expression Ankyrin repeat domain-containing protein
BRCA2−0.73320.0375High expression DNA-binding, DNA recombination, DNA damage
AC092279.1−0.68530.0203Low expression lncRNA
CDCA5−0.66520.0425High expression Cell cycle, cell division
TUBB2A−0.65590.0360High expression GTP-binding, microtubule cytoskeleton organization
OAS3−0.65180.0117High expression RNA-binding, antiviral defense, immunity
SFN−0.63820.0158High expression DNA damage response
MTHFD1−0.63330.0107High expression Embryonic morphogenesis
ZNF562−0.60410.0069Low expression DNA-binding, transcription factor, metal ion binding
MASTL−0.60080.0482High expression Ser/Thr protein kinase, cell division
CDCA4−0.59070.0236High expression Cell division
MMS22L−0.57250.0418Low expression DNA repair
RMI1−0.56610.0443Low expression DNA replication
C1orf112−0.55810.0415High expression Uncharacterized protein C1orf112
MIR4435-2HG−0.55370.0105High expression lncRNA
MCM4−0.53280.0482High expression DNA-binding, cell cycle, DNA replication
DSCC1−0.52680.0492High expression DNA-binding, cell cycle, DNA replication
USP1−0.51920.0330Low expression Protease, DNA repair
MCM3−0.51290.0471Low expression Transferase, mRNA transport, immunity
EIF6−0.50080.0100High expression Ribosome biogenesis, protein synthesis
PAAD—pancreatic cancer (dark blue), BRCA—breast cancer–luminal B (pink), LUAD—lung cancer–adenocarcinoma (turquoise), GBM—glioblastoma (orange), COAD—colon cancer (red), OV—ovarian cancer (purple), THCA—thyroid cancer (grey), STAD—stomach cancer (green). Molecular function and/or biological processes according to UniProt database [48].

