Total and Free Sugar Content of Canadian Prepackaged Foods and Beverages


Abstract
:1. Introduction
- “Free sugar” is the sugar no longer in its naturally-occurring state (i.e., no longer in whole fruits, vegetables, unsweetened dairy, and grains) and can be consumed as is or incorporated into other foods [9]. Examples include table sugar, syrup, honey, fruit juice and nectars.
- “Naturally-occurring sugar” is the sugar found naturally within whole foods (i.e., within whole fruits, vegetables, dairy, and some grains) [14].
- “Free Sugar Ingredients” (FSI) are all mono- and disaccharides added to foods as well as those naturally-occurring in honey, fruit juices, and syrups (e.g., sugar, honey, maple syrup, molasses, fruit juice, glucose, fructose, agave, and corn syrup) [9].
- “Sweeteners” are food additives that are used to give products a sweet taste and can include sugar alcohols (e.g., malitol, xylitol, and sorbitol), non-nutritive sweeteners (e.g., aspartame, sucralose, and acesulfame-potassium), cyclamate sweeteners, or saccharin sweeteners [21] and are not considered FSI.
2. Materials and Methods
2.1. Food Label Information Program (FLIP) Database
2.1.1. FLIP 2013 Data Collection
2.1.2. FLIP 2013 Data Processing
2.1.3. FLIP 2013 Sugar-Focused Food Categories
2.2. Assessment of Free and Total Sugar Content and Use of Free Sugar Ingredients and Sweeteners
2.3. Statistical Analysis
3. Results
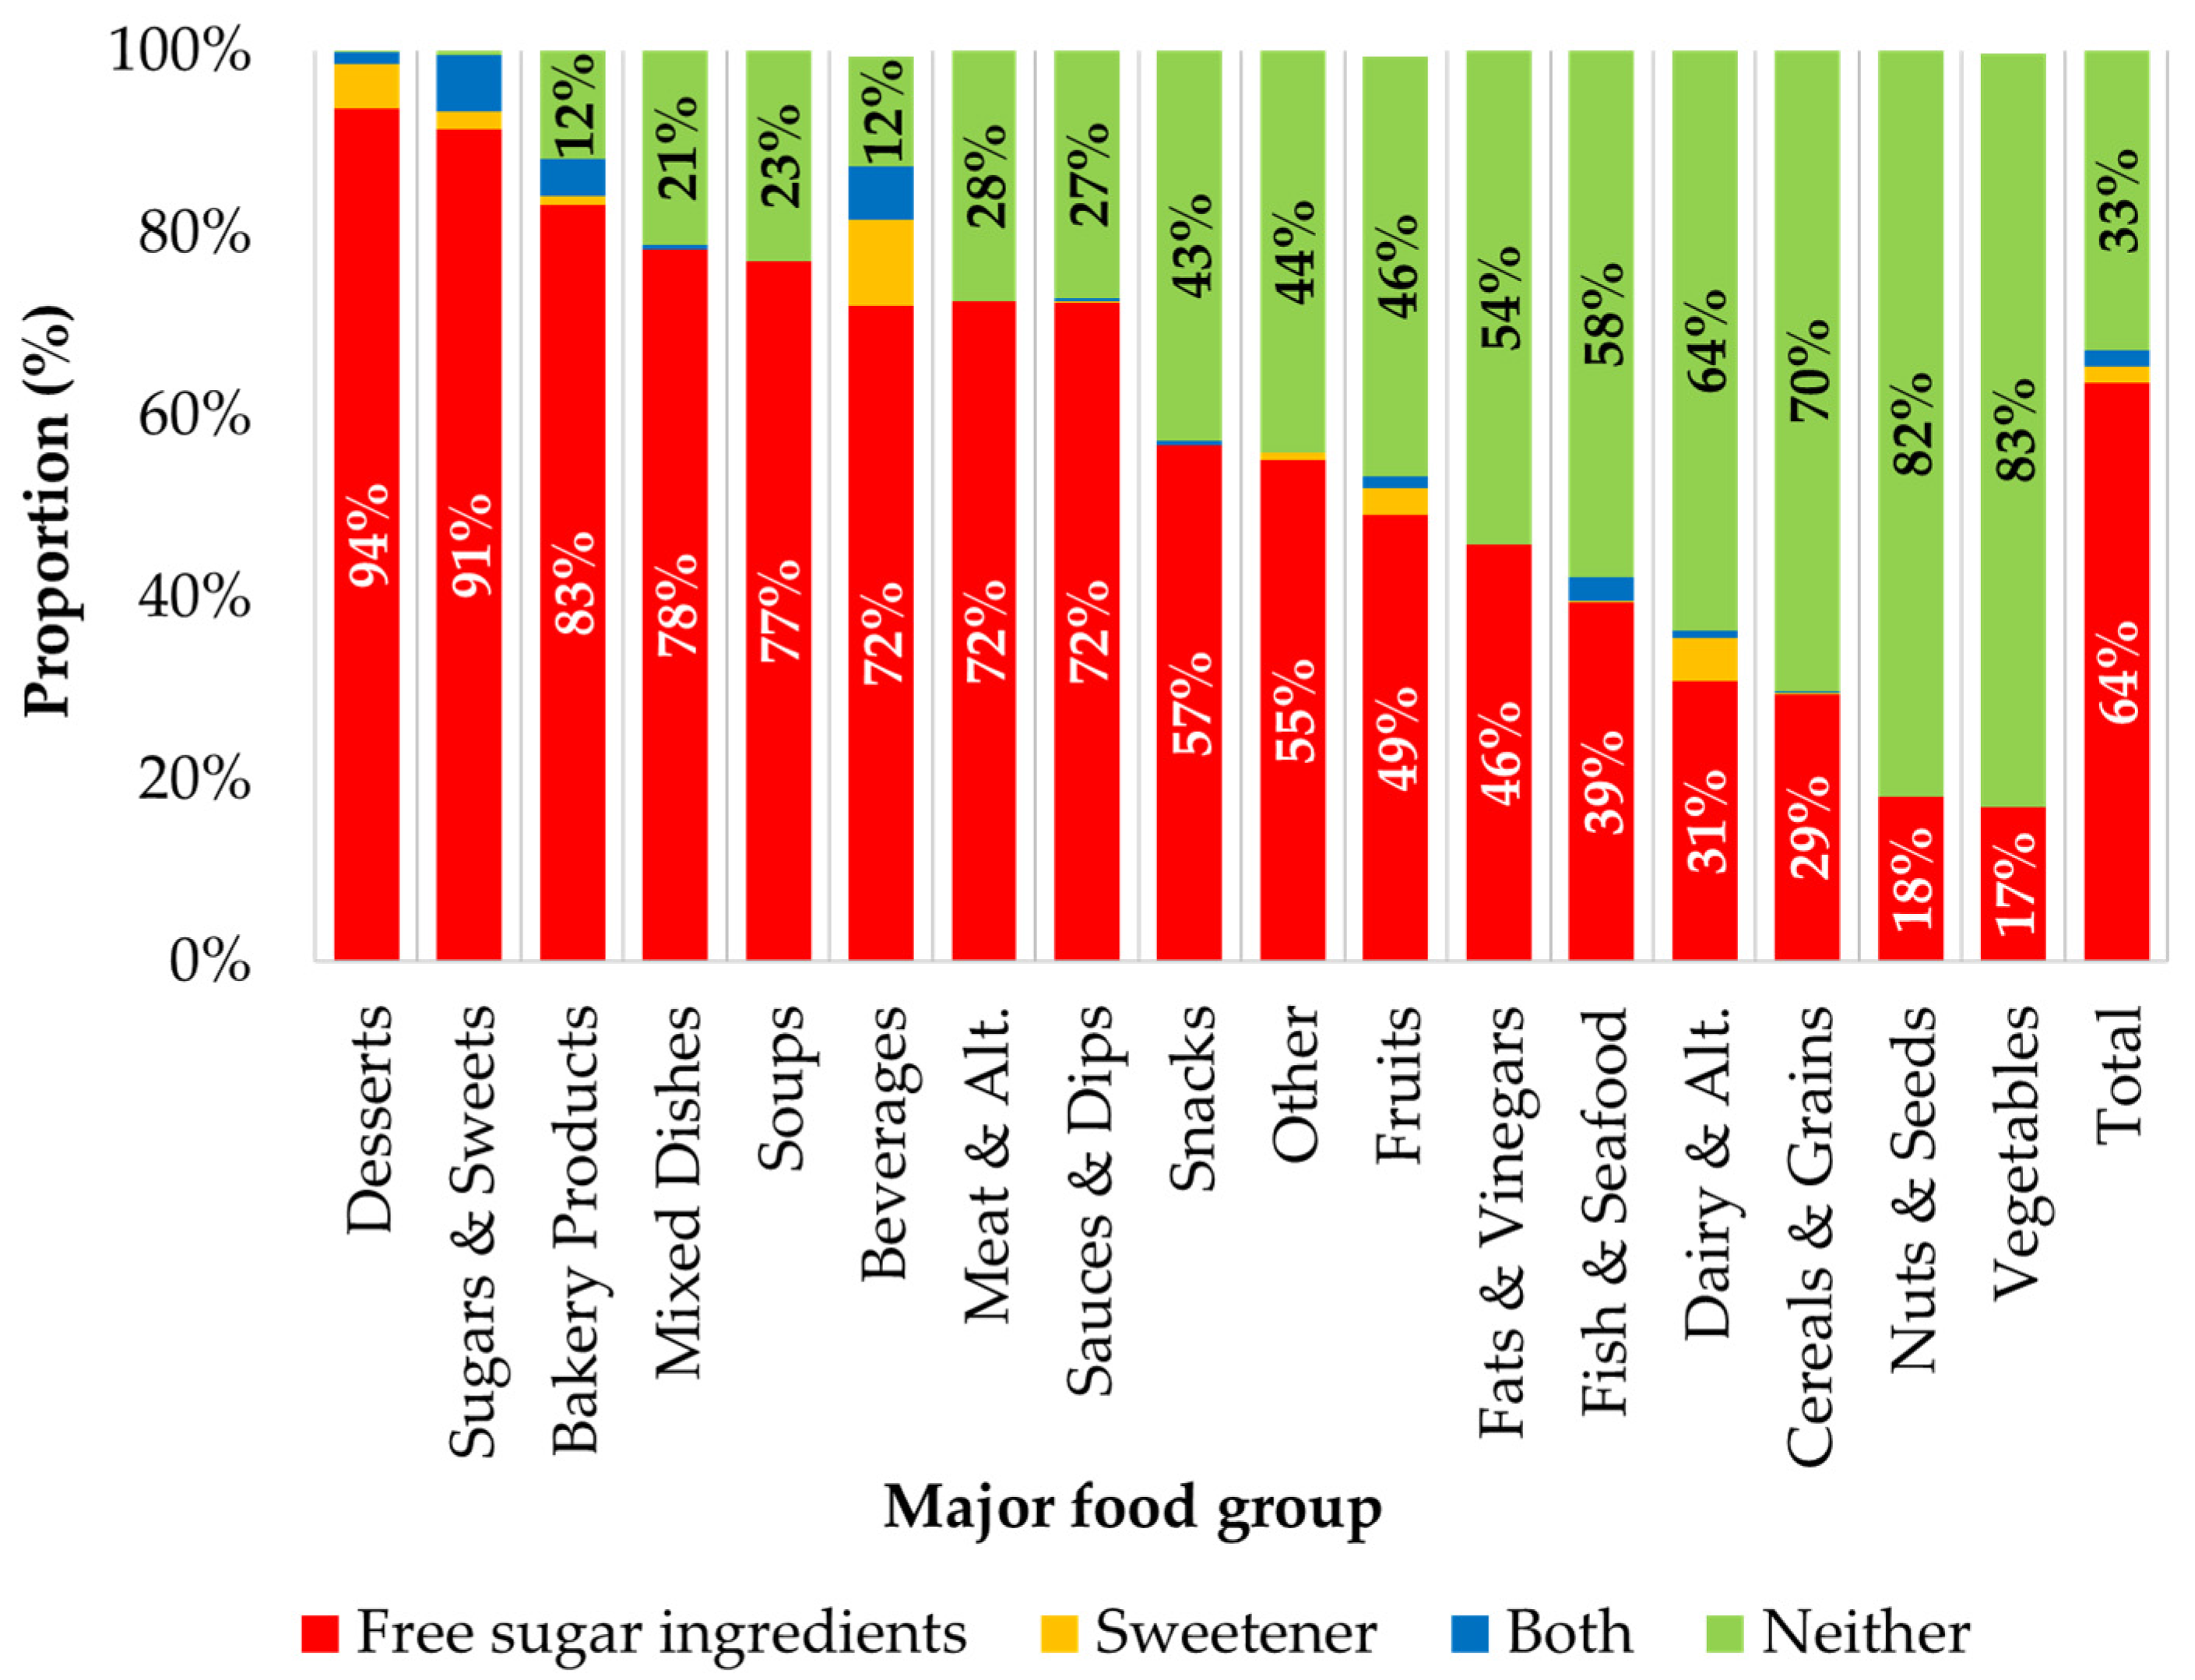
3.1. Use of Free Sugar Ingredients and Sweeteners
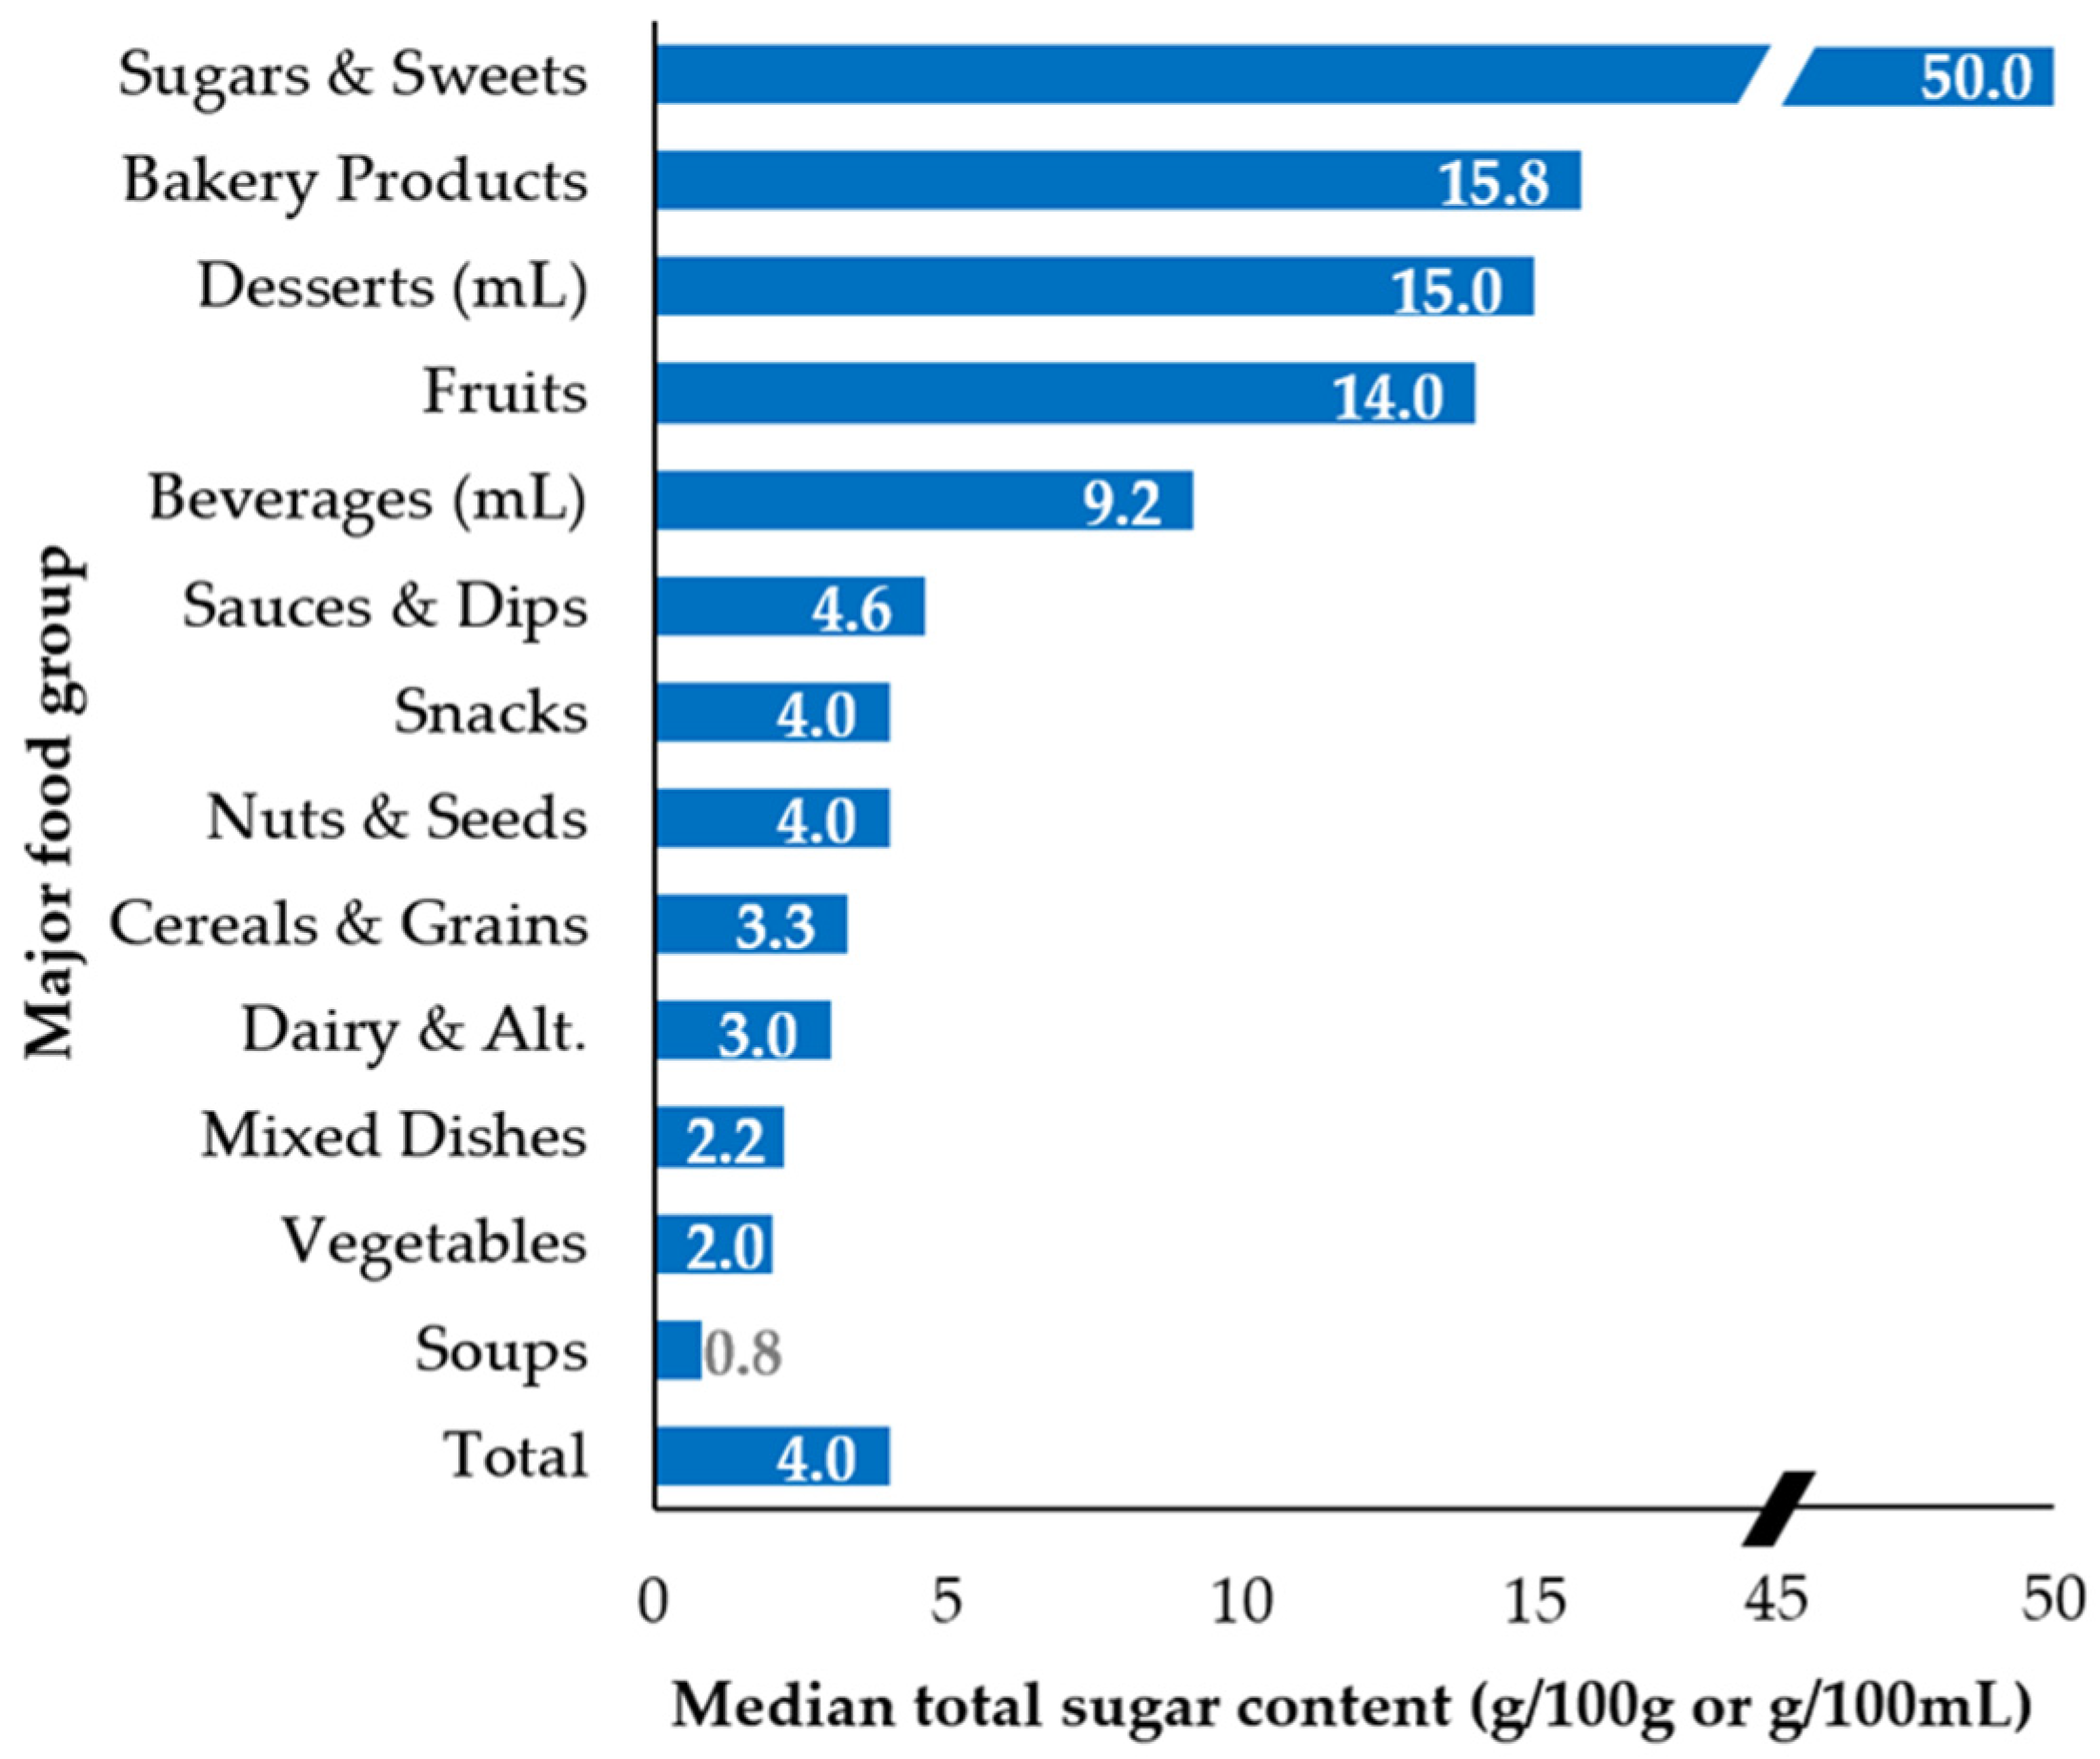
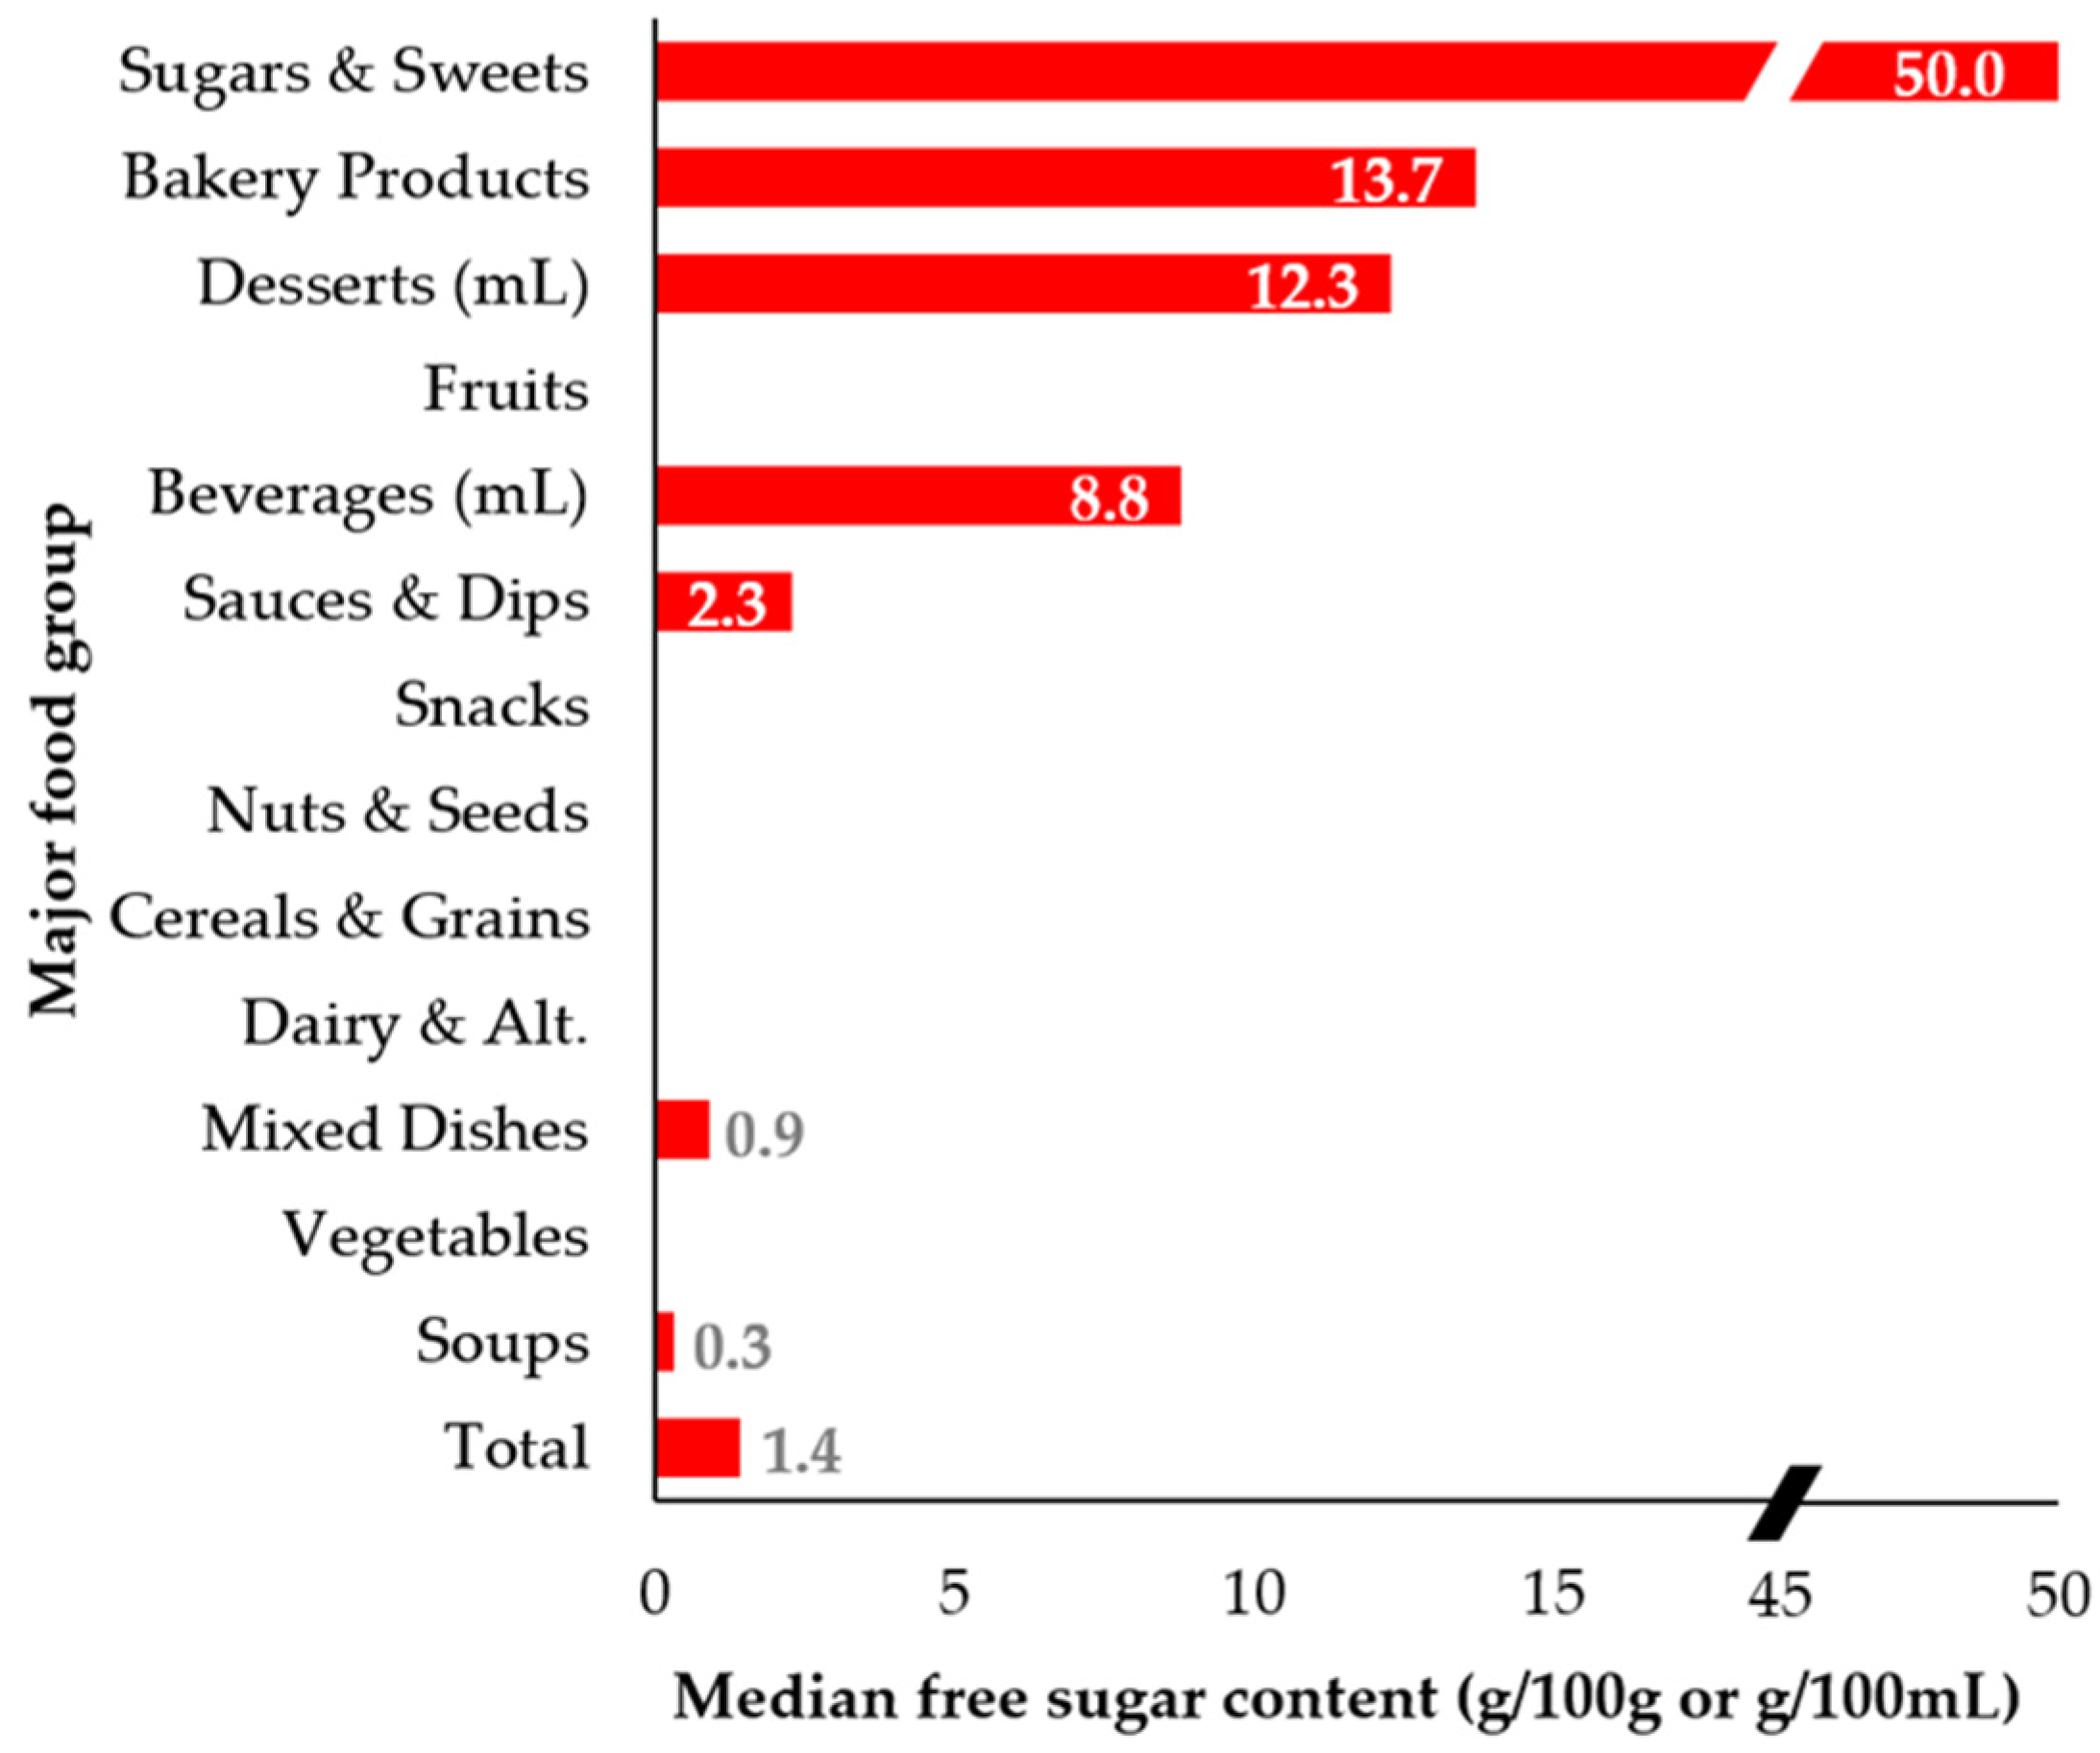
3.2. Median Total and Free Sugar Content
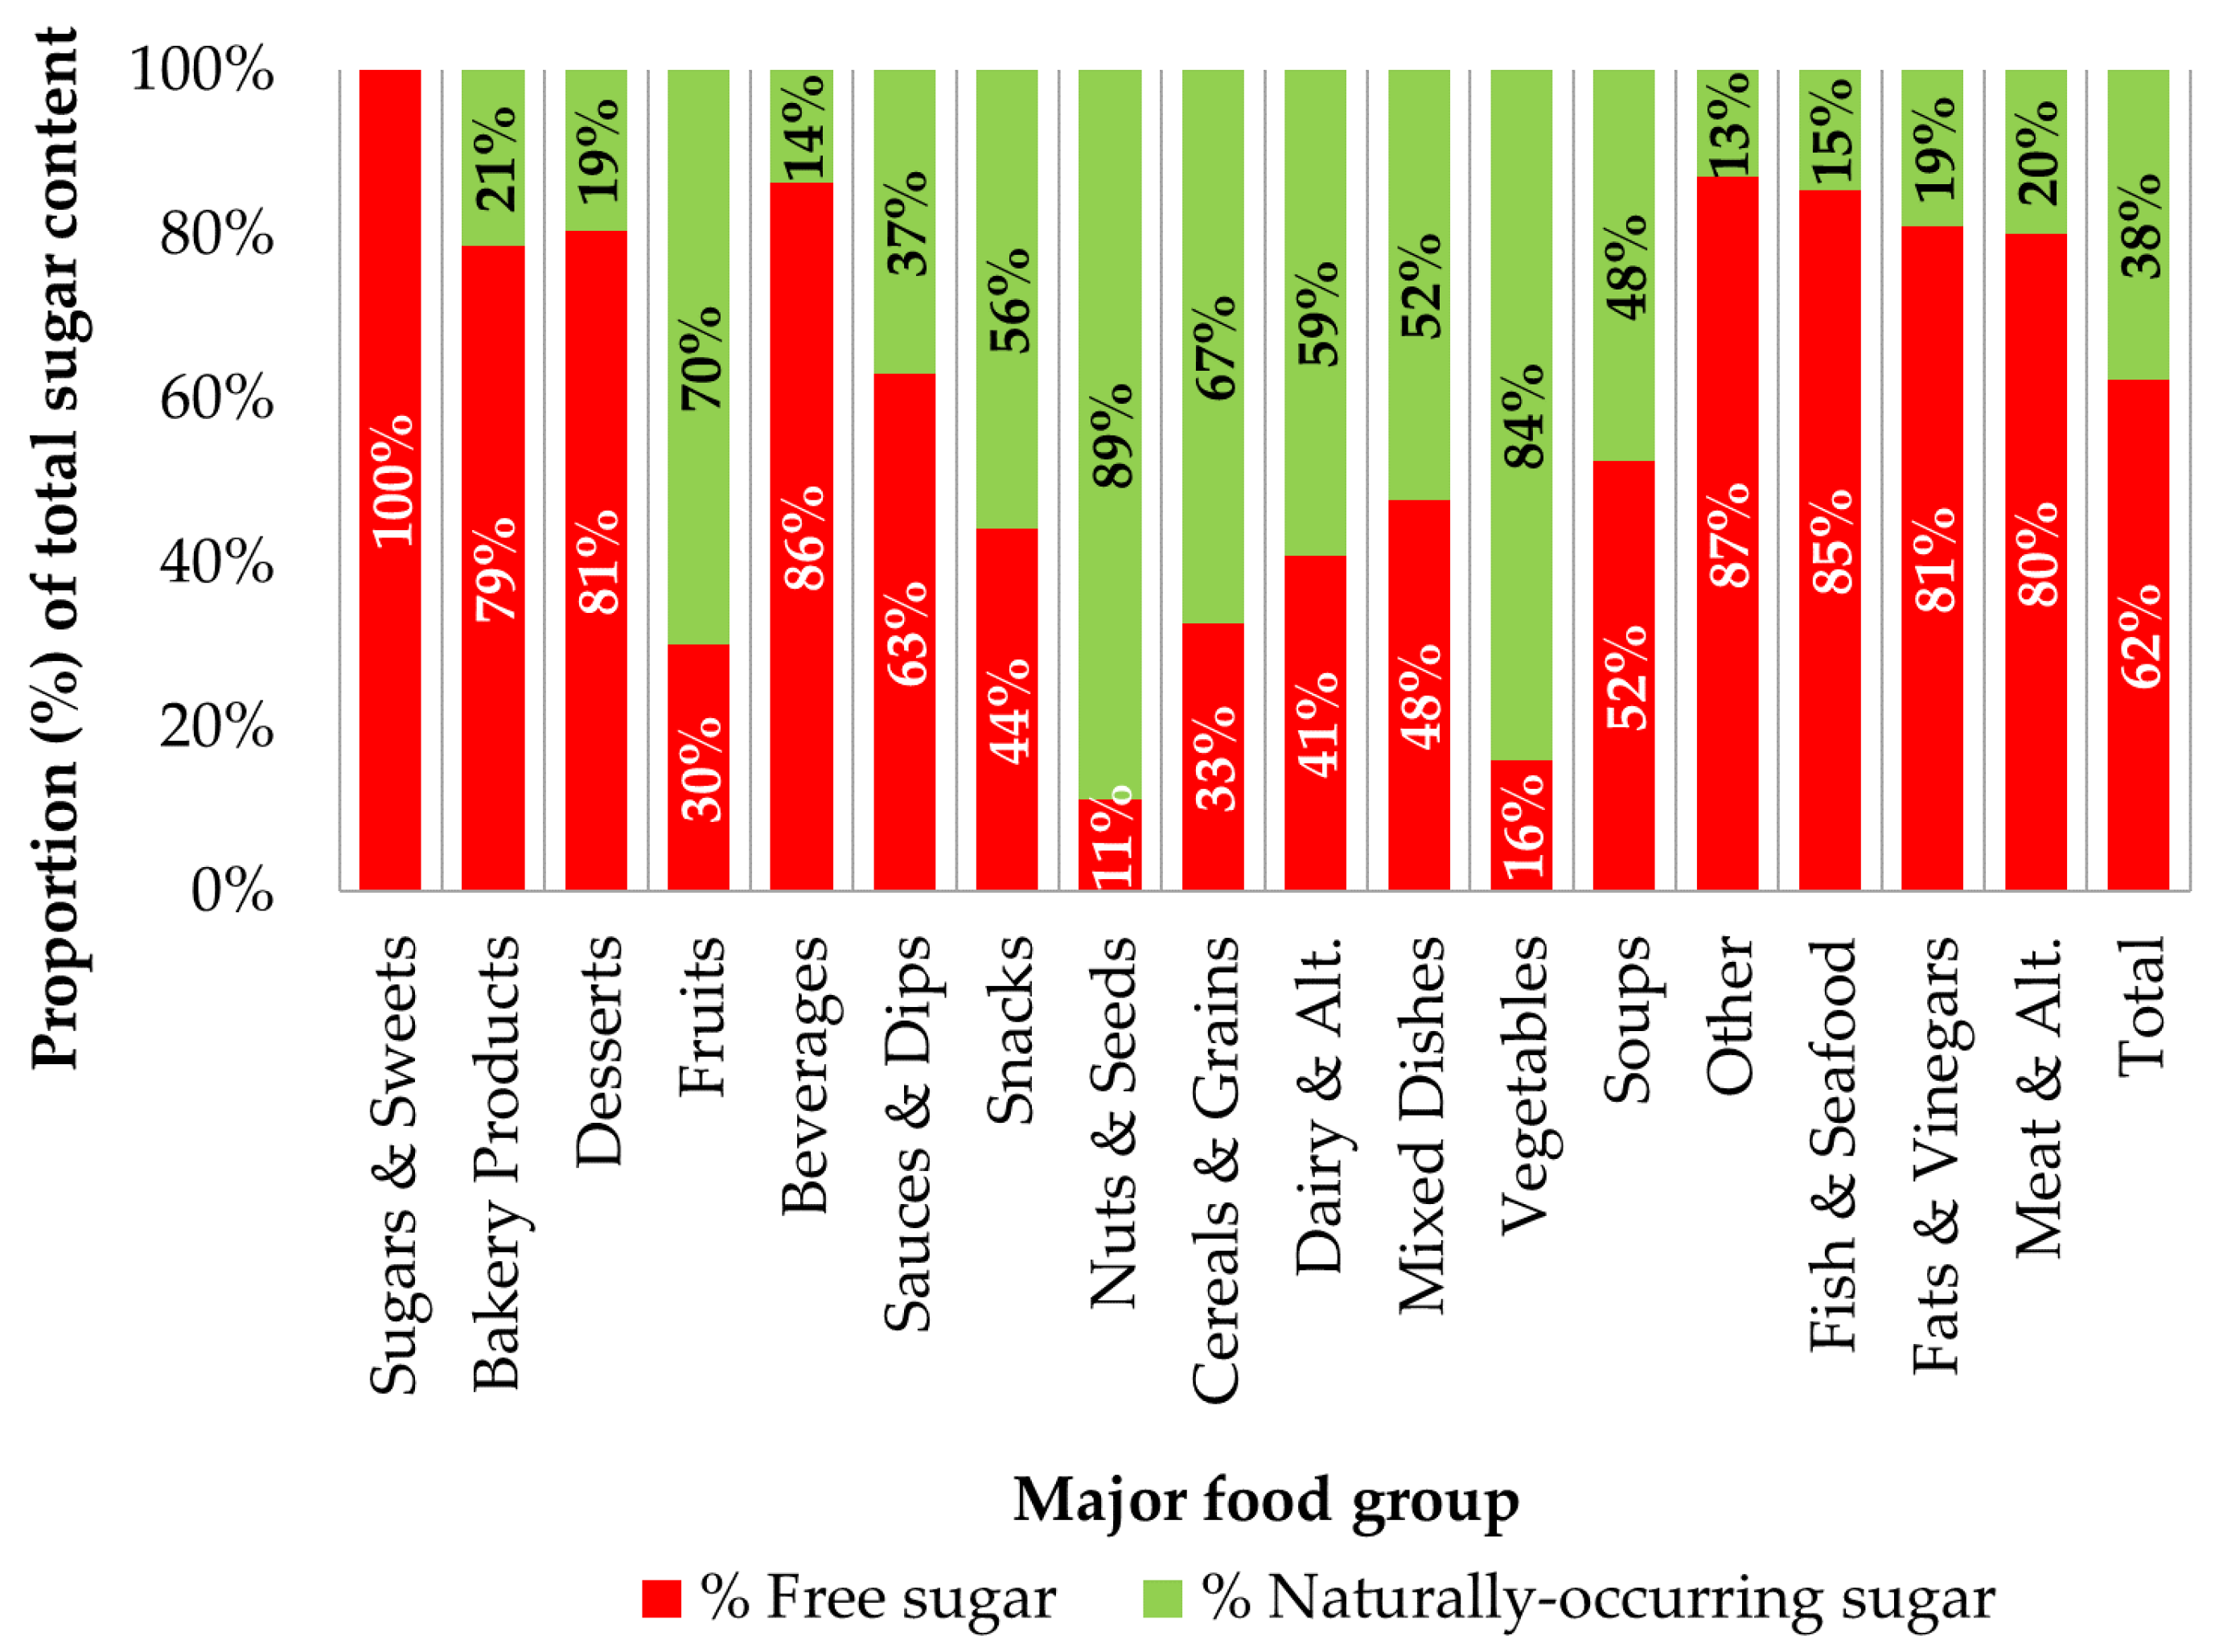
3.3. Free Sugar as a Percent of Total Sugar
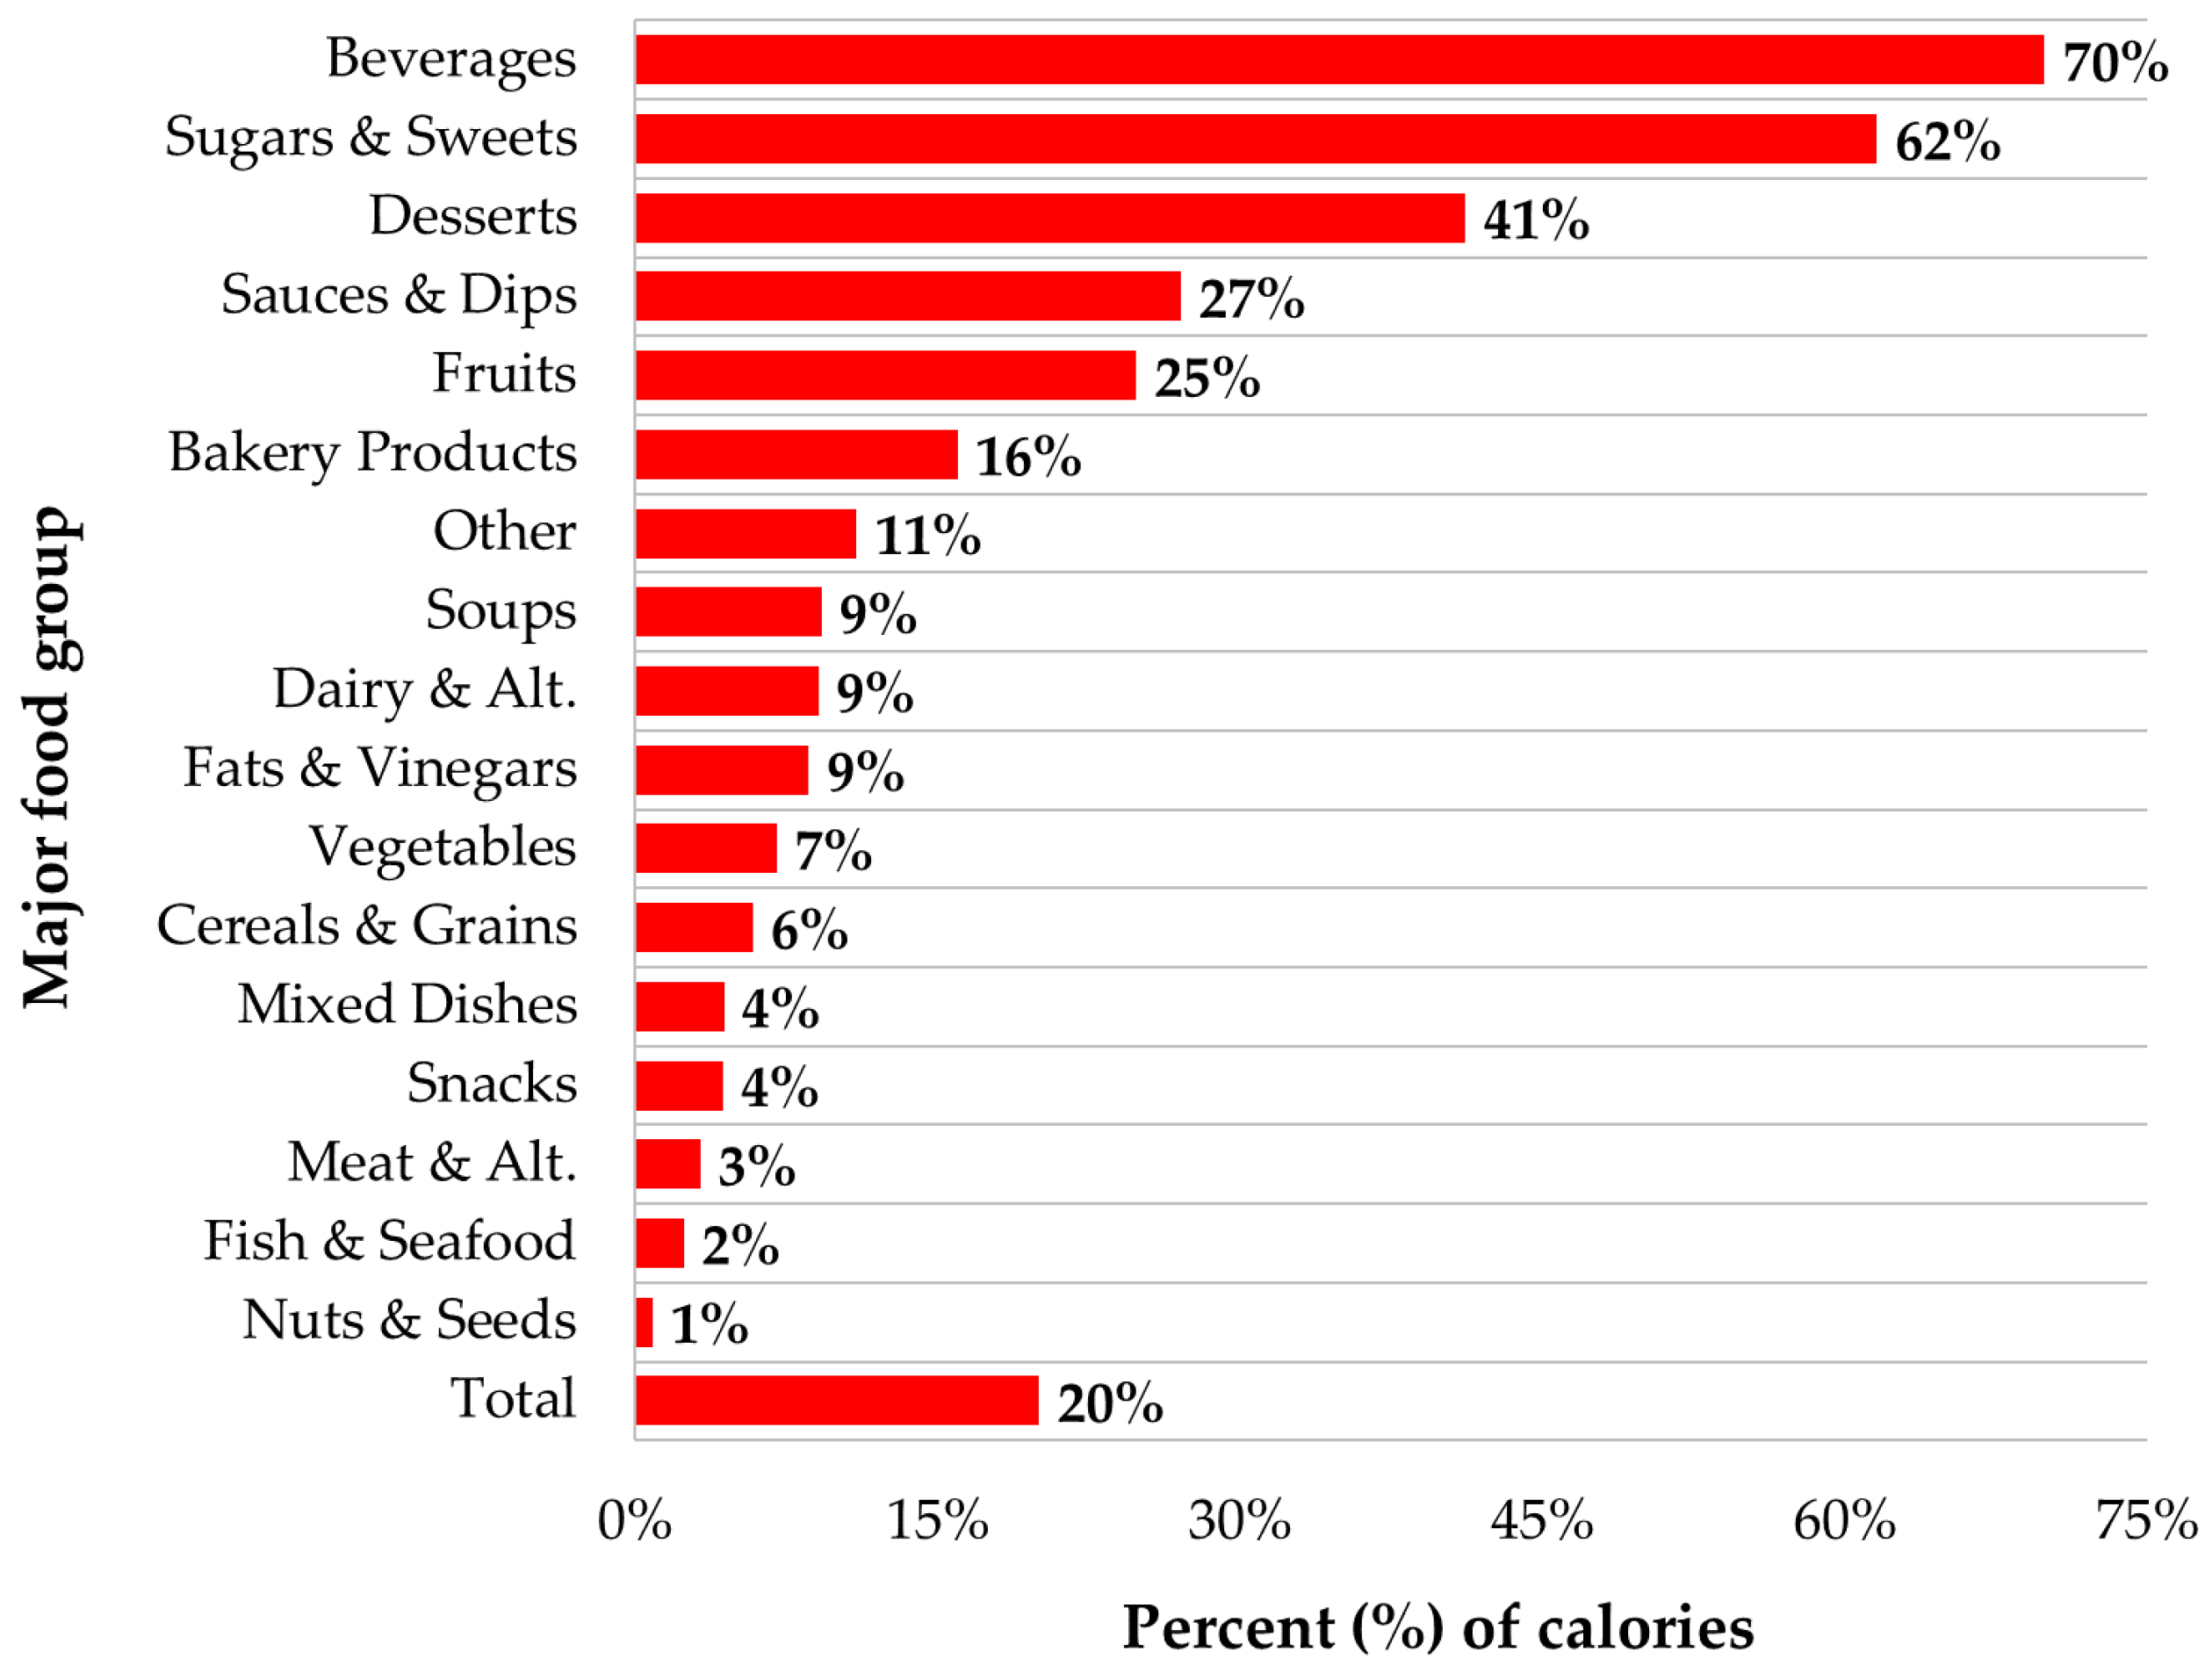
3.4. Contribution of Free Sugar to Total Calories
4. Discussion
5. Conclusions
Acknowledgments
Author Contributions
Conflicts of Interest
References
- Yang, Q.; Zhang, Z.; Gregg, E.W.; Flanders, W.; Merritt, R.; Hu, F.B. Added sugar intake and cardiovascular diseases mortality among us adults. JAMA Intern. Med. 2014, 174, 516–524. [Google Scholar] [CrossRef] [PubMed]
- Sheiham, A.; James, W.P. A new understanding of the relationship between sugars, dental caries and fluoride use: Implications for limits on sugars consumption. Public Health Nutr. 2014, 17, 2176–2184. [Google Scholar] [CrossRef] [PubMed]
- Malik, V.S.; Popkin, B.M.; Bray, G.A.; Despres, J.P.; Willett, W.C.; Hu, F.B. Sugar-sweetened beverages and risk of metabolic syndrome and type 2 diabetes: A meta-analysis. Diabetes Care 2010, 33, 2477–2483. [Google Scholar] [CrossRef] [PubMed]
- Te Morenga, L.A.; Howatson, A.J.; Jones, R.M.; Mann, J. Dietary sugars and cardiometabolic risk: Systematic review and meta-analyses of randomized controlled trials of the effects on blood pressure and lipids. Am. J. Clin. Nutr. 2014, 100, 65–79. [Google Scholar] [CrossRef] [PubMed]
- Te Morenga, L.; Mallard, S.; Mann, J. Dietary sugars and body weight: Systematic review and meta-analyses of randomised controlled trials and cohort studies. BMJ 2013, 346, e7492. [Google Scholar] [CrossRef] [PubMed]
- Li, Y.; Hruby, A.; Bernstein, A.M.; Ley, S.H.; Wang, D.D.; Chiuve, S.E.; Sampson, L.; Rexrode, K.M.; Rimm, E.B.; Willett, W.C.; et al. Saturated fats compared with unsaturated fats and sources of carbohydrates in relation to risk of coronary heart disease: A prospective cohort study. J. Am. Coll. Cardiol. 2015, 66, 1538–1548. [Google Scholar] [CrossRef] [PubMed]
- Canadian Diabetes Association. Position on Sugars. 2015. Available online: http://www.diabetes.ca/about-cda/public-policy-position-statements/sugars (accessed on 25 January 2016).
- Heart and Stroke Foundation Canada. Position Statement—Sugar, Heart Disease and Stroke. 2014. Available online: http://www.heartandstroke.com/atf/cf/%7B99452D8B-E7F1-4BD6-A57D-B136CE6C95BF%7D/Sugar-Eng.pdf (accessed on 3 October 2014).
- World Health Organization. Guideline: Sugars Intake for Adults and Children. 2015. Available online: http://apps.who.int/iris/bitstream/10665/149782/1/9789241549028_eng.pdf?ua=1 (accessed on 10 December 2015).
- United States Department of Health and Human Services and United States Department of Agriculture. 2015–2020 Dietary Guidelines for Americans, 8th ed. 2015. Available online: http://health.gov/dietaryguidelines/2015/guidelines/ (accessed on 12 January 2016). [Google Scholar]
- Public Health England. Sugar Reduction: From Evidence to Action. 2015. Available online: https://www.gov.uk/government/uploads/system/uploads/attachment_data/file/470179/Sugar_reduction_The_evidence_for_action.pdf (accessed on 25 October 2015). [Google Scholar]
- United Nations General Assembly. Prevention and Control of Non-Communicable Diseases. 2011. Available online: http://www.un.org/en/ga/search/view_doc.asp?symbol=A/66/83&Lang=E (accessed on 18 August 2014).
- Institute of Medicine. Dietary Reference Intakes for Energy, Carbohydrate, Fiber, Fat, Fatty Acids, Cholesterol, Protein and Amino Acids; National Academy Press: Washington, DC, USA, 2001. [Google Scholar]
- Sigman-Grant, M.; Morita, J. Defining and interpreting intakes of sugars. Am. J. Clin. Nutr. 2003, 78, 815–826. [Google Scholar]
- Neal, B.; Sacks, G.; Swinburn, B.; Vandevijvere, S.; Dunford, E.; Snowdon, W.; Webster, J.; Barquera, S.; Friel, S.; Hawkes, C. Monitoring the levels of important nutrients in the food supply. Obes. Rev. 2013, 14, 49–58. [Google Scholar] [CrossRef] [PubMed]
- Food and Drug Administration. Food Labeling: Revision of the Nutrition and Supplement Facts Labels. 2016. Available online: https://www.federalregister.gov/documents/2014/03/03/2014-04387/food-labeling-revision-of-the-nutrition-and-supplement-facts-labels (accessed on 13 September 2016). [Google Scholar]
- Canadian Food Inspection Agency. Information within the Nutrition Facts Table-Mandatory Information and Serving Size. 2016. Available online: http://www.inspection.gc.ca/food/labelling/food-labelling-for-industry/nutrition-labelling/information-within-the-nutrition-facts-table/eng/1389198568400/1389198597278?chap=1 (accessed on 20 May 2016). [Google Scholar]
- Australian Government. Australia New Zealand Food Standards Code—Standard 1.2.8—Nutrition Information Requirements. 2016. Available online: https://www.legislation.gov.au/Details/F2016C00162 (accessed on 19 August 2016). [Google Scholar]
- European Commission. Regulation (EU) No. 1169/2011 of the European Parliament and of the Council of 25 October 2011 on the Provision of Food Information to Consumers. 2011. Available online: http://eur-lex.europa.eu/legal-content/EN/TXT/HTML/?uri=CELEX:32011R1169&from=en (accessed on 19 August 2016).
- Republic of South Africa. Foodstuffs, Cosmetics and Disinfectants Act (54/1972): Regulations Relating to the Labelling and Advertising of Foods: Amendment. 2014. Available online: http://www.gpwonline.co.za/Gazettes/Gazettes/37695_29-5_Health.pdf (accessed on 19 August 2016). [Google Scholar]
- Canadian Food Inspection Agency. Food Labelling for Industry: Sweeteners. 2015. Available online: http://www.inspection.gc.ca/food/labelling/food-labelling-for-industry/sweeteners/eng/1387749708758/1387750396304?chap=5#s12c5 (accessed on 13 April 2016). [Google Scholar]
- MacGregor, G.A.; Hashem, K.M. Action on sugar—Lessons from UK salt reduction programme. Lancet 2014, 383, 929–931. [Google Scholar] [CrossRef]
- Government of Canada. Consulting Canadians to Modernize and Improve Food Labels-What We Heard. 2014. Available online: http://www.hc-sc.gc.ca/fn-an/alt_formats/pdf/label-etiquet/modernize-report-moderniser-rapport-eng.pdf (accessed on 25 March 2015). [Google Scholar]
- Langlois, K.; Garriguet, D. Sugar consumption among Canadians of all ages. Health Rep. 2011, 22, 23–27. [Google Scholar] [PubMed]
- Brisbois, T.; Marsden, S.; Anderson, G.; Sievenpiper, J. Estimated intakes and sources of total and added sugars in the Canadian diet. Nutrients 2014, 6, 1899–1912. [Google Scholar] [CrossRef] [PubMed]
- Health Canada. Canadian Community Health Survey Cycle 2.2 Nutrition—A Guide to Accessing and Interpreting the Data. 2006. Available online: http://www.hc-sc.gc.ca/fn-an/surveill/nutrition/commun/cchs_guide_escc-eng.php (accessed on 10 September 2015). [Google Scholar]
- Health Canada. Canadian Nutrient File: Compilation of Canadian Food Composition Data—Users’ Guide. 2015. Available online: http://www.hc-sc.gc.ca/fn-an/alt_formats/pdf/nutrition/fiche-nutri-data/user_guide_utilisation-eng.pdf (accessed on 20 May 2016). [Google Scholar]
- Schermel, A.; Emrich, T.; Arcand, J.; Wong, C.; L’Abbé, M. Nutrition marketing on processed food packages in Canada: 2010 food label information program. Appl. Physiol. Nutr. Metab. 2013, 38, 666–672. [Google Scholar] [CrossRef] [PubMed]
- Canadian Grocer. Executive Report, Canadian Grocery Industry 2012–2013; Rogers Publishing Limited: Toronto, ON, Canada, 2012. [Google Scholar]
- Government of Canada. Food and Drug Regulations (C.R.C., c. 870). 2012. Available online: http://laws-lois.justice.gc.ca/PDF/C.R.C.,_c._870.pdf (accessed on 20 May 2016). [Google Scholar]
- Sodium Working Group. Sodium Reduction Strategy for Canada: Recommendations of the Sodium Working Group. 2010. Available online: http://www.hc-sc.gc.ca/fn-an/nutrition/sodium/related-info-connexe/strateg/reduct-strat-eng.php (accessed on 10 March 2015).
- Health Canada. Nutrient Data: Canadian Nutrient File. 2015. Available online: http://www.healthcanada.gc.ca/cnf (accessed on 10 October 2014). [Google Scholar]
- Health Canada. Guidance for the Food Industry on Reducing Sodium in Processed Foods. 2012. Available online: http://www.hc-sc.gc.ca/fn-an/alt_formats/pdf/legislation/guide-ld/2012-sodium-reduction-indust-eng.pdf (accessed on 24 August 2014). [Google Scholar]
- Hess, J.; Latulippe, M.; Ayoob, K.; Slavin, J. The confusing world of dietary sugars: Definitions, intakes, food sources and international dietary recommendations. Food Funct. 2012, 3, 477–486. [Google Scholar] [CrossRef] [PubMed]
- Louie, J.C.Y.; Lei, L.; Rangan, A.M. Reliability of a systematic methodology to estimate added sugars content of foods when applied to a recent Australian food composition database. J. Food Compost. Anal. 2016, 46, 36–42. [Google Scholar] [CrossRef]
- Louie, J.C.Y.; Moshtaghian, H.; Boylan, S.; Flood, V.M.; Rangan, A.M.; Barclay, A.W.; Brand-Miller, J.C.; Gill, T.P. A systematic methodology to estimate added sugar content of foods. Eur. J. Clin. Nutr. 2014, 69, 1–8. [Google Scholar] [CrossRef] [PubMed]
- United States Department of Agriculture. USDA Database for the Added Sugars Content of Selected Foods, Release 1. Available online: http://www.megaheart.com/pdf/addedsugars.pdf (accessed on 13 September 2016).
- Pan American Health Organization. Pan American Health Organization Nutrient Profile Model. 2016. Available online: http://iris.paho.org/xmlui/bitstream/handle/123456789/18621/9789275118733_eng.pdf?sequence=8&isAllowed=y (accessed on 5 May 2016).
- Health Canada. Eating Well with Canada’s Food Guide. 2011. Available online: http://www.hc-sc.gc.ca/fn-an/alt_formats/hpfb-dgpsa/pdf/food-guide-aliment/view_eatwell_vue_bienmang-eng.pdf (accessed on 26 February 2014). [Google Scholar]
- Ng, S.W.; Slining, M.M.; Popkin, B.M. Use of caloric and noncaloric sweeteners in US consumer packaged foods, 2005–2009. J. Acad. Nutr. Diet. 2012, 112, 1828–1834. [Google Scholar] [CrossRef] [PubMed]
- Goldfein, K.R.; Slavin, J.L. Why sugar is added to food: Food science 101. Compr. Rev. Food Sci. Food Saf. 2015, 14, 644–656. [Google Scholar] [CrossRef]
- United States Department of Agriculture. Scientific Report of the 2015 Dietary Guidelines Advisory Committee. 2015. Available online: http://www.health.gov/dietaryguidelines/2015-scientific-report/PDFs/Scientific-Report-of-the-2015-Dietary-Guidelines-Advisory-Committee.pdf (accessed on 13 February 2016). [Google Scholar]
- Gardner, C.; Wylie-Rosett, J.; Gidding, S. Nonnutritive sweeteners: Current use and health perspectives. Circulation 2012, 126, 509–519. [Google Scholar] [CrossRef] [PubMed]
- Gortmaker, S.L.; Swinburn, B.A.; Levy, D.; Carter, R.; Mabry, P.L.; Finegood, D.T.; Huang, T.; Marsh, T.; Moodie, M.L. Changing the future of obesity: Science, policy, and action. Lancet 2011, 378, 838–847. [Google Scholar] [CrossRef]
- Government of Canada. Regulations Amending the Food and Drug Regulations (Nutrition Labelling, Other Labelling Provisions and Food Colours) [Canada Gazette Part 1 Volume 149 No. 24]. 2015. Available online: http://www.gazette.gc.ca/rp-pr/p1/2015/2015-06-13/html/reg1-eng.php (accessed on 17 September 2016). [Google Scholar]
- Canadian Food Inspection Agency. Nutrition Labelling Compliance Test. 2014. Available online: http://www.inspection.gc.ca/english/fssa/labeti/nutricon/nutricone.shtml (accessed on 1 September 2015). [Google Scholar]
- Fitzpatrick, L.; Arcand, J.; L’Abbe, M.; Deng, M.; Duhaney, T.; Campbell, N. Accuracy of Canadian food labels for sodium content of food. Nutrients 2014, 6, 3326–3335. [Google Scholar] [CrossRef] [PubMed]


| Description | n (%) 1 |
|---|---|
| Step 1: Products that contain 0 g total sugar as declared on the NFt. Free sugar value = 0 g/100 g. | 3586 (23.5%) |
| Step 2: Products that contain no FSI 2 listed in the Ingredient List. Free sugar value = 0 g/100 g. | 2620 (17.2%) |
| Step 3: Products that contain ingredients which contribute no, or a minimal amount of naturally-occurring sugars (i.e., fruits, vegetables, dairy, grains). Free sugar value = 100% of the declared total sugar content (e.g., soft drinks, fruit drinks) 3. | 1642 (10.8%) |
| Step 4: Products that contain both naturally-occurring sugars and FSI, were compared to similar products without FSI (from steps 1 and 2) from the same subcategory (i.e., RTE breakfast cereals with FSI vs. RTE breakfast cereals without FSI) or minor category (i.e., milk, flavoured vs. milk, plain). The following equation [36] was used to calculate free sugar contents:
| 6876 (45.1%) |
| Step 5: Products that do not have unsweetened comparators in the same subcategory in FLIP, were assigned a free sugar value based on a substitute value from the USDA Database for the Added Sugars Content of Selected Foods [37]. A free sugar value that matches the proportion of total sugar from added sugar in a product from the USDA database was assigned. For example, a product was assigned a free sugar value at 80% of total sugar if the comparable USDA database product had 80% of the total sugar coming from added sugars. | 402 (2.6%) |
| Step 6: Products with no comparator in Step 5, were assigned a value reflective of the proportion of total sugar coming from free sugar in products within the same food group (e.g., a chocolate cake is assigned a free sugar value based on the percent of total sugar derived from free sugar content of other products in bakery products). Only products that contained free sugar (steps 3–5) were included in the calculation. | 133 (0.9%) |
| Type | Examples 1 | n (% Foods with FSI) 2 |
|---|---|---|
| Sugar (sucrose), dried and granulated | sugar, sucrose, brown sugar, cane sugar, pure sugar cane, pure cane sugar, raw cane sugar, powdered sugar, golden sugar, golden cane sugar, granulated cane sugar, granulated sugar cane juice, beet sugar, refined cane sugar, icing sugar, dried sugar cane juice, demerara sugar, light brown sugar, refinery syrup powder, invert sugar, evaporated cane juice, evaporated cane juice crystals, evaporated milled sugar, milled cane sugar, evaporated sugar cane juice, caster sugar, coarse sugar, turbinado sugar, natural cane sugar, turbinado cane sugar, white sugar, whole cane sugar, yellow sugar, dehydrated cane juice, dehydrated cane sugar, natural evaporated cane juice, confectioner’s sugar, fondant sugar, raw sugar, evaporated cane sugar, dehydrated cane syrup, dark brown sugar | 7517 (49.3%) |
| Glucose | glucose, glucose solids, glucose syrup, dextrose, dextrose anhydrous, dextrose syrup, anhydrous dextrose, dried glucose syrup, dextrin syrup | 2939 (19.3%) |
| Corn syrup | corn syrup, corn syrup powder, corn syrup solids, high maltose corn syrup, dried corn syrup extract, glucose-fructose, caramelized glucose-fructose, corn malt syrup, fructose- glucose, glucose-fructose syrup, corn sweetener | 1626 (10.7%) |
| Fruit juice | concentrated fruit juice, fruit juice, fruit juice concentrates, fruit juice from concentrate | 1202 (7.9%) |
| High-fructose corn syrup 3 | high fructose corn syrup, sugar/glucose-fructose, sugar/fructose-glucose, sugar and/or glucose-fructose, sugar and/or fructose-glucose | 873 (5.7%) |
| Molasses | molasses, dehydrated molasses, powdered refiner’s molasses, black molasses, blackstrap molasses, dried molasses, refiner’s molasses, cane juice molasses, dry blackstrap molasses, dry molasses, fancy molasses, fancy molasses powder, cooking molasses, molasses granules, molasses powder, molasses solids | 706 (4.6%) |
| Honey | honey, liquid honey, amber honey, pasteurized honey, honey granules, honey powder, honey solids, creamed honey, dried honey, granulated honey, raw honey, buckwheat honey, dried honey powder, dry honey, white honey | 625 (4.1%) |
| Sugar (sucrose) syrups 4 | cane sugar syrup, sucrose syrup, dried cane syrup, cane syrup, cane refiner’s syrup, refined sugar syrup, burnt sugar syrup, invert cane syrup, golden syrup, refiner’s syrup, invert sugar syrup, caramel, caramel sugar syrup, caramel syrup, evaporated cane syrup, liquid invert sugar, liquid sugar, liquid sucrose, evaporated cane juice syrup, sugar cane syrup, treacle | 514 (3.4%) |
| Other syrups | brown rice syrup, apple cider syrup, apple syrup, rice syrup, malt syrup, barley malt syrup, malted barley syrup, tapioca syrup, raisin syrup, sorghum syrup, wheat syrup | 439 (2.9%) |
| Fructose | fructose, fructose solids, fructose syrup, crystalline fructose | 324 (2.1%) |
| Other sugars | potato syrup solids, palm sugar, tapioca sugar, tapioca syrup solids, lactose, coconut sugar, oat syrup solids, maltose, isomaltose | 272 (1.8%) |
| Maple syrup | maple syrup, dehydrated maple syrup, maple sugar | 72 (0.5%) |
| Agave | agave, agave nectar | 27 (0.2%) |
| Food Group, Subcategory, and Minor Category | n | Total Sugar (g/100 g or 100 mL) | Free Sugar (g/100 g or 100 mL) | Free Sugar as a Percent of Total Sugar 2 | ||||||||||
|---|---|---|---|---|---|---|---|---|---|---|---|---|---|---|
| (SD) | Min | 25th | 50th | 75th | Max | (SD) | Min | 25th | 50th | 75th | Max | |||
| Bakery Products | 2197 | 17 (15) | 0 | 4 | 16 | 29 | 94 | 16 (14) | 0 | 2 | 14 | 28 | 94 | 79% |
| Baked Breakfast | 123 | 10 (7) | 1 | 5 | 7 | 10 | 38 | 5 (8) | 0 | 0 | 2 | 5 | 34 | 29% |
| Croissants | 6 | 11 (5) | 6 | 7 | 8 | 17 | 18 | 5 (6) | 1 | 1 | 2 | 12 | 12 | 38% |
| Pancakes, Waffles, French Toast | 92 | 7 (3) | 1 | 5 | 6 | 9 | 24 | 2 (3) | 0 | 0 | 0 | 3 | 20 | 18% |
| Tea Biscuits and Scones | 14 | 12 (8) | 4 | 7 | 11 | 14 | 28 | 9 (8) | 0 | 3 | 7 | 11 | 25 | 59% |
| Toaster Pastries | 11 | 26 (9) | 15 | 17 | 24 | 36 | 38 | 22 (10) | 10 | 12 | 19 | 32 | 34 | 80% |
| Baked Desserts | 88 | 30 (11) | 8 | 22 | 28 | 39 | 50 | 27 (10) | 6 | 18 | 24 | 36 | 46 | 88% |
| Brownies/Squares | 39 | 39 (6) | 22 | 35 | 40 | 43 | 50 | 36 (7) | 18 | 33 | 36 | 40 | 46 | 92% |
| Doughnut, Cake | 12 | 23 (6) | 12 | 19 | 23 | 27 | 30 | 21 (5) | 11 | 17 | 20 | 24 | 29 | 92% |
| Doughnut, Yeast | 5 | 19 (4) | 15 | 17 | 17 | 20 | 24 | 17 (3) | 14 | 16 | 16 | 18 | 23 | 93% |
| Fruit-Filled Pastries | 8 | 24 (4) | 19 | 20 | 24 | 28 | 31 | 17 (3) | 13 | 14 | 17 | 19 | 21 | 69% |
| Other Pastries (e.g., eclairs) | 14 | 23 (11) | 8 | 14 | 21 | 27 | 50 | 19 (10) | 6 | 11 | 18 | 20 | 41 | 80% |
| Sweet Buns (e.g., cinnamon rolls) | 10 | 23 (6) | 11 | 22 | 25 | 27 | 32 | 21 (6) | 9 | 21 | 23 | 25 | 29 | 91% |
| Bread Products | 548 | 6 (7) | 0 | 2 | 3 | 6 | 36 | 4 (7) | 0 | 0 | 2 | 4 | 35 | 58% |
| Bagels | 37 | 5 (3) | 2 | 4 | 5 | 7 | 16 | 3 (3) | 0 | 1 | 3 | 5 | 15 | 62% |
| Bread w/ Additions (e.g., garlic bread) | 31 | 2 (3) | 0 | 0 | 2 | 3 | 14 | 1 (1) | 0 | 0 | 0 | 1 | 4 | 27% |
| Bread w/ Raisins | 15 | 16 (6) | 5 | 9 | 16 | 18 | 24 | 12 (8) | 0 | 4 | 14 | 17 | 23 | 72% |
| Diet Bread | 6 | 4 (1) | 2 | 2 | 4 | 5 | 5 | 2 (1) | 1 | 1 | 2 | 3 | 3 | 52% |
| English Muffins | 24 | 2 (2) | 0 | 2 | 2 | 2 | 13 | 0 (1) | 0 | 0 | 0 | 0 | 2 | 19% |
| Flatbreads (e.g., pita, naan, tortillas) | 131 | 3 (4) | 0 | 0 | 2 | 4 | 20 | 2 (4) | 0 | 0 | 1 | 3 | 19 | 60% |
| Hearth Bread | 69 | 2 (2) | 0 | 0 | 2 | 2 | 9 | 1 (2) | 0 | 0 | 0 | 1 | 9 | 39% |
| Muffins and Quick Breads | 57 | 24 (7) | 7 | 20 | 25 | 28 | 36 | 22 (7) | 0 | 19 | 23 | 27 | 35 | 93% |
| Pantry Bread and Rolls | 178 | 4 (2) | 0 | 3 | 4 | 5 | 20 | 2 (2) | 0 | 1 | 2 | 3 | 8 | 56% |
| Cake | 246 | 30 (9) | 13 | 23 | 28 | 36 | 56 | 27 (8) | 10 | 20 | 25 | 32 | 52 | 89% |
| Cake Mixes | 52 | 23 (5) | 16 | 20 | 22 | 24 | 36 | 22 (5) | 15 | 19 | 20 | 23 | 36 | 95% |
| Cakes w/Icing/Filling | 21 | 32 (7) | 13 | 29 | 34 | 36 | 38 | 27 (6) | 10 | 24 | 28 | 31 | 36 | 86% |
| Cheesecakes | 35 | 25 (4) | 18 | 22 | 25 | 27 | 32 | 21 (3) | 15 | 18 | 21 | 23 | 27 | 83% |
| Coffee Cakes w/o Icing/Filling | 42 | 28 (5) | 19 | 25 | 27 | 30 | 43 | 26 (4) | 18 | 23 | 26 | 28 | 41 | 95% |
| Cream, Custard and Mousse Cake | 13 | 22 (4) | 16 | 18 | 21 | 23 | 32 | 18 (4) | 13 | 15 | 18 | 19 | 26 | 83% |
| Cupcakes | 28 | 43 (6) | 29 | 40 | 42 | 46 | 56 | 37 (7) | 24 | 33 | 36 | 41 | 51 | 85% |
| Ice Cream Cakes | 11 | 26 (5) | 13 | 23 | 26 | 28 | 35 | 21 (5) | 11 | 19 | 22 | 23 | 29 | 83% |
| Sauce Cakes | 4 | 27 (2) | 25 | 25 | 26 | 28 | 29 | 22 (1) | 20 | 21 | 22 | 23 | 24 | 83% |
| Snack Cakes | 29 | 41 (8) | 24 | 36 | 43 | 46 | 54 | 37 (8) | 23 | 31 | 37 | 44 | 52 | 91% |
| Sponge Cakes w/o Icing/Filling | 6 | 36 (4) | 30 | 34 | 37 | 38 | 43 | 36 (4) | 30 | 33 | 37 | 37 | 42 | 99% |
| Upside-down and Fruit Cakes | 5 | 31 (2) | 28 | 30 | 31 | 32 | 34 | 26 (2) | 23 | 25 | 26 | 27 | 28 | 83% |
| Cereal/Granola Bars | 202 | 30 (7) | 11 | 24 | 31 | 35 | 57 | 27 (7) | 11 | 22 | 27 | 32 | 53 | 91% |
| w/ Filling or Coating | 101 | 33 (6) | 18 | 29 | 34 | 37 | 45 | 29 (6) | 17 | 24 | 29 | 34 | 41 | 88% |
| w/o Filling or Coating | 101 | 27 (7) | 11 | 23 | 27 | 32 | 57 | 26 (7) | 11 | 21 | 25 | 30 | 53 | 94% |
| Cookies | 412 | 32 (10) | 0 | 27 | 32 | 38 | 94 | 32 (10) | 0 | 27 | 32 | 38 | 94 | 100% |
| Chocolate Chip | 81 | 32 (7) | 0 | 30 | 33 | 36 | 43 | 32 (7) | 0 | 30 | 33 | 36 | 43 | 100% |
| Chocolate Covered | 39 | 35 (11) | 0 | 29 | 37 | 41 | 56 | 35 (11) | 0 | 29 | 37 | 41 | 56 | 100% |
| Fruit-Filled | 21 | 33 (5) | 20 | 31 | 33 | 34 | 43 | 33 (5) | 20 | 31 | 33 | 34 | 43 | 100% |
| Other Cookies (e.g., macaroons, biscotti) | 116 | 31 (11) | 0 | 26 | 30 | 36 | 94 | 31 (11) | 0 | 26 | 30 | 36 | 94 | 100% |
| Sandwich Cookies | 64 | 35 (7) | 0 | 32 | 35 | 40 | 53 | 35 (7) | 0 | 32 | 35 | 40 | 53 | 100% |
| Shortbread | 8 | 20 (10) | 0 | 16 | 22 | 27 | 30 | 20 (10) | 0 | 16 | 22 | 27 | 30 | 100% |
| Social Tea/Sugar-Type | 53 | 24 (8) | 0 | 19 | 23 | 29 | 43 | 24 (8) | 0 | 19 | 23 | 29 | 43 | 100% |
| Sugar Wafer | 30 | 35 (17) | 0 | 26 | 40 | 47 | 58 | 35 (17) | 0 | 26 | 40 | 47 | 58 | 100% |
| Dough and Pastry | 62 | 6 (8) | 0 | 0 | 4 | 7 | 29 | 5 (8) | 0 | 0 | 3 | 5 | 28 | 78% |
| Pie Dough and Shells | 49 | 6 (8) | 0 | 0 | 4 | 8 | 29 | 6 (8) | 0 | 0 | 2 | 6 | 28 | 79% |
| Pizza Crust | 13 | 3 (1) | 2 | 3 | 4 | 4 | 6 | 3 (1) | 1 | 2 | 3 | 3 | 5 | 77% |
| Other Bakery Products | 416 | 6 (6) | 0 | 0 | 5 | 8 | 30 | 5 (6) | 0 | 0 | 4 | 7 | 30 | 85% |
| Pies, Tarts, Cobblers, Crisps | 100 | 20 (8) | 2 | 16 | 20 | 26 | 42 | 17 (8) | 0 | 11 | 16 | 22 | 40 | 75% |
| Butter/Sugar | 28 | 27 (5) | 18 | 25 | 27 | 29 | 42 | 23 (5) | 15 | 21 | 24 | 26 | 40 | 86% |
| Custard-Based | 13 | 27 (7) | 14 | 23 | 26 | 32 | 36 | 23 (7) | 9 | 19 | 23 | 29 | 33 | 86% |
| Fruit-Filled Pies | 59 | 16 (6) | 2 | 14 | 16 | 18 | 36 | 12 (6) | 0 | 10 | 12 | 14 | 33 | 67% |
| Beverages 3 | 1407 | 8 (5) | 0 | 4 | 9 | 11 | 17 | 7 (5) | 0 | 1 | 9 | 11 | 17 | 86% |
| Dairy and Alternatives | 242 | 6 (4) | 0 | 3 | 5 | 10 | 15 | 3 (3) | 0 | 0 | 3 | 6 | 12 | 49% |
| Drinkable Yogurt | 35 | 11 (3) | 3 | 11 | 12 | 13 | 14 | 7 (3) | 0 | 7 | 8 | 10 | 11 | 63% |
| Milk, Flavoured | 28 | 10 (2) | 5 | 9 | 10 | 11 | 12 | 5 (2) | 0 | 4 | 6 | 7 | 8 | 52% |
| Milk, Plain | 52 | 5 (0) | 3 | 4 | 4 | 5 | 6 | 0 (0) | 0 | 0 | 0 | 0 | 0 | 0% |
| Plant-Based Milk, Flavoured | 55 | 5 (2) | 0 | 4 | 5 | 7 | 10 | 4 (3) | 0 | 3 | 4 | 7 | 9 | 79% |
| Plant-Based Milk, Plain | 59 | 2 (1) | 0 | 0 | 2 | 3 | 5 | 1 (1) | 0 | 0 | 1 | 2 | 5 | 54% |
| Shakes | 11 | 12 (4) | 6 | 6 | 14 | 14 | 15 | 9 (4) | 3 | 3 | 11 | 11 | 12 | 70% |
| Smoothies | 2 | 8 (2) | 7 | 7 | 8 | 10 | 10 | 5 (2) | 4 | 4 | 5 | 6 | 6 | 60% |
| Energy Drinks | 14 | 7 (5) | 0 | 0 | 7 | 11 | 14 | 7 (5) | 0 | 0 | 7 | 11 | 14 | 100% |
| Energy Drinks, Diet or Light | 7 | 2 (2) | 0 | 0 | 0 | 4 | 4 | 2 (2) | 0 | 0 | 0 | 4 | 4 | 100% |
| Energy Drinks, Regular | 7 | 12 (1) | 11 | 11 | 11 | 13 | 14 | 12 (1) | 11 | 11 | 11 | 13 | 14 | 100% |
| Fruit Drinks | 654 | 10 (3) | 0 | 9 | 10 | 12 | 17 | 10 (3) | 0 | 9 | 10 | 12 | 17 | 100% |
| Fruit Drink | 40 | 9 (2) | 3 | 10 | 10 | 10 | 12 | 9 (2) | 3 | 10 | 10 | 10 | 12 | 100% |
| Fruit Juice | 378 | 10 (3) | 0 | 9 | 10 | 12 | 17 | 10 (3) | 0 | 9 | 10 | 12 | 17 | 100% |
| Fruit Juice-Drink, Combination | 236 | 10 (3) | 0 | 9 | 11 | 12 | 17 | 10 (3) | 0 | 9 | 11 | 12 | 17 | 100% |
| Hot Beverages | 58 | 7 (4) | 0 | 4 | 9 | 11 | 14 | 6 (4) | 0 | 3 | 7 | 9 | 13 | 83% |
| Cocoa | 27 | 9 (3) | 2 | 8 | 10 | 11 | 14 | 7 (4) | 0 | 6 | 9 | 9 | 12 | 70% |
| Coffee, Flavoured/Sweetened | 27 | 5 (4) | 0 | 1 | 5 | 9 | 13 | 5 (4) | 0 | 1 | 5 | 9 | 13 | 100% |
| Tea, Sweetened | 4 | 6 (4) | 1 | 3 | 6 | 9 | 9 | 4 (3) | 0 | 2 | 5 | 7 | 7 | 65% |
| Other Beverages | 39 | 1 (3) | 0 | 0 | 0 | 0 | 15 | 1 (3) | 0 | 0 | 0 | 0 | 15 | 67% |
| Soft Drinks | 272 | 7 (5) | 0 | 0 | 9 | 11 | 16 | 7 (5) | 0 | 0 | 9 | 11 | 16 | 100% |
| Iced Tea, Diet or Light | 13 | 1 (1) | 0 | 0 | 0 | 0 | 4 | 1 (1) | 0 | 0 | 0 | 0 | 4 | 100% |
| Iced Tea, Regular | 52 | 8 (2) | 0 | 7 | 9 | 10 | 12 | 8 (2) | 0 | 7 | 9 | 10 | 12 | 100% |
| Soft Drink, Regular | 121 | 11 (2) | 5 | 10 | 11 | 13 | 16 | 11 (2) | 5 | 10 | 11 | 13 | 16 | 100% |
| Soft Drink, Diet or Light | 86 | 0 (0) | 0 | 0 | 0 | 0 | 0 | 0 (0) | 0 | 0 | 0 | 0 | 0 | . |
| Sports Drinks | 30 | 4 (2) | 0 | 2 | 6 | 6 | 6 | 4 (2) | 0 | 2 | 6 | 6 | 6 | 100% |
| Sports Drinks, Diet or Light | 11 | 1 (1) | 0 | 0 | 2 | 2 | 3 | 1 (1) | 0 | 0 | 2 | 2 | 3 | 100% |
| Sports Drinks, Regular | 19 | 6 (0) | 5 | 6 | 6 | 6 | 6 | 6 (0) | 5 | 6 | 6 | 6 | 6 | 100% |
| Vegetable Drinks | 43 | 3 (1) | 1 | 2 | 3 | 4 | 6 | 1 (1) | 0 | 0 | 0 | 1 | 4 | 16% |
| Water | 55 | 0 (0) | 0 | 0 | 0 | 0 | 0 | 0 (0) | 0 | 0 | 0 | 0 | 0 | . |
| Cereals and Grain Products | 969 | 8 (11) | 0 | 0 | 3 | 14 | 53 | 6 (10) | 0 | 0 | 0 | 10 | 53 | 33% |
| Hot Breakfast Cereal | 107 | 12 (13) | 0 | 0 | 3 | 24 | 42 | 11 (13) | 0 | 0 | 0 | 23 | 41 | 76% |
| Flavoured/Sweetened | 48 | 26 (7) | 9 | 21 | 25 | 29 | 42 | 25 (8) | 0 | 20 | 25 | 29 | 41 | 96% |
| Plain | 59 | 1 (2) | 0 | 0 | 0 | 0 | 10 | 0 (0) | 0 | 0 | 0 | 0 | 0 | 0% |
| Other Cereals and Grains | 612 | 2 (2) | 0 | 0 | 2 | 4 | 29 | 0 (1) | 0 | 0 | 0 | 0 | 27 | 0% |
| Ready-to-Eat Breakfast Cereal | 250 | 21 (10) | 0 | 16 | 20 | 26 | 53 | 17 (10) | 0 | 11 | 17 | 22 | 53 | 76% |
| Flakes | 36 | 18 (10) | 7 | 10 | 13 | 23 | 43 | 13 (11) | 1 | 5 | 8 | 18 | 40 | 60% |
| Flakes w/ Fruit and/or Nuts | 30 | 25 (6) | 16 | 22 | 24 | 28 | 42 | 21 (6) | 11 | 17 | 19 | 23 | 38 | 81% |
| Granola/Muesli | 84 | 21 (5) | 4 | 18 | 22 | 25 | 32 | 16 (6) | 0 | 13 | 17 | 21 | 28 | 72% |
| High-Fibre Compact | 8 | 16 (8) | 0 | 13 | 18 | 20 | 25 | 16 (8) | 0 | 13 | 18 | 20 | 25 | 100% |
| Puffed | 13 | 15 (17) | 0 | 3 | 10 | 22 | 53 | 15 (17) | 0 | 3 | 10 | 22 | 53 | 100% |
| Semi-Compact/Formed | 59 | 25 (12) | 3 | 16 | 20 | 34 | 53 | 21 (13) | 0 | 11 | 15 | 31 | 51 | 74% |
| Shredded | 20 | 16 (8) | 0 | 15 | 18 | 22 | 24 | 16 (8) | 0 | 15 | 18 | 22 | 24 | 100% |
| Dairy Products and Substitutes | 1003 | 6 (9) | 0 | 0 | 3 | 10 | 77 | 3 (8) | 0 | 0 | 0 | 5 | 76 | 41% |
| Cottage Cheese | 26 | 5 (2) | 3 | 4 | 5 | 5 | 12 | 1 (2) | 0 | 0 | 0 | 0 | 8 | 12% |
| Cottage Cheese, Flavoured | 5 | 10 (2) | 8 | 8 | 10 | 12 | 12 | 6 (2) | 4 | 4 | 6 | 8 | 8 | 57% |
| Cottage Cheese, Plain | 21 | 4 (1) | 3 | 4 | 4 | 5 | 6 | 0 (0) | 0 | 0 | 0 | 0 | 1 | 2% |
| Cream or Cream Substitute | 85 | 14 (13) | 0 | 6 | 11 | 22 | 58 | 13 (13) | 0 | 0 | 10 | 22 | 57 | 73% |
| Cream, Aerosol or Whipped | 27 | 16 (5) | 7 | 11 | 17 | 22 | 25 | 15 (6) | 4 | 11 | 15 | 20 | 23 | 90% |
| Cream, Liquid | 50 | 15 (15) | 0 | 6 | 7 | 33 | 58 | 13 (16) | 0 | 0 | 3 | 33 | 57 | 61% |
| Cream, Powder | 8 | 0 (0) | 0 | 0 | 0 | 0 | 0 | 0 (0) | 0 | 0 | 0 | 0 | 0 | . |
| Cream Cheese | 65 | 7 (4) | 0 | 7 | 7 | 7 | 25 | 1 (4) | 0 | 0 | 0 | 0 | 20 | 9% |
| Cream Cheese, Flavoured | 37 | 8 (4) | 0 | 7 | 7 | 7 | 25 | 2 (5) | 0 | 0 | 0 | 1 | 20 | 15% |
| Cream Cheese, Plain | 28 | 5 (2) | 0 | 3 | 7 | 7 | 10 | 0 (0) | 0 | 0 | 0 | 0 | 0 | 0% |
| Milk, Condensed | 36 | 18 (25) | 0 | 2 | 6 | 37 | 77 | 15 (26) | 0 | 0 | 0 | 30 | 76 | 29% |
| Coconut Milk (canned) | 18 | 7 (18) | 0 | 1 | 2 | 2 | 77 | 5 (18) | 0 | 0 | 0 | 0 | 76 | 11% |
| Condensed Milk | 8 | 58 (2) | 57 | 57 | 57 | 61 | 62 | 57 (2) | 55 | 55 | 55 | 59 | 60 | 97% |
| Evaporated Milk | 10 | 7 (2) | 6 | 6 | 6 | 6 | 13 | 0 (0) | 0 | 0 | 0 | 0 | 0 | 0% |
| Other Dairy Products and Substitutes | 468 | 1 (6) | 0 | 0 | 0 | 0 | 60 | 0 (2) | 0 | 0 | 0 | 0 | 9 | 42% |
| Cheese, unless listed separately | 327 | 0 (3) | 0 | 0 | 0 | 0 | 50 | 0 (0) | 0 | 0 | 0 | 0 | 0 | 0% |
| Dairy-Free Cheese and Spreads | 13 | 1 (1) | 0 | 0 | 0 | 0 | 4 | 0 (0) | 0 | 0 | 0 | 0 | 0 | 0% |
| Feta and Feta-Style Cheese | 40 | 0 (0) | 0 | 0 | 0 | 0 | 0 | 0 (0) | 0 | 0 | 0 | 0 | 0 | . |
| Hard Cheese | 32 | 7 (18) | 0 | 0 | 0 | 0 | 60 | 0 (0) | 0 | 0 | 0 | 0 | 0 | 0% |
| Processed Cheese | 56 | 7 (3) | 0 | 5 | 7 | 10 | 13 | 4 (4) | 0 | 0 | 4 | 9 | 9 | 53% |
| Soft Cheese | 71 | 3 (5) | 0 | 0 | 2 | 4 | 18 | 2 (4) | 0 | 0 | 0 | 1 | 17 | 40% |
| Soft Cheese, Savoury/Plain | 11 | 4 (1) | 3 | 3 | 4 | 4 | 5 | 0 (0) | 0 | 0 | 0 | 0 | 0 | 0% |
| Soft Cheese, Sweet | 45 | 1 (1) | 0 | 0 | 0 | 0 | 4 | 0 (0) | 0 | 0 | 0 | 0 | 2 | 13% |
| Ricotta | 15 | 11 (4) | 3 | 10 | 10 | 11 | 18 | 10 (4) | 2 | 9 | 9 | 10 | 17 | 88% |
| Sour Cream | 17 | 5 (2) | 3 | 3 | 6 | 6 | 7 | 0 (0) | 0 | 0 | 0 | 0 | 0 | 0% |
| Yogurt | 235 | 9 (4) | 1 | 4 | 11 | 12 | 17 | 6 (4) | 0 | 0 | 8 | 9 | 14 | 48% |
| Yogurt, Flavoured | 206 | 10 (4) | 2 | 7 | 11 | 12 | 17 | 6 (4) | 0 | 3 | 8 | 9 | 14 | 55% |
| Yogurt, Plain | 29 | 3 (1) | 1 | 3 | 3 | 4 | 6 | 0 (0) | 0 | 0 | 0 | 0 | 0 | 0% |
| Desserts 3,4 | 940 | 19 (19) | 0 | 11 | 15 | 20 | 160 | 17 (20) | 0 | 8 | 12 | 17 | 160 | 81% |
| Custard, Gelatin, Mousse and Pudding | 195 | 13 (7) | 0 | 10 | 15 | 18 | 26 | 12 (7) | 0 | 9 | 14 | 16 | 26 | 86% |
| Custard | 8 | 12 (4) | 9 | 10 | 11 | 14 | 19 | 12 (4) | 8 | 9 | 11 | 14 | 19 | 94% |
| Gelatin | 80 | 12 (8) | 0 | 0 | 15 | 15 | 26 | 12 (8) | 0 | 0 | 15 | 15 | 26 | 100% |
| Mousse | 6 | 5 (5) | 0 | 3 | 4 | 10 | 12 | 5 (4) | 0 | 2 | 3 | 9 | 11 | 83% |
| Pudding | 101 | 15 (6) | 0 | 12 | 16 | 19 | 22 | 12 (6) | 0 | 11 | 14 | 16 | 21 | 78% |
| Frozen Desserts | 626 | 14 (5) | 0 | 11 | 14 | 17 | 31 | 11 (5) | 0 | 7 | 10 | 14 | 30 | 75% |
| Bars | 134 | 19 (5) | 0 | 16 | 20 | 23 | 31 | 17 (5) | 0 | 14 | 18 | 21 | 29 | 89% |
| Cones, Filled | 25 | 16 (4) | 3 | 15 | 16 | 19 | 20 | 14 (4) | 0 | 12 | 13 | 16 | 17 | 79% |
| Dairy-Free | 14 | 11 (2) | 10 | 10 | 11 | 13 | 14 | 9 (2) | 7 | 7 | 10 | 11 | 12 | 80% |
| Frozen Yogurt | 56 | 12 (2) | 9 | 11 | 12 | 13 | 24 | 9 (2) | 6 | 8 | 9 | 10 | 21 | 75% |
| Ice Cream, Ice Milk | 292 | 12 (3) | 4 | 10 | 12 | 14 | 23 | 8 (3) | 0 | 6 | 8 | 10 | 20 | 65% |
| Ice Pops, Juice Bars, Cups | 37 | 17 (6) | 0 | 15 | 17 | 20 | 30 | 17 (6) | 0 | 15 | 17 | 20 | 30 | 100% |
| Sandwiches | 34 | 13 (3) | 4 | 12 | 13 | 15 | 20 | 9 (3) | 0 | 8 | 9 | 11 | 17 | 69% |
| Sherbet and Sorbet | 24 | 16 (4) | 10 | 13 | 16 | 19 | 25 | 14 (4) | 7 | 11 | 14 | 17 | 25 | 85% |
| Sundaes | 10 | 14 (3) | 10 | 12 | 15 | 17 | 18 | 11 (3) | 7 | 9 | 12 | 14 | 16 | 79% |
| Toppings and Fillings | 119 | 56 (33) | 0 | 28 | 53 | 70 | 160 | 56 (33) | 0 | 28 | 53 | 70 | 160 | 100% |
| Cake Frostings and Icings | 60 | 71 (35) | 0 | 46 | 65 | 100 | 160 | 71 (35) | 0 | 46 | 65 | 100 | 160 | 100% |
| Pie Fillings | 31 | 26 (9) | 8 | 21 | 25 | 28 | 53 | 26 (9) | 8 | 21 | 25 | 28 | 53 | 100% |
| Toppings, Dips, Spreads | 28 | 57 (22) | 0 | 50 | 55 | 69 | 113 | 57 (22) | 0 | 50 | 55 | 69 | 113 | 100% |
| Fats, Oils and Vinegars | 592 | 6 (9) | 0 | 0 | 0 | 7 | 63 | 4 (7) | 0 | 0 | 0 | 6 | 43 | 81% |
| Butter, Margarine, Oils | 242 | 0 (0) | 0 | 0 | 0 | 0 | 0 | 0 (0) | 0 | 0 | 0 | 0 | 0 | . |
| Mayonnaise | 39 | 5 (6) | 0 | 0 | 0 | 13 | 20 | 5 (6) | 0 | 0 | 0 | 13 | 20 | 100% |
| Salad Dressing | 311 | 10 (11) | 0 | 0 | 7 | 19 | 63 | 7 (8) | 0 | 0 | 5 | 12 | 43 | 79% |
| Salad Dressings | 253 | 9 (8) | 0 | 6 | 7 | 13 | 43 | 8 (8) | 0 | 2 | 6 | 13 | 43 | 91% |
| Vinegars | 58 | 16 (17) | 0 | 0 | 13 | 31 | 63 | 2 (7) | 0 | 0 | 0 | 0 | 42 | 12% |
| Fish and Seafood | 434 | 1 (2) | 0 | 0 | 0 | 1 | 22 | 1 (2) | 0 | 0 | 0 | 1 | 22 | 85% |
| Fruits | 444 | 25 (23) | 0 | 9 | 14 | 38 | 83 | 8 (15) | 0 | 0 | 0 | 9 | 73 | 30% |
| Canned Fruit | 157 | 12 (4) | 4 | 10 | 12 | 14 | 31 | 7 (4) | 0 | 5 | 7 | 10 | 28 | 54% |
| Canned in Juice | 70 | 12 (3) | 5 | 9 | 12 | 14 | 16 | 7 (3) | 0 | 4 | 7 | 9 | 11 | 53% |
| Canned in Syrup | 73 | 13 (3) | 8 | 11 | 13 | 15 | 31 | 9 (3) | 4 | 7 | 8 | 11 | 28 | 66% |
| Canned in Water | 14 | 5 (1) | 4 | 4 | 5 | 6 | 8 | 0 (0) | 0 | 0 | 0 | 0 | 0 | 0% |
| Dried Fruit | 152 | 51 (20) | 7 | 33 | 55 | 68 | 83 | 15 (23) | 0 | 0 | 0 | 32 | 73 | 22% |
| Sweetened Dried Fruit | 51 | 65 (14) | 33 | 65 | 68 | 76 | 83 | 44 (17) | 0 | 32 | 38 | 65 | 73 | 66% |
| Unsweetened Dried Fruit | 101 | 43 (18) | 7 | 33 | 38 | 60 | 75 | 0 (0) | 0 | 0 | 0 | 0 | 0 | 0% |
| Frozen Fruit | 61 | 8 (3) | 4 | 6 | 7 | 9 | 15 | 0 (0) | 0 | 0 | 0 | 0 | 0 | 0% |
| Fruit Sauces | 62 | 12 (3) | 7 | 9 | 10 | 15 | 20 | 3 (3) | 0 | 0 | 0 | 5 | 11 | 16% |
| Fruit Sauce, Sweetened | 27 | 15 (2) | 13 | 14 | 15 | 16 | 20 | 6 (2) | 0 | 5 | 5 | 7 | 11 | 38% |
| Fruit Sauce, Unsweetened | 35 | 9 (1) | 7 | 8 | 9 | 10 | 13 | 0 (0) | 0 | 0 | 0 | 0 | 0 | 0% |
| Other Fruits | 12 | 14 (21) | 0 | 0 | 0 | 40 | 50 | 14 (21) | 0 | 0 | 0 | 40 | 50 | 80% |
| Fruit Garnish (e.g., maraschino cherries) | 4 | 43 (5) | 40 | 40 | 40 | 45 | 50 | 42 (5) | 40 | 40 | 40 | 45 | 50 | 100% |
| Fruit Juice Ingredients | 8 | 0 (0) | 0 | 0 | 0 | 0 | 1 | 0 (0) | 0 | 0 | 0 | 0 | 0 | 0% |
| Meat, Eggs and Substitutes | 959 | 2 (3) | 0 | 0 | 0 | 2 | 21 | 1 (3) | 0 | 0 | 0 | 2 | 21 | 80% |
| Bacon | 58 | 0 (1) | 0 | 0 | 0 | 0 | 4 | 0 (1) | 0 | 0 | 0 | 0 | 4 | 100% |
| Cooked | 20 | 0 (1) | 0 | 0 | 0 | 0 | 4 | 0 (1) | 0 | 0 | 0 | 0 | 4 | 100% |
| Uncooked | 38 | 0 (1) | 0 | 0 | 0 | 0 | 2 | 0 (1) | 0 | 0 | 0 | 0 | 2 | 100% |
| Deli Meats | 257 | 1 (1) | 0 | 0 | 0 | 2 | 5 | 1 (1) | 0 | 0 | 0 | 2 | 5 | 93% |
| Dry-cured | 90 | 1 (1) | 0 | 0 | 0 | 1 | 3 | 1 (1) | 0 | 0 | 0 | 0 | 3 | 90% |
| Fully Cooked | 167 | 1 (1) | 0 | 0 | 1 | 2 | 5 | 1 (1) | 0 | 0 | 0 | 2 | 5 | 94% |
| Eggs and Egg Substitutes | 56 | 0 (2) | 0 | 0 | 0 | 0 | 10 | 0 (2) | 0 | 0 | 0 | 0 | 10 | 100% |
| Meat and Poultry | 498 | 2 (3) | 0 | 0 | 1 | 3 | 21 | 2 (3) | 0 | 0 | 0 | 2 | 21 | 78% |
| Meat Substitutes | 90 | 2 (2) | 0 | 0 | 1 | 2 | 11 | 1 (2) | 0 | 0 | 1 | 2 | 11 | 63% |
| Meat Analogues | 74 | 2 (2) | 0 | 0 | 1 | 2 | 11 | 1 (2) | 0 | 0 | 1 | 2 | 11 | 66% |
| Plain Tofu | 10 | 1 (1) | 0 | 0 | 0 | 1 | 2 | 0 (0) | 0 | 0 | 0 | 0 | 0 | 0% |
| Seasoned Tofu and Tempeh | 3 | 4 (4) | 0 | 0 | 4 | 9 | 9 | 4 (4) | 0 | 0 | 4 | 9 | 9 | 100% |
| Sweetened Tofu | 3 | 11 (1) | 10 | 10 | 11 | 11 | 11 | 10 (1) | 10 | 10 | 10 | 11 | 11 | 96% |
| Mixed Dishes, Sides and Entrees | 1580 | 3 (2) | 0 | 1 | 2 | 4 | 20 | 2 (2) | 0 | 0 | 1 | 2 | 19 | 48% |
| Beans | 36 | 6 (4) | 0 | 1 | 7 | 8 | 12 | 5 (4) | 0 | 0 | 6 | 8 | 12 | 79% |
| Baked Beans | 26 | 8 (2) | 4 | 6 | 8 | 9 | 12 | 7 (2) | 4 | 6 | 8 | 8 | 12 | 95% |
| Refried Beans | 10 | 1 (0) | 0 | 0 | 1 | 1 | 1 | 0 (0) | 0 | 0 | 0 | 0 | 0 | 17% |
| Canned Chili | 21 | 2 (1) | 1 | 2 | 2 | 3 | 4 | 1 (1) | 0 | 0 | 1 | 1 | 2 | 22% |
| Mixed Dishes, Other | 37 | 3 (2) | 0 | 1 | 3 | 4 | 8 | 1 (1) | 0 | 0 | 1 | 2 | 6 | 28% |
| Other Mixed Dishes | 17 | 2 (2) | 0 | 1 | 1 | 3 | 8 | 1 (2) | 0 | 0 | 0 | 0 | 6 | 17% |
| Taco Kits | 20 | 3 (1) | 2 | 3 | 4 | 4 | 6 | 1 (1) | 0 | 1 | 2 | 2 | 4 | 36% |
| Pizza and Frozen Sandwiches | 214 | 3 (2) | 1 | 2 | 3 | 4 | 10 | 3 (2) | 0 | 1 | 2 | 3 | 9 | 72% |
| Pizza | 161 | 3 (2) | 1 | 2 | 3 | 4 | 8 | 3 (2) | 0 | 1 | 2 | 4 | 7 | 71% |
| Pizza Snacks and Sandwiches | 53 | 4 (2) | 1 | 3 | 3 | 4 | 10 | 3 (2) | 0 | 2 | 2 | 3 | 9 | 76% |
| Potatoes | 126 | 1 (2) | 0 | 0 | 1 | 2 | 9 | 0 (1) | 0 | 0 | 0 | 0 | 8 | 20% |
| Fries | 49 | 1 (3) | 0 | 0 | 0 | 1 | 8 | 0 (0) | 0 | 0 | 0 | 0 | 1 | 14% |
| Hash Browns and Patties | 19 | 0 (1) | 0 | 0 | 0 | 1 | 2 | 0 (0) | 0 | 0 | 0 | 0 | 1 | 42% |
| Mashed and Scalloped | 58 | 2 (1) | 0 | 1 | 1 | 2 | 9 | 1 (1) | 0 | 0 | 0 | 0 | 8 | 19% |
| Prepared Salads | 61 | 5 (4) | 0 | 2 | 3 | 6 | 16 | 4 (4) | 0 | 1 | 3 | 6 | 15 | 75% |
| Coleslaw | 6 | 14 (1) | 12 | 13 | 14 | 15 | 16 | 13 (1) | 12 | 12 | 13 | 15 | 15 | 95% |
| Fish and Meat Salad | 11 | 3 (3) | 0 | 2 | 2 | 3 | 9 | 3 (3) | 0 | 2 | 2 | 3 | 9 | 100% |
| Grain-Based Salad | 6 | 4 (6) | 1 | 1 | 2 | 6 | 15 | 3 (6) | 0 | 0 | 1 | 5 | 14 | 40% |
| Pasta Salad | 8 | 4 (2) | 1 | 2 | 5 | 6 | 6 | 3 (2) | 0 | 1 | 3 | 5 | 5 | 58% |
| Potato Salad | 8 | 4 (1) | 3 | 3 | 4 | 5 | 6 | 4 (1) | 2 | 3 | 3 | 4 | 6 | 82% |
| Vegetable Salad | 22 | 5 (4) | 0 | 2 | 3 | 9 | 12 | 4 (4) | 0 | 1 | 2 | 8 | 11 | 72% |
| Refrigerated or Frozen | 775 | 3 (2) | 0 | 1 | 2 | 4 | 20 | 2 (2) | 0 | 0 | 1 | 2 | 19 | 46% |
| 170–285 g | 290 | 2 (2) | 0 | 1 | 2 | 3 | 12 | 1 (2) | 0 | 0 | 1 | 2 | 12 | 43% |
| Less than 170 g | 381 | 3 (3) | 0 | 1 | 2 | 4 | 20 | 2 (2) | 0 | 0 | 1 | 2 | 19 | 45% |
| More than 285 g | 104 | 3 (2) | 0 | 1 | 2 | 4 | 16 | 2 (3) | 0 | 0 | 2 | 3 | 15 | 56% |
| Shelf-Stable, Grain-Based Dishes | 310 | 2 (2) | 0 | 1 | 2 | 3 | 9 | 1 (1) | 0 | 0 | 0 | 1 | 8 | 36% |
| Pasta and Noodles | 177 | 3 (1) | 0 | 2 | 3 | 4 | 7 | 1 (1) | 0 | 0 | 1 | 1 | 5 | 25% |
| Rice and Grains | 116 | 1 (1) | 0 | 0 | 1 | 1 | 9 | 1 (1) | 0 | 0 | 0 | 1 | 8 | 51% |
| Stuffing | 17 | 2 (1) | 0 | 2 | 2 | 3 | 5 | 2 (1) | 0 | 1 | 2 | 2 | 4 | 79% |
| Nuts and Seeds | 205 | 5 (4) | 0 | 3 | 4 | 7 | 28 | 1 (4) | 0 | 0 | 0 | 0 | 25 | 11% |
| Butters, Pastes and Creams | 78 | 8 (6) | 0 | 6 | 7 | 8 | 28 | 3 (5) | 0 | 0 | 0 | 3 | 25 | 30% |
| Other than Peanut Butter | 28 | 4 (4) | 0 | 0 | 3 | 7 | 13 | 2 (4) | 0 | 0 | 0 | 2 | 10 | 28% |
| Peanut Butter | 50 | 9 (5) | 6 | 7 | 7 | 13 | 28 | 4 (6) | 0 | 0 | 2 | 9 | 25 | 31% |
| Nuts and Seeds | 127 | 4 (2) | 0 | 2 | 3 | 4 | 13 | 0 (0) | 0 | 0 | 0 | 0 | 0 | 0% |
| Nut and Seed Flours | 7 | 7 (5) | 0 | 4 | 7 | 13 | 13 | 0 (0) | 0 | 0 | 0 | 0 | 0 | 0% |
| Nuts and Seeds, Not for Snacking | 120 | 3 (2) | 0 | 2 | 3 | 4 | 8 | 0 (0) | 0 | 0 | 0 | 0 | 0 | 0% |
| Other Foods and Beverages | 274 | 6 (13) | 0 | 0 | 0 | 8 | 100 | 6 (13) | 0 | 0 | 0 | 6 | 100 | 87% |
| Baking Misc. (e.g., yeast, baking soda) | 15 | 0 (0) | 0 | 0 | 0 | 0 | 0 | 0 (0) | 0 | 0 | 0 | 0 | 0 | . |
| Seasoning, Topping, Breading Mix | 259 | 8 (14) | 0 | 0 | 0 | 13 | 100 | 7 (14) | 0 | 0 | 0 | 9 | 100 | 86% |
| Sauces, Dips and Condiments | 1204 | 11 (14) | 0 | 2 | 5 | 17 | 70 | 10 (15) | 0 | 0 | 2 | 17 | 70 | 63% |
| Condiments | 291 | 18 (17) | 0 | 0 | 19 | 33 | 66 | 18 (17) | 0 | 0 | 17 | 31 | 66 | 96% |
| Barbecue and Steak Sauce | 115 | 30 (14) | 0 | 21 | 31 | 38 | 66 | 30 (14) | 0 | 21 | 31 | 38 | 66 | 100% |
| Ketchup | 24 | 24 (8) | 7 | 20 | 27 | 27 | 33 | 18 (8) | 0 | 14 | 21 | 21 | 29 | 70% |
| Mustard | 54 | 9 (15) | 0 | 0 | 0 | 20 | 60 | 9 (15) | 0 | 0 | 0 | 20 | 60 | 100% |
| Other Condiments (e.g., hot sauce) | 98 | 9 (12) | 0 | 0 | 3 | 17 | 60 | 9 (12) | 0 | 0 | 3 | 17 | 60 | 97% |
| Dips | 259 | 3 (3) | 0 | 0 | 3 | 4 | 25 | 1 (3) | 0 | 0 | 0 | 1 | 23 | 24% |
| Dips and Salsa | 210 | 4 (3) | 0 | 3 | 3 | 5 | 25 | 1 (3) | 0 | 0 | 0 | 1 | 23 | 23% |
| Hummus and Legume Dips | 49 | 1 (2) | 0 | 0 | 0 | 3 | 10 | 1 (2) | 0 | 0 | 0 | 0 | 9 | 29% |
| Sauces | 654 | 11 (14) | 0 | 2 | 5 | 13 | 70 | 10 (15) | 0 | 0 | 3 | 13 | 70 | 65% |
| Curry Paste | 27 | 6 (4) | 0 | 3 | 5 | 7 | 16 | 3 (4) | 0 | 0 | 0 | 5 | 14 | 37% |
| Gravy and Cooking Sauce | 188 | 8 (12) | 0 | 0 | 3 | 9 | 48 | 8 (12) | 0 | 0 | 3 | 8 | 48 | 79% |
| Marinades | 60 | 15 (14) | 0 | 5 | 11 | 22 | 50 | 15 (14) | 0 | 5 | 11 | 22 | 50 | 100% |
| Pesto | 15 | 3 (6) | 0 | 0 | 0 | 5 | 20 | 0 (1) | 0 | 0 | 0 | 0 | 2 | 29% |
| Soya and Oriental Sauce | 61 | 16 (17) | 0 | 7 | 12 | 24 | 70 | 16 (17) | 0 | 7 | 12 | 24 | 70 | 98% |
| Sweet Sauce (e.g., plum sauce) | 73 | 35 (14) | 0 | 27 | 34 | 43 | 63 | 35 (14) | 0 | 27 | 34 | 43 | 63 | 100% |
| Tomato Sauce | 198 | 4 (2) | 0 | 3 | 5 | 5 | 8 | 2 (2) | 0 | 0 | 2 | 3 | 6 | 37% |
| White Sauce | 32 | 3 (2) | 2 | 2 | 3 | 4 | 7 | 1 (2) | 0 | 0 | 1 | 1 | 5 | 26% |
| Snacks | 854 | 10 (16) | 0 | 2 | 4 | 8 | 83 | 5 (10) | 0 | 0 | 0 | 4 | 65 | 44% |
| Chips, Corn and Rice Snacks | 412 | 4 (5) | 0 | 0 | 3 | 5 | 35 | 3 (5) | 0 | 0 | 1 | 3 | 34 | 59% |
| Extruded Snacks (e.g., cheese puffs) | 90 | 6 (8) | 0 | 2 | 5 | 7 | 35 | 5 (8) | 0 | 0 | 1 | 6 | 34 | 52% |
| Flavoured Chips | 194 | 4 (3) | 0 | 2 | 4 | 4 | 15 | 3 (3) | 0 | 1 | 3 | 3 | 14 | 68% |
| Plain Chips | 116 | 2 (4) | 0 | 0 | 0 | 2 | 30 | 1 (2) | 0 | 0 | 0 | 0 | 17 | 32% |
| Savoury Snack Mixes | 12 | 5 (2) | 2 | 3 | 5 | 6 | 9 | 3 (2) | 1 | 2 | 4 | 5 | 8 | 65% |
| Ethnic Snacks | 21 | 7 (12) | 0 | 2 | 4 | 8 | 54 | 5 (12) | 0 | 0 | 0 | 6 | 53 | 38% |
| Fruit Snacks (e.g., apple chips, fruit leather) | 40 | 61 (24) | 6 | 49 | 72 | 78 | 83 | 9 (14) | 0 | 0 | 0 | 24 | 37 | 12% |
| Meat Snacks | 42 | 9 (11) | 0 | 0 | 4 | 18 | 43 | 9 (11) | 0 | 0 | 4 | 18 | 43 | 96% |
| Meat and Poultry Jerky | 20 | 19 (9) | 7 | 12 | 18 | 21 | 43 | 19 (9) | 7 | 12 | 18 | 21 | 43 | 100% |
| Meat and Poultry Sticks | 22 | 1 (1) | 0 | 0 | 0 | 2 | 4 | 1 (1) | 0 | 0 | 0 | 2 | 4 | 88% |
| Nuts and Seeds | 225 | 13 (13) | 0 | 4 | 6 | 22 | 52 | 4 (9) | 0 | 0 | 0 | 3 | 41 | 15% |
| Mix w/ Fruit, Chocolate, Candy | 80 | 28 (10) | 10 | 20 | 28 | 33 | 52 | 12 (12) | 0 | 0 | 11 | 17 | 41 | 34% |
| Mix w/o Fruit, Chocolate, Candy | 145 | 5 (2) | 0 | 4 | 4 | 6 | 14 | 0 (1) | 0 | 0 | 0 | 0 | 8 | 5% |
| Popcorn | 80 | 9 (17) | 0 | 0 | 0 | 6 | 65 | 9 (17) | 0 | 0 | 0 | 4 | 65 | 63% |
| Plain/Savoury | 61 | 1 (2) | 0 | 0 | 0 | 2 | 6 | 0 (1) | 0 | 0 | 0 | 0 | 6 | 30% |
| Sweet | 19 | 35 (17) | 0 | 24 | 34 | 42 | 65 | 35 (17) | 0 | 24 | 34 | 42 | 65 | 100% |
| Pretzels | 34 | 12 (15) | 0 | 2 | 4 | 14 | 43 | 11 (15) | 0 | 1 | 3 | 13 | 42 | 80% |
| Coated or Filled | 14 | 26 (14) | 8 | 14 | 23 | 43 | 43 | 25 (14) | 7 | 13 | 22 | 42 | 42 | 97% |
| Plain | 20 | 2 (2) | 0 | 2 | 2 | 4 | 5 | 2 (1) | 0 | 0 | 1 | 3 | 4 | 66% |
| Soups | 464 | 1 (1) | 0 | 0 | 1 | 2 | 7 | 1 (1) | 0 | 0 | 0 | 1 | 7 | 52% |
| Bouillon and Broth | 110 | 0 (0) | 0 | 0 | 0 | 0 | 1 | 0 (0) | 0 | 0 | 0 | 0 | 1 | 94% |
| Broth | 56 | 0 (0) | 0 | 0 | 0 | 0 | 1 | 0 (0) | 0 | 0 | 0 | 0 | 1 | 90% |
| Dry Mix | 39 | 0 (0) | 0 | 0 | 0 | 0 | 1 | 0 (0) | 0 | 0 | 0 | 0 | 1 | 100% |
| Liquid Concentrates | 15 | 0 (0) | 0 | 0 | 0 | 0 | 0 | 0 (0) | 0 | 0 | 0 | 0 | 0 | 100% |
| Canned Condensed Soup | 76 | 1 (1) | 0 | 0 | 1 | 2 | 6 | 1 (1) | 0 | 0 | 0 | 1 | 6 | 45% |
| Cream or Cheese | 32 | 1 (1) | 0 | 0 | 1 | 2 | 2 | 0 (0) | 0 | 0 | 0 | 0 | 1 | 12% |
| Non-Cream | 44 | 2 (2) | 0 | 0 | 1 | 2 | 6 | 1 (2) | 0 | 0 | 1 | 2 | 6 | 69% |
| Dry Soup Mix | 55 | 1 (1) | 0 | 0 | 1 | 1 | 4 | 0 (1) | 0 | 0 | 0 | 1 | 3 | 37% |
| Cream or Cheese | 15 | 2 (1) | 0 | 1 | 2 | 3 | 3 | 1 (1) | 0 | 1 | 1 | 1 | 2 | 53% |
| Non-Cream | 40 | 1 (1) | 0 | 0 | 0 | 1 | 4 | 0 (1) | 0 | 0 | 0 | 0 | 3 | 30% |
| Fresh and Instant Oriental Noodle | 76 | 1 (1) | 0 | 0 | 1 | 1 | 3 | 1 (1) | 0 | 0 | 1 | 1 | 3 | 87% |
| Ready-to-Serve Soup | 147 | 2 (1) | 0 | 1 | 2 | 3 | 7 | 1 (1) | 0 | 0 | 0 | 2 | 7 | 30% |
| Cream or Cheese | 28 | 2 (2) | 0 | 0 | 1 | 4 | 7 | 2 (2) | 0 | 0 | 1 | 3 | 7 | 65% |
| Non-Cream Soup | 119 | 2 (1) | 0 | 1 | 2 | 3 | 6 | 1 (1) | 0 | 0 | 0 | 1 | 5 | 23% |
| Sugars and Sweets | 776 | 51 (17) | 0 | 43 | 50 | 60 | 100 | 51 (17) | 0 | 43 | 50 | 60 | 100 | 100% |
| Confectionery | 469 | 51 (16) | 0 | 45 | 51 | 60 | 100 | 51 (16) | 0 | 45 | 51 | 60 | 100 | 100% |
| Baking Candies (e.g., sprinkles, chocolate chips) | 33 | 53 (19) | 0 | 47 | 53 | 62 | 100 | 53 (19) | 0 | 47 | 53 | 62 | 100 | 100% |
| Breath Mints | 6 | 94 (5) | 88 | 93 | 93 | 100 | 100 | 94 (5) | 88 | 93 | 93 | 100 | 100 | 100% |
| Candies (e.g., licorice, gummies, jelly beans) | 151 | 56 (12) | 6 | 48 | 55 | 63 | 100 | 56 (12) | 6 | 48 | 55 | 63 | 100 | 100% |
| Chocolate and Candy Bars | 257 | 46 (15) | 0 | 42 | 49 | 54 | 80 | 46 (15) | 0 | 42 | 49 | 54 | 80 | 100% |
| Hard Candies | 9 | 70 (17) | 48 | 61 | 68 | 80 | 94 | 70 (17) | 48 | 61 | 68 | 80 | 94 | 100% |
| Marshmallows | 13 | 56 (4) | 52 | 52 | 54 | 57 | 67 | 56 (4) | 52 | 52 | 54 | 57 | 67 | 100% |
| Sugar | 7 | 98 (4) | 89 | 100 | 100 | 100 | 100 | 98 (4) | 89 | 100 | 100 | 100 | 100 | 100% |
| Icing Sugar | 1 | 89 (0) | 89 | 89 | 89 | 89 | 89 | 89 (0) | 89 | 89 | 89 | 89 | 89 | 100% |
| Sugar | 6 | 100 (0) | 100 | 100 | 100 | 100 | 100 | 100 (0) | 100 | 100 | 100 | 100 | 100 | 100% |
| Sweet Condiments | 300 | 50 (17) | 0 | 40 | 50 | 60 | 81 | 50 (17) | 0 | 40 | 50 | 60 | 81 | 100% |
| Bread Spreads (e.g., chocolate spread) | 13 | 52 (15) | 25 | 47 | 50 | 58 | 79 | 52 (15) | 25 | 47 | 50 | 58 | 79 | 100% |
| Fruit Preserve Spreads (e.g., jam, jelly) | 187 | 45 (14) | 0 | 35 | 45 | 55 | 75 | 45 (14) | 0 | 35 | 45 | 55 | 75 | 100% |
| Honey and Molasses | 38 | 76 (9) | 45 | 76 | 80 | 80 | 80 | 76 (9) | 45 | 76 | 80 | 80 | 80 | 100% |
| Syrups | 62 | 49 (16) | 3 | 40 | 50 | 61 | 81 | 49 (16) | 3 | 40 | 50 | 61 | 81 | 100% |
| Vegetables | 957 | 3 (6) | 0 | 0 | 2 | 4 | 40 | 2 (5) | 0 | 0 | 0 | 0 | 40 | 16% |
| Canned Vegetables and Legumes | 460 | 2 (2) | 0 | 0 | 1 | 3 | 29 | 0 (1) | 0 | 0 | 0 | 0 | 6 | 15% |
| Canned Tomatoes | 93 | 3 (1) | 1 | 2 | 3 | 4 | 6 | 0 (1) | 0 | 0 | 0 | 0 | 3 | 9% |
| Other Canned Vegetables | 367 | 2 (2) | 0 | 0 | 1 | 2 | 29 | 0 (1) | 0 | 0 | 0 | 0 | 6 | 17% |
| Dried Legumes | 86 | 3 (2) | 0 | 1 | 2 | 3 | 11 | 0 (0) | 0 | 0 | 0 | 0 | 0 | 0% |
| Fresh Vegetables | 54 | 3 (6) | 0 | 0 | 2 | 3 | 40 | 0 (2) | 0 | 0 | 0 | 0 | 18 | 3% |
| Frozen Vegetables | 155 | 3 (2) | 0 | 2 | 2 | 4 | 14 | 0 (0) | 0 | 0 | 0 | 0 | 4 | 2% |
| Frozen Vegetables w/ Sauce | 9 | 2 (2) | 0 | 2 | 2 | 3 | 5 | 1 (1) | 0 | 0 | 1 | 1 | 4 | 40% |
| Frozen Vegetables w/o Sauce | 146 | 3 (2) | 0 | 2 | 2 | 4 | 14 | 0 (0) | 0 | 0 | 0 | 0 | 0 | 0% |
| Vegetable Paste | 20 | 6 (5) | 0 | 0 | 9 | 9 | 13 | 0 (0) | 0 | 0 | 0 | 0 | 0 | 0% |
| Tomato Paste | 12 | 10 (1) | 9 | 9 | 9 | 9 | 13 | 0 (0) | 0 | 0 | 0 | 0 | 0 | 0% |
| Vegetable and Herb Paste | 8 | 0 (0) | 0 | 0 | 0 | 0 | 0 | 0 (0) | 0 | 0 | 0 | 0 | 0 | . |
| Pickled Vegetables | 182 | 8 (10) | 0 | 0 | 3 | 13 | 40 | 7 (10) | 0 | 0 | 0 | 13 | 40 | 57% |
| Sour or Spicy | 126 | 2 (4) | 0 | 0 | 0 | 3 | 29 | 0 (1) | 0 | 0 | 0 | 0 | 9 | 11% |
| Sweet | 56 | 21 (7) | 0 | 14 | 20 | 27 | 40 | 21 (7) | 0 | 14 | 20 | 27 | 40 | 100% |
| TOTAL | 15259 | 11 (16) | 0 | 1 | 4 | 13 | 160 | 9 (16) | 0 | 0 | 1 | 11 | 160 | 62% |
© 2016 by the authors; licensee MDPI, Basel, Switzerland. This article is an open access article distributed under the terms and conditions of the Creative Commons Attribution (CC-BY) license (http://creativecommons.org/licenses/by/4.0/).
Share and Cite
Bernstein, J.T.; Schermel, A.; Mills, C.M.; L’Abbé, M.R. Total and Free Sugar Content of Canadian Prepackaged Foods and Beverages. Nutrients 2016, 8, 582. https://doi.org/10.3390/nu8090582
Bernstein JT, Schermel A, Mills CM, L’Abbé MR. Total and Free Sugar Content of Canadian Prepackaged Foods and Beverages. Nutrients. 2016; 8(9):582. https://doi.org/10.3390/nu8090582
Chicago/Turabian StyleBernstein, Jodi T., Alyssa Schermel, Christine M. Mills, and Mary R. L’Abbé. 2016. "Total and Free Sugar Content of Canadian Prepackaged Foods and Beverages" Nutrients 8, no. 9: 582. https://doi.org/10.3390/nu8090582
APA StyleBernstein, J. T., Schermel, A., Mills, C. M., & L’Abbé, M. R. (2016). Total and Free Sugar Content of Canadian Prepackaged Foods and Beverages. Nutrients, 8(9), 582. https://doi.org/10.3390/nu8090582