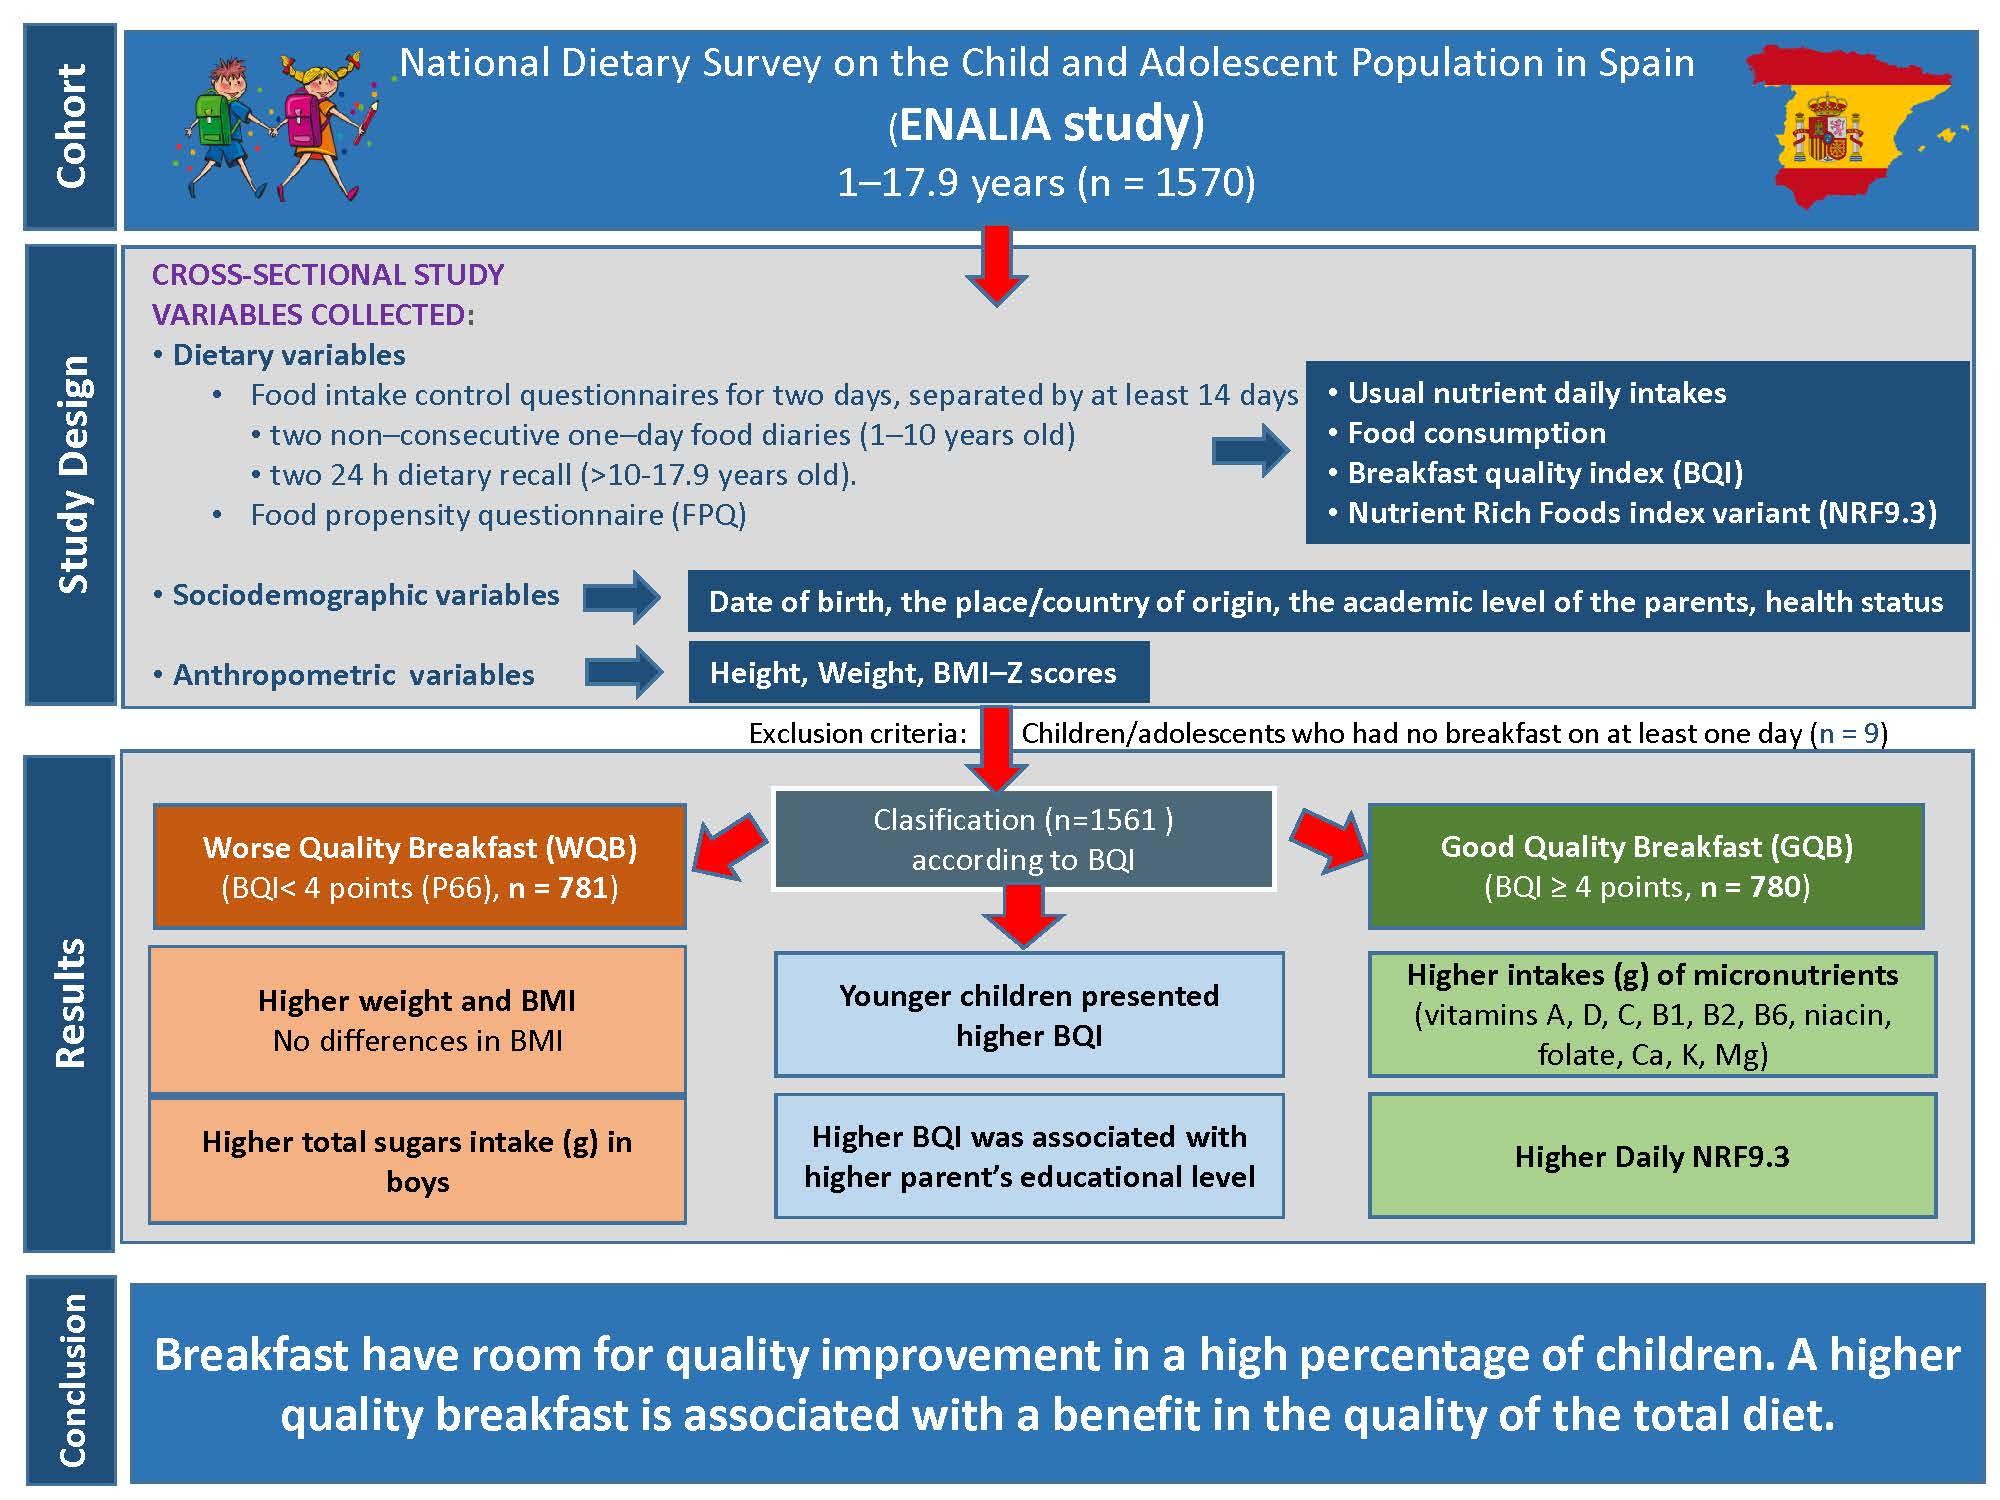
Breakfast Habits of a Representative Sample of the Spanish Child and Adolescent Population (The ENALIA Study): Association with Diet Quality

 , ,
, ,  ,
,  and
and
Abstract

1. Introduction
2. Materials and Methods
2.1. Study Design
2.2. Samples
2.3. Dietary Study
2.4. Assessment of Dietary Quality
2.5. Breakfast Quality
2.6. Handling of Misreporting
2.7. Socio–Demographic and Anthropometric Information
2.8. Statistical Analysis
3. Results
3.1. Description of the Sample
3.2. Breakfast Habits
3.3. Breakfast Quality
3.4. Differences in Personal and Anthropometric Data According to the Quality of Breakfast
3.5. Dietary Quality According to the Quality of Breakfast
4. Discussion
4.1. Breakfast Habits Description
4.2. Breakfast Quality
4.3. Association between the Quality of Breakfast and Dietary Quality
4.4. Strengths and Limitations
5. Conclusions
Supplementary Materials
Author Contributions
Funding
Acknowledgments
Conflicts of Interest
References
- Arenaza, L.; Munoz-Hernandez, V.; Medrano, M.; Oses, M.; Amasene, M.; Merchan-Ramirez, E.; Cadenas-Sanchez, C.; Ortega, F.B.; Ruiz, J.R.; Labayen, I. Association of breakfast quality and energy density with cardiometabolic risk factors in overweight/obese children: Role of physical activity. Nutrients 2018, 10, 1066. [Google Scholar] [CrossRef] [PubMed]
- Coulthard, J.D.; Palla, L.; Pot, G.K. Breakfast consumption and nutrient intakes in 4–18-year-olds: UK national diet and nutrition survey rolling programme (2008–2012). Br. J. Nutr. 2017, 118, 280–290. [Google Scholar] [CrossRef] [PubMed]
- Gibney, M.J.; Barr, S.I.; Bellisle, F.; Drewnowski, A.; Fagt, S.; Livingstone, B.; Masset, G.; Varela Moreiras, G.; Moreno, L.A.; Smith, J.; et al. Breakfast in human nutrition: The International Breakfast Research Initiative. Nutrients 2018, 10, 559. [Google Scholar] [CrossRef] [PubMed]
- Giménez-Legarre, N.; Flores-Barrantes, P.; Miguel-Berges, M.L.; Moreno, L.A.; Santaliestra-Pasias, A.M. Breakfast characteristics and their association with energy, macronutrients, and food intake in children and adolescents: A systematic review and meta-analysis. Nutrients 2020, 12, 2460. [Google Scholar] [CrossRef] [PubMed]
- Rampersaud, G.C.; Pereira, M.A.; Girard, B.L.; Adams, J.; Metzl, J.D. Breakfast habits, nutritional status, body weight, and academic performance in children and adolescents. J. Am. Diet. Assoc. 2005, 105, 743–760, quiz 761-742. [Google Scholar] [CrossRef] [PubMed]
- Lazzeri, G.; Ahluwalia, N.; Niclasen, B.; Pammolli, A.; Vereecken, C.; Rasmussen, M.; Pedersen, T.P.; Kelly, C. Trends from 2002 to 2010 in daily breakfast consumption and its socio-demographic correlates in adolescents across 31 countries participating in the HBSC study. PLoS ONE 2016, 11, e0151052. [Google Scholar] [CrossRef]
- López-Sobaler, A.M.; Cuadrado-Soto, E.; Peral-Suárez, A.; Aparicio, A.; Ortega, R.M. Importance of breakfast in the nutritional and health improvement of the population. Nutr. Hosp. 2018, 35, 3–6. [Google Scholar]
- Pollitt, E.; Cueto, S.; Jacoby, E.R. Fasting and cognition in well- and undernourished schoolchildren: A review of three experimental studies. Am. J. Clin. Nutr. 1998, 67, 779S–784S. [Google Scholar] [CrossRef]
- Pollitt, E.; Leibel, R.L.; Greenfield, D. Brief fasting, stress, and cognition in children. Am. J. Clin. Nutr. 1981, 34, 1526–1533. [Google Scholar] [CrossRef]
- Chugani, H.T. A critical period of brain development: Studies of cerebral glucose utilization with pet. Prev. Med. 1998, 27, 184–188. [Google Scholar] [CrossRef]
- Thorleifsdottir, B.; Bjornsson, J.K.; Benediktsdottir, B.; Gislason, T.; Kristbjarnarson, H. Sleep and sleep habits from childhood to young adulthood over a 10-year period. J. Psychosom. Res. 2002, 53, 529–537. [Google Scholar] [CrossRef]
- Deshmukh-Taskar, P.R.; Nicklas, T.A.; O’Neil, C.E.; Keast, D.R.; Radcliffe, J.D.; Cho, S. The relationship of breakfast skipping and type of breakfast consumption with nutrient intake and weight status in children and adolescents: The National Health and Nutrition Examination Survey 1999–2006. J. Am. Diet. Assoc. 2010, 110, 869–878. [Google Scholar] [CrossRef]
- Grieger, J.A.; Cobiac, L. Comparison of dietary intakes according to breakfast choice in Australian boys. Eur. J. Clin. Nutr. 2012, 66, 667–672. [Google Scholar] [CrossRef]
- López-Sobaler, A.M.; Cuadrado Soto, E.; Salas González, M.D.; Peral Suárez, A.; Jiménez Ortega, A.I.; Ortega, R.M. Role of yogurt in children’s breakfast. Nutr. Hosp. 2019, 36, 40–43. [Google Scholar] [CrossRef] [PubMed]
- Monzani, A.; Ricotti, R.; Caputo, M.; Solito, A.; Archero, F.; Bellone, S.; Prodam, F. A systematic review of the association of skipping breakfast with weight and cardiometabolic risk factors in children and adolescents. What should we better investigate in the future? Nutrients 2019, 11, 387. [Google Scholar] [CrossRef]
- Wennberg, M.; Gustafsson, P.E.; Wennberg, P.; Hammarstrom, A. Poor breakfast habits in adolescence predict the metabolic syndrome in adulthood. Public Health Nutr. 2015, 18, 122–129. [Google Scholar] [CrossRef] [PubMed]
- Hallstrom, L.; Labayen, I.; Ruiz, J.R.; Patterson, E.; Vereecken, C.A.; Breidenassel, C.; Gottrand, F.; Huybrechts, I.; Manios, Y.; Mistura, L.; et al. Breakfast consumption and CVD risk factors in European adolescents: The HELENA (Healthy Lifestyle in Europe by Nutrition in Adolescence) study. Public Health Nutr. 2013, 16, 1296–1305. [Google Scholar] [CrossRef]
- Pearson, N.; Biddle, S.J.; Gorely, T. Family correlates of fruit and vegetable consumption in children and adolescents: A systematic review. Public Health Nutr. 2009, 12, 267–283. [Google Scholar] [CrossRef]
- Vereecken, C.; Dupuy, M.; Rasmussen, M.; Kelly, C.; Nansel, T.R.; Al Sabbah, H.; Baldassari, D.; Jordan, M.D.; Maes, L.; Niclasen, B.V.; et al. Breakfast consumption and its socio-demographic and lifestyle correlates in schoolchildren in 41 countries participating in the HBSC study. Int. J. Public Health 2009, 54 (Suppl. 2), 180–190. [Google Scholar] [CrossRef]
- Sjoberg, A.; Hallberg, L.; Hoglund, D.; Hulthen, L. Meal pattern, food choice, nutrient intake and lifestyle factors in the Goteborg Adolescence Study. Eur. J. Clin. Nutr. 2003, 57, 1569–1578. [Google Scholar] [CrossRef]
- Guevara, R.M.; Urchaga, J.D.; Cabaco, A.S.; Moral-Garcia, J.E. The quality of breakfast and healthy diet in school-aged adolescents and their association with BMI, weight loss diets and the practice of physical activity. Nutrients 2020, 12, 2294. [Google Scholar] [CrossRef]
- Agencia Española de Seguridad Alimentaria y Nutrición (AESAN). Estudio Aladino 2019: Estudio sobre Alimentación, Actividad Física, Desarrollo Infantil y Obesidad en España 2019; Agencia Española de Seguridad Alimentaria y Nutrición, Ministerio de Consumo: Madrid, Spain, 2020; Available online: https://www.aesan.gob.es/AECOSAN/web/nutricion/detalle/aladino_2019.htm (accessed on 8 December 2020).
- Ruiz, E.; Valero, T.; Rodríguez, P.; Díaz-Roncero, A.; Gómez, A.; Ávila, J.M.; Varela-Moreiras, G. Estado de Situación Sobre el Desayuno en España; Fundación Española de la Nutrición (FEN): Madrid, Spain, 2018. [Google Scholar]
- Matthys, C.; De Henauw, S.; Bellemans, M.; De Maeyer, M.; De Backer, G. Breakfast habits affect overall nutrient profiles in adolescents. Public Health Nutr. 2007, 10, 413–421. [Google Scholar] [CrossRef]
- Ramsay, S.A.; Bloch, T.D.; Marriage, B.; Shriver, L.H.; Spees, C.K.; Taylor, C.A. Skipping breakfast is associated with lower diet quality in young US children. Eur. J. Clin. Nutr. 2018, 72, 548–556. [Google Scholar] [CrossRef]
- Afeiche, M.C.; Taillie, L.S.; Hopkins, S.; Eldridge, A.L.; Popkin, B.M. Breakfast dietary patterns among Mexican children are related to total-day diet quality. J. Nutr. 2017, 147, 404–412. [Google Scholar] [CrossRef]
- Barr, S.I.; DiFrancesco, L.; Fulgoni, V.L., 3rd. Breakfast consumption is positively associated with nutrient adequacy in Canadian children and adolescents. Br. J. Nutr. 2014, 112, 1373–1383. [Google Scholar] [CrossRef] [PubMed]
- Fayet-Moore, F.; McConnell, A.; Tuck, K.; Petocz, P. Breakfast and breakfast cereal choice and its impact on nutrient and sugar intakes and anthropometric measures among a nationally representative sample of Australian children and adolescents. Nutrients 2017, 9, 1045. [Google Scholar] [CrossRef]
- O’Neil, C.E.; Byrd-Bredbenner, C.; Hayes, D.; Jana, L.; Klinger, S.E.; Stephenson-Martin, S. The role of breakfast in health: Definition and criteria for a quality breakfast. J. Acad. Nutr. Diet. 2014, 114, S8–S26. [Google Scholar] [CrossRef] [PubMed]
- US Department of Health and Human Services. 2015–2020 Dietary Guidelines for Americans, 8th ed.; US Department of Agriculture: Washington, DC, USA, 2015.
- Aranceta, J.; Serra-Majem, L.; Ribas, L.; Perez-Rodrigo, C. Breakfast consumption in Spanish children and young people. Public Health Nutr. 2001, 4, 1439–1444. [Google Scholar] [CrossRef] [PubMed]
- Cuadrado-Soto, E.; López-Sobaler, A.M.; Jiménez-Ortega, A.I.; Aparicio, A.; Bermejo, L.M.; Hernández-Ruiz, A.; Lara Villoslada, F.; Leis, R.; Martínez de Victoria, E.; Moreno, J.M.; et al. Usual dietary intake, nutritional adequacy and food sources of calcium, phosphorus, magnesium and vitamin D of Spanish children aged one to <10 years. Findings from the EsNuPi study. Nutrients 2020, 12, 1787. [Google Scholar] [CrossRef]
- Chepulis, L.; Everson, N.; Ndanuko, R.; Mearns, G. The nutritional content of children’s breakfast cereals: A cross-sectional analysis of New Zealand, Australia, the UK, Canada and the USA. Public Health Nutr. 2020, 23, 1589–1598. [Google Scholar] [CrossRef]
- Potvin Kent, M.; Cameron, C.; Philippe, S. The healthfulness and prominence of sugar in child-targeted breakfast cereals in Canada. Health Promot. Chronic. Dis. Prev. Can. 2017, 37, 266–273. [Google Scholar] [CrossRef] [PubMed]
- Tong, T.; Rangan, A.; Gemming, L. Evaluating the nutritional content of children’s breakfast cereals in Australia. Children 2018, 5, 84. [Google Scholar] [CrossRef]
- Monteagudo, C.; Palacin-Arce, A.; Bibiloni Mdel, M.; Pons, A.; Tur, J.A.; Olea-Serrano, F.; Mariscal-Arcas, M. Proposal for a breakfast quality index (BQI) for children and adolescents. Public Health Nutr. 2013, 16, 639–644. [Google Scholar] [CrossRef]
- Ruiz, E.; Avila, J.M.; Valero, T.; Rodriguez, P.; Varela-Moreiras, G. Breakfast consumption in Spain: Patterns, nutrient intake and quality. Findings from the ANIBES study, a study from the International Breakfast Research Initiative. Nutrients 2018, 10, 1324. [Google Scholar] [CrossRef] [PubMed]
- Agencia Española de Seguridad Alimentaria y Nutrición (AESAN). Campaña Despierta, Desayuna; Ministerio de Sanidad y Consumo: Madrid, España, 2007. [Google Scholar]
- Comunidad de Madrid. Proyecto Desayunos Saludables e Higiene Bucodental; Comunidad de Madrid: Madrid, Spain, 2019. [Google Scholar]
- López-Sobaler, A.M.; Aparicio, A.; González-Rodríguez, L.G.; Cuadrado-Soto, E.; Rubio, J.; Marcos, V.; Sanchidrian, R.; Santos, S.; Perez-Farinos, N.; Dal Re, M.A.; et al. Adequacy of usual vitamin and mineral intake in Spanish children and adolescents: ENALIA study. Nutrients 2017, 9, 131. [Google Scholar] [CrossRef]
- López-Sobaler, A.M.; Aparicio, A.; Rubio, J.; Marcos, V.; Sanchidrian, R.; Santos, S.; Pérez-Farinós, N.; Dal-Re, M.A.; Villar-Villalba, C.; Yusta-Boyo, M.J.; et al. Adequacy of usual macronutrient intake and macronutrient distribution in children and adolescents in Spain: A national dietary survey on the child and adolescent population, ENALIA 2013–2014. Eur. J. Nutr. 2019, 58, 705–719. [Google Scholar] [CrossRef]
- Marcos Suarez, V.; Rubio Mañas, J.; Sanchidrián Fernández, R.; Robledo de Dios, T. Spanish national dietary survey on children and adolescents. EFSA Supporting Publ. 2015, 12, 900E. [Google Scholar] [CrossRef]
- European Food Safety Authority (EFSA). General principles for the collection of national food consumption data in the view of a pan-european dietary survey. EFSA J. 2009, 7, 1435. [Google Scholar] [CrossRef]
- European Food Safety Authority (EFSA). Guidance on the EU menu methodology. EFSA J. 2014, 12, 3944. [Google Scholar]
- Ortega, R.M.; López-Sobaler, A.M.; Requejo, A.M.; Andrés, P. Food Composition. A Basic Tool for Assessing Nutritional Status; Editorial Complutense: Madrid, Spain, 2010; p. 95. [Google Scholar]
- Sluik, D.; van Lee, L.; Engelen, A.I.; Feskens, E.J. Total, free, and added sugar consumption and adherence to guidelines: The Dutch National Food Consumption Survey 2007–2010. Nutrients 2016, 8, 70. [Google Scholar] [CrossRef]
- Roodenburg, A.J.; Popkin, B.M.; Seidell, J.C. Development of international criteria for a front of package food labelling system: The International Choices Programme. Eur. J. Clin. Nutr. 2011, 65, 1190–1200. [Google Scholar] [CrossRef]
- Drewnowski, A. The Nutrient Rich Foods Index helps to identify healthy, affordable foods. Am. J. Clin. Nutr. 2010, 91, 1095S–1101S. [Google Scholar] [CrossRef]
- Fulgoni, V.L., 3rd; Keast, D.R.; Drewnowski, A. Development and validation of the Nutrient-Rich Foods Index: A tool to measure nutritional quality of foods. J. Nutr. 2009, 139, 1549–1554. [Google Scholar] [CrossRef] [PubMed]
- Willett, W. Nutritional Epidemiology; Oxford University Press: Oxford, UK, 1990. [Google Scholar]
- Institute of Medicine. Dietary Reference Intakes for Calcium and Vitamin D.; The National Academies Press: Washington, DC, USA, 2011; p. 1132. [Google Scholar]
- Institute of Medicine. Dietary Reference Intakes for Calcium, Phosphorus, Magnesium, Vitamin D, and Fluoride; The National Academies Press: Washington, DC, USA, 1997; p. 448. [Google Scholar]
- Institute of Medicine. Dietary Reference intakes for Energy, Carbohydrate, Fiber, Fat, Fatty Acids, Cholesterol, Protein, and Amino Acids (Macronutrients); The National Academies Press: Washington, DC, USA, 2005; p. 1357. [Google Scholar]
- Institute of Medicine. Dietary Reference Intakes for Thiamin, Riboflavin, Niacin, Vitamin B6, Folate, Vitamin B12, Pantothenic Acid, Biotin, and Choline; The National Academies Press: Washington, DC, USA, 1998; p. 592. [Google Scholar]
- Institute of Medicine. Dietary Reference Intakes for Vitamin A, Vitamin K, Arsenic, Boron, Chromium, Copper, Iodine, Iron, Manganese, Molybdenum, Nickel, Silicon, Vanadium, and Zinc; The National Academies Press: Washington, DC, USA, 2001; p. 800. [Google Scholar]
- Institute of Medicine. Dietary Reference Intakes for Vitamin C, Vitamin E, Selenium, and Carotenoids; The National Academies Press: Washington, DC, USA, 2000; p. 528. [Google Scholar]
- Institute of Medicine. Dietary Reference Intakes for Water, Potassium, Sodium, Chloride, and Sulfate; The National Academies Press: Washington, DC, USA, 2005; p. 638. [Google Scholar]
- World Health Organization. Guideline: Sugars Intake for Adults and Children; World Health Organization: Geneva, Switzerland, 2015. [Google Scholar]
- World Health Organization. Diet, Nutrition, and the Prevention of Chronic Diseases; Report of a Joint WHO/FAO expert consultation; World Health Organization: Geneva, Switzerland, 2003; p. 149. [Google Scholar]
- Pereira, J.L.; Castro, M.A.; Hopkins, S.; Gugger, C.; Fisberg, R.M.; Fisberg, M. Proposal for a breakfast quality index for Brazilian population: Rationale and application in the Brazilian National Dietary Survey. Appetite 2017, 111, 12–22. [Google Scholar] [CrossRef] [PubMed]
- Schofield, W.N. Predicting basal metabolic rate, new standards and review of previous work. Hum. Nutr. Clin. Nutr. 1985, 39 (Suppl. 1), 5–41. [Google Scholar]
- Rodríguez-Artalejo, F.; Graciani, A.; Guallar-Castillón, P.; León-Muñoz, L.M.; Zuluaga, M.C.; López-García, E.; Gutiérrez-Fisac, J.L.; Taboada, J.M.; Aguilera, M.T.; Regidor, E.; et al. Rationale and methods of the Study on Nutrition and Cardiovascular Risk in Spain (ENRICA). Rev. Esp. Cardiol. 2011, 64, 876–882. [Google Scholar] [CrossRef] [PubMed]
- de Onis, M.; Onyango, A.W.; Borghi, E.; Siyam, A.; Nishida, C.; Siekmann, J. Development of a WHO growth reference for school-aged children and adolescents. Bull. World Health Organ. 2007, 85, 660–667. [Google Scholar] [CrossRef]
- WHO. Growth Reference Data for 5–19 Years; World Health Organization: Geneva, Switzerland, 2007. [Google Scholar]
- Serra-Majem, L.; Ribas-Barba, L.; Pérez-Rodrigo, C.; Bartrina, J.A. Nutrient adequacy in Spanish children and adolescents. Br. J. Nutr. 2006, 96 (Suppl. 1), S49–S57. [Google Scholar] [CrossRef]
- Nusser, S.M.; Carriquiry, A.L.; Dodd, K.W.; Fuller, W.A. A semiparametric transformation approach to estimating usual daily intake distributions. J. Am. Stat. Assoc. 1996, 91, 1440–1449. [Google Scholar] [CrossRef]
- Institute of Medicine. DRI Dietary Reference Intakes: Applications in Dietary Assessment; National Academies Press (US): Washington, DC, USA, 2000. [Google Scholar]
- Drewnowski, A.; Rehm, C.D.; Vieux, F. Breakfast in the United States: Food and nutrient intakes in relation to diet quality in National Health and Examination Survey 2011–2014. A study from the International Breakfast Research Initiative. Nutrients 2018, 10, 1200. [Google Scholar] [CrossRef]
- Bellisle, F.; Hebel, P.; Salmon-Legagneur, A.; Vieux, F. Breakfast consumption in French children, adolescents, and adults: A nationally representative cross-sectional survey examined in the context of the International Breakfast Research Initiative. Nutrients 2018, 10, 1056. [Google Scholar] [CrossRef] [PubMed]
- Olza, J.; Aranceta-Bartrina, J.; González-Gross, M.; Ortega, R.M.; Serra-Majem, L.; Varela-Moreiras, G.; Gil, A. Reported dietary intake, disparity between the reported consumption and the level needed for adequacy and food sources of calcium, phosphorus, magnesium and vitamin D in the Spanish population: Findings from the ANIBES Study. Nutrients 2017, 9, 168. [Google Scholar] [CrossRef] [PubMed]
- Ortega, R.M.; López-Sobaler, A.M.; Jiménez, A.I.; Navia, B.; Ruiz-Roso, B.; Rodríguez-Rodríguez, E.; López-Plaza, B.; Grupo de investigación VALORNUT. Food sources and average intake of calcium in a representative sample of Spanish schoolchildren. Nutr. Hosp. 2012, 27, 715–723. [Google Scholar] [PubMed]
- Kris-Etherton, P.M.; Krauss, R.M. Public health guidelines should recommend reducing saturated fat consumption as much as possible: Yes. Am. J. Clin. Nutr. 2020, 112, 13–18. [Google Scholar] [CrossRef] [PubMed]
- Astrup, A.; Magkos, F.; Bier, D.M.; Brenna, J.T.; de Oliveira Otto, M.C.; Hill, J.O.; King, J.C.; Mente, A.; Ordovás, J.M.; Volek, J.S.; et al. Saturated fats and health: A reassessment and proposal for food-based recommendations: JACC state-of-the-art review. J. Am. Coll Cardiol. 2020, 76, 844–857. [Google Scholar] [CrossRef] [PubMed]
- Duarte, C.; Boccardi, V.; Amaro Andrade, P.; Souza Lopes, A.C.; Jacques, P.F. Dairy versus other saturated fats source and cardiometabolic risk markers: Systematic review of randomized controlled trials. Crit. Rev. Food Sci. Nutr. 2020, 1–12. [Google Scholar] [CrossRef] [PubMed]
- Fidler Mis, N.; Braegger, C.; Bronsky, J.; Campoy, C.; Domellof, M.; Embleton, N.D.; Hojsak, I.; Hulst, J.; Indrio, F.; Lapillonne, A.; et al. Sugar in infants, children and adolescents: A position paper of the European Society for Paediatric Gastroenterology, Hepatology and Nutrition Committee on Nutrition. J. Pediatr. Gastroenterol. Nutr. 2017, 65, 681–696. [Google Scholar] [CrossRef]
- Ocke, M.; Brants, H.; Dofkova, M.; Freisling, H.; van Rossum, C.; Ruprich, J.; Slimani, N.; Temme, E.; Trolle, E.; Vandevijvere, S.; et al. Feasibility of dietary assessment methods, other tools and procedures for a pan-European food consumption survey among infants, toddlers and children. Eur. J. Nutr. 2015, 54, 721–732. [Google Scholar] [CrossRef]
- Livingstone, M.B.; Robson, P.J.; Wallace, J.M. Issues in dietary intake assessment of children and adolescents. Br. J. Nutr. 2004, 92 (Suppl. 2), S213–S222. [Google Scholar] [CrossRef]

| Total | Boys | Girls | |
|---|---|---|---|
| N | 1561 | 824 | 737 |
| Age (years) X ± SD | 8.0 ± 5.0 | 8.1 ± 5.0 | 7.9 ± 4.9 |
| Age group. n (%) | |||
| 1–3 years | 406 (26) | 217 (26.3) | 189 (25.6) |
| 4–8 years | 416 (26.6) | 210 (25.5) | 206 (28) |
| 9–13 years | 468 (30) | 242 (29.4) | 226 (30.7) |
| 14–17 years | 271 (17.4) | 155 (18.8) | 116 (15.7) |
| Anthropometric characteristics | |||
| Weight (kg) X ± SD # | 33.2 ± 18.3 | 34.4 ± 19.4 | 31.9 ± 17 ** |
| Height (cm) X ± SD # | 129.7 ± 30.6 | 131.3 ± 31.7 | 127.9 ± 29.2 * |
| BMI (kg/m2) X ± SD # | 17.9 ± 3.1 | 18.0 ± 3.0 | 17.8 ± 3.1 |
| Z–BMI # | 0.32 ± 1.22 | 0.31 ± 1.22 | 0.33 ± 1.21 |
| Father’s highest educational level. n (%) | |||
| Mandatory or less | 179 (11.6) | 106 (13.1) | 73 (10.0) |
| Secondary | 438 (28.4) | 221 (27.3) | 217 (28.8) |
| Vocational training/Bachelors | 323 (21) | 176 (21.7) | 147 (20.2) |
| University | 600 (39) | 308 (38.0) | 292 (40.1) |
| Mother’s highest educational level. n (%) | |||
| Mandatory or less | 121 (7.8) | 72 (8.8) | 49 (6.7) |
| Secondary | 377 (24.2) | 192 (23.4) | 185 (25.2) |
| Vocational training/Bachelors | 319 (20.5) | 167 (20.3) | 152 (20.7) |
| University | 739 (47.5) | 390 (47.5) | 349 (47.5) |
| Energy usual intake (EI) (kcal/day) # | |||
| 1–3 years | 1451 ± 202 | 1497 ± 210.8 | 1398 ± 177.6 ** |
| 4–8 years | 1780 ± 214.5 | 1880 ± 214.6 | 1679 ± 159.9 ** |
| 9–13 years | 2024 ± 258.7 | 2137 ± 229.3 | 1903 ± 232.5 ** |
| 14–17 years | 2199 ± 440.2 | 2412 ± 415.5 | 1915 ± 285.4 ** |
| EI/BMR # | |||
| 1–3 years | 2.05 ± 0.37 | 2.04 ± 0.37 | 2.07 ± 0.37 |
| 4–8 years | 1.75 ± 0.25 | 1.77 ± 0.25 | 1.72 ± 0.25 |
| 9–13 years | 1.53 ± 0.26 | 1.53 ± 0.25 | 1.52 ± 0.26 |
| 14–17 years | 1.37 ± 0.25 | 1.38 ± 0.27 | 1.35 ± 0.23 |
| 1–3 Years | 4–8 Years | 9–13 Years | 14–17 Years | p-Value † | 14–17 Years | p-Value $ | |||
|---|---|---|---|---|---|---|---|---|---|
| Boys | Girls | ||||||||
| N | 406 | 416 | 468 | 271 | 155 | 116 | |||
| Dairy | X ± SD | 142.8 ± 121.2 a | 201.8 ± 74.2 b | 197.9 ± 83.2 b | 191.1 ± 95.0 b | <0.001 | 206.0 ± 93.5 | 172.7 ± 94.0 | 0.010 |
| P50 (P5–P95) | 151.4 (0.0–305.0) | 216.1 (5.0–294.8) | 207.0 (0.0–320.0) | 204.8 (0.0–340.3) | 212.1 (0.0–351.3) | 200.8 (0.0–302.0) | |||
| Cereals | X ± SD | 15.6 ± 30.7 a | 18.4 ± 26.8 a | 23.1 ± 29.5 b | 20.4 ± 33.5 a,b | <0.001 | 19.8 ± 25.7 | 21.3 ± 41.1 | 0.902 |
| P50 (P5–P95) | 5.8 (0.0–50.3) | 11.8 (0.0–56.4) | 16.9 (0.0–71.9) | 10.5 (0.0–72.3) | 11.8 (0.0–72.6) | 9.8 (0.0–71.6) | |||
| Fruits | X ± SD | 6.7 ± 37.0 a | 9.3 ± 40.8 a | 19.8 ± 80.3 b | 28.1 ± 83.3 b | <0.001 | 24.9 ± 79.8 | 32.0 ± 87.4 | 0.454 |
| P50 (P5–P95) | 0.0 (0.0–40.1) | 0.0 (0.0–72.6) | 0.0 (0.0–126.0) | 0.0 (0.0–148.6) | 0.0 (0.0–148.6) | 0.0 (0.0–175.3) | |||
| Protein foods | X ± SD | 0.7 ± 3.8 a | 1.8 ± 7.9 a,b | 2.2 ± 7.1 b | 3.2 ± 14.3 b | 0.001 | 3.8 ± 17.9 | 2.4 ± 8.0 | 0.86 |
| P50 (P5–P95) | 0.0 (0.0–3.2) | 0.0 (0.0–12.2) | 0.0 (0.0–16.5) | 0.0 (0.0–23.0) | 0.0 (0.0–25.4) | 0.0 (0.0–19.5) | |||
| Added Products | X ± SD | 3.1 ± 5.6 a | 6.8 ± 8.4 b | 7.2 ± 9.8 b | 7.5 ± 7.3 b | <0.001 | 7.0 ± 6.7 | 8.1 ± 8.0 | 0.398 |
| P50 (P5–P95) | 0.0 (0.0–13.8) | 5.4 (0.0–19.6) | 5.1 (0.0–19.1) | 6.3 (0.0–22.3) | 6.2 (0.0–21.3) | 6.3 (0.0–26.8) | |||
| Fats and oils | X ± SD | 0.5 ± 1.9 a | 1.8 ± 3.6 b | 2.0 ± 3.9 b | 1.7 ± 3.7 b | <0.001 | 1.8 ± 3.6 | 1.6 ± 4.0 | 0.485 |
| P50 (P5–P95) | 0.0 (0.0–4.3) | 0.0 (0.0–9.8) | 0.0 (0.0–9.8) | 0.0 (0.0–9.1) | 0.0 (0.0–9.2) | 0.0 (0.0–8.7) | |||
| Baby foods | X ± SD | 69.4 ± 106.5 a | 4.8 ± 31.6 b | 0.7 ± 10.3 b | 0.5 ± 6.9 b | <0.001 | 0.0 ± 0.0 | 1.2 ± 10.3 | 0.044 |
| P50 (P5–P95) | 9.7 (0.0–290.3) | 0.0 (0.0–4.4) | 0.0 (0.0–0.0) | 0.0 (0.0–0.0) | 0.0 (0.0–0.0) | 0.0 (0.0–0.0) | |||
| Bakery | X ± SD | 13.5 ± 28.5 a | 21.9 ± 33.8 b | 21.1 ± 31.6 b | 21.7 ± 30.5 b | <0.001 | 20.0 ± 25.7 | 23.8 ± 35.5 | 0.774 |
| P50 (P5–P95) | 0.0 (0.0–61.2) | 9.3 (0.0–87.0) | 9.2 (0.0–77.3) | 10.5 (0.0–76.3) | 10.2 (0.0–72.1) | 10.6 (0.0–98.3) | |||
| Juices | X ± SD | 8.2 ± 31.7 a | 15.6 ± 42.8 a | 23.5 ± 52.9 b | 27.0 ± 52.8 b | <0.001 | 26.8 ± 52.9 | 27.2 ± 52.7 | 0.685 |
| P50 (P5–P95) | 0.0 (0.0–64.0) | 0.0 (0.0–104.3) | 0.0 (0.0–140.8) | 0.0 (0.0–154.2) | 0.0 (0.0–176.3) | 0.0 (0.0–151.9) | |||
| Other foods | X ± SD | 0.6 ± 2.9 a | 0.6 ± 2.9 a,b | 0.9 ± 3.6 b | 1.2 ± 4.7 b | 0.001 | 1.5 ± 5.5 | 0.8 ± 3.5 | 0.908 |
| P50 (P5–P95) | 0.0 (0.0–4.6) | 0.0 (0.0–4.3) | 0.0 (0.0–8.5) | 0.0 (0.0–9.0) | 0.0 (0.0–10.9) | 0.0 (0.0–3.0) | |||
| Total Sample | 1–3 Years | 4–8 Years | 9–13 Years | 14–17 Years | p-Value † | 14–17 Years | p-Value † | ||
|---|---|---|---|---|---|---|---|---|---|
| Boys | Girls | ||||||||
| N | 1561 | 406 | 416 | 468 | 271 | 155 | 116 | ||
| BQI Item, n (%) | |||||||||
| Cereals and derivate consumption | 1094 (62.3) | 103 (55.5) a | 92 (61.2) b,c | 409 (69.4) b | 195 (58.1) a,c | <0.001 | 103 (55.5) | 92 (61.2) | 0.296 |
| Fruits and/or vegetables consumption | 274 (15.6) | 39 (21.3) a | 36 (24.1) a | 109 (18.5) b | 76 (22.6) c | <0.001 | 39 (21.3) | 36 (24.1) | 0.541 |
| Dairy products consumption | 1573 (89.6) | 172 (92.9) a | 132 (87.9) b | 559 (95) b,c | 304 (90.7) c | <0.001 | 172 (92.9) | 132 (87.9) | 0.118 |
| Food rich in simple sugars (<5%E) | 702 (40.0) | 42 (22.6) a | 49 (32.8) b | 201 (34.1) c | 91 (27.1) c | <0.001 | 42 (22.6) | 49 (32.8) | 0.041 |
| Include MUFA–rich fats | 243 (13.8) | 26 (14.2) a | 17 (11.2) b | 100 (17) b | 43 (12.9) a,b | <0.001 | 26 (14.2) | 17 (11.2) | 0.459 |
| MUFA/SFA ratio (≥2:1) | 19 (1.1) | 4 (1.9) a | 3 (1.7) a | 6 (1.1) a | 6 (1.8) a | 0.531 | 4 (1.9) | 3 (1.7) | 0.911 |
| Energy intake from breakfast (20–25%E) | 287 (16.3) | 31 (16.8) a | 34 (22.4) a | 112 (19) a | 65 (19.3) a | <0.001 | 31 (16.8) | 34 (22.4) | <0.001 |
| Fruits. cereals and dairy product in the breakfast | 148 (8.4) | 21 (11.6) a | 19 (12.9) a,b | 62 (10.5) b,c | 41 (12.2) c | <0.001 | 21 (11.6) | 19 (12.9) | 0.726 |
| Calcium (>20% RDA) | 1484 (84.5) | 155 (83.9) a | 109 (72.4) a | 463 (78.7) b | 264 (78.7) b | <0.001 | 155 (83.9) | 109 (72.4) | 0.013 |
| Absence of butter or margarine | 1701 (96.9) | 174 (94.2) a | 145 (96.6) a,b | 566 (96.2) b | 319 (95.3) b,c | <0.001 | 174 (94.2) | 145 (96.6) | 0.265 |
| Breakfast quality BQI score (0–10), X ± SD | 4.29 ± 1.26 | 4.03 ± 1.18 a | 4.37 ± 1.2 b | 4.39 ± 1.33 b | 4.19 ± 1.27 a,b | <0.001 | 4.15 ± 1.28 | 4.23 ± 1.27 | 0.547 |
| WQB (BQI < P66) | GQB (BQI ≥ P66) | p-Value † | ||
|---|---|---|---|---|
| N | 781 | 780 | ||
| Dairy | X ± SD | 178.6 ± 97.7 | 200.0 ± 85.3 | <0.001 |
| P50 (P5–P95) | 203.5 (0.0–316.3) | 214.4 (0.0–312.6) | ||
| Cereals | X ± SD | 14.4 ± 33.0 | 26.1 ± 24.5 | <0.001 |
| P50 (P5–P95) | 0.0 (0.0–59.4) | 21.5 (0.0–71.6) | ||
| Fruits | X ± SD | 7.1 ± 36.4 | 25.8 ± 85.9 | <0.001 |
| P50 (P5–P95) | 0.0 (0.0–54.9) | 0.0 (0.0–138.3) | ||
| Protein foods | X ± SD | 1.1 ± 5.8 | 3.1 ± 11.2 | <0.001 |
| P50 (P5–P95) | 0.0 (0.0–0.0) | 0.0 (0.0–19.7) | ||
| Added Products | X ± SD | 7.3 ± 9.7 | 5.4 ± 6.7 | <0.001 |
| P50 (P5–P95) | 5.5 (0.0–21.3) | 4.1 (0.0–15.9) | ||
| Fats and oils | X ± SD | 1.2 ± 3.6 | 2.1 ± 3.5 | <0.001 |
| P50 (P5–P95) | 0.0 (0.0–9.2) | 0.0 (0.0–9.2) | ||
| Baby foods | X ± SD | 15.2 ± 61.7 | 11.0 ± 41.9 | 0.011 |
| P50 (P5–P95) | 0.0 (0.0–118.6) | 0.0 (0.0–88.5) | ||
| Bakery | X ± SD | 26.7 ± 35.2 | 13.1 ± 25.5 | <0.001 |
| P50 (P5–P95) | 15.5 (0.0–92.9) | 0.0 (0.0–56.3) | ||
| Juices | X ± SD | 21.4 ± 50.8 | 16.8 ± 43.1 | 0.039 |
| P50 (P5–P95) | 0.0 (0.0–147.9) | 0.0 (0.0–102.7) | ||
| Other foods | X ± SD | 0.7 ± 3.2 | 0.9 ± 3.9 | <0.001 |
| P50 (P5–P95) | 0.0 (0.0–6.6) | 0.0 (0.0–4.4) |
| WQB (BQI < P66) | GQB (BQI ≥ P66) | p Value † | |
| N | 781 | 780 | |
| BQI Item, n (%) | |||
| Cereals and derivate consumption | 381 (41.2) | 713 (85.7) | <0.001 |
| Fruits and/or vegetables consumption | 55 (5.9) | 219 (26.3) | <0.001 |
| Dairy products consumption | 791 (85.7) | 782 (93.9) | <0.001 |
| Food rich in simple sugars (<5%E) | 261 (28.3) | 441 (53) | <0.001 |
| Include MUFA–rich fats | 11 (1.2) | 232 (27.8) | <0.001 |
| MUFA/SFA ratio (≥2:1) | 0 (0) | 19 (2.3) | <0.001 |
| Energy intake from breakfast (20–25%E) | 71 (7.7) | 216 (25.9) | <0.001 |
| Fruits, cereals and dairy product in the breakfast | 0 (0) | 148 (17.8) | <0.001 |
| Calcium (>20% RDA) | 711 (77) | 773 (92.9) | <0.001 |
| Absence of butter or margarine | 877 (95) | 824 (99) | <0.001 |
| Breakfast quality BQI score (0–10), X ± SD | 3.42 ± 0.68 | 5.25 ± 1.05 | <0.001 |
| Total Sample | WQB BQI < P66 (<4) | GQB BQI ≥ P66 (≥4) | p-Value † | |
|---|---|---|---|---|
| N | 1561 | 781 | 780 | |
| Sex, n (%) | 0.032 | |||
| Male | 903 (51.4) | 452 (49) | 450 (54.1) | |
| Female | 853 (48.6) | 471 (51) | 382 (45.9) | |
| Age group. n (%) | <0.001 | |||
| 1–3 years | 289 (16.4) | 88 (9.6) | 200 (24) | |
| 4–8 years | 543 (30.9) | 320 (34.6) | 223 (26.8) | |
| 9–13 years | 589 (33.5) | 361 (39.1) | 228 (27.4) | |
| 14–17 years | 335 (19.1) | 154 (16.7) | 181 (21.7) | |
| Community size. n (%) | 0.702 | |||
| <10,000 | 341 (19.4) | 189 (20.5) | 152 (18.3) | |
| 10,000–100,000 | 728 (41.5) | 380 (41.2) | 348 (41.8) | |
| 100,000–500,000 | 429 (24.4) | 221 (23.9) | 208 (25) | |
| >500,000 | 257 (14.7) | 133 (14.4) | 124 (14.9) | |
| Father’s highest educational level. n (%) | <0.001 | |||
| Mandatory or less | 210 (12.1) | 137 (15) | 74 (9) | |
| Secondary | 497 (28.7) | 265 (29.2) | 232 (28.2) | |
| FP superior/Bachelors | 361 (20.9) | 191 (21.1) | 170 (20.6) | |
| University | 663 (38.3) | 314 (34.7) | 348 (42.3) | |
| Mother’s highest educational level. n (%) | 0.003 | |||
| Mandatory or less | 146 (8.4) | 91 (9.9) | 55 (6.6) | |
| Secondary | 434 (24.8) | 239 (26) | 195 (23.4) | |
| Vocational training/Bachelors | 358 (20.4) | 196 (21.4) | 161 (19.4) | |
| University | 812 (46.4) | 391 (42.6) | 421 (50.6) | |
| Sedentary free time. n (%) | ||||
| ≥1 h using computer on weekdays | 437 (29.9) | 253 (31.3) | 184 (28.3) | 0.205 |
| ≥1 h using computer on weekend | 898 (61.5) | 521 (64.4) | 377 (57.8) | 0.009 |
| ≥2 h using TV on weekdays | 365 (25.0) | 210 (26.0) | 154 (23.7) | 0.298 |
| ≥2 h using TV on weekend | 1034 (70.8) | 579 (71.6) | 455 (69.8) | 0.434 |
| Anthropometric characteristics. X ± SD | ||||
| Weight (kg) # | 35.6 ± 17.6 | 35.9 ± 16.1 | 35.4 ± 19.1 | 0.018 $ |
| Height (cm) # | 134.8 ± 27.8 | 136.3 ± 24.7 | 133.1 ± 30.8 | 0.013 $ |
| BMI (kg/m2) # | 18.1 ± 3.1 | 18.1 ± 3.1 | 18.1 ± 3.1 | 0.233 $ |
| Z–BMI/Age # | 0.3 ± 1.2 | 0.3 ± 1.2 | 0.4 ± 1.2 | 0.091 $ |
| Weight status by WHO. n (%) | 0.474 | |||
| Underweight | 32 (1.9) | 17 (2) | 15 (1.9) | |
| Normal | 1158 (69.8) | 608 (69.7) | 551 (69.8) | |
| Overweight | 344 (20.7) | 188 (21.6) | 156 (19.8) | |
| Obese | 126 (7.6) | 58 (6.7) | 67 (8.5) | |
| Energy intake (kcal/day) # | ||||
| 1–3 years | 1468 ± 209 | 1467 ± 204 | 1469 ± 211 | 0.776 |
| 4–8 years | 1779 ± 214 | 1780 ± 218 | 1778 ± 209 | 0.815 |
| 9–13 years | 2020 ± 258 | 2023 ± 259 | 2014 ± 257 | 0.856 |
| 14–17 years | 2189 ± 439 | 2087 ± 382 | 2276 ± 465 | <0.001 |
| EI/BMR # | ||||
| 1–3 years | 2.02 ± 0.37 | 2.03 ± 0.37 | 2.01 ± 0.38 | 0.302 |
| 4–8 years | 1.75 ± 0.25 | 1.76 ± 0.24 | 1.72 ± 0.26 | 0.079 |
| 9–13 years | 1.53 ± 0.26 | 1.54 ± 0.25 | 1.5 ± 0.27 | 0.082 |
| 14–17 years | 1.37 ± 0.25 | 1.35 ± 0.23 | 1.38 ± 0.27 | 0.372 |
| Boys | Girls | |||||||||
|---|---|---|---|---|---|---|---|---|---|---|
| Worse Quality Breakfast (WQB) | Good Quality Breakfast (GQB) | p Value † | Worse Quality Breakfast (WQB) | Good Quality Breakfast (GQB) | p Value † | |||||
| Mean ± SD | Median (P5–P95) | Mean ± SD | Median (P5–P95) | Mean ± SD | Median (P5–P95) | Mean ± SD | Median (P5–P95) | |||
| Energy (KJ/day) # | 8.437 ± 1.417 | 8.492 (6.142–10.696) | 8.390 ± 1.883 | 8.212 (5.547–11.667) | 0.010 | 7.452 ± 1.105 | 7.418 (5.680–9.331) | 7.217 ± 1.249 | 7.114 (5.266–9.435) | <0.001 |
| Energy (kcal/day) # | 2.017 ± 339 | 2.030 (1.468–2.556) | 2.005 ± 450 | 1.963 (1.326–2.788) | 0.010 | 1.781 ± 264 | 1.773 (1.358–2.230) | 1.725 ± 299 | 1.700 (1.259–2.255) | <0.001 |
| Protein g/day# | 76.1 ± 7.9 | 75.1 (65.2–88.9) | 77.2 ± 8.1 | 77.1 (64.1–92.0) | 0.028 | 75.5 ± 8.1 | 74.9 (62.5–90.0) | 77.1 ± 8.0 | 76.1 (65.3–92.4) | 0.005 |
| Protein (%E) # | 16.8 ± 1.7 | 16.6 (14.3–19.7) | 17.0 ± 1.8 | 17.0 (14.2–20.3) | 0.017 | 16.7 ± 1.8 | 16.6 (13.9–19.9) | 17.1 ± 1.8 | 16.8 (14.6–20.7) | 0.002 |
| Carbohydrates, total (g/day) | 212.7 ± 15.4 | 212.4 (188.6–238.7) | 212.0 ± 18.7 | 211.6 (180.6–241.9) | 0.546 | 210.8 ± 17.2 | 211.8 (179.8–238.8) | 211.1 ± 15.8 | 210.3 (185.7–237.0) | 0.799 |
| Carbohydrates, total (%E) | 46.9 ± 3.4 | 46.9 (41.7–52.6) | 46.8 ± 4.1 | 46.6 (40.0–53.3) | 0.573 | 46.6 ± 3.8 | 46.8 (39.8–52.8) | 46.7 ± 3.5 | 46.4 (41.1–52.4) | 0.736 |
| Total sugars (g/day) | 100.4 ± 16.9 | 100.2 (69.9–128.3) | 97.9 ± 16.1 | 97.5 (71.1–124.6) | 0.022 | 92.7 ± 16.8 | 92.6 (65.4–122.2) | 93.3 ± 14.9 | 93.3 (68.1–116.9) | 0.598 |
| Total sugars (%E) | 21.5 ± 3.9 | 21.5 (14.9–28.0) | 21.2 ± 4.0 | 21.2 (14.9–27.8) | 0.155 | 20.8 ± 4.0 | 20.7 (14.2–27.3) | 21.2 ± 3.7 | 21.2 (15.4–27.2) | 0.115 |
| Fat, total (g/day) # | 69.2 ± 6.4 | 69.7 (58.0–79.0) | 69.0 ± 6.8 | 69.1 (57.3–81.1) | 0.726 | 70.0 ± 6.5 | 69.7 (59.8–80.2) | 68.7 ± 6.7 | 69.1 (56.2–78.7) | 0.057 |
| Fat, total (%E) # | 34.6 ± 3.2 | 34.8 (29.0–39.4) | 34.5 ± 3.4 | 34.5 (28.7–40.6) | 0.670 | 34.9 ± 3.2 | 34.8 (29.7–40.1) | 34.3 ± 3.3 | 34.5 (28.1–39.3) | 0.046 |
| SFA (g/day) # | 24.5 ± 3.8 | 24.8 (18.0–30.3) | 24.5 ± 4.3 | 24.4 (17.8–32.1) | 0.464 | 25.1 ± 4.0 | 25.3 (18.3–31.0) | 24.9 ± 4.8 | 24.7 (18.0–33.1) | 0.863 |
| MUFA (g/day) # | 25.8 ± 4.0 | 26.0 (19.0–31.9) | 25.9 ± 4.2 | 25.7 (19.2–33.1) | 0.738 | 27.4 ± 3.8 | 27.6 (21.1–32.8) | 27.0 ± 4.2 | 27.6 (20.1–32.8) | 0.200 |
| PUFA (g/day) # | 10.4 ± 1.5 | 10.2 (8.1–13.3) | 10.2 ± 1.6 | 10.1 (7.8–12.8) | 0.049 | 10.4 ± 1.8 | 10.2 (7.9–13.9) | 10.3 ± 1.7 | 10.1 (7.8–13.1) | 0.378 |
| Fiber (g/day) # | 15.5 ± 3.2 | 15.1 (11.3–20.0) | 15.7 ± 3.0 | 15.4 (11.4–20.8) | 0.423 | 16.5 ± 4.0 | 16.0 (11.1–22.1) | 17.0 ± 3.7 | 16.6 (11.4–23.3) | 0.148 |
| Vitamin A (μg/day) # | 844.7 ± 273.0 | 801.7 (482.6–1.273.6) | 913.4 ± 278.0 | 876.1 (529.5–1.338.4) | <0.001 | 853.4 ± 307.2 | 805.9 (470.6–1.414.2) | 893.8 ± 270.2 | 850.6 (514.5–1.386.6) | 0.004 |
| Vitamin D (μg/day) # | 2.51 ± 1.12 | 2.31 (1.17–4.57) | 2.89 ± 1.11 | 2.76 (1.36–4.90) | <0.001 | 2.42 ± 1.33 | 2.07 (0.94–4.72) | 2.61 ± 1.20 | 2.43 (1.01–4.88) | 0.001 |
| Vitamin E (mg α–TE/day) # | 8.7 ± 2.3 | 8.5 (5.6–12.8) | 9.0 ± 2.3 | 8.8 (5.8–13.2) | 0.238 | 8.9 ± 2.3 | 8.4 (6.0–12.7) | 9.0 ± 2.1 | 8.8 (6.0–12.9) | 0.332 |
| Thiamin (mg/day) # | 1.20 ± 0.18 | 1.18 (0.94–1.51) | 1.27 ± 0.24 | 1.23 (0.96–1.73) | <0.001 | 1.18 ± 0.20 | 1.15 (0.90–1.56) | 1.24 ± 0.21 | 1.21 (0.95–1.61) | 0.001 |
| Riboflavin (mg/day) # | 1.71 ± 0.27 | 1.73 (1.24–2.16) | 1.83 ± 0.33 | 1.79 (1.35–2.46) | <0.001 | 1.65 ± 0.31 | 1.63 (1.19–2.18) | 1.77 ± 0.33 | 1.75 (1.32–2.38) | <0.001 |
| Niacin (mg Eq. Niacin/day) # | 29.1 ± 4.0 | 28.5 (23.3–36.0) | 29.8 ± 4.3 | 29.5 (23.5–38.4) | 0.033 | 28.7 ± 4.3 | 28.3 (22.4–36.9) | 29.7 ± 4.2 | 29.3 (23.9–37.8) | 0.002 |
| Vitamin B6 (mg/day) # | 1.81 ± 0.29 | 1.78 (1.35–2.30) | 1.90 ± 0.34 | 1.87 (1.40–2.54) | 0.004 | 1.76 ± 0.36 | 1.71 (1.24–2.43) | 1.90 ± 0.38 | 1.88 (1.35–2.62) | <0.001 |
| Vitamin B12 (μg/day) # | 4.3 ± 1.0 | 4.2 (3.0–6.0) | 4.3 ± 0.9 | 4.2 (3.1–5.9) | 0.259 | 4.5 ± 1.4 | 4.2 (2.7–6.6) | 4.5 ± 1.1 | 4.4 (2.8–6.3) | 0.135 |
| Folate (μg DFE b/day) # | 222.7 ± 44.5 | 216.8 (160.7–305.3) | 236.4 ± 48.7 | 229.3 (170.5–325.4) | 0.001 | 230.1 ± 48.8 | 224.2 (160.0–317.6) | 244.7 ± 51.4 | 242.2 (168.1–333.7) | 0.003 |
| Vitamin C (mg/day) # | 98.1 ± 39.2 | 91.3 (46.9–167.9) | 104.2 ± 37.8 | 98.3 (53.3–171.7) | 0.047 | 96.5 ± 37.2 | 91.0 (47.2–163.5) | 108.9 ± 40.4 | 103.4 (54.2–184.1) | 0.001 |
| Calcium (mg/day) # | 935 ± 168 | 935 (652–1.208) | 989 ± 171 | 975 (740–1.289) | <0.001 | 914 ± 152 | 924 (664–1.164) | 955 ± 152 | 945 (711–1.214) | <0.001 |
| Iron (mg/day) # | 11.2 ± 1.8 | 10.9 (9.1–14.7) | 11.6 ± 2.0 | 11.4 (8.9–15.6) | 0.88 | 11.3 ± 1.9 | 11.0 (8.9–15.1) | 11.6 ± 2.1 | 11.4 (8.8–15.9) | 0.124 |
| Potassium (mg/day) | 2.568 ± 296 | 2.589 (2.054–3.056) | 2.638 ± 343 | 2.616 (2.103–3.237) | 0.001 | 2.494 ± 350 | 2.460 (1.954–3.080) | 2.611 ± 333 | 2.590 (2.077–3.171) | <0.001 |
| Sodium (mg/day) # | 1.617 ± 319 | 1.572 (1.179–2.200) | 1.650 ± 295 | 1.631 (1.246–2.181) | 0.051 | 1.704 ± 284 | 1.696 (1.265–2.185) | 1.722 ± 282 | 1.707 (1.301–2.204) | 0.814 |
| Zinc (mg/day) # | 8.7 ± 1.0 | 8.6 (7.3–10.6) | 8.8 ± 1.0 | 8.7 (7.2–10.5) | 0.243 | 8.5 ± 1.1 | 8.3 (6.9–10.4) | 8.6 ± 1.1 | 8.4 (7.1–10.8) | 0.328 |
| Magnesium (mg/day) # | 236.1 ± 26.3 | 233.3 (194.2–282.3) | 241.8 ± 30.9 | 238.8 (198.1–295.5) | 0.021 | 238.7 ± 26.1 | 238.0 (196.7–282.1) | 247.2 ± 26.4 | 245.6 (206.7–290.5) | <0.001 |
| Selenium (μg/day) # | 86.1 ± 15.4 | 85.5 (62.4–112.1) | 87.2 ± 15.5 | 86.6 (63.8–114.6) | 0.409 | 90.1 ± 15.8 | 88.8 (67.6–117.0) | 91.8 ± 17.2 | 91.2 (66.3–118.6) | 0.199 |
| Iodine (μg/day) # | 91.2 ± 15.0 | 89.7 (68.8–118.9) | 92.2 ± 15.2 | 90.7 (68,7–118.1) | 0.189 | 86.4 ± 14.2 | 85.2 (66.4–110.2) | 90.0 ± 15.3 | 87.7 (67.7–117.0) | 0.001 |
| Nutrient Rich subscore # | 768.9 ± 53.4 | 787.9 (668.2–823.3) | 775.8 ± 51.7 | 796.6 (665,5–829,6) | 0.001 | 768.7 ± 54.7 | 790.3 (665.2–827.4) | 786,8 ± 44.2 | 807.1 (683.0–827.5) | <0.001 |
| Limiting subscore # | 284.0 ± 16.5 | 288.1 (253.1–300.0) | 282.9 ± 17.7 | 287.3 (249.3–300.0) | 0.773 | 284.1 ± 17.5 | 287.9 (247.4–300.0) | 282.3 ± 19.0 | 285.7 (246.7–300.0) | 0.255 |
| NRF 9.3 score # | 484.9 ± 52.8 | 499.1 (383.5–549.8) | 492.9 ± 51.8 | 508.4 (388.0–559.9) | 0.001 | 484.5 ± 56.4 | 499.2 (378.9–560.7) | 504.4 ± 46.8 | 513.5 (407.1–568.2) | <0.001 |
| Boys | Girls | |||||||||||||
|---|---|---|---|---|---|---|---|---|---|---|---|---|---|---|
| Worse Quality Breakfast (WQB) | Good Quality Breakfast (GQB) | p Value † | Worse Quality Breakfast (WQB) | Good Quality Breakfast (GQB) | p Value † | |||||||||
| <EAR, n (%) | <AMDR | >AMDR | <EAR, n (%) | <AMDR | >AMDR | <EAR, n (%) | <AMDR | >AMDR | <EAR, n (%) | <AMDR | >AMDR | |||
| [% > UL] | [% > UL] | [% > UL] | [% > UL] | |||||||||||
| Carbohydrates, total (g/day) | 0 (0.0) | 0 (0.0) | – | 0 (0.0) | 0 (0.0) | – | ||||||||
| Protein (g/day) | 0 (0.0) | 0 (0.0) | – | 0 (0.0) | 0 (0.0) | – | ||||||||
| Carbohydrates, total (%E) | 395 (100) | 0 (0) | 429 (100) | 0 (0) | – | 385 (99.7) | 0 (0) | 351 (100.0) | 0 (0) | 0.340 | ||||
| Protein (%E) | 0 (0) | 3 (0.8) | 0 (0) | 8 (1.9) | 0.167 | 0 (0) | 4 (1.0) | 0 (0) | 18 (5.1) | 0.001 | ||||
| Fat, total (%E) | 0 (0.0) | 159 (40.3) | 0 (0) | 128 (20.8) | 0.002 | 0 (0.0) | 160 (41.5) | 0 (0.0) | 102 (29.1) | <0.001 | ||||
| Vitamin A (μg/day) | 11 (2.8) | 9 (2.1) | 0.522 | 9 (2.3) | 8 (2.3) | 0.962 | ||||||||
| Vitamin D (μg/day) | 395 (100) [0.0] | 429 (100) [0.0] | – | 384 (99.5) [0.0] | 351 (100) [0.0] | 0.177 | ||||||||
| Vitamin E (mg α–TE/day) | 122 (30.9) [0.0] | 127 (29.6) [0.0] | 0.689 | 155 (40.2) [0.0] | 99 (28.2) [0.0] | 0.001 | ||||||||
| Thiamin (mg/day) | 0 (0) | 2 (0.5) | 0.174 | 4 (1) | 2 (0.6) | 0.175 | 0.47 | 0.482 | ||||||
| Riboflavin (mg/day) | 0 (0) | 0 (0) | – | 2 (0.5) | 0 (0) | 0.176 | 0.177 | |||||||
| Niacin (mg Eq. Niacin/day) | 0 (0) | 0 (0) | – | 0 (0) | 0 (0) | – | ||||||||
| Vitamin B6 (mg/day) | 0 (0) [0.0] | 0 (0) [0.0] | – | 0 (0) [0.0] | 1 (0.3) [0.0] | 0.294 | ||||||||
| Vitamin B12 (μg/day) | 0 (0) | 0 (0) | – | 1 (0.3) | 0 (0) | 0.340 | ||||||||
| Folate (μg DFE/day) | 136 (34.4) [1.3] | 109 (25.4) [1.4] | 0.005 | 213 (55.2) [0.0] | 204 (58.1) [0.0] | <0.001 | ||||||||
| Vitamin C (mg/day) | 6 (1.5) [0.0] | 5 (1.2) [0.0] | 0.659 | 4 (1) [0.0] | 2 (0.6) [0.0] | 0.482 | ||||||||
| Calcium (mg/day) | 157 (39.7) [0.0] | 119 (27.7) [0.0] | <0.001 | 204 (52.8) [0.0] | 130 (37.0) [0.0] | <0.001 | ||||||||
| Iron (mg/day) | 0 (0) [0.0] | 0 (0) [0.0] | – | 0 (0) [0.0] | 2 (0.6) [0.0] | 0.138 | ||||||||
| Potassium (mg/day) ‡ | 393 (99.5) | 421 (98.1) | 0.075 | 384 (99.5) | 347 (98.9) | 0.348 | ||||||||
| Sodium (mg/day) ‡ | 45 (11.4) | 46 (10.7) | 0.759 | 64 (16.6) | 55 (15.7) | 0.737 | ||||||||
| Zinc (mg/day) | 2 (0.5) [12.2] | 2 (0.5) [23.8] | 0.934 | 19 (4.9) [9.6] | 6 (1.7) [18.8] | 0.016 | ||||||||
| Magnesium (mg/day) | 40 (10.1) | 63 (14.7) | 0.048 | 68 (17.6) | 35 (10) | 0.003 | ||||||||
| Selenium (μg/day) | 0 (0) [0.3] | 0 (0) [1.6] | 0 (0) [1.0] | 0 (0) [2.3] | – | |||||||||
| Iodine (μg/day) | 41 (10.4) [0.0] | 51 (11.9) [0.0] | 0.492 | 96 (24.9) [0.0] | 58 (16.5) [0.0] | 0.005 | ||||||||
Publisher’s Note: MDPI stays neutral with regard to jurisdictional claims in published maps and institutional affiliations. |
© 2020 by the authors. Licensee MDPI, Basel, Switzerland. This article is an open access article distributed under the terms and conditions of the Creative Commons Attribution (CC BY) license (http://creativecommons.org/licenses/by/4.0/).
Share and Cite
Cuadrado-Soto, E.; López-Sobaler, A.M.; Jiménez-Ortega, A.I.; Bermejo, L.M.; Aparicio, A.; Ortega, R.M. Breakfast Habits of a Representative Sample of the Spanish Child and Adolescent Population (The ENALIA Study): Association with Diet Quality. Nutrients 2020, 12, 3772. https://doi.org/10.3390/nu12123772
Cuadrado-Soto E, López-Sobaler AM, Jiménez-Ortega AI, Bermejo LM, Aparicio A, Ortega RM. Breakfast Habits of a Representative Sample of the Spanish Child and Adolescent Population (The ENALIA Study): Association with Diet Quality. Nutrients. 2020; 12(12):3772. https://doi.org/10.3390/nu12123772
Chicago/Turabian StyleCuadrado-Soto, Esther, Ana M. López-Sobaler, Ana Isabel Jiménez-Ortega, Laura M. Bermejo, Aránzazu Aparicio, and Rosa M. Ortega. 2020. "Breakfast Habits of a Representative Sample of the Spanish Child and Adolescent Population (The ENALIA Study): Association with Diet Quality" Nutrients 12, no. 12: 3772. https://doi.org/10.3390/nu12123772
APA StyleCuadrado-Soto, E., López-Sobaler, A. M., Jiménez-Ortega, A. I., Bermejo, L. M., Aparicio, A., & Ortega, R. M. (2020). Breakfast Habits of a Representative Sample of the Spanish Child and Adolescent Population (The ENALIA Study): Association with Diet Quality. Nutrients, 12(12), 3772. https://doi.org/10.3390/nu12123772