Impact of Foods and Dietary Supplements Containing Hydroxycinnamic Acids on Cardiometabolic Biomarkers: A Systematic Review to Explore Inter-Individual Variability

 ,
,  ,
,  ,
, 
 ,
, 
 ,
,  ,
,  ,
,  , , ,
, , , 
Abstract
1. Introduction
2. Materials and Methods
2.1. Search Strategy and Study Selection
2.2. Data Extraction
2.3. Risk of Bias
3. Results
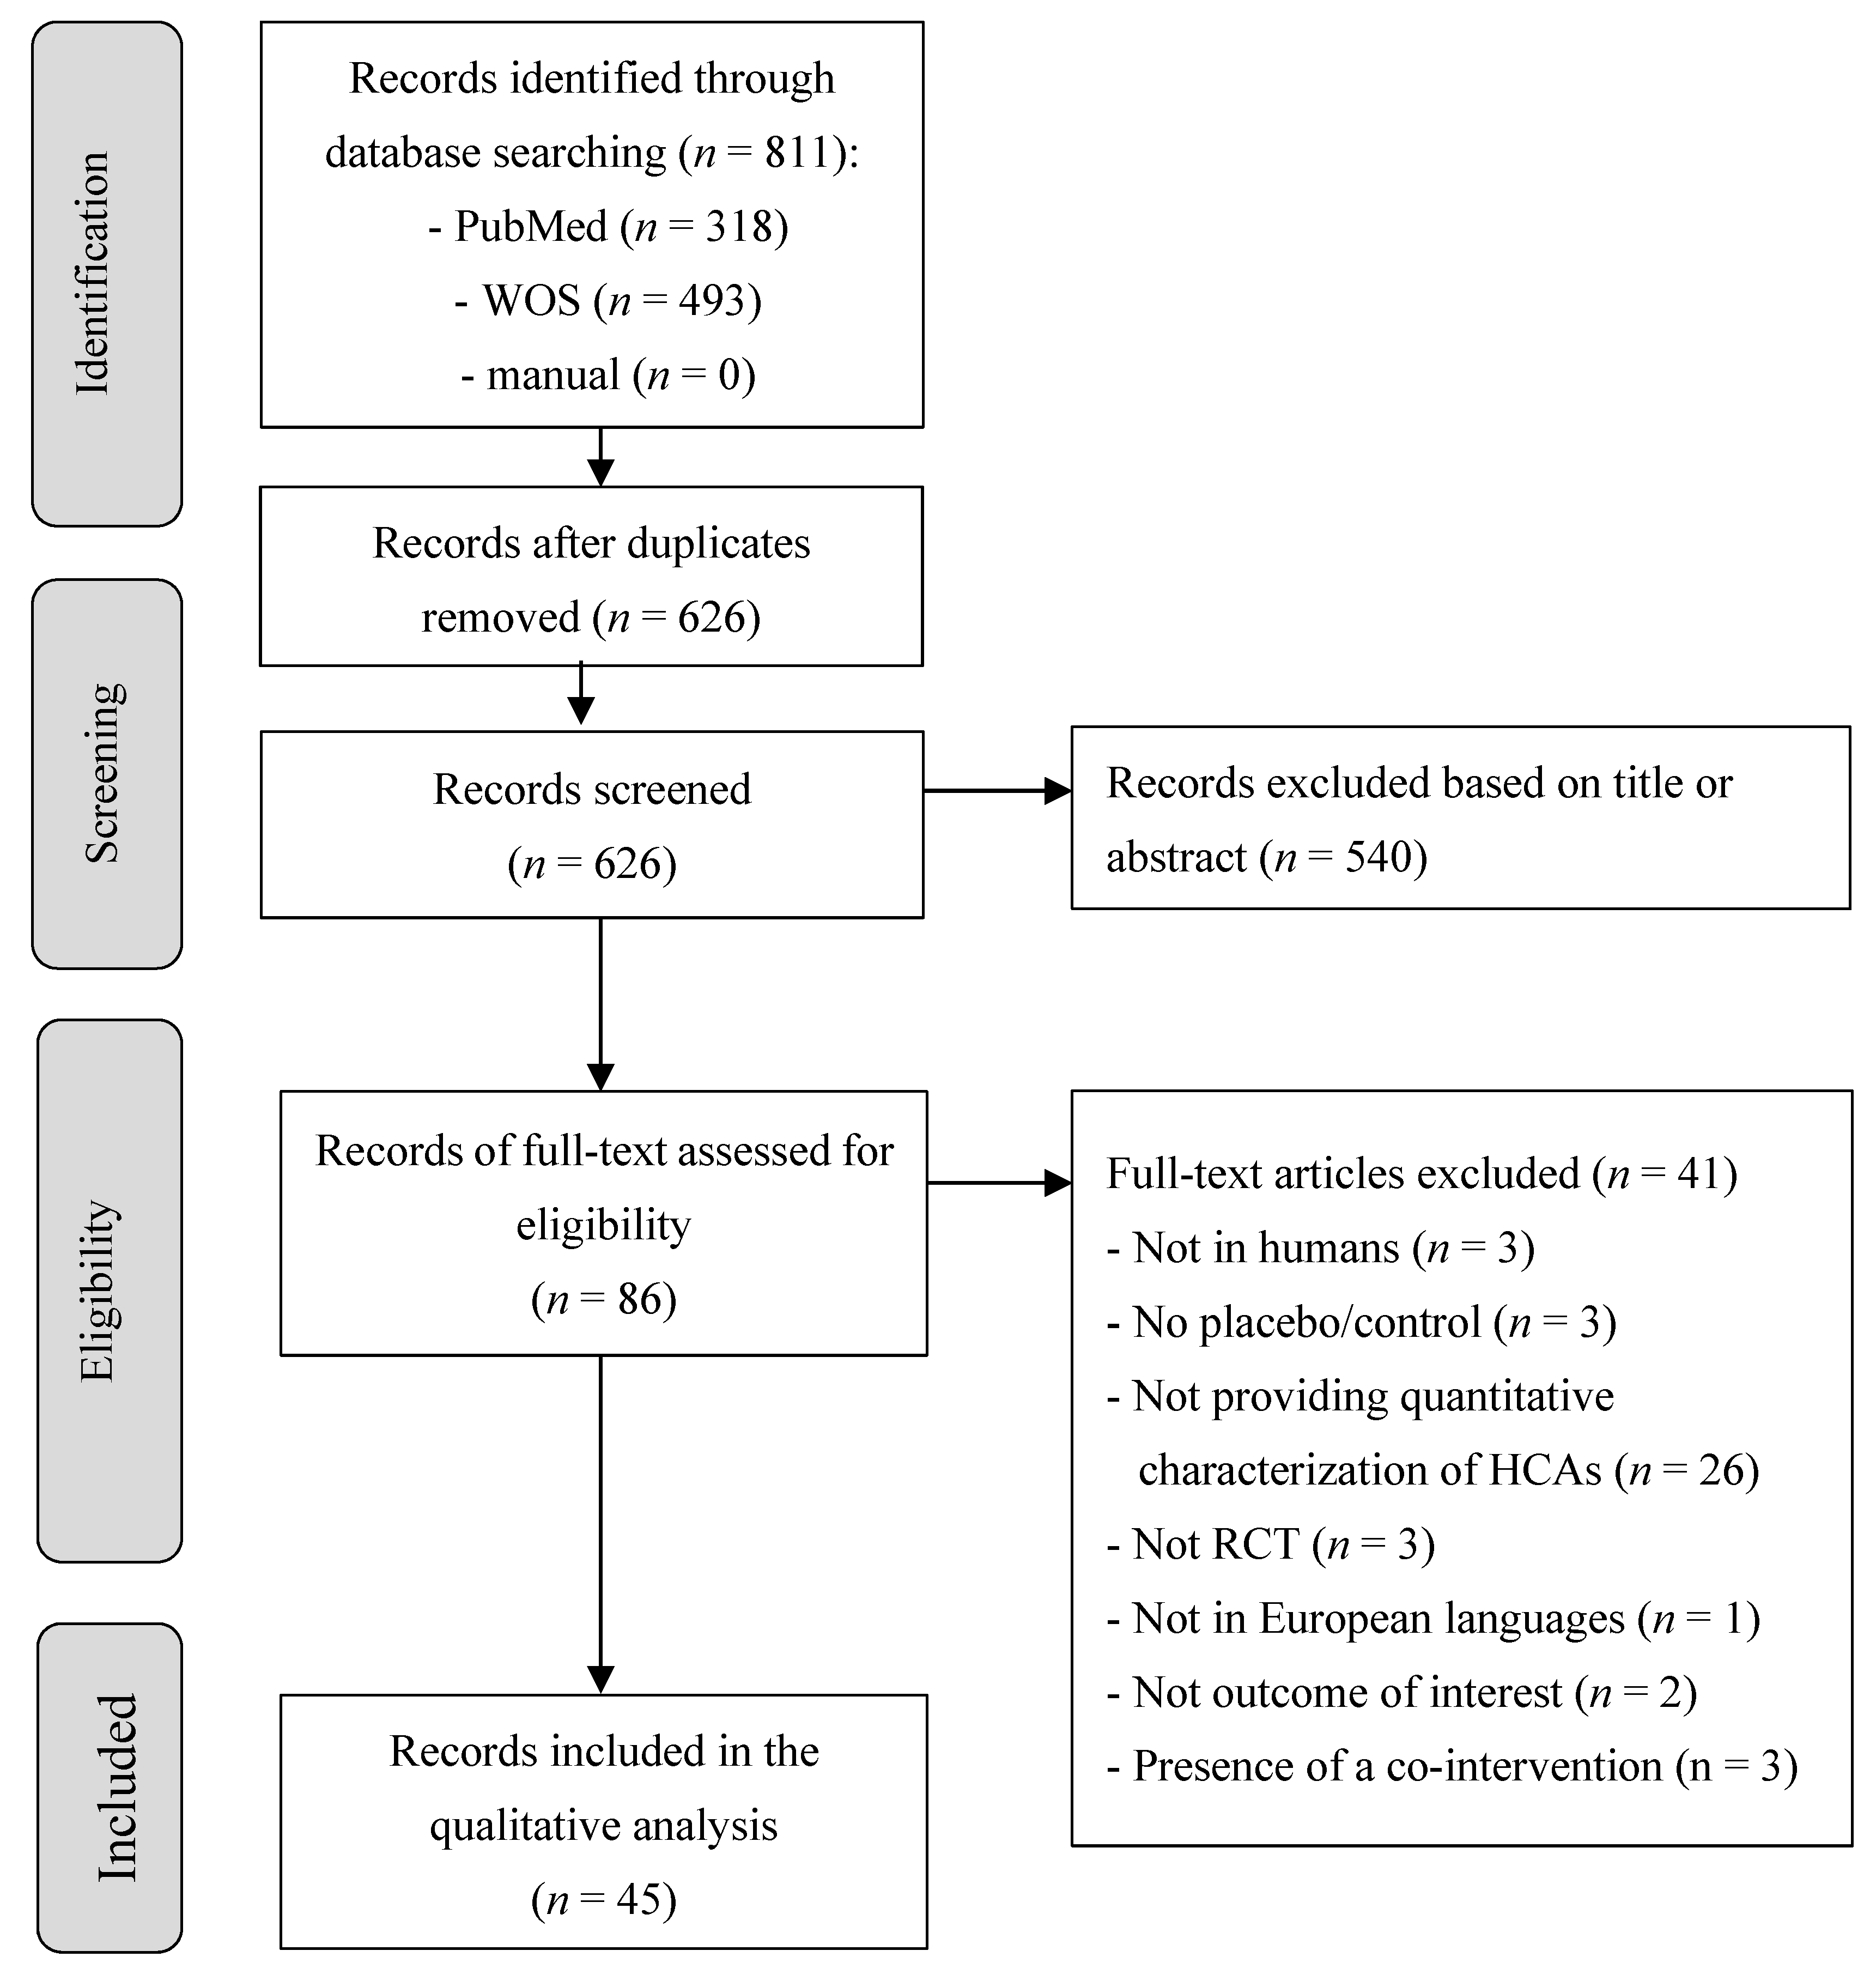
3.1. Study Selection
3.2. Characteristics and Risk of Bias of the Included Studies
3.3. Impact of Hydroxycinnamic Acids on Cardiometabolic Markers
3.3.1. Acute Studies
3.3.2. Chronic Studies
3.3.3. Inter-Individual Variability
4. Discussion
5. Conclusions
Supplementary Materials
Author Contributions
Funding
Acknowledgments
Conflicts of Interest
References
- Gakidou, E.; Afshin, A.; Abajobir, A.A.; Abate, K.H.; Abbafati, C.; Abbas, K.M.; Abd-Allah, F.; Abdulle, A.M.; Abera, S.F.; Aboyans, V.; et al. Global, regional, and national comparative risk assessment of 84 behavioural, environmental and occupational, and metabolic risks or clusters of risks, 1990–2016: A systematic analysis for the Global Burden of Disease Study 2016. Lancet 2017, 390, 1345–1422. [Google Scholar] [CrossRef]
- Piepoli, M.F.; Hoes, A.W.; Agewall, S.; Albus, C.; Brotons, C.; Catapano, A.L.; Cooney, M.-T.; Corrà, U.; Cosyns, B.; Deaton, C.; et al. 2016 European Guidelines on cardiovascular disease prevention in clinical practice. Atherosclerosis 2016, 252, 207–274. [Google Scholar] [CrossRef]
- Petersen, K.S.; Flock, M.R.; Richter, C.K.; Mukherjea, R.; Slavin, J.L.; Kris-Etherton, P.M. Healthy Dietary Patterns for Preventing Cardiometabolic Disease: The Role of Plant-Based Foods and Animal Products. Curr. Dev. Nutr. 2017, 1, 001289. [Google Scholar] [CrossRef] [PubMed]
- Angelino, D.; Godos, J.; Ghelfi, F.; Tieri, M.; Titta, L.; Lafranconi, A.; Marventano, S.; Alonzo, E.; Gambera, A.; Sciacca, S.; et al. Fruit and vegetable consumption and health outcomes: An umbrella review of observational studies. Int. J. Food Sci. Nutr. 2019. [Google Scholar] [CrossRef] [PubMed]
- Rodriguez-Mateos, A.; Vauzour, D.; Krueger, C.G.; Shanmuganayagam, D.; Reed, J.; Calani, L.; Mena, P.; Del Rio, D.; Crozier, A. Bioavailability, bioactivity and impact on health of dietary flavonoids and related compounds: An update. Arch. Toxicol. 2014, 88, 1803–1853. [Google Scholar] [CrossRef] [PubMed]
- Del Rio, D.; Rodriguez-Mateos, A.; Spencer, J.P.E.; Tognolini, M.; Borges, G.; Crozier, A. Dietary (poly)phenolics in human health: Structures, bioavailability, and evidence of protective effects against chronic diseases. Antioxid. Redox Signal. 2013, 18, 1818–1892. [Google Scholar] [CrossRef] [PubMed]
- Clifford, M.N.; Johnston, K.L.; Knight, S.; Kuhnert, N. Hierarchical scheme for LC-MSn identification of chlorogenic acids. J. Agric. Food Chem. 2003, 51, 2900–2911. [Google Scholar] [CrossRef] [PubMed]
- Bento-Silva, A.; Koistinen, V.M.; Mena, P.; Bronze, M.R.; Hanhineva, K.; Sahlstrøm, S.; Kitrytė, V.; Moco, S.; Aura, A.-M. Factors affecting intake, metabolism and health benefits of phenolic acids: Do we understand individual variability? Eur. J. Nutr. 2019. [Google Scholar] [CrossRef] [PubMed]
- Phenol Explorer. Available online: http://phenol-explorer.eu/ (accessed on 11 May 2019).
- Ziauddeen, N.; Rosi, A.; Del Rio, D.; Amoutzopoulos, B.; Nicholson, S.; Page, P.; Scazzina, F.; Brighenti, F.; Ray, S.; Mena, P. Dietary intake of (poly)phenols in children and adults: Cross-sectional analysis of UK National Diet and Nutrition Survey Rolling Programme (2008–2014). Eur. J. Nutr. 2018. [Google Scholar] [CrossRef] [PubMed]
- Stalmach, A.; Steiling, H.; Williamson, G.; Crozier, A. Bioavailability of chlorogenic acids following acute ingestion of coffee by humans with an ileostomy. Arch. Biochem. Biophys. 2010, 50, 98–105. [Google Scholar] [CrossRef] [PubMed]
- Scalbert, A.; Manach, C.; Morand, C.; Rémésy, C.; Jiménez, L. Dietary Polyphenols and the Prevention of Diseases. Crit. Rev. Food Sci. Nutr. 2005, 45, 287–306. [Google Scholar] [CrossRef] [PubMed]
- Tajik, N.; Tajik, M.; Mack, I.; Enck, P. The potential effects of chlorogenic acid, the main phenolic components in coffee, on health: A comprehensive review of the literature. Eur. J. Nutr. 2017, 56, 2215–2244. [Google Scholar] [CrossRef] [PubMed]
- Potì, F.; Santi, D.; Spaggiari, G.; Zimetti, F.; Zanotti, I. Polyphenol Health Effects on Cardiovascular and Neurodegenerative Disorders: A Review and Meta-Analysis. Int. J. Mol. Sci. 2019, 20, 351. [Google Scholar] [CrossRef]
- Mena, P.; Del Rio, D. Gold Standards for Realistic (Poly)phenol Research. J. Agric. Food Chem. 2018, 66, 8221–8223. [Google Scholar] [CrossRef] [PubMed]
- Manach, C.; Milenkovic, D.; Van de Wiele, T.; Rodriguez-Mateos, A.; de Roos, B.; Garcia-Conesa, M.T.; Landberg, R.; Gibney, E.R.; Heinonen, M.; Tomás-Barberán, F.; et al. Addressing the inter-individual variation in response to consumption of plant food bioactives: Towards a better understanding of their role in healthy aging and cardiometabolic risk reduction. Mol. Nutr. Food Res. 2017, 61, 1600557. [Google Scholar] [CrossRef] [PubMed]
- Milenkovic, D.; Morand, C.; Cassidy, A.; Konic-Ristic, A.; Tomás-Barberán, F.; Ordovas, J.M.; Kroon, P.; De Caterina, R.; Rodriguez-Mateos, A. Interindividual Variability in Biomarkers of Cardiometabolic Health after Consumption of Major Plant-Food Bioactive Compounds and the Determinants Involved. Adv. Nutr. 2017, 8, 558–570. [Google Scholar] [PubMed]
- Menezes, R.; Rodriguez-Mateos, A.; Kaltsatou, A.; González-Sarrías, A.; Greyling, A.; Giannaki, C.; Andres-Lacueva, C.; Milenkovic, D.; Gibney, E.; Dumont, J.; et al. Impact of Flavonols on Cardiometabolic Biomarkers: A Meta-Analysis of Randomized Controlled Human Trials to Explore the Role of Inter-Individual Variability. Nutrients 2017, 9, 117. [Google Scholar] [CrossRef] [PubMed]
- González-Sarrías, A.; Combet, E.; Pinto, P.; Mena, P.; Dall’Asta, M.; Garcia-Aloy, M.; Rodríguez-Mateos, A.; Gibney, E.R.; Dumont, J.; Massaro, M.; et al. A Systematic Review and Meta-Analysis of the Effects of Flavanol-Containing Tea, Cocoa and Apple Products on Body Composition and Blood Lipids: Exploring the Factors Responsible for Variability in Their Efficacy. Nutrients 2017, 9, 746. [Google Scholar] [CrossRef]
- Higgins, J.; Green, S. Cochrane Handbook for Systematic Reviews of Interventions; Version 5.1.0; Cochrane Collaboration, 2011. [Google Scholar]
- Centre for Reviews and Dissemination (CRD). Systematic Reviews: CRD’s Guidance for Undertaking Reviews in Health Careitle; CRD, University of York: York, UK, 2009. [Google Scholar]
- Liberati, A.; Altman, D.G.; Tetzlaff, J.; Mulrow, C.; Gøtzsche, P.C.; Ioannidis, J.P.A.; Clarke, M.; Devereaux, P.J.; Kleijnen, J.; Moher, D. The PRISMA statement for reporting systematic reviews and meta-analyses of studies that evaluate health care interventions: Explanation and elaboration. J. Clin. Epidemiol. 2009, 62, e1–e34. [Google Scholar] [CrossRef]
- International Prospective Register of Systematic Reviews (PROSPERO). Available online: http://www.crd.york.ac.uk/PROSPERO/display_record.php?ID=CRD42016050790 (accessed on 7 November 2016).
- García-Conesa, M.T.; Chambers, K.; Combet, E.; Pinto, P.; Garcia-Aloy, M.; Andrés-Lacueva, C.; De Pascual-Teresa, S.; Mena, P.; Ristic, A.K.; Hollands, W.J.; et al. Meta-analysis of the effects of foods and derived products containing ellagitannins and anthocyanins on cardiometabolic biomarkers: Analysis of factors influencing variability of the individual responses. Int. J. Mol. Sci. 2018, 19, 694. [Google Scholar] [CrossRef]
- Mills, C.E.; Flury, A.; Marmet, C.; Poquet, L.; Rimoldi, S.F.; Sartori, C.; Rexhaj, E.; Brenner, R.; Allemann, Y.; Zimmermann, D.; et al. Mediation of coffee-induced improvements in human vascular function by chlorogenic acids and its metabolites: Two randomized, controlled, crossover intervention trials. Clin. Nutr. 2017, 36, 1520–1529. [Google Scholar] [CrossRef]
- Sarriá, B.; Martínez-López, S.; Sierra-Cinos, J.L.; García-Diz, L.; Mateos, R.; Bravo-Clemente, L. Regularly consuming a green/roasted coffee blend reduces the risk of metabolic syndrome. Eur. J. Nutr. 2018, 57, 269–278. [Google Scholar] [CrossRef]
- Sarriá, B.; Martínez-López, S.; Mateos, R.; Bravo-Clemente, L. Long-term consumption of a green/roasted coffee blend positively affects glucose metabolism and insulin resistance in humans. Food Res. Int. 2016, 89, 1023–1028. [Google Scholar] [CrossRef]
- Martínez-López, S.; Sarriá, B.; Mateos, R.; Bravo-Clemente, L. Moderate consumption of a soluble green/roasted coffee rich in caffeoylquinic acids reduces cardiovascular risk markers: Results from a randomized, cross-over, controlled trial in healthy and hypercholesterolemic subjects. Eur. J. Nutr. 2019, 58, 865–878. [Google Scholar] [CrossRef]
- Rosén, L.A.H.; Östman, E.M.; Shewry, P.R.; Ward, J.L.; Andersson, A.A.M.; Piironen, V.; Lampi, A.-M.; Rakszegi, M.; Bedö, Z.; Björck, I.M.E. Postprandial Glycemia, Insulinemia, and Satiety Responses in Healthy Subjects after Whole Grain Rye Bread Made from Different Rye Varieties. 1. J. Agric. Food Chem. 2011, 59, 12139–12148. [Google Scholar] [CrossRef]
- Ochiai, R.; Sugiura, Y.; Otsuka, K.; Katsuragi, Y.; Hashiguchi, T. Coffee bean polyphenols ameliorate postprandial endothelial dysfunction in healthy male adults. Int. J. Food Sci. Nutr. 2015, 66, 350–354. [Google Scholar] [CrossRef]
- Ochiai, R.; Sugiura, Y.; Shioya, Y.; Otsuka, K.; Katsuragi, Y.; Hashiguchi, T. Coffee polyphenols improve peripheral endothelial function after glucose loading in healthy male adults. Nutr. Res. 2014, 34, 155–159. [Google Scholar] [CrossRef]
- Mubarak, A.; Bondonno, C.P.; Liu, A.H.; Considine, M.J.; Rich, L.; Mas, E.; Croft, K.D.; Hodgson, J.M. Acute effects of chlorogenic acid on nitric oxide status, endothelial function, and blood pressure in healthy volunteers: A randomized trial. J. Agric. Food Chem. 2012, 60, 9130–9136. [Google Scholar] [CrossRef]
- Ward, N.C.; Hodgson, J.M.; Woodman, R.J.; Zimmermann, D.; Poquet, L.; Leveques, A.; Actis-Goretta, L.; Puddey, I.B.; Croft, K.D. Acute effects of chlorogenic acids on endothelial function and blood pressure in healthy men and women. Food Funct. 2016, 7, 2197–2203. [Google Scholar] [CrossRef]
- Johnston, K.L.; Clifford, M.N.; Morgan, L.M. Coffee acutely modifies gastrointestinal hormone secretion and glucose tolerance in humans: Glycemic effects of chlorogenic acid and caffeine. Am. J. Clin. Nutr. 2003, 78, 728–733. [Google Scholar] [CrossRef]
- Iwai, K.; Narita, Y.; Fukunaga, T.; Nakagiri, O.; Kamiya, T.; Ikeguchi, M.; Kikuchi, Y. Study on the Postprandial Glucose Responses to a Chlorogenic Acid-Rich Extract of Decaffeinated Green Coffee Beans in Rats and Healthy Human Subjects. Food Sci. Technol. Res. 2013, 18, 849–860. [Google Scholar] [CrossRef]
- Thom, E. The effect of chlorogenic acid enriched coffee on glucose absorption in healthy volunteers and its effect on body mass when used long-term in overweight and obese people. Int. J. Med. Res. 2007, 35, 900–908. [Google Scholar] [CrossRef]
- Boon, E.A.J.; Croft, K.D.; Shinde, S.; Hodgson, J.M.; Ward, N.C. The acute effect of coffee on endothelial function and glucose metabolism following a glucose load in healthy human volunteers. Food Funct. 2017, 8, 3366–3373. [Google Scholar] [CrossRef]
- Van Dijk, A.E.; Olthof, M.R.; Meeuse, J.C.; Seebus, E.; Heine, R.J.; Van Dam, R.M. Acute effects of decaffeinated coffee and the major coffee components chlorogenic acid and trigonelline on glucose tolerance. Diabetes Care 2009, 32, 1023–1025. [Google Scholar] [CrossRef]
- Kajikawa, M.; Maruhashi, T.; Hidaka, T.; Nakano, Y.; Kurisu, S.; Matsumoto, T.; Iwamoto, Y.; Kishimoto, S.; Matsui, S.; Aibara, Y.; et al. Coffee with a high content of chlorogenic acids and low content of hydroxyhydroquinone improves postprandial endothelial dysfunction in patients with borderline and stage 1 hypertension. Eur. J. Nutr. 2019, 58, 989–996. [Google Scholar] [CrossRef]
- Lappi, J.; Aura, A.M.; Katina, K.; Nordlund, E.; Kolehmainen, M.; Mykkänen, H.; Poutanen, K. Comparison of postprandial phenolic acid excretions and glucose responses after ingestion of breads with bioprocessed or native rye bran. Food Funct. 2013, 4, 972–981. [Google Scholar] [CrossRef]
- Beam, J.R.; Gibson, A.L.; Kerksick, C.M.; Conn, C.A.; White, A.C.; Mermier, C.M. Effect of post-exercise caffeine and green coffee bean extract consumption on blood glucose and insulin concentrations. Nutrition 2015, 31, 292–297. [Google Scholar] [CrossRef]
- Rakvaag, E.; Dragsted, L.O. Acute effects of light and dark roasted coffee on glucose tolerance: A randomized, controlled crossover trial in healthy volunteers. Eur. J. Nutr. 2016, 55, 2221–2230. [Google Scholar] [CrossRef]
- Robertson, T.M.; Clifford, M.N.; Penson, S.; Chope, G.; Robertson, M.D. A single serving of caffeinated coffee impairs postprandial glucose metabolism in overweight men. Br. J. Nutr. 2015, 114, 1218–1225. [Google Scholar] [CrossRef]
- Moser, S.; Aragon, I.; Furrer, A.; Van Klinken, J.W.; Kaczmarczyk, M.; Lee, B.H.; George, J.; Hamaker, B.R.; Mattes, R.; Ferruzzi, M.G. Potato phenolics impact starch digestion and glucose transport in model systems but translation to phenolic rich potato chips results in only modest modification of glycemic response in humans. Nutr. Res. 2018, 52, 57–70. [Google Scholar] [CrossRef]
- Schubert, M.M.; Grant, G.; Horner, K.; King, N.; Leveritt, M.; Sabapathy, S.; Desbrow, B. Coffee for morning hunger pangs. An examination of coffee and caffeine on appetite, gastric emptying, and energy intake. Appetite 2014, 83, 317–326. [Google Scholar] [CrossRef]
- Jokura, H.; Watanabe, I.; Umeda, M.; Hase, T.; Shimotoyodome, A. Coffee polyphenol consumption improves postprandial hyperglycemia associated with impaired vascular endothelial function in healthy male adults. Nutr. Res. 2015, 35, 873–881. [Google Scholar] [CrossRef]
- Skinner, T.L.; Jenkins, D.G.; Folling, J.; Leveritt, M.D.; Coombes, J.S.; Taaffe, D.R. Influence of carbohydrate on serum caffeine concentrations following caffeine ingestion. J. Sci. Med. Sport 2013, 16, 343–347. [Google Scholar] [CrossRef]
- Angelino, D.; Cossu, M.; Marti, A.; Zanoletti, M.; Chiavaroli, L.; Brighenti, F.; Del Rio, D.; Martini, D. Bioaccessibility and bioavailability of phenolic compounds in bread: A review. Food Funct. 2017, 8, 2368–2393. [Google Scholar] [CrossRef]
- Ioakeimidis, N.; Tzifos, V.; Vlachopoulos, C.; Terentes-Printzios, D.; Georgakopoulos, C.; Tousoulis, D. Acute effect of coffee on aortic stiffness and wave reflections in healthy individuals: Differential effect according to habitual consumption. Int. J. Food Sci. Nutr. 2018, 69, 870–881. [Google Scholar] [CrossRef]
- Kozuma, K.; Tsuchiya, S.; Kohori, J.; Hase, T.; Tokomitsu, I. Antihypertensive Effect of Green Coffee Bean Extract on Mildly Hypertensive Subjects. Hypertens. Res. 2005, 28, 711–718. [Google Scholar] [CrossRef]
- Zuñiga, L.Y.; Aceves-de la Mora, M.C.A.; González-Ortiz, M.; Ramos-Núñez, J.L.; Martínez-Abundis, E. Effect of Chlorogenic Acid Administration on Glycemic Control, Insulin Secretion, and Insulin Sensitivity in Patients with Impaired Glucose Tolerance. J. Med. Food 2017, 21, 469–473. [Google Scholar] [CrossRef]
- Lecoultre, V.; Carrel, G.; Egli, L.; Binnert, C.; Boss, A.; MacMillan, E.L.; Kreis, R.; Boesch, C.; Darimont, C.; Tappy, L. Coffee consumption attenuates short-term fructose-induced liver insulin resistance in healthy men. Am. J. Clin. Nutr. 2014, 99, 268–275. [Google Scholar] [CrossRef]
- Yamaguchi, T.; Chikama, A.; Mori, K.; Watanabe, T.; Shioya, Y.; Katsuragi, Y.; Tokimitsu, I. Hydroxyhydroquinone-free coffee: A double-blind, randomized controlled dose-response study of blood pressure. Nutr. Metab. Cardiovasc. Dis. 2008, 18, 408–414. [Google Scholar] [CrossRef]
- Rondanelli, M.; Giacosa, A.; Opizzi, A.; Faliva, M.A.; Sala, P.; Perna, S.; Riva, A.; Morazzoni, P.; Bombardelli, E. Beneficial effects of artichoke leaf extract supplementation on increasing HDL-cholesterol in subjects with primary mild hypercholesterolaemia: A double-blind, randomized, placebo-controlled trial. Int. J. Food Sci. Nutr. 2013, 64, 7–15. [Google Scholar] [CrossRef]
- Ochiai, R.; Jokura, H.; Suzuki, A.; Tokimitsu, I.; Ohishi, M.; Komai, N.; Rakugi, H.; Ogihara, T. Green Coffee Bean Extract Improves Human Vasoreactivity. Hypertens. Res. 2004, 27, 731–737. [Google Scholar] [CrossRef]
- Riedel, A.; Dieminger, N.; Bakuradze, T.; Lang, R.; Montoya Parra, G.A.; Hochkogler, C.M.; Winkler, S.; Bytof, G.; Lantz, I.; Stiebitz, H.; et al. A 4-week consumption of medium roast and dark roast coffees affects parameters of energy status in healthy subjects. Food Res. Int. 2014, 63, 409–419. [Google Scholar] [CrossRef]
- Kempf, K.; Kolb, H.; Gärtner, B.; Bytof, G.; Stiebitz, H.; Lantz, I.; Lang, R.; Hofmann, T.; Martin, S. Cardiometabolic effects of two coffee blends differing in content for major constituents in overweight adults: A randomized controlled trial. Eur. J. Nutr. 2015, 54, 845–854. [Google Scholar] [CrossRef]
- Rezazadeh, K.; Rezazadeh, F.; Ebrahimi-Mameghani, M. The effect of artichoke leaf extract supplementation on lipid and CETP response in metabolic syndrome with respect to Taq 1B CETP polymorphism: A randomized placebo-controlled clinical trial. Eur. J. Integr. Med. 2018, 17, 112–118. [Google Scholar] [CrossRef]
- Bumrungpert, A.; Lilitchan, S.; Tuntipopipat, S.; Tirawanchai, N.; Komindr, S. Ferulic acid supplementation improves lipid profiles, oxidative stress, and inflammatory status in hyperlipidemic subjects: A randomized, double-blind, placebo-controlled clinical trial. Nutrients 2018, 10, 713. [Google Scholar] [CrossRef]
- Shahmohammadi, H.A.; Hosseini, S.A.; Hajiani, E.; Malehi, A.S.; Alipour, M. Effects of Green Coffee Bean Extract Supplementation on Patients with Non-Alcoholic Fatty Liver Disease: A Randomized Clinical Trial. Hepat. Mon. 2017, 17, e45609. [Google Scholar] [CrossRef]
- Haidari, F.; Samadi, M.; Mohammadshahi, M.; Jalali, M.T.; Engali, K.A. Energy restriction combined with green coffee bean extract affects serum adipocytokines and the body composition in obese women. Asia Pac. J. Clin. Nutr. 2017, 26, 1048–1054. [Google Scholar]
- Rondanelli, M.; Opizzi, A.; Faliva, M.; Sala, P.; Perna, S.; Riva, A.; Morazzoni, P.; Bombardelli, E.; Giacosa, A. Metabolic Management in Overweight Subjects with Naive Impaired Fasting Glycaemia by Means of a Highly Standardized Extract From Cynara scolymus: A Double-blind, Placebo-controlled, Randomized Clinical Trial. Phyther. Res. 2014, 28, 33–41. [Google Scholar] [CrossRef]
- Agudelo-Ochoa, G.M.; Pulgarín-Zapata, I.C.; Velásquez-Rodriguez, C.M.; Duque-Ramírez, M.; Naranjo-Cano, M.; Quintero-Ortiz, M.M.; Lara-Guzmán, O.J.; Muñoz-Durango, K. Coffee Consumption Increases the Antioxidant Capacity of Plasma and Has No Effect on the Lipid Profile or Vascular Function in Healthy Adults in a Randomized Controlled Trial. J. Nutr. 2016, 146, 524–531. [Google Scholar] [CrossRef]
- Ochiai, R.; Chikama, A.; Kataoka, K.; Tokimitsu, I.; Maekawa, Y.; Ohishi, M.; Rakugi, H.; Mikami, H. Effects of hydroxyhydroquinone-reduced coffee on vasoreactivity and blood pressure. Hypertens. Res. 2009, 32, 969–974. [Google Scholar] [CrossRef]
- Wedick, N.M.; Brennan, A.M.; Sun, Q.; Hu, F.B.; Mantzoros, C.S.; Van Dam, R.M. Effects of caffeinated and decaffeinated coffee on biological risk factors for type 2 diabetes: A randomized controlled trial. Nutr. J. 2011, 10, 93. [Google Scholar] [CrossRef] [PubMed]
- Watanabe, T.; Arai, Y.; Mitsui, Y.; Kusaura, T.; Okawa, W.; Kajihara, Y.; Saito, I. The blood pressure-lowering effect and safety of chlorogenic acid from green coffee bean extract in essential hypertension. Clin. Exp. Hypertens. 2006, 28, 439–449. [Google Scholar] [CrossRef] [PubMed]
- Roshan, H.; Nikpayam, O.; Sedaghat, M.; Sohrab, G. Effects of green coffee extract supplementation on anthropometric indices, glycaemic control, blood pressure, lipid profile, insulin resistance and appetite in patients with the metabolic syndrome: A randomised clinical trial. Br. J. Nutr. 2018, 119, 250–258. [Google Scholar] [CrossRef] [PubMed]
- Urgert, R.; Katan, M.B. The Cholesterol-Raising Factor from Coffee Beans. J. R. Soc. Med. 1996, 89, 618–623. [Google Scholar] [CrossRef] [PubMed]
- Soga, S.; Ota, N.; Shimotoyodome, A. Stimulation of Postprandial Fat Utilization in Healthy Humans by Daily Consumption of Chlorogenic Acids. Biosci. Biotechnol. Biochem. 2013, 77, 1633–1636. [Google Scholar] [CrossRef]
- Winkler, S.; Dieminger, N.; Blust, V.; Riedel, A.; Bakuradze, T.; Montoya, G.; Hassmann, U.; Lang, R.; Hofmann, T.; Somoza, V.; et al. Modulation of inflammatory gene transcription after long-term coffee consumption. Food Res. Int. 2014, 63, 428–438. [Google Scholar] [CrossRef]
- Vitaglione, P.; Mennella, I.; Ferracane, R.; Rivellese, A.A.; Giacco, R.; Ercolini, D.; Gibbons, S.M.; La Storia, A.; Gilbert, J.A.; Jonnalagadda, S.; et al. Whole-grain wheat consumption reduces inflammation in a randomized controlled trial on overweight and obese subjects with unhealthy dietary and lifestyle behaviors: Role of polyphenols bound to cereal dietary fiber. Am. J. Clin. Nutr. 2015, 101, 251–261. [Google Scholar] [CrossRef]
- Robertson, T.M.; Clifford, M.N.; Penson, S.; Williams, P.; Robertson, M.D. Postprandial glycaemic and lipaemic responses to chronic coffee consumption may be modulated by CYP1A2 polymorphisms. Br. J. Nutr. 2018, 119, 792–800. [Google Scholar] [CrossRef]
- Vinson, J.A.; Demkosky, C.A.; Navarre, D.A.; Smyda, M.A. High-Antioxidant Potatoes: Acute in Vivo Antioxidant Source and Hypotensive Agent in Humans after Supplementation to Hypertensive Subjects. J. Agric. Food Chem. 2012, 60, 6749–6754. [Google Scholar] [CrossRef]
- Egert, S.; Bosy-Westphal, A.; Seiberl, J.; Kürbitz, C.; Settler, U.; Plachta-Danielzik, S.; Wagner, A.E.; Frank, J.; Schrezenmeir, J.; Rimbach, G.; et al. Quercetin reduces systolic blood pressure and plasma oxidised low-density lipoprotein concentrations in overweight subjects with a high-cardiovascular disease risk phenotype: A double-blinded, placebo-controlled cross-over study. Br. J. Nutr. 2009, 102, 1065–1074. [Google Scholar] [CrossRef]
- Nagao, T.; Meguro, S.; Hase, T.; Otsuka, K.; Komikado, M.; Tokimitsu, I.; Yamamoto, T.; Yamamoto, K. A catechin-rich beverage improves obesity and blood glucose control in patients with type 2 diabetes. Obesity 2009, 17, 310–317. [Google Scholar] [CrossRef] [PubMed]
- Campesi, I.; Marino, M.; Cipolletti, M.; Romani, A.; Franconi, F. Put “gender glasses” on the effects of phenolic compounds on cardiovascular function and diseases. Eur. J. Nutr. 2018, 57, 2677–2691. [Google Scholar] [CrossRef] [PubMed]
- West, S.G.; McIntyre, M.D.; Piotrowski, M.J.; Poupin, N.; Miller, D.L.; Preston, A.G.; Wagner, P.; Groves, L.F.; Skulas-Ray, A.C. Effects of dark chocolate and cocoa consumption on endothelial function and arterial stiffness in overweight adults. Br. J. Nutr. 2014, 111, 653–661. [Google Scholar] [CrossRef] [PubMed]
- Ibero-Baraibar, I.; Abete, I.; Navas-Carretero, S.; Massis-Zaid, A.; Martinez, J.A.; Zulet, M.A. Oxidised LDL levels decreases after the consumption of ready-to-eat meals supplemented with cocoa extract within a hypocaloric diet. Nutr. Metab. Cardiovasc. Dis. 2014, 24, 416–422. [Google Scholar] [CrossRef] [PubMed]
- Miller, R.J.; Jackson, K.G.; Dadd, T.; Mayes, A.E.; Louise Brown, A.; Minihane, A.M. The impact of the catechol-O-methyltransferase genotype on the acute responsiveness of vascular reactivity to a green tea extract. Br. J. Nutr. 2011, 105, 1138–1144. [Google Scholar] [CrossRef] [PubMed]
- Rasmussen, B.B.; Brix, T.H.; Kyvik, K.O.; Brøsen, K. The interindividual differences in the 3-demthylation of caffeine alias CYP1A2 is determined by both genetic and environmental factors. Pharmacogenetics 2002, 12, 473–478. [Google Scholar] [CrossRef] [PubMed]
- Alkhaldy, A.; Edwards, C.A.; Combet, E. The urinary phenolic acid profile varies between younger and older adults after a polyphenol-rich meal despite limited differences in in vitro colonic catabolism. Eur. J. Nutr. 2019, 58, 1095–1111. [Google Scholar] [CrossRef] [PubMed]
- Velderrain-Rodríguez, G.R.; Palafox-Carlos, H.; Wall-Medrano, A.; Ayala-Zavala, J.F.; Chen, C.Y.O.; Robles-Sánchez, M.; Astiazaran-García, H.; Alvarez-Parrilla, E.; González-Aguilar, G.A. Phenolic compounds: Their journey after intake. Food Funct. 2014, 5, 189–197. [Google Scholar] [CrossRef]
- Williamson, G.; Clifford, M.N. Role of the small intestine, colon and microbiota in determining the metabolic fate of polyphenols. Biochem. Pharmacol. 2017, 139, 24–39. [Google Scholar] [CrossRef] [PubMed]
- Van Duynhoven, J.; Vaughan, E.E.; Jacobs, D.M.; Kemperman, R.A.; van Velzen, E.J.J.; Gross, G.; Roger, L.C.; Possemiers, S.; Smilde, A.K.; Dore, J.; et al. Metabolic fate of polyphenols in the human superorganism. Proc. Natl. Acad. Sci. USA 2011, 108, 4531–4538. [Google Scholar] [CrossRef]
- Stalmach, A.; Mullen, W.; Barron, D.; Uchida, K.; Yokota, T.; Cavin, C.; Steiling, H.; Williamson, G.; Crozier, A. Metabolite Profiling of Hydroxycinnamate Derivatives in Plasma and Urine after the Ingestion of Coffee by Humans: Identification of Biomarkers of Coffee Consumption. Drug Metab. Dispos. 2009, 37, 1749–1758. [Google Scholar] [CrossRef] [PubMed]
- Del Rio, D.; Stalmach, A.; Calani, L.; Crozier, A. Bioavailability of Coffee Chlorogenic Acids and Green Tea Flavan-3-ols. Nutrients 2010, 2, 820–833. [Google Scholar] [CrossRef] [PubMed]
- Calani, L.; Dall’Asta, M.; Derlindati, E.; Scazzina, F.; Bruni, R.; Del Rio, D. Colonic Metabolism of Polyphenols From Coffee, Green Tea, and Hazelnut Skins. J. Clin. Gastroenterol. 2012, 46, S95–S99. [Google Scholar] [CrossRef] [PubMed]
- Zhang, L.; Wang, Y.; Li, D.; Ho, C.T.; Li, J.; Wan, X. The absorption, distribution, metabolism and excretion of procyanidins. Food Funct. 2016, 7, 1273–1281. [Google Scholar] [CrossRef] [PubMed]
- González-Barrio, R.; Edwards, C.A.; Crozier, A. Colonic catabolism of ellagitannins, ellagic acid, and raspberry anthocyanins: In vivo and in vitro studies. Drug Metab. Dispos. 2011, 39, 1680–1688. [Google Scholar] [CrossRef]
- Ludwig, I.A.; Mena, P.; Calani, L.; Cid, C.; Del Rio, D.; Lean, M.E.J.; Crozier, A. Variations in caffeine and chlorogenic acid contents of coffees: What are we drinking? Food Funct. 2014, 5, 1718–1726. [Google Scholar] [CrossRef] [PubMed]
- Angelino, D.; Tassotti, M.; Brighenti, F.; Del Rio, D.; Mena, P. Niacin, alkaloids and (poly)phenolic compounds in the most widespread Italian capsule-brewed coffees. Sci. Rep. 2018, 8, 11. [Google Scholar] [CrossRef]
- Morand, C.; Tomás-Barberán, F.A. Interindividual Variability in Absorption, Distribution, Metabolism, and Excretion of Food Phytochemicals Should Be Reported. J. Agric. Food Chem. 2019, 67, 3843–3844. [Google Scholar] [CrossRef]


| Reference | Study Participants | Study Design | Intervention | Dose of HCAs | Control/Placebo | Main Findings |
|---|---|---|---|---|---|---|
| Beam et al. 2015 [41] | n = 10 male cyclists; age 26 ± 5 y; BMI 24 ± 4.3 kg/m2 | CO | 75 g of dextrose with 10 mg/kg bw of GC bean extract post-exercise | 5 mg/kg bw CGA (325–450 mg CGA) | 75 g of dextrose with 5 mg/kg bw caffeine | = blood glucose and insulin 2 h AUC, Matsuda Index |
| Boon et al. 2017 [37] | n = 12 (7M/5F); age 59.4 ± 6.4 y; BMI 24.7 ± 3.3 kg/m2 | CO | (1) 18 g of DC in 200 mL of hot water taken after a 12-h fast; then again 2h later plus 75 g glucose drink (2) Note: Another treatment included 18 g of ground caffeinated coffee in 200 mL of hot water, taken after a 12-h fast; then again 2 h later plus 75 g glucose drink | (1) 287 mg CGAs (DC) (2) 300 mg CGA (caffeinated coffee) | 200 mL of hot water, taken after a 12-h fast; then again 2 h later plus 75 g glucose drink | = 1 h FMD, 2 h glucose (at any time point) and 1 h or 2 h BP (based on a single reading) ↑FMD after caffeinated coffee vs. DC or control |
| Ioakeimidis et al. 2018 [49] | n = 24 (16M/8F); age 32.7 ± 9.3 y; BMI 26.4 ± 2.5 kg/m2 (habitual consumers) and 26.4 ± 2.5 kg/m2 (non-habitual consumers) | CO | (1) triple coffee espresso (75 mL) (2) triple DC espresso (75 mL) | 81 mg of 3-CQA and 156 mg of 5-CQA | (1) 240 mg caffeine tablet (2) placebo (hot water, 75 mL) | ↑peripheral SBP, DBP after DC, caffeinated coffee and caffeine tablet compared to placebo after 2.5 h |
| Iwai et al. 2013 [35] | n = 41 (22M/19F); age 34.8 ± 8.0 y; BMI 22.0 ± 3.1 kg/m2 | CO | 2 pieces of Onigiri (200 g carbohydrate) together with: (1) 100 mg or (2) 300 mg decaffeinated green coffee beans extract in 200 mL water | 39 and 118 g/day (39.2 g CGA/100 g) | 2 pieces of Onigiri (200 g carbohydrate) together with 200 mL water | ↓glucose after 300 mg decaffeinated green coffee beans extract compared to control at 30 min = insulin and glucose 2 h AUC |
| Johnston et al. 2003 [34] | n = 9 (4M/5F); age 26 ± 3.2 y; BMI ≤ 25 kg/m2 | CO | 25 g glucose in 400 mL of (1) caffeinated or (2) decaffeinated coffee | 2.5 mmol CGA/L | 25 g glucose in 400 mL water | = glucose, insulin at any time point ↑0–30 min IAUC insulin caffeinated coffee vs. DC and control |
| Jokura et al. 2015 [46] | n = 19 M; age 38.1 ± 8.4 y; BMI 21.8 ± 2.2 kg/m2 | CO | Meal (75 g carb, 28.5 g fat, 8 g protein) with coffee polyphenol extract | 355 mg CQAs in 185 mL | Meal (75 g carb, 28.5 g fat, 8 g protein) without coffee polyphenol extract; matched caffeine (54.9 mg) | ↓peak postprandial blood glucose at 30 min vs. control ↑ postprandial FMD at 60 min, 120 min, 180 min over 4 h vs. control = postprandial insulin |
| Kajikawa et al. 2019 [39] | n = 18 patients with borderline or stage 1 hypertension (12M/6F); age 56 ± 15 y; BMI 23.2 ± 3.1 kg/m2 | CO | Single intake of roasted coffee (beverage A) | 412 mg CGAs (beverage A) | Single intake of beverage C (no CGAs) | = TG, glucose, insulin, FMD, SBP vs. control ↑TG, glucose, insulin at 1 h and 2 h within beverage A and within control ↑FMD at 1 h and 2 h within beverage A |
| Lappi et al. 2013 [40] | n = 15 (6M/9F); age 57 y; BMI 26 kg/m2; healthy but self-reported mild, moderate or severe gastrointestinal symptoms post-ingestion of cereals, particularly rye | CO | Meal including white wheat breads fortified with bioprocessed rye bran (WW + BRB) or with native rye bran (WW + RB) providing 50 g of available starch (meal also included 40 g cucumber, 20 g margarine, 14/15 participants also consumed black coffee or tea) | - WW + BRB: 134.6 mg total FA, 31.3 mg total sinapic acid and 4.7 mg coumaric acid - WW + RB: 117.0 mg total FA, 28.8 mg total sinapic acid and 5.0 mg total coumaric acid | Control meals including wholegrain rye (R) bread (74.0 mg FA + 17.1 mg SA + 2.9 mg CA) or white wheat (WW) bread (6.6 mg FA + 1.7 mg SA + 0.2 mg CA) providing 50 g of available starch (meal also included 40 g cucumber, 20 g margarine, 14/15 participants also consumed black coffee or tea) | = glucose ↓insulin incremental AUC for R bread (control) compared to others |
| Mills et al. 2017 [25]—Study 1 | n = 15 M; age 26.3 ± 1.6 y; BMI 23.5 ± 0.5 kg/m2 | CO | LPC and HPC coffees | 89 mg (LPC) and 310 mg (HPC) CGA | Caffeine control: 110 mg caffeine and 0 mg CGA in hot water | ↑FMD at 1 h and 5h for 450 mg and 900 mg CGA vs. control = SBP, DBP |
| Mills et al. 2017 [43]—Study 2 | n = 24 M; age 23.8 ± 1.4 y; BMI 23.2 ± 1.4 kg/m2 | CO | 450 mg purified 5-CQA + 1 g maltodextrin; 900 mg purified 5-CQA + 1 g maltodextrin | 450 mg and 900 mg CGA | 1 g maltodextrin (negative control) and 200 mg (−)-epicatechin + 1 g maltodextrin (positive control) | = FMD ↑FMD at 1 h within 450 mg CGA = SBP, DBP |
| Moser et al. 2018 [44] | n = 12 (6M/6F); range age 19–33 y; BMI 23.2 ± 0.7 kg/m2 | CO | Potato chip product made from (1) white, (2) purple or (3) red potatoes providing 50 g of available carbohydrates (~93 g potato chips) | Total CGAs ranging from 13.4 ± 0.8 to 362.1 ± 9.2 mg/100 g dw | Plain salted wheat crackers providing 50 g of available carbohydrates | ↓mean 2 h glucose IAUC and glucose at 20, 40 and 60 min time points to each potato chip vs. control |
| Mubarak et al. 2012 [32] | n = 23 (4M/19F); age 52.3 ± 10.6 y; BMI 25.6 ± 4.7 kg/m2 | CO | 400 mg CGAs in 200 mL of low nitrate water | 400 mg CGAs (3-CQA) | Water | ↓SBP, DBP (mean of 60, 90, 120 and 150 min) = FMD at 120 min |
| Ochiai et al. 2014 [31] | n = 14 M; age 36.2 ± 7.8 y; BMI 22.7 ± 1.8 kg/m2 | CO | 225 mL of a 75 g glucose-equivalent test solution with coffee polyphenols | 600 mg CQAs | 225 mL of a 75 g glucose-equivalent test solution | = glucose, insulin, SBP |
| Ochiai et al. 2015 [30] | n = 13 M; age 44.9 ± 1.4 y; BMI 21.9 ± 0.6 kg/m2 | CO | Coffee bean polyphenols beverage in 100 mL of water followed by a test meal (14 g of protein, 30 g of fat and 58 g of carbohydrates) | 600 mg CGAs | Placebo beverage with same taste followed by a test meal (14 g of protein, 30 g of fat and 58 g of carbohydrates) | ↓DBP at 1 h vs. placebo ↑FMD at 6 h vs. placebo = glucose, insulin, TG, TC |
| Rakvaag et al. 2016 [42] | n = 11 (4M/7F); age 26.2 ± 0.6 y; BMI 23.2 ± 0.4 kg/m2 | CO | 300 mL of either light (LIR) or dark (DAR) roasted coffee 30 min before 75 g OGTT | - LIR: 399.6 ± 12.5 mg CQA/serving - DAR: 66.6 ± 1.2 CQA mg/serving | 300 mL of tap water 30 min before 75 g OGTT | ↑insulin 2 h IAUC DAR vs. control = glucose ↑glucose 60 min time point DAR vs. control ↓ISI (Matsuda) DAR and LIR vs. control |
| Robertson et al. 2015 [43] | n = 10 overweight M; age 30.4 ± 14.2 y; BMI 27.8 ± 2.2 kg/m2 | CO | (i) 2, 4 or 8 g instant DC in 400 mL water with caffeine added in proportion (total 100, 200 or 400 mg caffeine) all with 50 g glucose (ii) 2, 4 and 8 g DC with a standard 100 mg caffeine added to each | 47, 94 and 188 mg CQAs/drink | (i) 400 mL water with 50 g glucose (ii) 400 mL water with a standard 100 mg caffeine | (i) ↑2 h IAUC glucose for 2 and 4 g DC vs. control (i) = 2 h IAUC insulin, ISI (Matsuda) (ii) = 2 h IAUC glucose, 2 h IAUC insulin, ISI (Matsuda) |
| Rosen et al. 2011 [29] | n = 14 (7M/7F); age 23.6 ± 0.5 y; BMI 22.0 ± 0.5 kg/m2 | CO | A portion of one of five whole grain rye test breads (differing in rye varieties) providing 50 g of available starch | FA ranging from 2.2 to 2.6 mg/serving; sinapic acid ranging from 724 to 993 µg/serving | 122.7 g of WW bread providing 50 g of available starch | ↓3 h IAUC insulin for two rye test breads (Amilo and Rekrut) vs. WW = 3 h IAUC glucose |
| Schubert et al. 2014 [45] | n = 12 (3M/9F); age 26.3 ± 6.3 y; BMI 22.7 ± 2.2 kg/m2 (n = 10 in glucose analysis) | CO | A standardized breakfast (pancakes, butter, and jam: 48 g carbohydrate, 17 g fat, 15 g protein) at 0 min plus: (i) 225 mL of DC + placebo capsules at 0 and 120 min (ii) 225 mL DC + caffeine capsules at 0 and 120 min | 248.9 ± 11.3 mg CGAs per serving | A standardized breakfast (pancakes, butter and jam: 48 g carbohydrate, 17 g fat and 15 g protein) at 0 min plus: (i) Placebo (250 mg Metamucil) capsules and 225 mL water at 0 and 120 min (ii) Caffeine capsules and 225 mL water at 0 and 120 min | = 4.5 h IAUC glucose |
| Thom 2007 [36] | n = 12 (6M/6F); age 24.2 ± 3.2 y; BMI < 25.0 kg/m2 | CO | (i) 25 g of sucrose and 10 g of coffee made with GCE (ii) 25 g of sucrose and 10 g of normal instant coffee; (iii) 25 g of sucrose and 10 g of DC all in 400 mL water | (i) ~432 mg CGA (ii + iii) ~220 mg CGA | 25 g of sucrose in 400 mL of water | ↓2 h IAUC glucose AUC for GCE vs. control only |
| Van Dijk et al. 2009 [38] | n = 15 overweight M; age 39.9 ± 16.5 y; BMI 27.6 ± 2.2 kg/m2 | CO | Either (i) 12 g DC (ii) 1 g CGA 30 min before a 75 g oral glucose | (i) 264 mg CGA (ii) 1 g CGA | 1 g mannitol 30 min before a 75 g oral glucose | = 2 h IAUC glucose and insulin ↓glucose and insulin at 15 min CGA vs. control |
| Ward et al. 2016 [33] | n = 16 (6M/10F); age 58.9 ± 8.2 y; BMI 24.7 ± 3.3 kg/m2 | CO | 200 mL warm water with either 450 mg and 900 mg purified 5-CGA 2 h after a standardized breakfast (2 pieces of white bread with cheese, tub of plain yoghurt and water) | 450 and 900 mg CGA | 200 mL warm water with either 0 mg purified 5-CGA (control group) or 200 mg purified (−)-epicatechin (positive control) 2 h after a standardized breakfast (2 pieces of white bread with cheese, tub of plain yoghurt and water) | ↑continuous FMD vs. control = BP, peak FMD |
| Reference | Subjects | Study Design | Intervention | Dose of HCAs | Control/Placebo | Main Findings |
|---|---|---|---|---|---|---|
| Agudelo-Ochoa et al. 2016 [63] | n = 75 (38M/37F); age 38.5 ± 9 y; BMI 24.1 ± 2.6 kg/m2; overall healthy | P | 400 mL coffee/d containing a medium (MCCGA) or high (HCCGA) CGA content for 8 weeks | MCCGA = 420 mg/400 mL; HCCGA = 780 mg/400 mL (each with ~193 mg/d caffeine) | No consumption of coffee or placebo | =TC, LDL, HDL, TG, FMD, BP |
| Bumrungpert et al. 2018 [59] | n = 48 with hyperlipidemia (6M/42 F); age 48.7 ± 7.6 y (FA) and 45.9 ± 7.8 y (placebo); BMI 25.9 ± 5.3 kg/m2 (FA) and 26.6 ± 6.2 kg/m2 (placebo) | P | 2 capsules of FA/day for 6 weeks | 1000 mg FA/day | 2 placebo capsules/day for 6 weeks | ↓TC, LDL, and TG ↑HDL = SBP, DBP, glucose, BMI, WC compared to control |
| Haidari et al. 2017 [61] | 64 obese F; age 36.1 (GCE) and 35.7 y (placebo); BMI 26.4 ± 2.5 kg/m2 (GCE) and 26.4 ± 2.5 kg/m2 (placebo) | P | One capsule of 400 mg GCE/day for 8 weeks | 180 mg CGA/capsule | One placebo capsule of 400 mg starch/day for 8 weeks | ↓BMI, TC, LDL = HDL, TG, glucose, insulin in the GCE group + compared to control |
| Kempf et al. 2015 [57] | n = 116 overweight (39M/77F); age 50.6 ± 11.8 y (M-coffee) and 48.0 ± 12.7 y (D-coffee); BMI 32.4 ± 4.4 kg/m2 (M-coffee) and 33.9 ± 4.6 kg/m2 (D-coffee) | CO | 4–5 servings/day of 7.5 g MRC in 125 mL water for 3 months | 19.31 ± 0.28 mg/L CGA | 7.5 mg/L dark roast coffee (10.01 ± 0.28 mg/L CGA; 1.20 ± 0.03 mg/L N-methylpyridinium; caffeine-matched) in 125 mL water for 3 months | ↓SBP in control vs. M-coffee ↑TG within control ↑HDL within M-coffee = BMI, DBP, glucose, insulin, HOMA-IR, TC, LDL, HbA1c between M-coffee and control |
| Kozuma et al. 2005 [50] | n = 117 M with mild hypertension -Group 46 mg (n = 29): age 42.9 ± 8.2 y; BMI 25.2 ± 4.0 kg/m2 -Group 93 mg (n = 28): age 43.3 ± 8.3 y; BMI 24.4 ± 2.6 kg/m2 -Group 185 mg (n = 31): age 43.4 ± 8.4 y; BMI 25.1 ± 3.6 kg/m2 -Placebo (n = 29): age 43.1 ± 9.1 y; BMI 24.0 ± 3.1 kg/m2 | P | Soy sauce-flavored instant cup soup containing 46 mg, 93 mg, or 185 mg of GCE, once a day for 28 days | 25 mg, 50 mg, and 100 mg CGAs, respectively | Soy sauce-flavored instant cup soup without GCE, once a day for 28 days | ↓SBP and DBP in all group compared to baseline, significant for 93 and 185 g groups compared to placebo ↓TC, LDL within 185 mg group = BMI, TG, HDL |
| Lecoultre et al. 2014 [52] | n = 10 M; age 23 ± 2 y; BMI 22.6 ± 0.6 kg/m2; healthy | CO | 4 cups of (i) caffeinated coffee high in CGA (C-HCA), (ii) DC high in CGA (D-HCA), or (iii) DC regular in CGA (D-RCA) daily for 14 days, with 4 g fructose/kg day the last 6 days | -C-HCA: 9% CGAs -D-HCA: 9% CGAs -D-RCA: 3% CGAs | No coffee + 4 g fructose/kg d (high fructose only) in the last 6 days | = TG, glucose, insulin ↑TG after control |
| Martínez-López et al. 2018 [28] * | n = 52: n = 25 NC (10M/15F) and n = 27 HC (10M/17F); age 26.6 ± 7.7 y (NC-F), 24.7 ± 5.8 y (NC-M), 33.3 ± 10.2 y (HC-F), 34.8 ± 9.2 y (HC-M); BMI 21.9 ± 2.5 kg/m2 (NC-F), 24.2 ± 2.8 kg/m2 (NC-M), 21.4 ± 2.5 kg/m2 (HC-F), 24.9 ± 2.3 kg/m2 (HC-M) | CO | 6 g/day of soluble green/roasted (35:65) coffee for 8 weeks | 510.6 mg/day HCAs (~344 mg/d CGA) + ~120 mg caffeine | Control beverage (water or an isotonic drink) for 8 weeks | ↓TC, LDL, TG =HDL ↓TC, LDL, TG in HC only = TC, LDL, TG in NC only |
| Ochiai et al. 2004 [55] | n = 20 M; age 37.2 ± 1.6 y (test) and 34.8 ± 2.3y (placebo); BMI 24.7 ± 1.6 kg/m2 (test) and 23.8 ± 0.6 kg/m2 (placebo); healthy | P | 1 bottle of 125 mL test drink containing GCE for 4 months | 140 mg CGA/serving (28%) | 125 mL GCE-free drink | = SBP, DBP, TC, LDL, HDL, TG, glucose, insulin |
| Ochiai et al. 2009 [64] | n = 21 with mild hypertension and vascular failure; range age 30–64 y; BMI 24.2 ± 0.9 kg/m2 (active group) and 24.2 ± 1.1 kg/m2 (placebo group) | P | 1 can (184 mL) of active beverage (canned coffee) for 8 weeks | Active beverage: 300 mg CGA/serving (reduced in HHQ) | 1 can (184 mL) of placebo beverage for 8 weeks (reduced in HHQ and CGA; caffeine-matched) | ↓SBP = DBP, BMI, glucose, HbA1c, TG, LDL, HDL = DBP, glucose, BMI, FMD, TC, LDL, HDL, TG |
| Rezazadeh et al. 2018 [58] | 68 patients with MetS (19M/49F); age 38.9 ± 6.9 y; BMI 34.3 ± 4.3 kg/m2 | P | 1800 mg/day ALE as four tablets for 12 weeks | 4%–5% CGAs | 4 placebo tablets/day | ↓TG, TC, LDL within ALE =HDL ↓TG in ALE vs. control |
| Riedel et al. 2014 [56] | n = 84 (46M/38F); age 25.6 ± 5.8 y; BMI 22.9 ± 1.9 kg/m2; healthy | CO | 750 mL (6 coffee pads at 7.5 g) of MRC per day for 4 weeks | 19.2 ± 0.3 mg/g CGA | 750 mL of DRC (10.0 ± 0.3 mg/L CGA; 1.20 ± 0.0 mg/L N-methylpyridinium; caffeine-matched) per day for 4 weeks | ↑TC within MRC only ↑insulin, HOMA-IR within MRC and vs. DRC (control)↑HDL within MRC and DRC, but greater in DRC (control) =LDL, TG and glucose |
| Robertson et al. 2018 [72] | n = 27: n = 19 (10M/9F) in the coffee group; range age 18–42; BMI 23.4 ± 3.0 kg/m2; n = 8 (4M/4F) in the control group; range age 19–41; BMI 22.9 ± 3.1 kg/m2; overall healthy | P | Four cups/day instant coffee for 12 weeks | 43.6 mg CGAs/cup | No coffee/caffeine for 12 weeks | = fasting glucose, insulin, TG, BMI |
| Rondanelli et al. 2013 [54] | n = 92 with mild hypercholesterolemia (41M/51F); age 54.2 ± 6.6 y (intervention) and 53.8 ± 9.0 y (placebo); BMI 25.8 ± 3.9 kg/m2 (intervention) and 24.8 ± 1.6 kg/m2 (placebo) | P | Tablets of 250 mg ALE twice a day for 8 weeks | >20% CQAs | Placebo tablets of 250 mg twice a day for 8 weeks | ↑HDL within and between groups ↓LDL and TC within and between groups = TG, glucose |
| Rondanelli et al. 2014 [62] | n = 55 overweight with IFG (25M/30F) age 54.1 ± 9.8 y; BMI 30.7 ± 3.8 kg/m2 | P | 600 mg/day extract of Cs (30%–60% CQAs) tablets for 8 weeks | CQAs between 30% and 60% | Placebo tablets for 8 weeks | ↓BMI, glucose, HOMA, TC, and LDL within Cs and vs. control ↓HbA1c within Cs only = insulin, HDL, TG, WC |
| Roshan et al. 2018 [67] | n = 43 with MetS (10M/33F); age 52.8 ± 9.8 y (CGE) and 52.0 ± 8.7 y (placebo); BMI 31.6 ± 3.6 kg/m2 (CGE) and 31.2 ± 4.9 kg/m2 (placebo) | P | Two decaffeinated CGE capsules of 400 mg/day for 8 weeks | 372 mg CGA/day (186 mg/capsule) | Two placebo capsules (starch)/day for 8 weeks | ↓SBP, fasting glucose, HOMA-IR, and WC compared to placebo = DBP, insulin, HbA1c, BMI, TC, LDL, HDL, TG |
| Sarriá et al. 2016 [27] * | n = 52 (20M/32F); age 29.8 ± 8.9 y (M) and 29.4 ± 9.5 y (F); BMI 24.8 ± 2.7 kg/m2 (M) and 21.7±2.5 kg/m2 (F) | CO | 6 g/day of soluble green/roasted (35:65) coffee for 8 weeks | 510.6 mg/day HCAs (~344 mg/day CGA) + ~120 mg caffeine | Water or an isotonic drink | ↓glucose and HOMA-IR ↑QUICKI |
| Sarriá et al. 2018 [26] * | n = 52: n = 25 NC (10M/15F) and n = 27 HC (10M/17F); age 26.6 ± 7.7 y (NC-F), 24.7 ± 5.8 y (NC-M), 33.3 ± 10.2 y (HC-F), 34.8 ± 9.2 y (HC-M); BMI 21.9 ± 2.5 kg/m2 (NC-F), 24.2 ± 2.8 kg/m2 (NC-M), 21.4 ± 2.5 kg/m2 (HC-F), 24.9 ± 2.3 kg/m2 (HC-M) | CO | 6 g/day of soluble green/roasted (35:65) coffee for 8 weeks | 510.6 mg/day HCAs (~344 mg/day CGA) + ~120 mg caffeine | Water or an isotonic drink | ↓SBP, DBP ↓glucose, HOMA-IR and TG = HDL, insulin, waist circumference ↓SBP, DBP, HOMA-IR, TG in HC only = HDL, glucose, insulin in HC only ↓HOMA-IR in NC only = SBP, DBP, TG, HDL, glucose, insulin in NC only |
| Shahmohammadi et al. 2017 [60] | n = 44 (22M/22F) patients with NAFLD; age 41.4 ± 7.7 y (GCE) and 44.5 ± 5.2 y (placebo); BMI 31.3 ± 2.6 kg/m2 (GCE) and 31.5 ± 2.2 kg/m2 (placebo) | P | 1 g GCE/day for 8 weeks + advice on 30 min/day exercise | 500 mg CGAs/day | 1 g placebo/day for 8 weeks + advice on 30 min/day exercise | ↓TC, TG, fasting blood glucose, HOMA-IR = HDL, LDL, insulin, WC, BMI for GCE vs. control |
| Soga et al. 2013 [69] | n = 18 M; age 36.1 ± 7:4 y; BMI 21.9 ± 0.6 kg/m2 (CGA) and 22.0 ± 0.5 kg/m2 (control); healthy | CO | 185 mL of a test beverage with CGAs daily for 4 weeks | 329 mg CGAs/serving | 185 mL of test beverage without CGAs for 4 weeks; caffeine-matched | ↓glucose within CGA = BMI |
| Vinson et al. 2012 [73] | n = 18 hypertensive (7M/11F); age 54 ± 10 y; BMI 29.4 ± 6.4 kg/m2 | CO | 6–8 purple potatoes for 4 weeks | 2.72 mg/g dw CGA; 0.147 mg/g dw neoCGA | No potatoes for 4 weeks | ↓DBP within purple potatoes = SBP, glucose, HbA1c, TC, HDL, TG |
| Vitaglione et al. 2015 [71] | n = 68 overweight/obese otherwise healthy (23M/45F); age 40 ± 2 y (WG) and 37 ± 2 y (control); BMI 30.0 ± 0.5 kg/m2 (WG) and 29.5 ± 0.4 kg/m2 (control) | P | 70 g/d (3 biscuits/d) of WG products for 8 weeks | 96.7 mg FA/serving; 26.5 mg SA/serving; 9.4 mg CA/serving | 1 package (33 g) of crackers and 3 slices of toasted bread for 8 weeks | = BMI, WC, glucose, TC, HDL, TG |
| Watanabe et al. 2006 [66] | n = 28 with mild hypertension (11M/17F); age 52 ± 11 y (CGA) and 51 ± 8 y (placebo); BMI 23.8 ± 3.3 kg/m2 (CGA) and 25.0 ± 3.5 kg/m2 (placebo) | P | 125 mL/day fruit and vegetable juice mixed with GCE for 12 weeks | 140 mg CGA/day | 125 mL/day fruit and vegetable juice for 12 weeks | ↓SBP and DBP within GCE ↓SBP GCE vs. control = BMI, TC, LDL, HDL, TG, glucose |
| Wedick et al. 2011 [65] | n = 45 overweight (16M/29F); age 40 y; BMI 29.5 kg/m2 | P | 5 cups (177 mL each) per day of (1) DC or (2) caffeinated coffee for 8 weeks | (1) 216 mg/5 cups of DC (2) 302 mg/5 cups for caffeinated coffee | No coffee (i.e., water) for 8 weeks | = BMI, WC, SBP, LDL, HDL, TG, glucose, insulin and HOMA-IR ↓DBP within DC |
| Yamaguchi et al. 2008 [53] | n = 183 with mild hypertension (91M/92F); age 49.4 ± 10.1 y; BMI 25.4 ± 3.8 kg/m2 | P | One can (184 mL)/day of zero-dose, low-dose, middle-dose, high-dose coffee for 4 weeks | 82 mg (low-dose), 172 mg (middle-dose) and 299 mg (high-dose) CGA/can | 0 mg (zero-dose) coffee (0 mg CGA) | ↓SBP and DBP in low, middle and high-dose = LDL, TG ↑HDL and TC within middle-dose ↓BW within middle and high dose |
| Zuñiga et al. 2017 [51] | n = 30 (5M/25F) patients with IGT; age 43 ± 11 y (CGA) and 45 ± 9 y (placebo); BMI 32.6 ± 2.4 kg/m2 (CGA) and 32.1 ± 2.5 kg/m2 (placebo) | P | Oral CGAs from GCE, three times per day for 12 weeks | 1200 mg CGAs/day | Oral placebo, three times per day for 12 weeks | ↓BMI, WC, TG, TC, LDL, glucose = SBP, DBP, HDL, HbA1c within CGA |
| Reference | Determinant of Inter-Individual Variability | Main Findings |
|---|---|---|
| Acute studies | ||
| Ioakeimidis et al. 2018 [49] | Dietary pattern (habitual and non habitul coffee consumers) | = BP between habitual and non-habitual consumers |
| Iwai et al. 2013 [35] | Pathophysiological status (high glycemic response vs. total mean glycemic response) | ↓glucose after both 100 mg 300 mg EDGCB in high glycemic response group |
| Jokura et al. 2015 [46] | Pathophysiological status (lower or higher insulinogenic index) | ↓blood glucose after CPE compared to the placebo in study participants with a lower insulinogenic index ↑postprandial FMD after CPE compared to the placebo in study participants with either lower or higher insulinogenic index |
| Chronic studies | ||
| Martínez-López et al. 2018 [28] * | Pathophysiological status (normocholesterolemia vs. hypercholesterolemia) | ↓TC, LDL, TG only in HC |
| Sarriá et al. 2018 [26] * | Pathophysiological status (normocholesterolemia vs. hypercholesterolemia) | ↓SBP, DBP only in HC ↓HOMA-IR in both HC and NC separately = glucose in either HC or NC separately |
| Rezazadeh et al. 2018 [58] | -Taq IB polymorphism in cholesteryl ester transfer protein gene (B1B1 vs. B2 allel) -Sex (men vs. women with the selected polymorphisms) | Similar changes in lipid profile among Taq IB genotype compared to placebo ↓LDL in men with B1B1 genotype after ALE |
| Rondanelli et al. 2013 [54] | Sex (men vs. women) Stratified by median HDL | ↑HDL in men only ↓LDL, TC in men and women ↓ TG in women only ↑ HDL in men in both strata ↑HDL in women in ≤median HDL strata |
© 2019 by the authors. Licensee MDPI, Basel, Switzerland. This article is an open access article distributed under the terms and conditions of the Creative Commons Attribution (CC BY) license (http://creativecommons.org/licenses/by/4.0/).
Share and Cite
Martini, D.; Chiavaroli, L.; González-Sarrías, A.; Bresciani, L.; Palma-Duran, S.A.; Dall’Asta, M.; Deligiannidou, G.-E.; Massaro, M.; Scoditti, E.; Combet, E.; et al. Impact of Foods and Dietary Supplements Containing Hydroxycinnamic Acids on Cardiometabolic Biomarkers: A Systematic Review to Explore Inter-Individual Variability. Nutrients 2019, 11, 1805. https://doi.org/10.3390/nu11081805
Martini D, Chiavaroli L, González-Sarrías A, Bresciani L, Palma-Duran SA, Dall’Asta M, Deligiannidou G-E, Massaro M, Scoditti E, Combet E, et al. Impact of Foods and Dietary Supplements Containing Hydroxycinnamic Acids on Cardiometabolic Biomarkers: A Systematic Review to Explore Inter-Individual Variability. Nutrients. 2019; 11(8):1805. https://doi.org/10.3390/nu11081805
Chicago/Turabian StyleMartini, Daniela, Laura Chiavaroli, Antonio González-Sarrías, Letizia Bresciani, Susana A. Palma-Duran, Margherita Dall’Asta, Georgia-Eirini Deligiannidou, Marika Massaro, Egeria Scoditti, Emilie Combet, and et al. 2019. "Impact of Foods and Dietary Supplements Containing Hydroxycinnamic Acids on Cardiometabolic Biomarkers: A Systematic Review to Explore Inter-Individual Variability" Nutrients 11, no. 8: 1805. https://doi.org/10.3390/nu11081805
APA StyleMartini, D., Chiavaroli, L., González-Sarrías, A., Bresciani, L., Palma-Duran, S. A., Dall’Asta, M., Deligiannidou, G.-E., Massaro, M., Scoditti, E., Combet, E., Maksimova, V., Urpi-Sarda, M., Kontogiorgis, C. A., Andrés-Lacueva, C., Gibney, E. R., Del Rio, D., Morand, C., Garcia-Aloy, M., Rodriguez-Mateos, A., & Mena, P. (2019). Impact of Foods and Dietary Supplements Containing Hydroxycinnamic Acids on Cardiometabolic Biomarkers: A Systematic Review to Explore Inter-Individual Variability. Nutrients, 11(8), 1805. https://doi.org/10.3390/nu11081805