The Handbook of Minerals on a Gluten-Free Diet


Abstract
1. Introduction
2. Materials and Methods
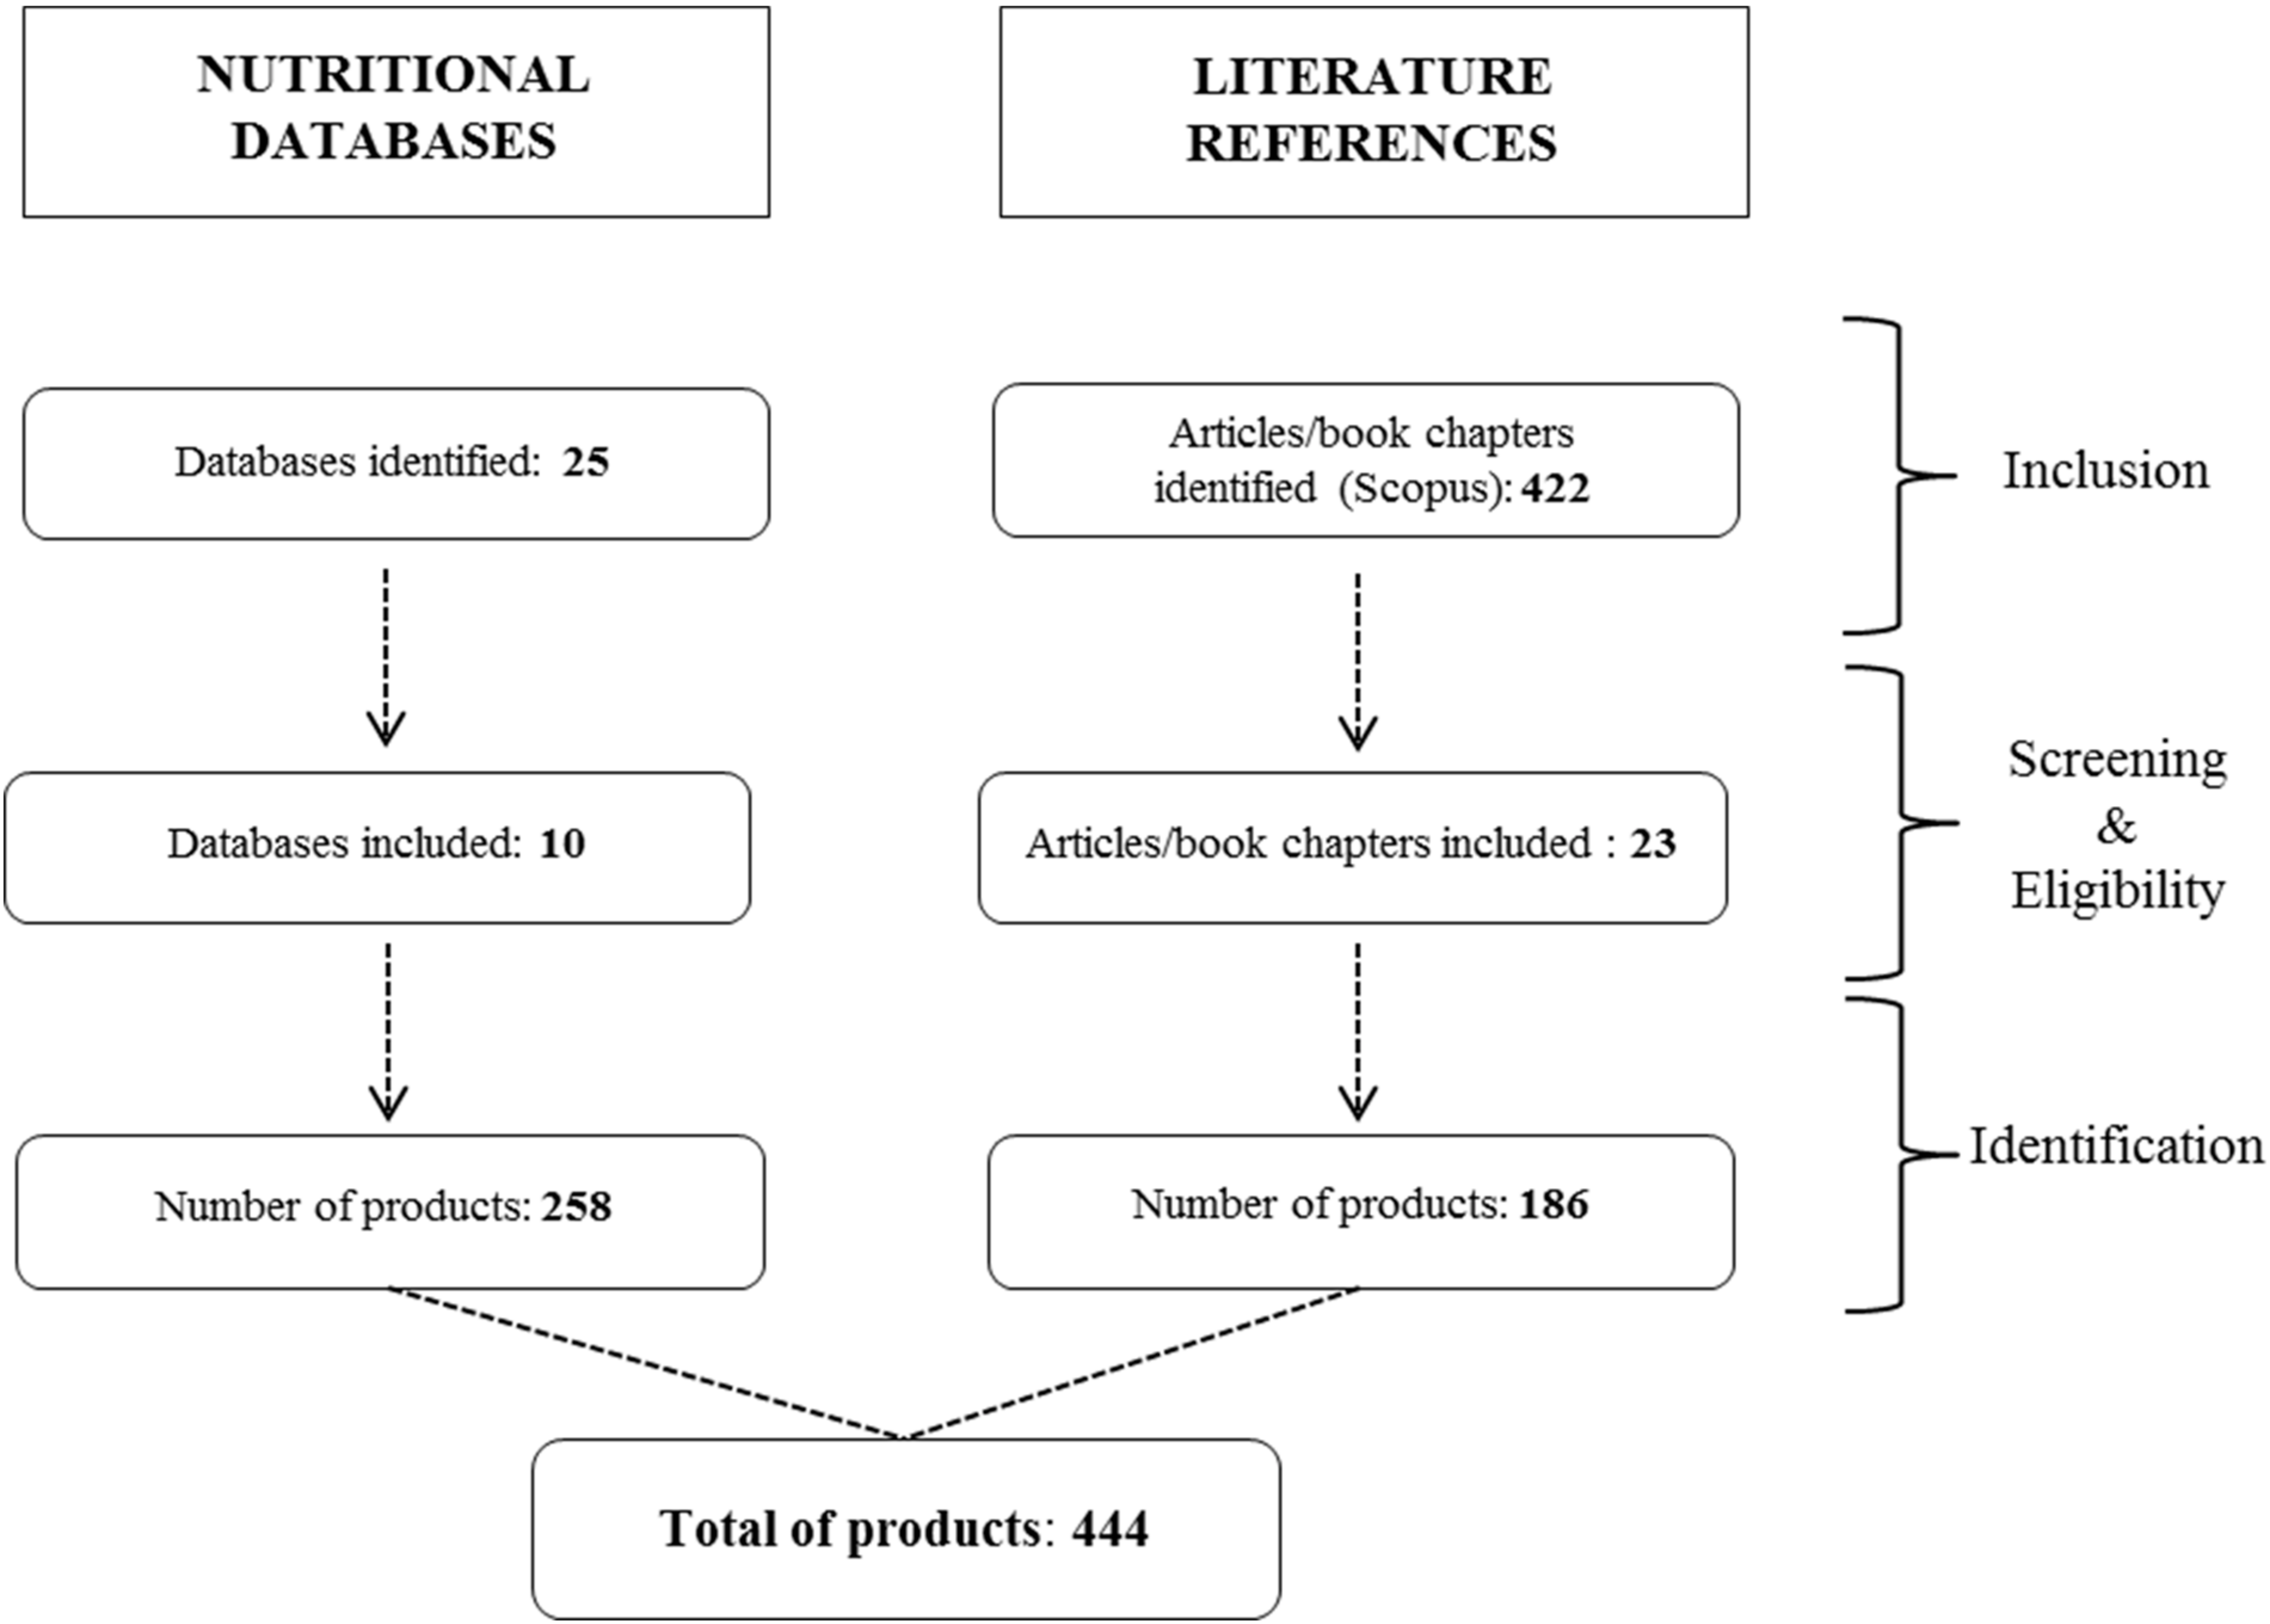
2.1. Methods
2.2. Data Extraction
3. Results & Discussion
- I—flours
- II—mixes for cooking
- III—bakery products (e.g., breads, rolls, dinner rolls, crack bread)
- IV—cereals (plain and musli flakes)
- V—grains and rice
- VI—pasta
4. Conclusions
Supplementary Materials
Funding
Conflicts of Interest
References
- Topper, A. Non-Celiacs Drive Gluten-Free Market Growth. Mintel Group Ltd. 2014. Available online: http://www.mintel.com/blog/food-market-news/gluten-free-consumption-trends (accessed on 7 November 2018).
- Priven, M.; Baum, J.; Vieira, E.; Fung, T.; Herbold, N. The influence of a factitious free-from food product label on consumer perceptions of healthfulness. J. Acad. Nutr. Diet. 2015, 115, 1808–1814. [Google Scholar] [CrossRef] [PubMed]
- Kim, H.; Patel, K.G.; Orosz, E.; Kothari, N.; Demyen, M.F.; Pyrsopoulos, N.; Ahlawat, S.K. Time trends in the prevalence of celiac disease and gluten-free diet in the us population: Results from the national health and nutrition examination surveys 2009–2014. JAMA Intern. Med. 2016, 176, 1716–1717. [Google Scholar] [CrossRef] [PubMed]
- Richardson, B. Food Trends and Gluten. Know the Facts. Nutrition Foodservice Edge. 2018. Available online: https://www.anfponline.org/docs/default-source/legacy-docs/docs/ce-articles/nc012018.pdf (accessed on 7 November 2018).
- Christoph, M.J.; Larson, N.; Hootman, K.C.; Miller, J.M.; Neumark-Sztainer, D. Who values gluten-free? Dietary intake, behaviors, and sociodemographic characteristics of young adults who value gluten-free food. J. Acad. Nutr. Diet. 2018, 118, 1389–1398. [Google Scholar] [CrossRef] [PubMed]
- Vici, G.; Belli, L.; Biondi, M.; Polzonetti, V. Gluten free diet and nutrient deficiencies: A review. Clin. Nutr. 2016, 35, 1236–1241. [Google Scholar] [CrossRef] [PubMed]
- Gobbetti, M.; Pontonio, E.; Filannino, P.; Rizzello, C.G.; De Angelis, M.; Di Cagnoa, R. How to improve the gluten-free diet: The state of the art from a food science perspective. Food Res. Int. 2018, 11, 22–32. [Google Scholar] [CrossRef] [PubMed]
- Pellegrini, N.; Agostoni, C. Nutritional aspects of gluten-free products. J. Sci. Food Agric. 2015, 95, 2380–2385. [Google Scholar] [CrossRef] [PubMed]
- Bascuñán, K.A.; Vespa, M.C.; Araya, M. Celiac disease: Understanding the gluten-free diet. Eur. J. Nutr. 2017, 56, 449–459. [Google Scholar] [CrossRef] [PubMed]
- Foschia, M.; Horstmann, S.; Arendt, E.K.; Zannini, E. Nutritional therapy–Facing the gap between coeliac disease and gluten-free food. Int. J. Food Microbiol. 2016, 239, 113–124. [Google Scholar] [CrossRef] [PubMed]
- FAO. 2018. Available online: http://www.fao.org/infoods/infoods/tables-and-databases/europe/en/ (accessed on 10 October 2018).
- USDA Food Composition Database. Release April 2018. Available online: https://ndb.nal.usda.gov/ndb/search/list (accessed on 10 October 2018).
- Nutritionix. 2018. Available online: https://www.nutritionix.com/ (accessed on 10 October 2018).
- Nutrient Reference Values for Australia and New Zealand. 2018. Available online: https://www.nrv.gov.au/nutrients-energy-calculation/nutrients-energy-calc-result-1531402860 (accessed on 10 October 2018).
- Canadian Nutrient File. 2018. Available online: https://food-nutrition.canada.ca/cnf-fce/search-rechercher.do;jsessionid=C82C3179ABE8F09D19D8F621E5D3CC9C (accessed on 10 October 2018).
- Bundeslebensmittelschlüssel BLS, Version 3.02. 2018. Available online: https://www.blsdb.de/ (accessed on 10 October 2018).
- Norwegian Food Composition Table Matvaretabellen. 2018. Available online: http://www.matvaretabellen.no/ (accessed on 10 October 2018).
- The Dutch Food Composition Database (NEVO) Online Version 2016/5.0. 2016. Available online: https://nevo-online.rivm.nl/ (accessed on 10 October 2018).
- Fineli, Version 29.06.2018. 2018. Available online: https://fineli.fi/fineli/en/index? (accessed on 10 October 2018).
- Internubel 2018. Available online: http://www.internubel.be (accessed on 10 October 2018).
- NutriData Estonian Food Composition Database, Version 8. 2018. Available online: http://tka.nutridata.ee/index.action?request_locale=en (accessed on 10 October 2018).
- Armenian Food Composition Table. 2010. Available online: http://www.fao.org/fileadmin/templates/food_composition/documents/ArmenianFoodCompositionTable2010.pdf (accessed on 10 October 2018).
- Czech Food Composition Database, Version 7.16. 2016. Available online: https://www.nutridatabaze.cz/en/ (accessed on 10 October 2018).
- Danish Food Composition Databank, Revision 7.0. 2018. Available online: https://frida.fooddata.dk/?lang=en (accessed on 10 October 2018).
- ANSES-CIQUAL Food Composition Table. 2017. Available online: https://ciqual.anses.fr/ (accessed on 10 October 2018).
- Medical School of Crete: Food Composition Tables of Greek Foods 2018. Available online: http://www.hhf-greece.gr/tables/Dishes.aspx?l=en (accessed on 10 October 2018).
- Icelandic Food Composition Database Matís. 2018. Available online: http://www1.matis.is/ISGEM/default_en.aspx (accessed on 10 October 2018).
- Food Composition Database for Epidemiological Studies in Italy BDA 2015. Available online: http://www.bda-ieo.it/wordpress/en/?page_id=27 (accessed on 10 October 2018).
- Latvian Food Composition Database. 2018. Available online: http://www.partikasdb.lv/ (accessed on 10 October 2018).
- Serbian Food and Nutrition Database. 2018. Available online: http://104.155.19.23/serbianfood/index.php (accessed on 10 October 2018).
- Slovak Food Composition Data Bank. 2018. Available online: http://www.pbd-online.sk/en (accessed on 10 October 2018).
- Spanish Food Composition Database. 2018. Available online: http://www.bedca.net/bdpub/index_en.php (accessed on 10 October 2018).
- Swedish Food Composition Database. 2015. Available online: https://www.livsmedelsverket.se/en/food-and-content/naringsamnen/livsmedelsdatabasen (accessed on 10 October 2018).
- Swiss Food Composition Database 2018. Available online: http://www.naehrwertdaten.ch/request?xml=MessageData&xml=MetaData&xsl=Start&lan=en&pageKey=Start (accessed on 10 October 2018).
- National Food Composition Database Türkomp. 2018. Available online: http://www.turkomp.gov.tr/main (accessed on 10 October 2018).
- McCance and Widdowson’s the Composition of Foods Integrated Dataset. 2015. Available online: https://www.gov.uk/government/publications/composition-of-foods-integrated-dataset-cofid?utm_source=MW7+List+March+2015&utm_campaign=947c9d4b28-Newsletter_2_December_2013_FINAL12_13_2013&utm_medium=email&utm_term=0_3b8ecbdaea-947c9d4b28-95444717 (accessed on 10 October 2018).
- Lu, Z.; Zhang, H.; Luoto, S.; Ren, X. Gluten-free living in China: The characteristics, food choices and difficulties in following a gluten-free diet—An online survey. Appetite 2018, 127, 242–248. [Google Scholar] [CrossRef] [PubMed]
- Regulation (EU) No 1169/2011 of the European Parliament and of the Council of 25 October 2011 on the Provision of Food Information to Consumers, Amending Regulations (EC) No 1924/2006 and (EC) No 1925/2006 of the European Parliament and of the Council, and Repealing Commission Directive 87/250/EEC, Council Directive 90/496/EEC, Commission Directive 1999/10/EC, Directive 2000/13/EC of the European Parliament and of the Council, Commission Directives 2002/67/EC and 2008/5/EC and Commission Regulation (EC) No 608/2004 Text with EEA Relevance. Available online: https://www.tul.cz/en/document/2471 (accessed on 10 October 2018).
- Bradley, R.L. Moisture and total solids analysis. In Food Analysis, 4th ed.; Nielsen, S.S., Ed.; Food Science Texts Series; Springer: Berlin, Germany, 2010; pp. 85–104. [Google Scholar]
- Skendi, A.; Mouselemidou, P.; Papageorgiou, M.; Papastergiadis, E. Effect of acorn meal-water combinations on technological properties and fine structure of gluten-free bread. Food Chem. 2018, 253, 119–126. [Google Scholar] [CrossRef] [PubMed]
- Gull, A.; Prasad, K.; Kumar, P. Nutritional, antioxidant, microstructural and pasting properties of functional pasta. J. Saudi Soc. Agric. Sci. 2018, 17, 147–153. [Google Scholar] [CrossRef]
- Cabrera-Chávez, F.; Calderón de la Barca, A.M.; Islas-Rubio, A.R.; Marti, A.; Marengo, M.; Pagani, M.; Bonomi, F.; Iametti, S. Molecular rearrangements in extrusion processes for the production of amaranth-enriched, gluten-free rice pasta. LWT Food Sci. Technol. 2012, 47, 421–426. [Google Scholar] [CrossRef]
- Orecchio, S.; Amorello, S.; Raso, M.; Barreca, S.; Lino, C.; Di Gaudio, F. Determination of trace elements in gluten-free food for celiac people by ICP-MS. Microchem. J. 2014, 116, 163–172. [Google Scholar] [CrossRef]
- Risius, H.; Prochnow, A.; Ammon, C.; Mellmann, J.; Hoffmann, T. Appropriateness of on-combine moisture measurement for the management of harvesting and postharvest operations and capacity planning in grain harvest. Biosyst. Eng. 2017, 156, 120–135. [Google Scholar] [CrossRef]
- Campo, E.; del Arco, L.; Urtasun, L.; Oria, R.; Ferrer-Mairal, A. Impact of sourdough on sensory properties and consumers’ preference of gluten-free breads enriched with teff flour. J. Cereal Sci. 2016, 67, 75–82. [Google Scholar] [CrossRef]
- Nascimento, A.C.; Mota, C.; Coelho, I.; Gueifăo, S.; Santos, M.; Matos, A.S.; Gimenez, A.; Lobo, M.; Samman, N.; Castanheira, I. Characterisation of nutrient profile of quinoa (Chenopodium quinoa), amaranth (Amaranthus caudatus), and purple corn (Zea mays L.) consumed in the North of Argentina: Proximates, minerals and trace elements. Food Chem. 2014, 148, 420–426. [Google Scholar] [CrossRef] [PubMed]
- Kumar, K.V.P.; Dharmaraj, U.; Sakhare, S.D.; Inamdar, A.A. Preparation of protein and mineral rich fraction from grain amaranth and evaluation of its functional characteristics. J. Cereal Sci. 2016, 69, 358–362. [Google Scholar] [CrossRef]
- Jimoh, M.O.; Afolayan, A.J.; Lewu, F.B. Suitability of Amaranthus species for alleviating human dietary deficiencies. S. Afr. J. Bot. 2018, 115, 65–73. [Google Scholar] [CrossRef]
- Kunachowicz, H. (Ed.) Gluten-Free Diet—What to Choose? 2nd ed.; Wydawnictwo Lekarskie PZWL: Warsaw, Poland, 2015; pp. 99–170. ISBN 978-83-200-4965-7. [Google Scholar]
- Alvarez-Jubete, L.; Arendt, E.K.; Gallagher, E. Nutritive value and chemical composition of pseudocereals as gluten-free ingredients. Int. J. Food Sci. Nutr. 2009, 60, 240–257. [Google Scholar] [CrossRef] [PubMed]
- Mota, C.; Nascimento, A.C.; Santos, M.; Delgado, I.; Coelho, I.; Rego, A.; Matos, A.S.; Torres, D.; Castanheira, I. The effect of cooking methods on the mineral content of quinoa (Chenopodium quinoa), amaranth (Amaranthus sp.) and buckwheat (Fagopyrum esculentum). J. Food Compos. Anal. 2016, 49, 57–64. [Google Scholar] [CrossRef]
- Thavarajah, D.; Thavarajah, P. Evaluation of chickpea (Cicer arietinum L.) micronutrient composition: Biofortification opportunities to combat global micronutrient malnutrition. Food Res. Int. 2012, 49, 99–104. [Google Scholar] [CrossRef]
- Vilcacundo, R.; Hernandez-Ledesma, B. Nutritional and biological value of quinoa (Chenopodium quinoa Willd.). Curr. Opin. Food Sci. 2017, 14, 1–6. [Google Scholar] [CrossRef]
- Dame, Z.T. Analysis of major and trace elements in teff (Eragrostis tef). J. King Saud Univ. Sci. 2018. [Google Scholar] [CrossRef]
- Zhu, F. Chemical composition and food uses of teff (Eragrostis tef). Food Chem. 2018, 239, 402–415. [Google Scholar] [CrossRef] [PubMed]
- Mazzeo, T.; Cauzzi, S.; Brighenti, F.; Pellegrini, N. The development of a composition database of gluten-free products. Public Health Nutr. 2014, 18, 1353–1357. [Google Scholar] [CrossRef] [PubMed]


| Ca [mg/100 g] | Fe [mg/100 g] | Mg [mg/100 g] | Zn [mg/100 g] | Literature Source | |
|---|---|---|---|---|---|
| Amaranth | 61 4 | 6.2 6 | 129 2 | 1.4 5 | 1 [46] |
| 153 5 | 7.6 3 | 231 1 | 2.2 2 | 2 [47] | |
| 159 3 | 7.8 5 | 237 5 | 2.9 3 | 3 [48] | |
| 165 1 | 8.9 4 | 248 3 | 3.9 6 | 4 [49] | |
| 170 6 | 9.6 1 | 279 6 | 5.6 1 | 5 [50] | |
| 497 2 | 16 2 | 313 4 | n.a. * 4 | 6 [51] | |
| Buckwheat | 15 2 | 2.4 2 | 173 1 | 0.9 1 | 1 [50] |
| 52 1 | 4.0 1 | 204 2 | 1.6 2 | 2 [51] | |
| Chickpea | 93–197 1 | 4.6–6.7 1 | 125–159 1 | 3.7–7.4 1 | 1 [52] |
| Corn | Purple < LOQ 1 | Purple 2.78 1 | Purple 118 1 | Purple 2.5 1 | 1 [46] |
| Yellow 7 2 | Yellow 2.7 2 | Yellow 127 2 | Yellow 2.2 2 | 2 [12] | |
| Millet | 8 2 | 3 2 | 103 1 | 1.7 2 | 1 [21] |
| 9 1 | 4.8 1 | 114 2 | 3.4 1 | 2 [12] | |
| Quinoa | 24–127 2 | 1.2–14 2 | 22–427 2 | 1.5 6 | 1 [46] |
| 26 4 | 3.6 7 | 131 4 | 2.4–4.1 2 | 2 [53] | |
| 28 6 | 3.7 4 | 167 7 | 2.5 3 | 3 [21] | |
| 44 1 | 4.7 6 | 176 6 | 2.5 7 | 4 [36] | |
| 61 5 | 5.5 1 | 197 1 | 2.9 1 | 5 [49] | |
| 66 7 | 8 3 | 275 3 | 3.3 4 | 6 [50] | |
| 80 3 | 8.9 5 | 313 5 | n.a. 5 | 7 [51] | |
| Rice | Brown 32 1 | White 0.22 1 | White n.d. * 2 | White n.d. * 3 | 1 [46] |
| White < LOQ 1 | 0.8 3 | 13 3 | 0.5 2 | 2 [53] | |
| 10 3 | 1.2 2 | 27 1 | 1.0 1 | 3 [49] | |
| 19 2 | Wholegrain 1.3 1 | Wholegrain 115 1 | Wholegrain 2.1 1 | 1 [21] | |
| Wholegrain 11 1 | Red 2.2 1 | Red 106 1 | Red 1.5 1 | 1 [21] | |
| Red 15 1 | Wild 1.27 1 | Wild 108 1 | Wild 4.3 1 | 1 [21] | |
| Wild 8 1 | Brown 1.3 1 | Brown 110 1 | n.a. 1 | 1 [49] | |
| Indica/Japonica 3.6/4.3 4 | Indica/Japonica 0.1/0.1 4 | Indica/Japonica 24/17 4 | Indica/Japonica 0.9/0.7 4 | 4 [51] | |
| Sorghum | 13 2 | 3.4 2 | 162 1 | n.a. * 1 | 1 [49] |
| 28 1 | 4.4 1 | 165 2 | 1.7 2 | 2 [12] | |
| Tapioca | 16 1 | 1.3 1 | 1 2 | n.a. * 1 | 1 [49] |
| 20 2 | 1.6 2 | 2 1 | 0.1 2 | 2 [12] | |
| Teff | White/Red 32/44 1 | White/Red 1.1/1.4 1 | White/Red 54/44 1 | White/Red 1.0/1.0 1 | 1 [54] |
| 180 2 | 7.6 2 | 184 2 | 3.6 2 | 2 [55] |
© 2018 by the author. Licensee MDPI, Basel, Switzerland. This article is an open access article distributed under the terms and conditions of the Creative Commons Attribution (CC BY) license (http://creativecommons.org/licenses/by/4.0/).
Share and Cite
Rybicka, I. The Handbook of Minerals on a Gluten-Free Diet. Nutrients 2018, 10, 1683. https://doi.org/10.3390/nu10111683
Rybicka I. The Handbook of Minerals on a Gluten-Free Diet. Nutrients. 2018; 10(11):1683. https://doi.org/10.3390/nu10111683
Chicago/Turabian StyleRybicka, Iga. 2018. "The Handbook of Minerals on a Gluten-Free Diet" Nutrients 10, no. 11: 1683. https://doi.org/10.3390/nu10111683
APA StyleRybicka, I. (2018). The Handbook of Minerals on a Gluten-Free Diet. Nutrients, 10(11), 1683. https://doi.org/10.3390/nu10111683