
Evaluation of Multiple Downscaled Microwave Soil Moisture Products over the Central Tibetan Plateau


 ,
, 
Abstract
:
1. Introduction
2. Data
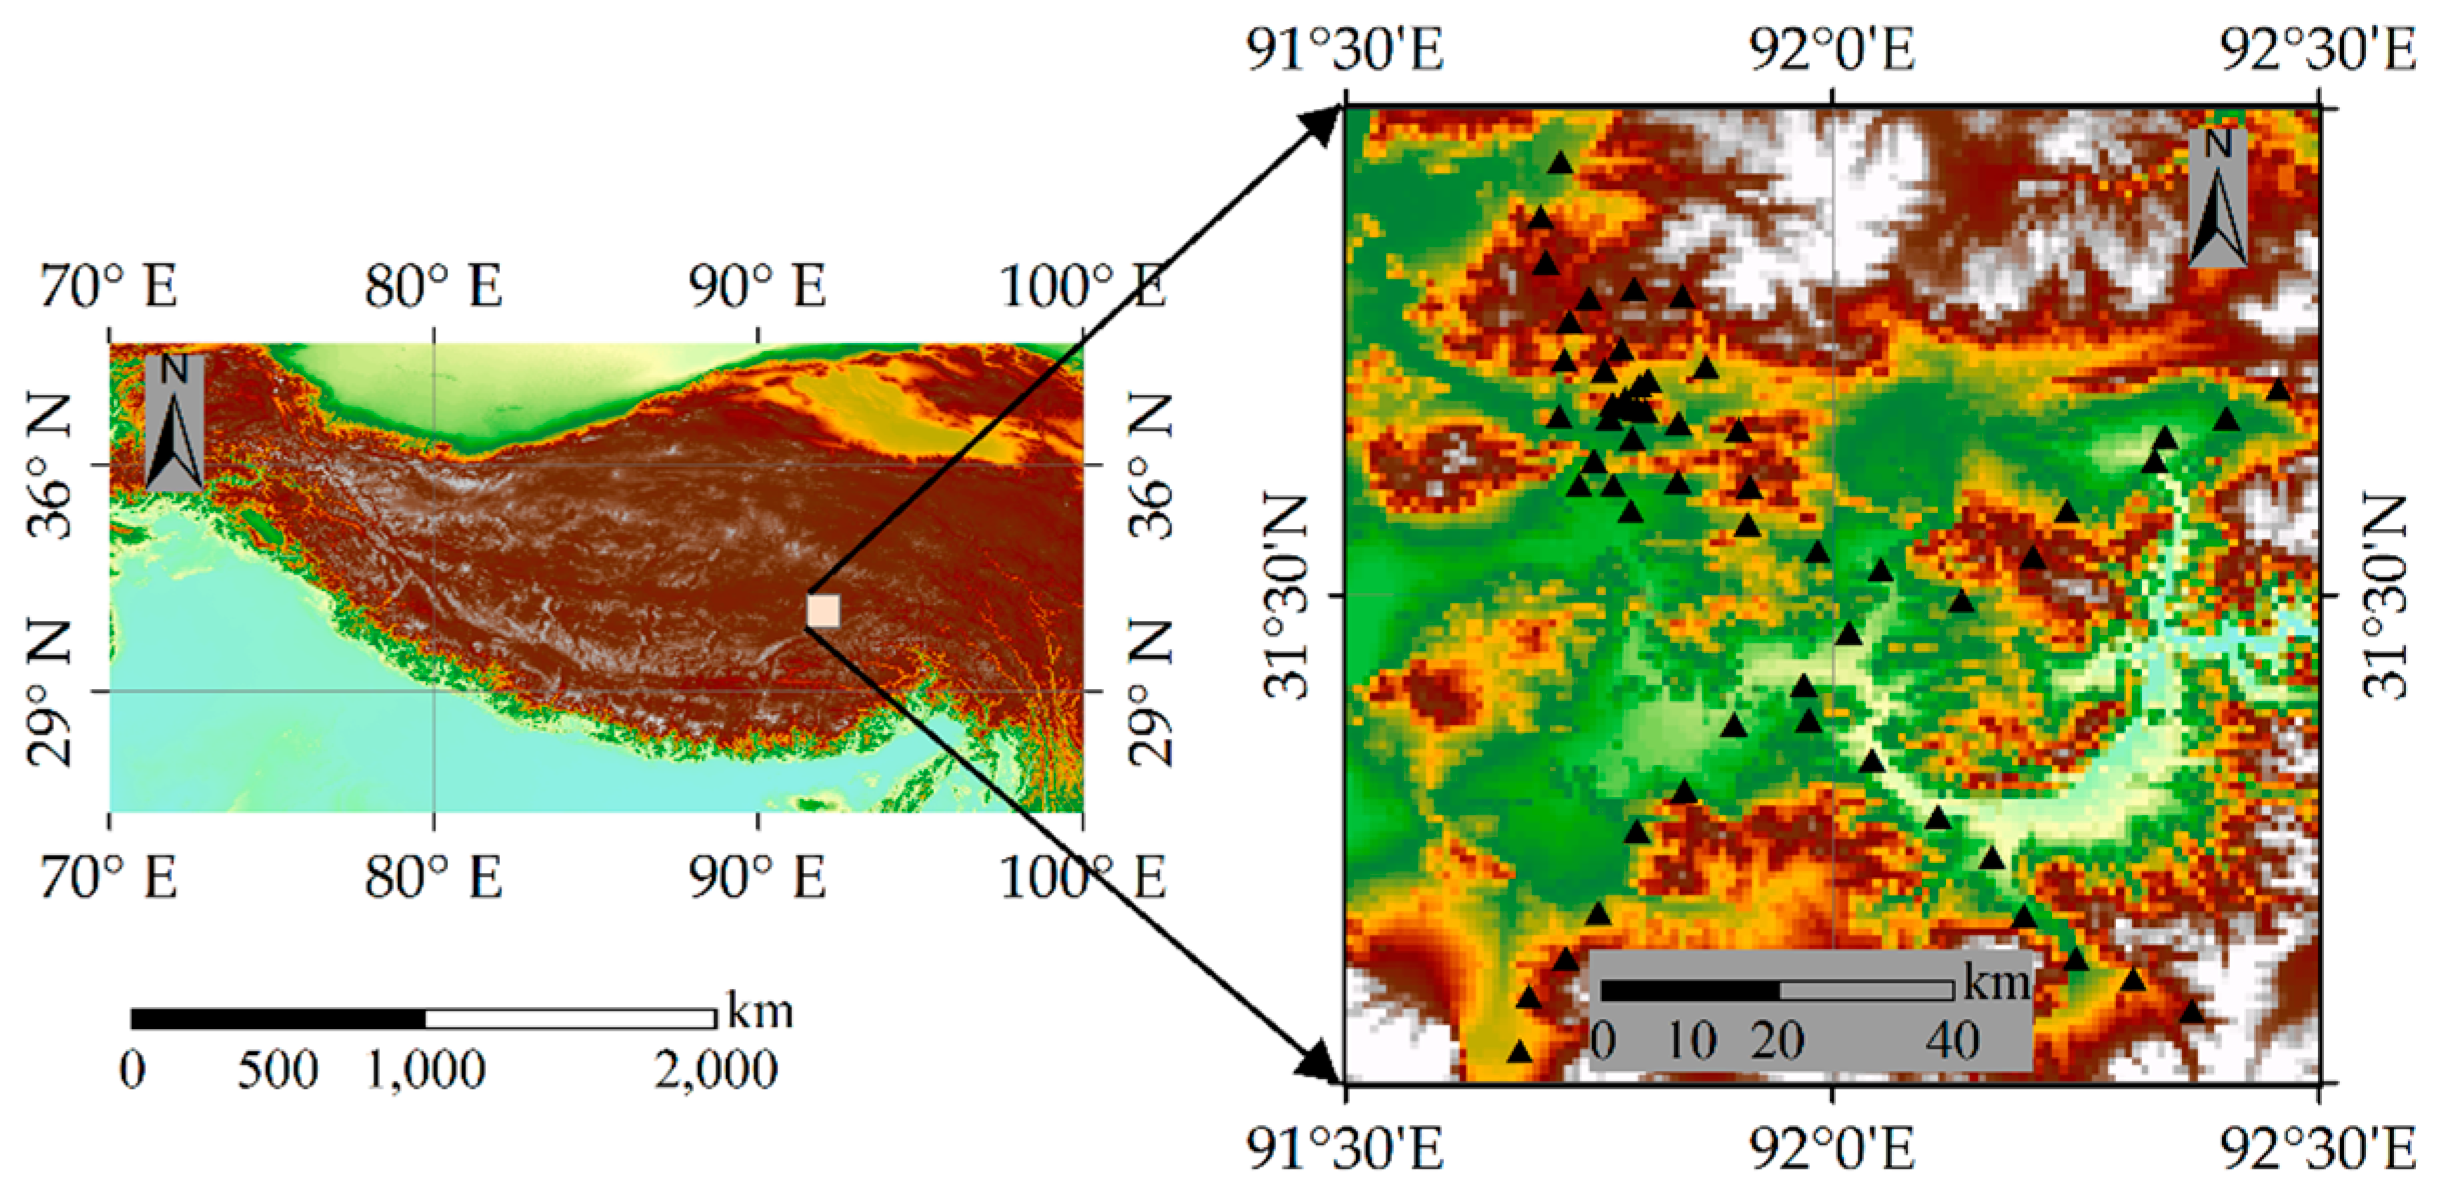
2.1. In-Situ Measurement
2.2. Microwave Soil Moisture Products
2.2.1. AMSR-E
2.2.2. AMSR2
2.2.3. SMOS
2.3. MODIS
3. Method
3.1. Data Pre-Processing
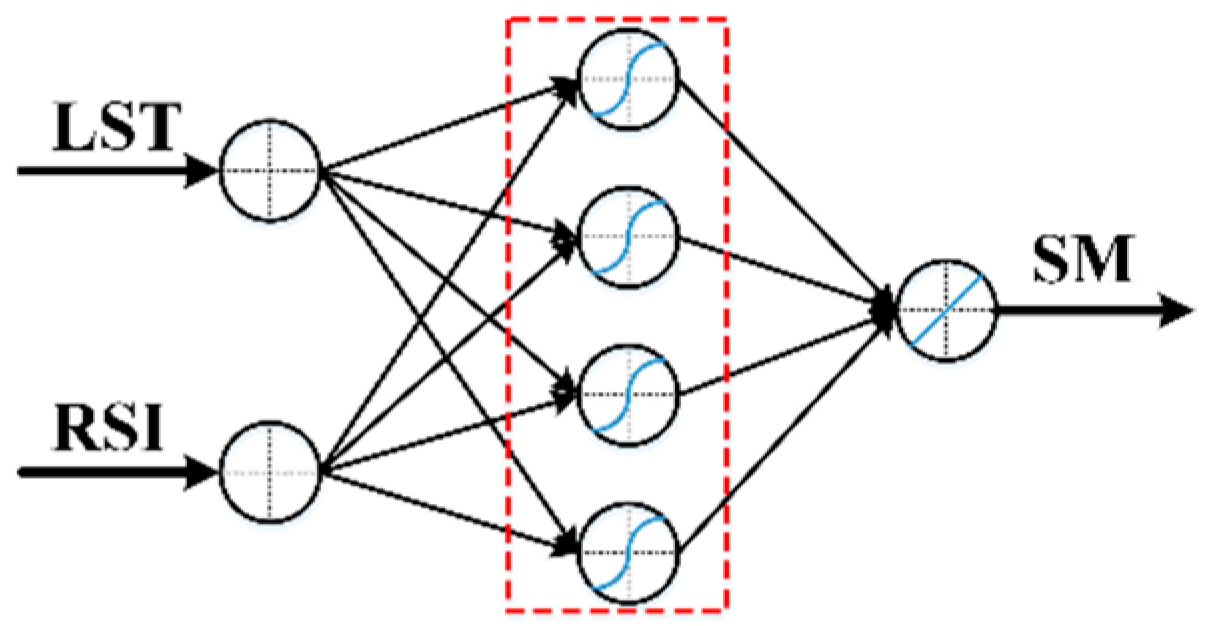
3.2. Microwave SM Product BPNN Downscaling
3.3. Quantitative Evaluation
4. Results
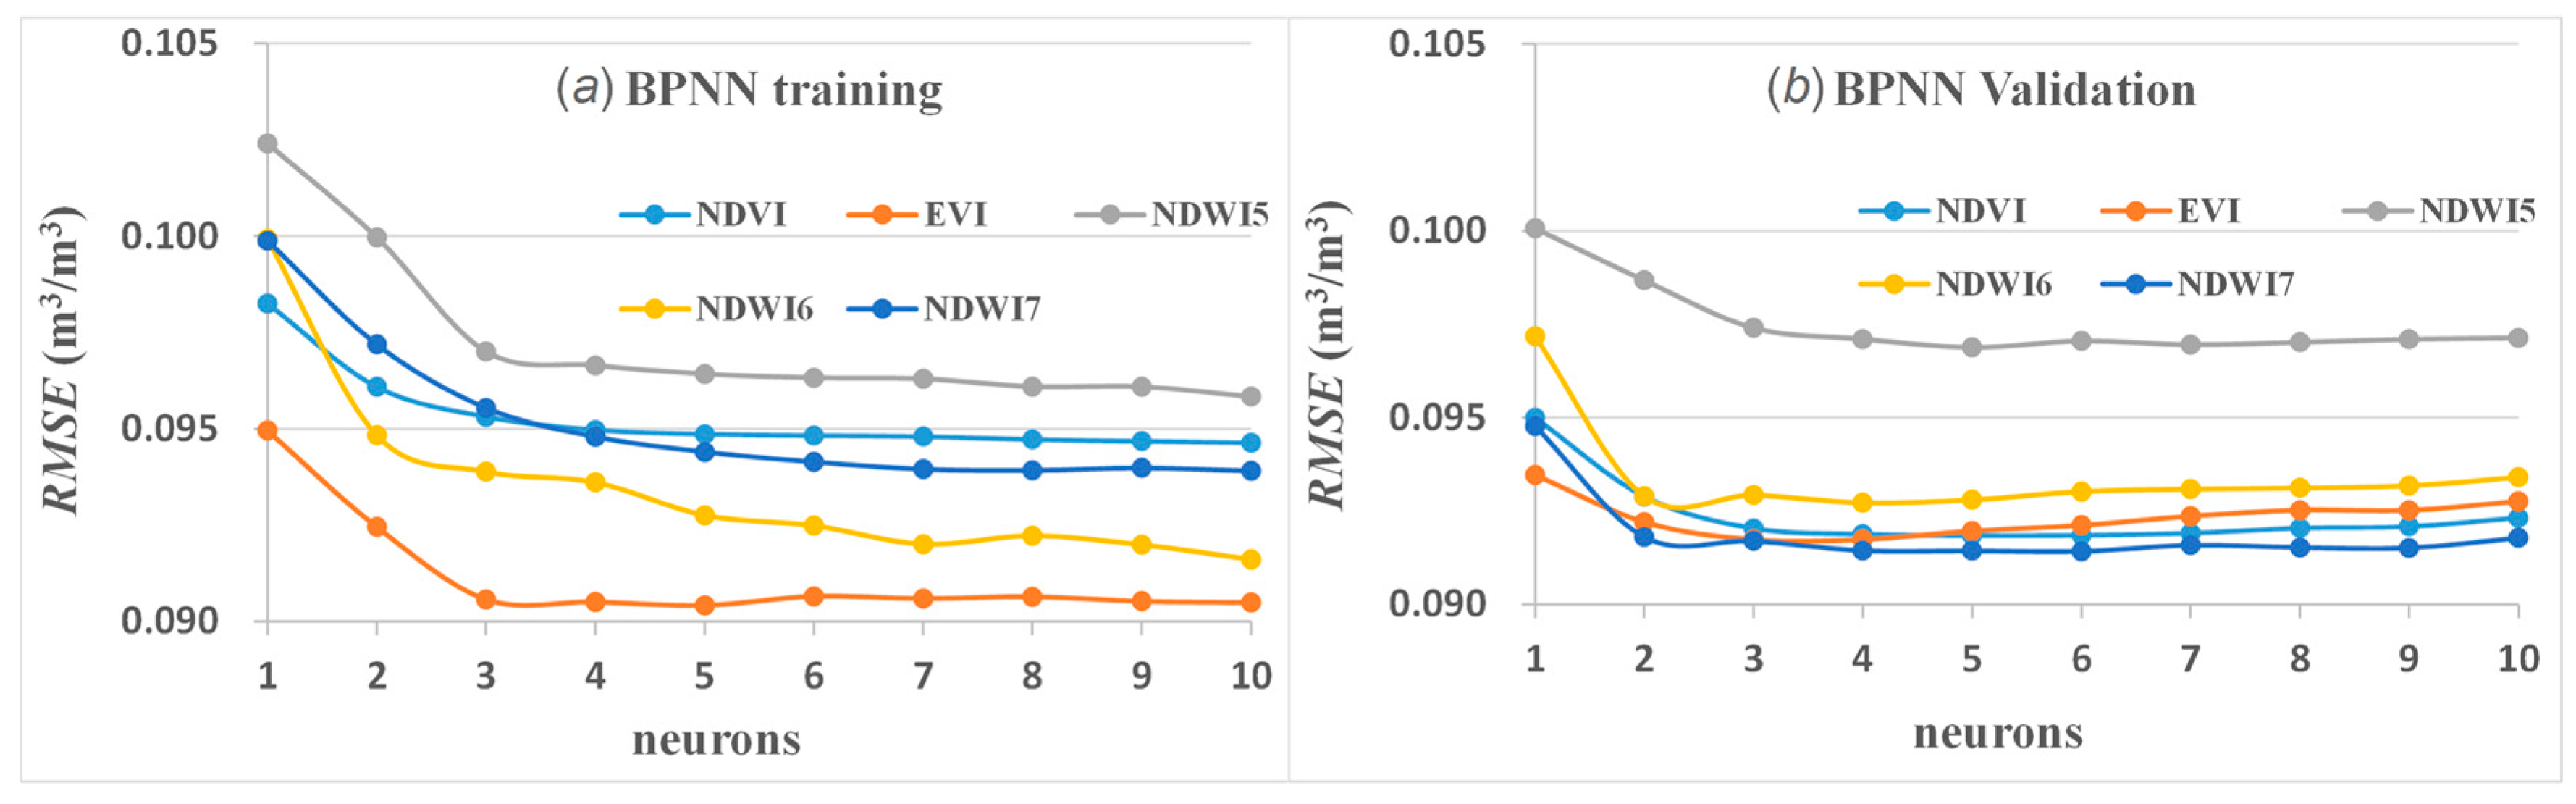
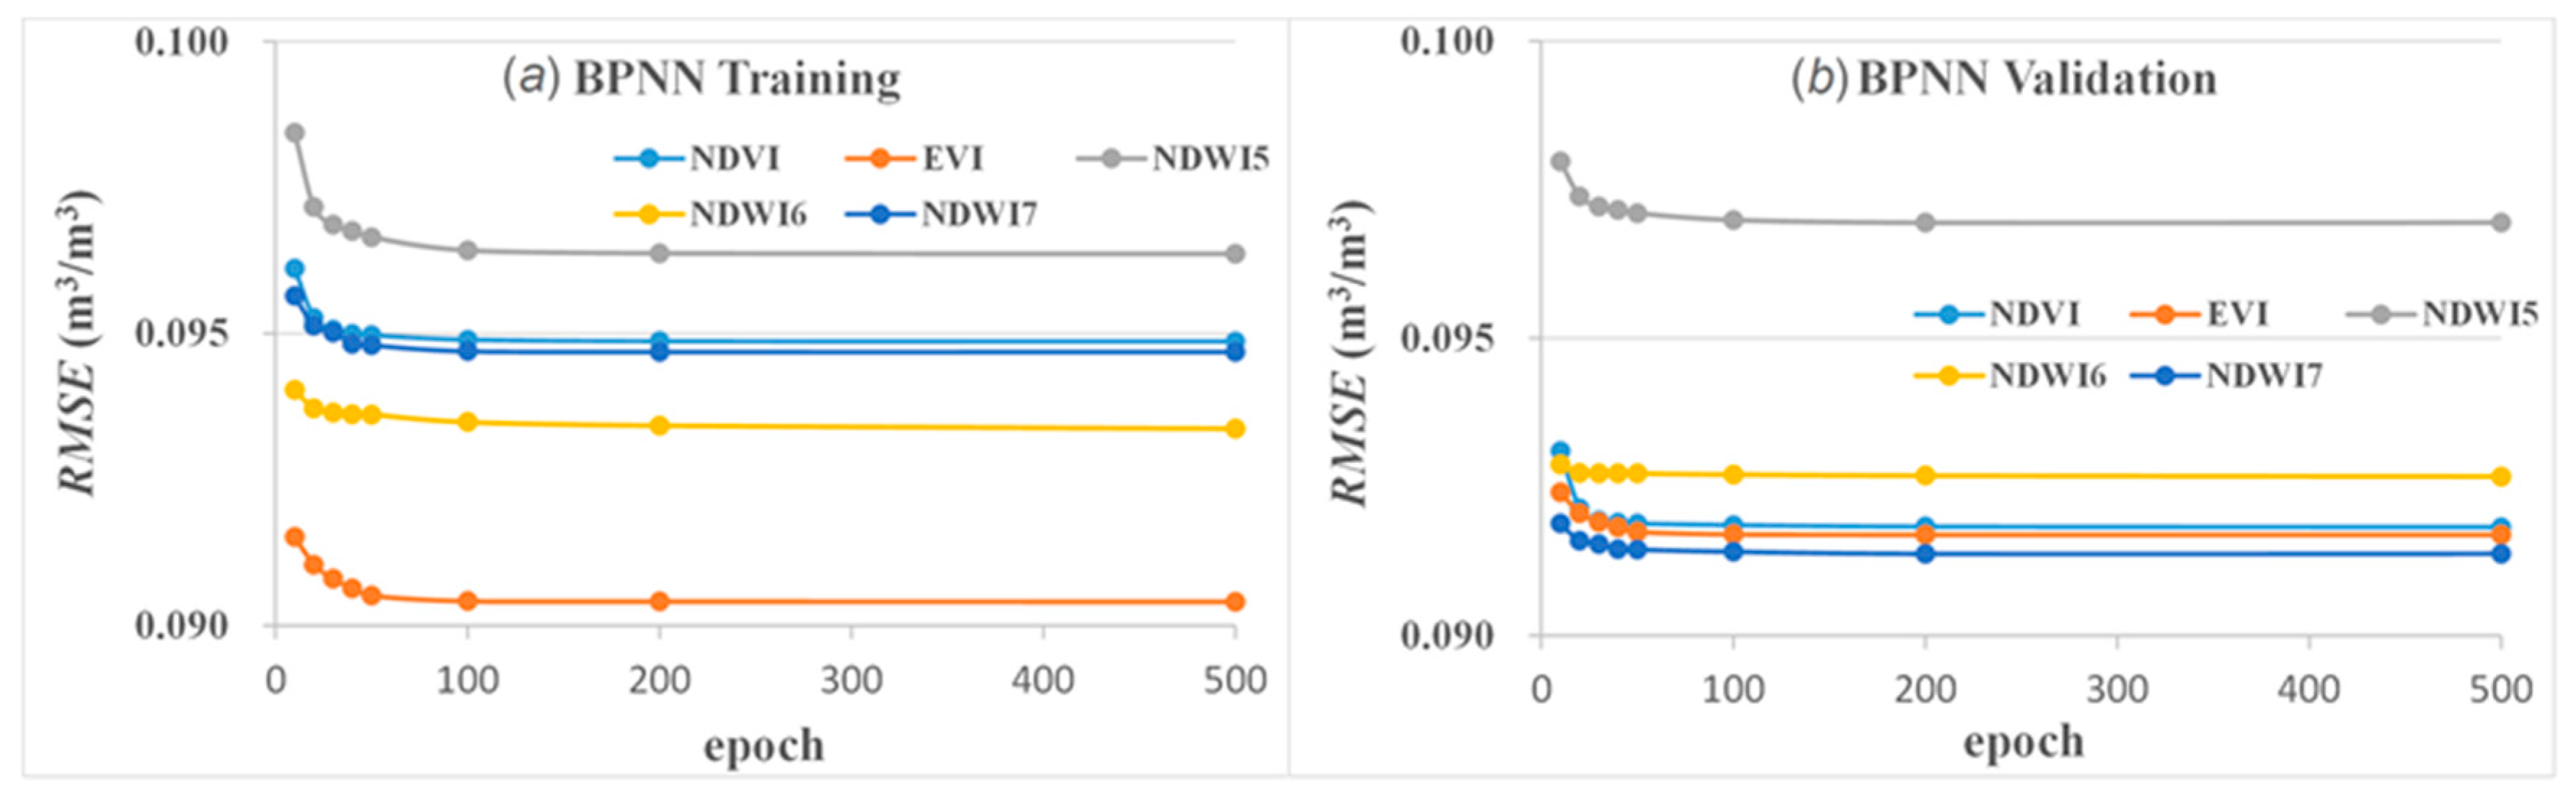
4.1. Structure Optimization of the BPNN
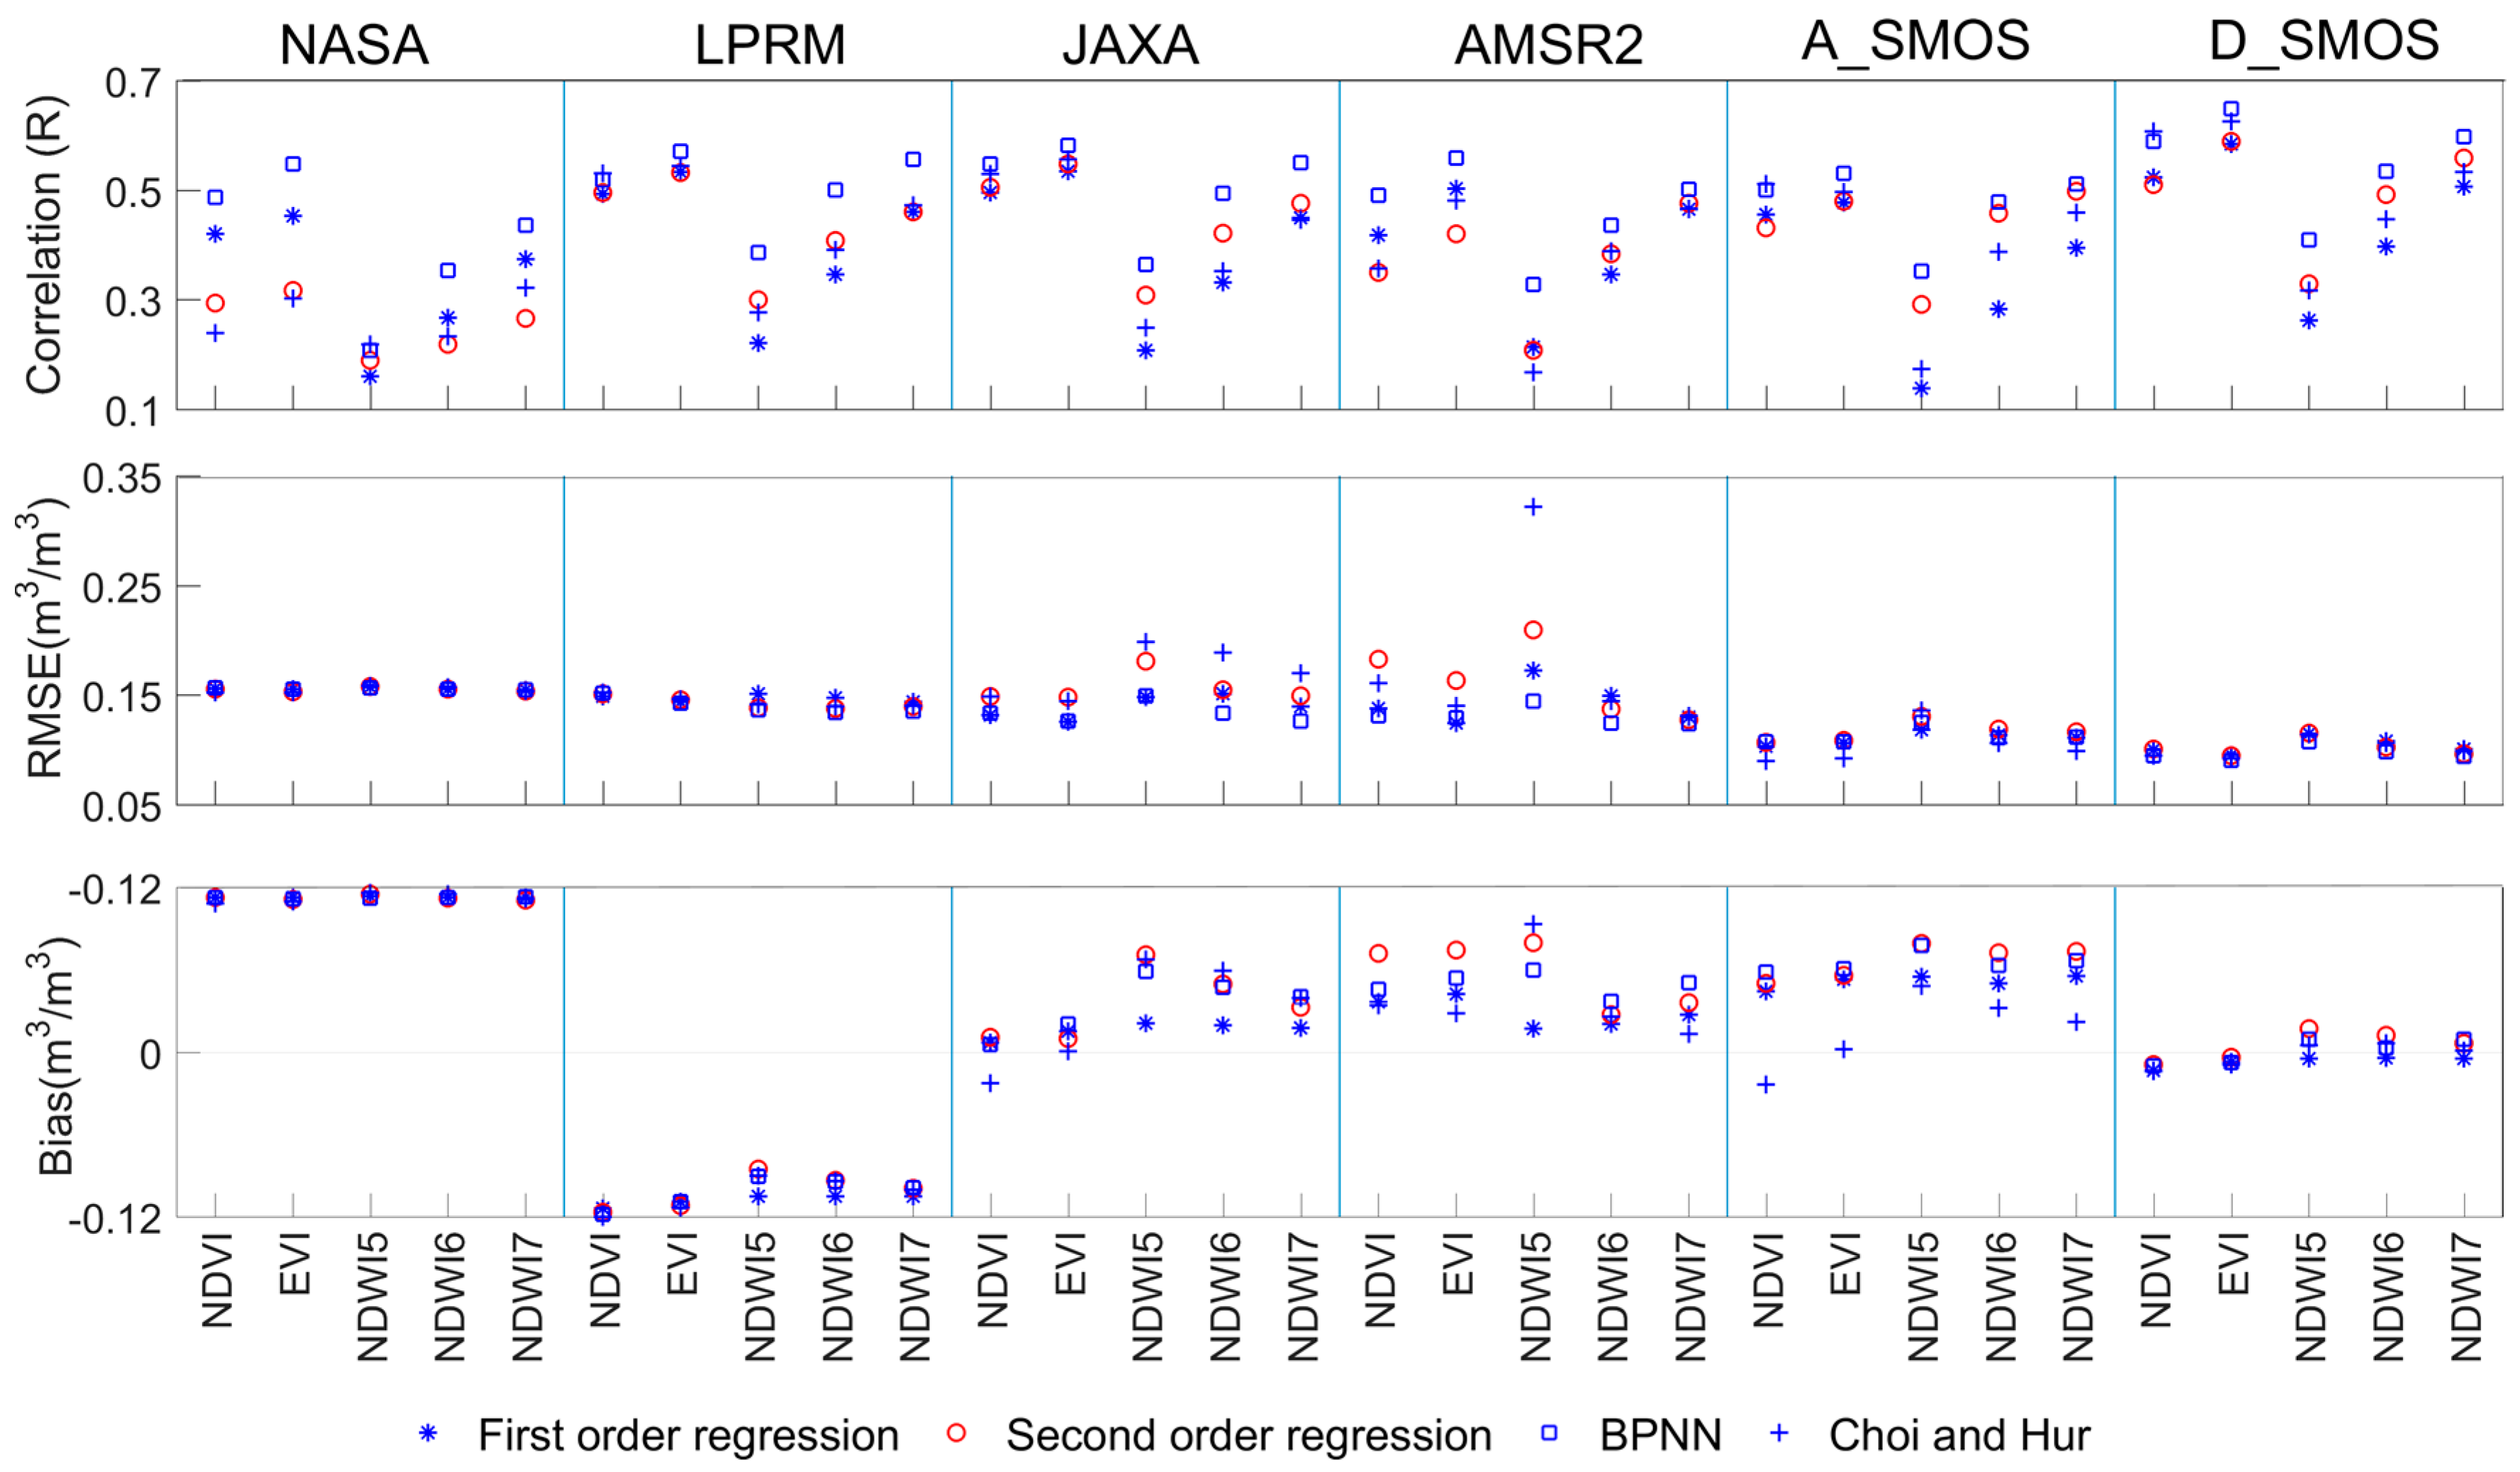
4.2. Evaluation of Downscaled SM Products at the MODIS Scale
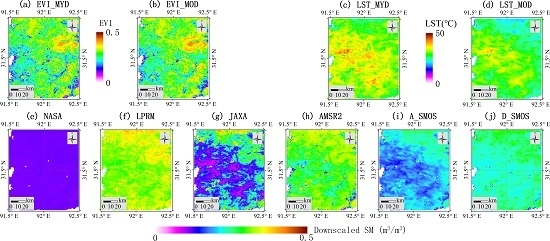
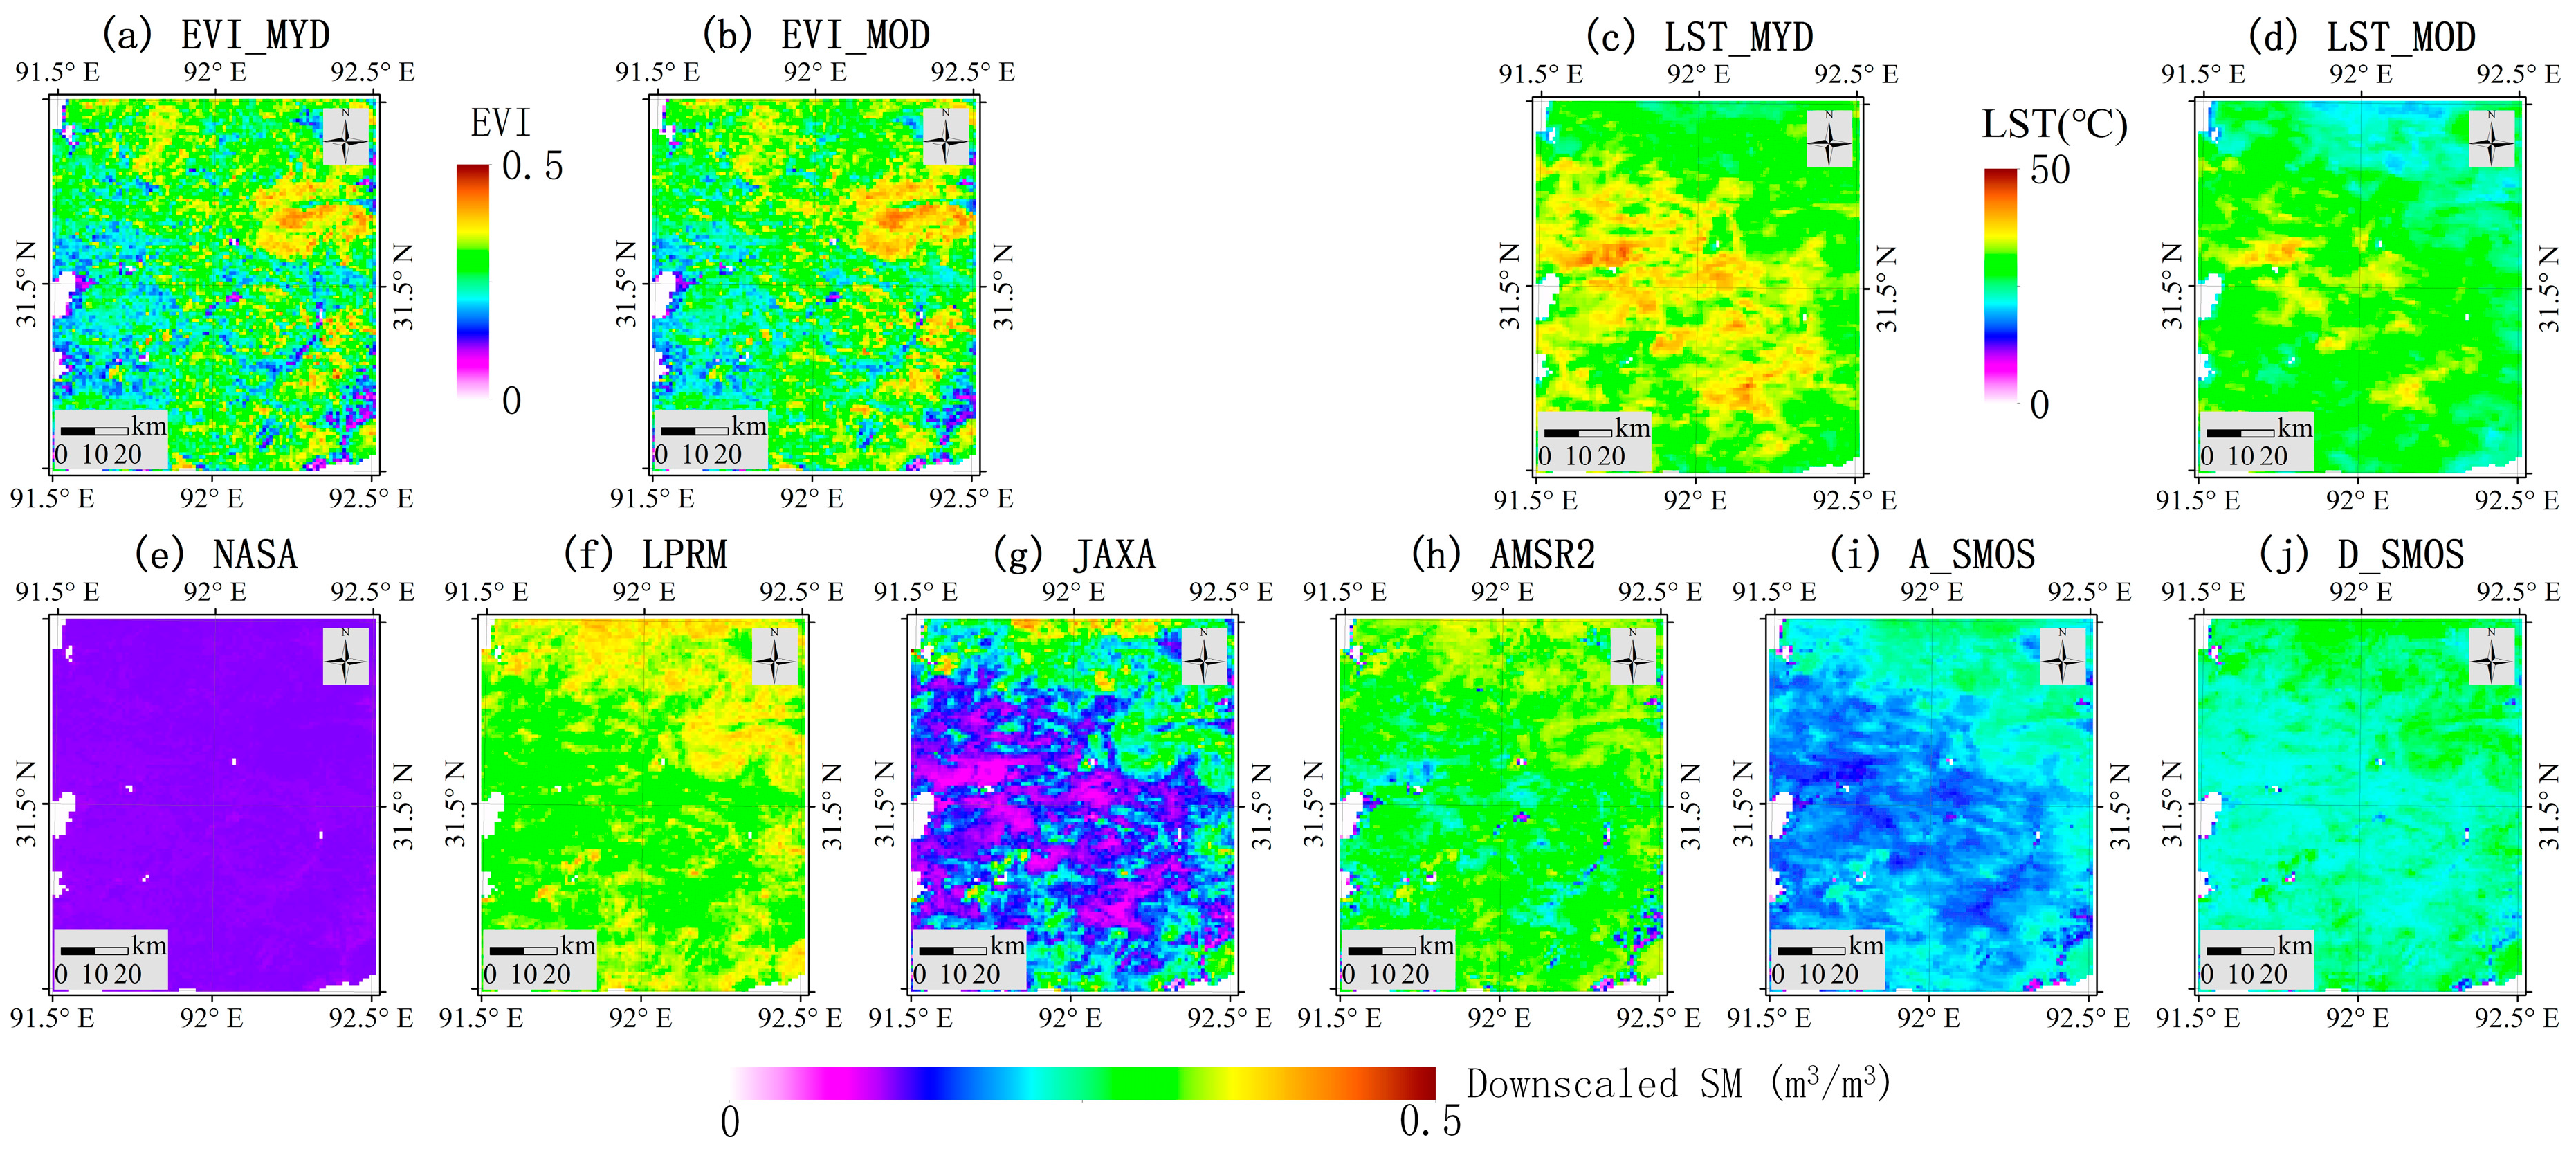
4.3. Spatial Maps of the BPNN-Downscaled SM Products by LST/EVI
4.4. Temporal Evaluation of the BPNN-Downscaled SM Products by LST/EVI at the SMTMN Scale
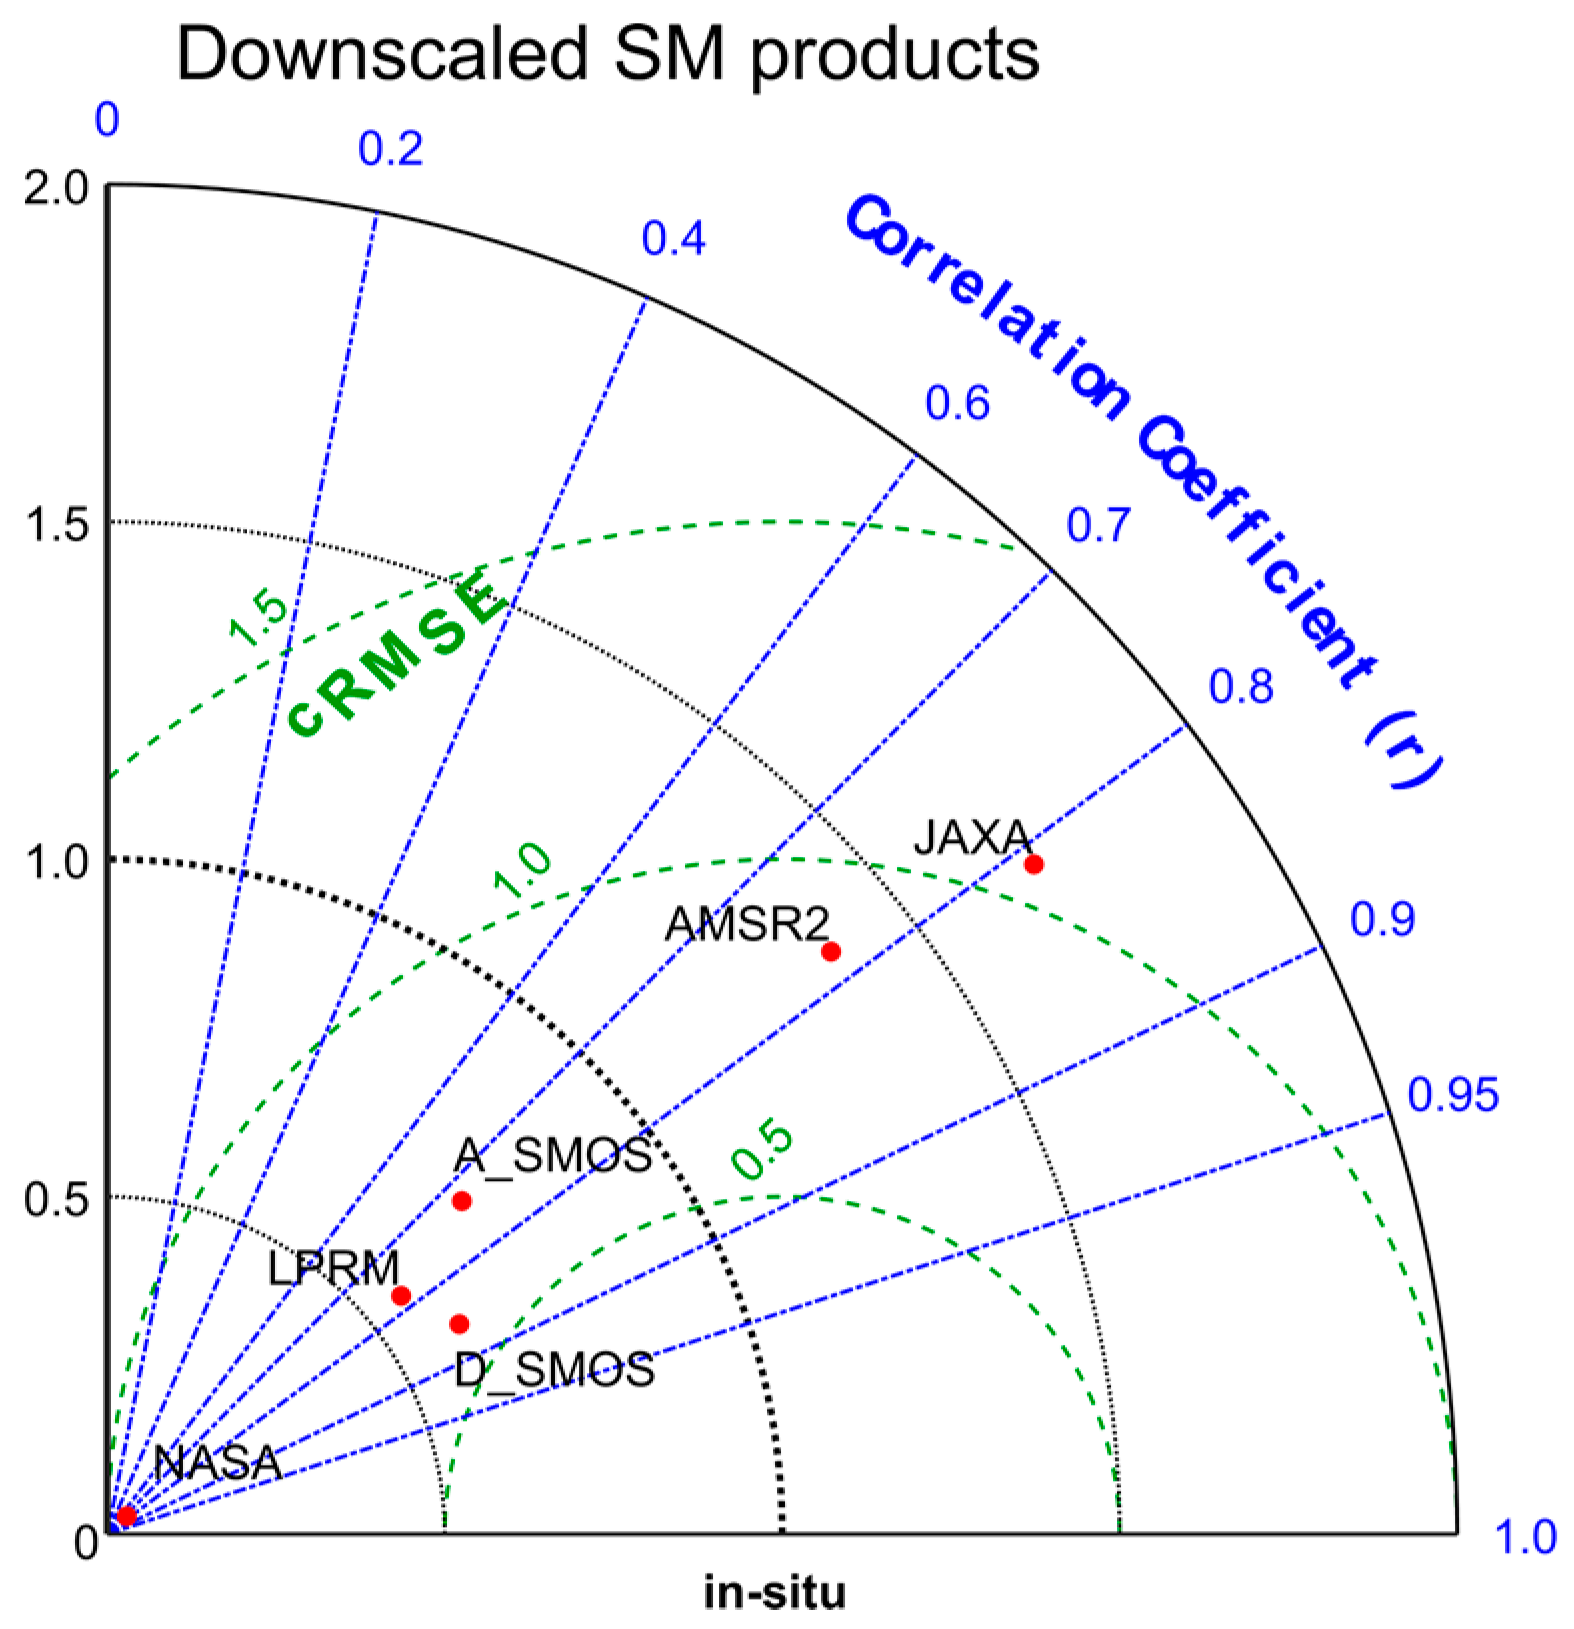
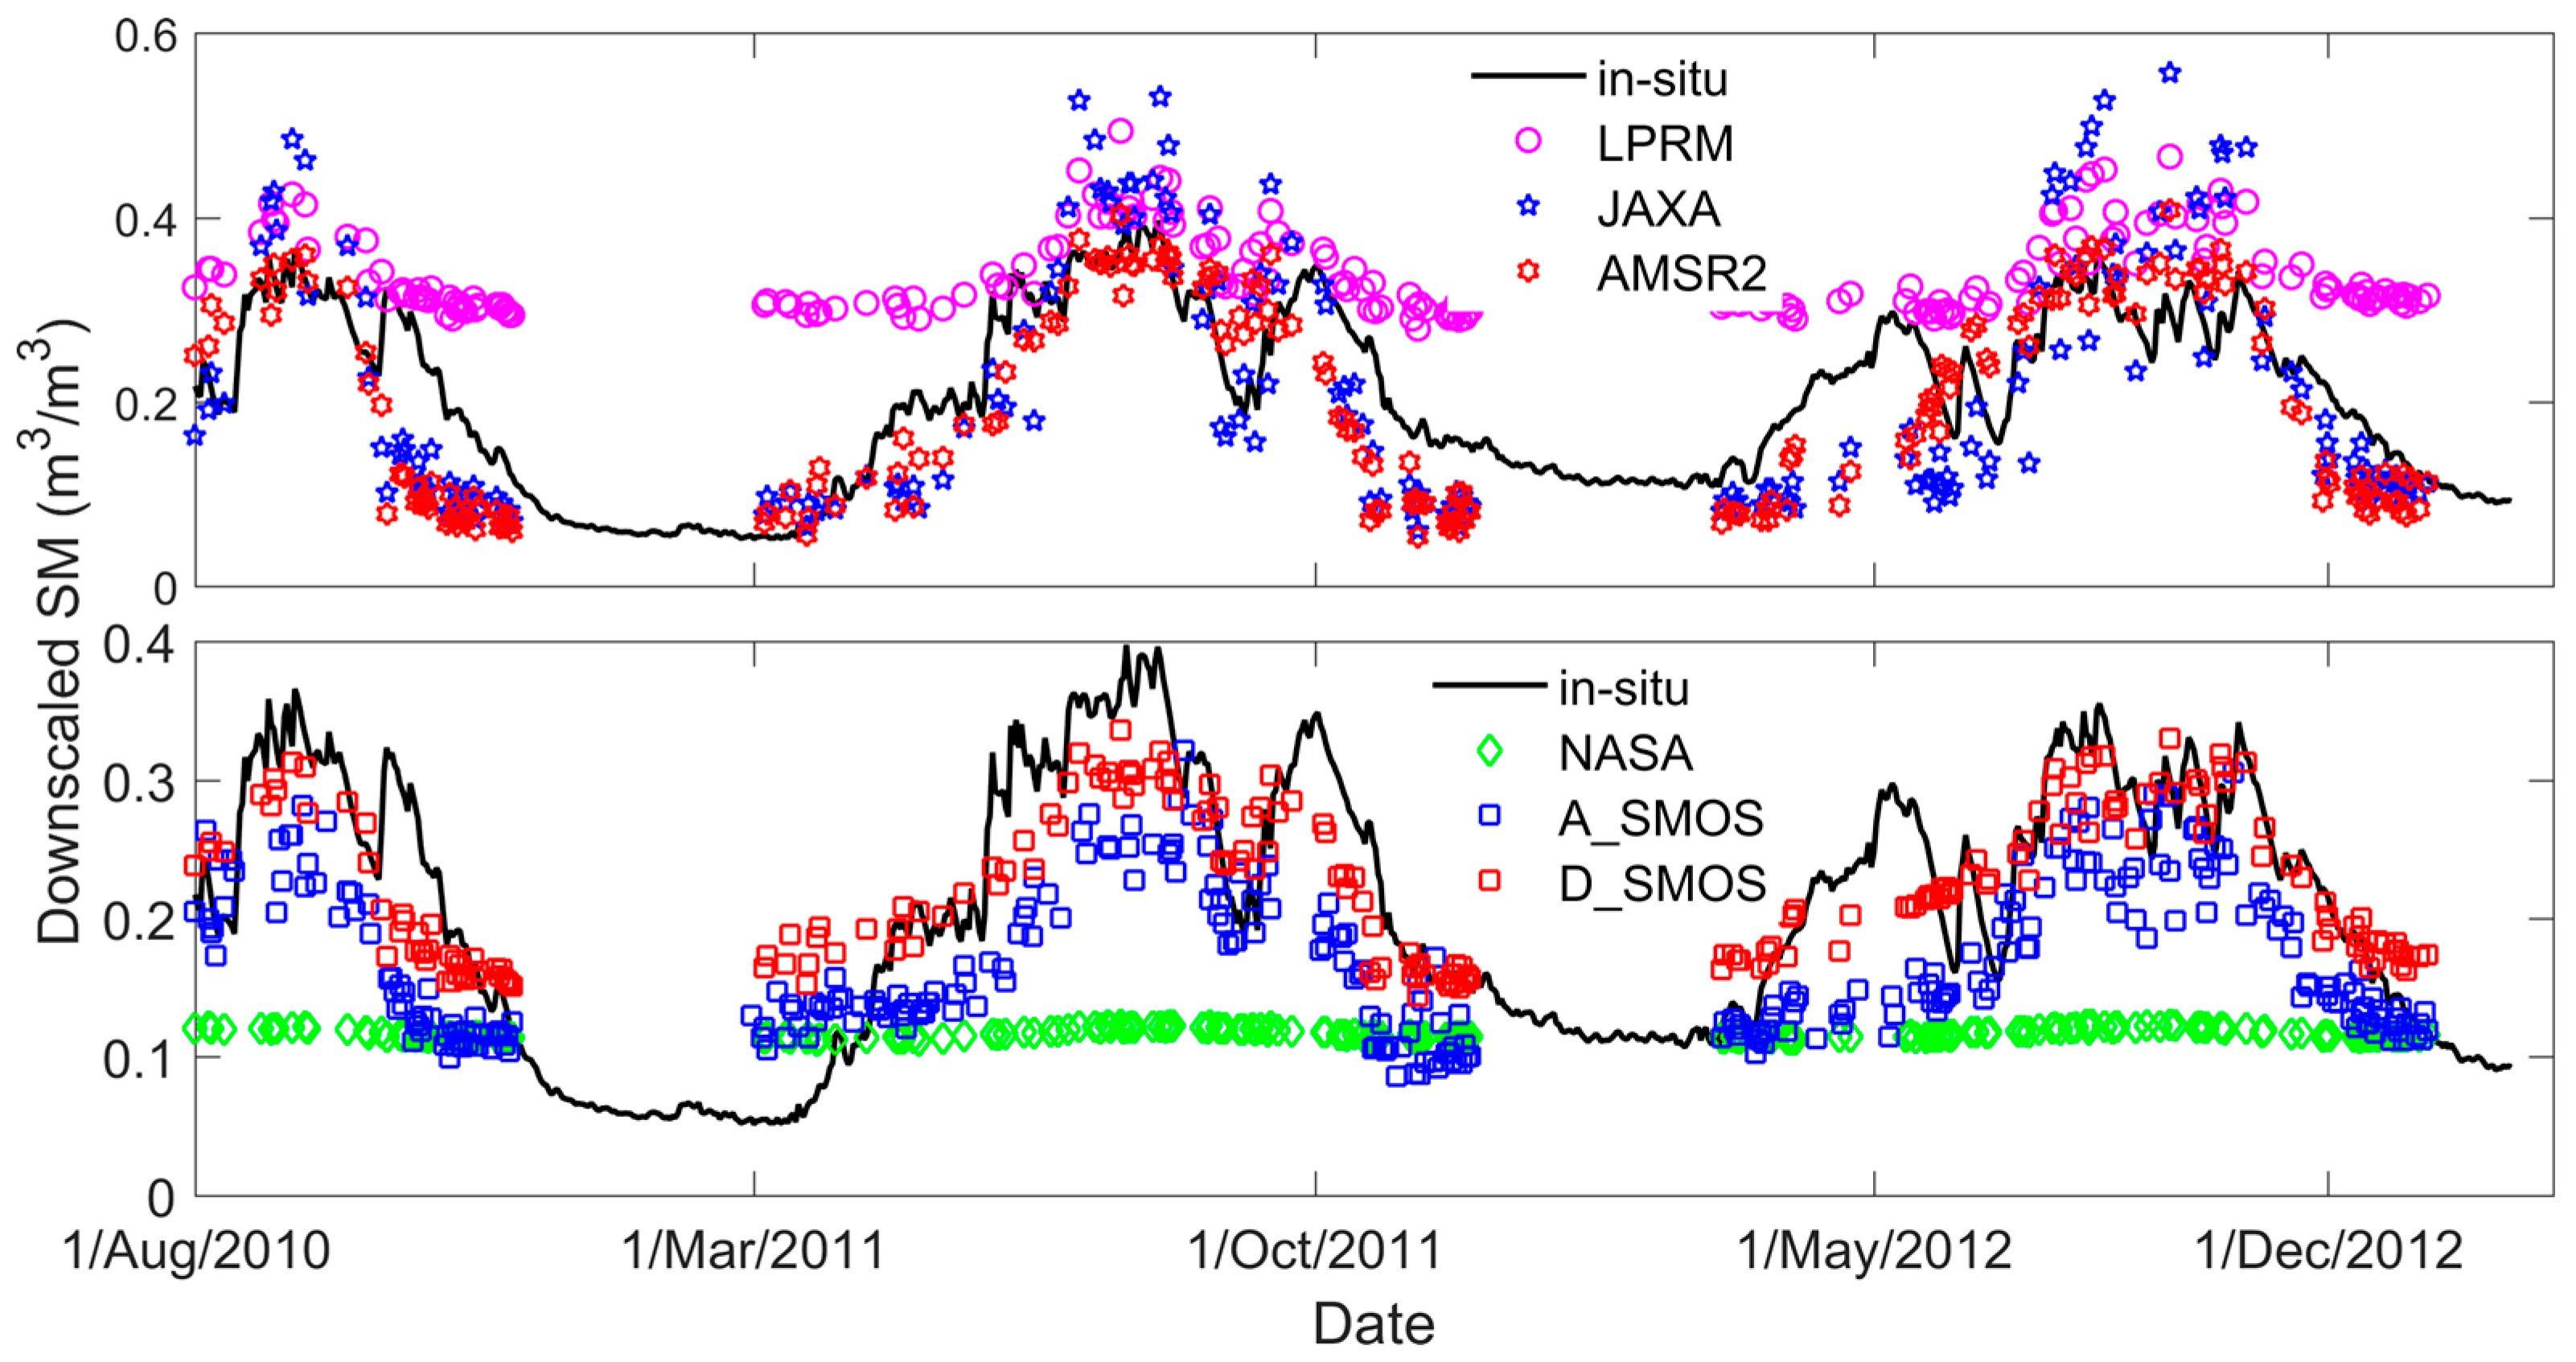
4.5. Comparison between the Microwave and Downscaled SM Products at the SMTMN Scale
5. Discussion
6. Conclusions
Acknowledgments
Author Contributions
Conflicts of Interest
References
- Das, N.N.; Entekhabi, D.; Njoku, E.G. An algorithm for merging SMAP radiometer and radar data for high-resolution soil-moisture retrieval. IEEE Trans. Geosci. Remote Sens. 2011, 49, 1504–1512. [Google Scholar] [CrossRef]
- Kim, S.; Liu, Y.Y.; Johnson, F.M.; Parinussa, R.M.; Sharma, A. A global comparison of alternate AMSR2 soil moisture products: Why do they differ? Remote Sens. Environ. 2015, 161, 43–62. [Google Scholar] [CrossRef]
- Al-Yaari, A.; Wigneron, J.P.; Ducharne, A.; Kerr, Y.; de Rosnay, P.; de Jeu, R.; Govind, A.; Al Bitar, A.; Albergel, C.; Muñoz-Sabater, J.; et al. Global-scale evaluation of two satellite-based passive microwave soil moisture datasets (SMOS and AMSR-E) with respect to land data assimilation system estimates. Remote Sens. Environ. 2014, 149, 181–195. [Google Scholar] [CrossRef]
- Piles, M.; Sanchez, N.; Vall-llossera, M.; Camps, A.; Martinez-Fernandez, J.; Martinez, J.; Gonzalez-Gambau, V. A downscaling approach for SMOS land observations: Evaluation of high-resolution soil moisture maps over the Iberian Peninsula. IEEE J. Sel. Top. Appl. Earth Obs. Remote Sens. 2014, 7, 3845–3857. [Google Scholar] [CrossRef]
- Chauhan, N.S.; Miller, S.; Ardanuy, P. Spaceborne soil moisture estimation at high resolution: A microwave-optical/IR synergistic approach. Int. J. Remote Sens. 2003, 24, 4599–4622. [Google Scholar] [CrossRef]
- Choi, M.; Hur, Y. A microwave-optical/infrared disaggregation for improving spatial representation of soil moisture using AMSR-E and MODIS products. Remote Sens. Environ. 2012, 124, 259–269. [Google Scholar] [CrossRef]
- Merlin, O.; Al Bitar, A.; Walker, J.P.; Kerr, Y. An improved algorithm for disaggregating microwave-derived soil moisture based on red, near-infrared and thermal-infrared data. Remote Sens. Environ. 2010, 114, 2305–2316. [Google Scholar] [CrossRef]
- Merlin, O.; Walker, J.P.; Chehbouni, A.; Kerr, Y. Towards deterministic downscaling of SMOS soil moisture using MODIS derived soil evaporative efficiency. Remote Sens. Environ. 2008, 112, 3935–3946. [Google Scholar] [CrossRef]
- Peng, J.; Loew, A.; Zhang, S.; Wang, J. Spatial downscaling of satellite soil moisture data using a vegetation temperature condition index. IEEE Trans. Geosci. Remote Sens. 2016, 54, 1–9. [Google Scholar] [CrossRef]
- Song, C.; Jia, L.; Menenti, M. Retrieving high-resolution surface soil moisture by downscaling AMSR-E brightness temperature using MODIS LST and NDVI data. IEEE J. Sel. Top. Appl. Earth Obs. Remote Sens. 2014, 7, 935–942. [Google Scholar] [CrossRef]
- Wang, J.; Ling, Z.; Wang, Y.; Zeng, H. Improving spatial representation of soil moisture by integration of microwave observations and the temperature–vegetation–drought index derived from MODIS products. ISPRS J. Photogramm. Remote Sens. 2016, 113, 144–154. [Google Scholar] [CrossRef]
- Chen, N.; He, Y.; Zhang, X. Nir-red spectra-based disaggregation of SMAP soil moisture to 250 m resolution based on smapex-4/5 in southeastern Australia. Remote Sens. 2017, 9. [Google Scholar] [CrossRef]
- Kim, J.; Hogue, T.S. Improving spatial soil moisture representation through integration of AMSR-E and MODIS products. IEEE Trans. Geosci. Remote Sens. 2012, 50, 446–460. [Google Scholar] [CrossRef]
- Liu, Y.Y.; Dorigo, W.A.; Parinussa, R.M.; de Jeu, R.A.M.; Wagner, W.; McCabe, M.F.; Evans, J.P.; van Dijk, A.I.J.M. Trend-preserving blending of passive and active microwave soil moisture retrievals. Remote Sens. Environ. 2012, 123, 280–297. [Google Scholar] [CrossRef]
- Tomer, S.; Al Bitar, A.; Sekhar, M.; Zribi, M.; Bandyopadhyay, S.; Kerr, Y. MAPSM: A spatio-temporal algorithm for merging soil moisture from active and passive microwave remote sensing. Remote Sens. 2016, 8. [Google Scholar] [CrossRef]
- Ranney, K.J.; Niemann, J.D.; Lehman, B.M.; Green, T.R.; Jones, A.S. A method to downscale soil moisture to fine resolutions using topographic, vegetation, and soil data. Adv. Water Resour. 2015, 76, 81–96. [Google Scholar] [CrossRef]
- Carlson, T.N.; Gillies, R.R.; Perry, E.M. A method to make use of thermal infrared temperature and NDVI measurements to infer surface soil water content and fractional vegetation cover. Remote Sens. Rev. 1994, 9, 161–173. [Google Scholar] [CrossRef]
- Ray, R.L.; Jacobs, J.M.; Cosh, M.H. Landslide susceptibility mapping using downscaled AMSR-E soil moisture: A case study from Cleveland corral, California, US. Remote Sens. Environ. 2010, 114, 2624–2636. [Google Scholar] [CrossRef]
- Sánchez-Ruiz, S.; Piles, M.; Sánchez, N.; Martínez-Fernández, J.; Vall-Llossera, M.; Camps, A. Combining SMOS with visible and near/shortwave/thermal infrared satellite data for high resolution soil moisture estimates. J. Hydrol. 2014, 516, 273–283. [Google Scholar] [CrossRef]
- Merlin, O.; Rudiger, C.; Al Bitar, A.; Richaume, P.; Walker, J.P.; Kerr, Y.H. Disaggregation of SMOS soil moisture in southeastern Australia. IEEE Trans. Geosci. Remote Sens. 2012, 50, 1556–1571. [Google Scholar] [CrossRef]
- Piles, M.; Petropoulos, G.P.; Sánchez, N.; González-Zamora, Á.; Ireland, G. Towards improved spatio-temporal resolution soil moisture retrievals from the synergy of SMOS and MSG SEVIRI spaceborne observations. Remote Sens. Environ. 2016, 180, 403–417. [Google Scholar] [CrossRef]
- Lei, F.; Crow, W.; Shen, H.; Parinussa, R.; Holmes, T. The impact of local acquisition time on the accuracy of microwave surface soil moisture retrievals over the contiguous United States. Remote Sens. 2015, 7, 13448–13465. [Google Scholar] [CrossRef]
- Zeng, J.; Li, Z.; Chen, Q.; Bi, H.; Qiu, J.; Zou, P. Evaluation of remotely sensed and reanalysis soil moisture products over the Tibetan plateau using in-situ observations. Remote Sens. Environ. 2015, 163, 91–110. [Google Scholar] [CrossRef]
- Zhao, W.; Li, A. A comparison study on empirical microwave soil moisture downscaling methods based on the integration of microwave-optical/IR data on the Tibetan plateau. Int. J. Remote Sens. 2015, 36, 4986–5002. [Google Scholar] [CrossRef]
- Qin, J.; Yang, K.; Lu, N.; Chen, Y.; Zhao, L.; Han, M. Spatial upscaling of in-situ soil moisture measurements based on MODIS-derived apparent thermal inertia. Remote Sens. Environ. 2013, 138, 1–9. [Google Scholar] [CrossRef]
- Zhao, L.; Yang, K.; Qin, J.; Chen, Y.; Tang, W.; Montzka, C.; Wu, H.; Lin, C.; Han, M.; Vereecken, H. Spatiotemporal analysis of soil moisture observations within a Tibetan mesoscale area and its implication to regional soil moisture measurements. J. Hydrol. 2013, 482, 92–104. [Google Scholar] [CrossRef]
- Zhao, L.; Yang, K.; Qin, J.; Chen, Y.; Tang, W.; Lu, H.; Yang, Z.-L. The scale-dependence of SMOS soil moisture accuracy and its improvement through land data assimilation in the central Tibetan plateau. Remote Sens. Environ. 2014, 152, 345–355. [Google Scholar] [CrossRef]
- Yang, K.; Qin, J.; Zhao, L.; Chen, Y.; Han, M. A multi-scale soil moisture and freeze-thaw monitoring network on the third pole. Bull. Am. Meteorol. Soc. 2013, 94, 1907–1916. [Google Scholar] [CrossRef]
- Jackson, T.J.; Cosh, M.H.; Bindlish, R.; Starks, P.J.; Bosch, D.D.; Seyfried, M.; Goodrich, D.C.; Moran, M.S.; Du, J. Validation of advanced microwave scanning radiometer soil moisture products. IEEE Trans. Geosci. Remote Sens. 2010, 48, 4256–4272. [Google Scholar] [CrossRef]
- Njoku, E.G.; Chan, S.K. Vegetation and surface roughness effects on AMSR-E land observations. Remote Sens. Environ. 2006, 100, 190–199. [Google Scholar] [CrossRef]
- Owe, M.; de Jeu, R.; Walker, J. A methodology for surface soil moisture and vegetation optical depth retrieval using the microwave polarization difference index. IEEE Trans. Geosci. Remote Sens. 2001, 39, 1643–1654. [Google Scholar] [CrossRef]
- Owe, M.; de Jeu, R.; Holmes, T. Multisensor historical climatology of satellite-derived global land surface moisture. J. Geophys. Res. 2008, 113. [Google Scholar] [CrossRef]
- Lu, H.; Koike, T.; Fujii, H.; Ohta, T.; Tamagawa, K. Development of a physically-based soil moisture retrieval algorithm for spaceborne passive microwave radiometers and its application to AMSR-E. J. Remote Sens. Soc. Jpn. 2009, 29, 253–262. [Google Scholar]
- Mai, M.R.; Zhang, B.; Li, X.F.; Hwang, P.A.; Zhang, J.A. Application of AMSR-E and AMSR2 low-frequency channel brightness temperature data for hurricane wind retrievals. IEEE Trans. Geosci. Remote Sens. 2016, 54, 4501–4512. [Google Scholar] [CrossRef]
- Kerr, Y.H.; Waldteufel, P.; Richaume, P.; Wigneron, J.P.; Ferrazzoli, P.; Mahmoodi, A.; Al Bitar, A.; Cabot, F.; Gruhier, C.; Juglea, S.E.; et al. The SMOS soil moisture retrieval algorithm. IEEE Trans. Geosci. Remote Sens. 2012, 50, 1384–1403. [Google Scholar] [CrossRef]
- Mo, T.; Choudhury, B.J.; Schmugge, T.J.; Wang, J.R.; Jackson, T.J. A model for microwave emission from vegetation-covered fields. J. Geophys. Res. Oceans Atmos. 1982, 87, 1229–1237. [Google Scholar] [CrossRef]
- Liang, S. Narrowband to broadband conversions of land surface albedo I: Algorithms. Remote Sens. Environ. 2001, 76, 213–238. [Google Scholar] [CrossRef]
- Carlson, T. An overview of the “triangle method” for estimating surface evapotranspiration and soil moisture from satellite imagery. Sensors 2007, 7, 1612–1629. [Google Scholar] [CrossRef]


| Filtering Criteria | |
|---|---|
| SM | SM > 0.7 m3/m3 was excluded; and SMOS SM pixels with a DQX of greater than 0.06 were also excluded |
| LST | LST < 0 was excluded |
| NDVI | NDVI < 0 was excluded as a negative NDVI indicates an invalid SM |
| NDWI | NDWI > 1 or NDWI < −1 were excluded as they are out of the valid range of the NDWI |
| Date | SM and MODIS products in frozen periods (1 December to 31 March next year) were excluded |
| Microwave Scale (Training) | MODIS Scale (Downscaling) | ||
|---|---|---|---|
| Training Dataset (80%) | Validation Dataset (20%) | MODIS Dataset | |
| NASA | 574 | 143 | 5499 |
| JAXA | 365 | 92 | 5499 |
| LPRM | 632 | 158 | 5499 |
| AMSR2 | 230 | 58 | 5499 |
| A_SMOS | 751 | 188 | 8010 |
| D_SMOS | 447 | 112 | 5434 |
| NASA | LPRM | JAXA | AMSR2 | A_SMOS | D_SMOS | ||
|---|---|---|---|---|---|---|---|
| First-order regression | NDVI | 0.420 | 0.493 | 0.495 | 0.418 | 0.455 | 0.523 |
| EVI | 0.453 | 0.533 | 0.535 | 0.502 | 0.477 | 0.584 | |
| NDWI5 | 0.161 | 0.221 | 0.208 | 0.214 | 0.138 | 0.262 | |
| NDWI6 | 0.267 | 0.347 | 0.331 | 0.346 | 0.283 | 0.397 | |
| NDWI7 | 0.374 | 0.460 | 0.449 | 0.465 | 0.394 | 0.507 | |
| Second-order regression | NDVI | 0.293 | 0.495 | 0.505 | 0.350 | 0.431 | 0.510 |
| EVI | 0.316 | 0.532 | 0.548 | 0.420 | 0.480 | 0.589 | |
| NDWI5 | 0.190 | 0.300 | 0.308 | 0.207 | 0.291 | 0.329 | |
| NDWI6 | 0.218 | 0.408 | 0.421 | 0.383 | 0.458 | 0.491 | |
| NDWI7 | 0.265 | 0.461 | 0.476 | 0.475 | 0.498 | 0.559 | |
| Choi and Hur | NDVI | 0.239 | 0.531 | 0.529 | 0.357 | 0.511 | 0.608 |
| EVI | 0.302 | 0.544 | 0.556 | 0.481 | 0.497 | 0.625 | |
| NDWI5 | 0.218 | 0.276 | 0.249 | 0.165 | 0.173 | 0.317 | |
| NDWI6 | 0.233 | 0.391 | 0.351 | 0.388 | 0.387 | 0.447 | |
| NDWI7 | 0.322 | 0.472 | 0.445 | 0.466 | 0.459 | 0.533 | |
| BPNN | NDVI | 0.487 | 0.519 | 0.548 | 0.490 | 0.500 | 0.589 |
| EVI | 0.547 | 0.571 | 0.582 | 0.558 | 0.531 | 0.649 | |
| NDWI5 | 0.208 | 0.386 | 0.365 | 0.328 | 0.352 | 0.409 | |
| NDWI6 | 0.354 | 0.500 | 0.494 | 0.436 | 0.479 | 0.534 | |
| NDWI7 | 0.436 | 0.556 | 0.550 | 0.501 | 0.512 | 0.597 | |
| NASA | LPRM | JAXA | AMSR2 | A_SMOS | D_SMOS | |
|---|---|---|---|---|---|---|
| r | 0.747 | 0.777 | 0.811 | 0.779 | 0.729 | 0.859 |
| RMSE | 0.134 | 0.124 | 0.087 | 0.076 | 0.074 | 0.052 |
| bias | 0.109 | −0.112 | 0.019 | 0.031 | 0.054 | −0.011 |
| number | 214 | 214 | 213 | 214 | 315 | 214 |
| Downscaled | Microwave | Number | |||||
|---|---|---|---|---|---|---|---|
| r | RMSE | bias | r | RMSE | bias | ||
| NASA | 0.742 | 0.150 | 0.122 | 0.614 | 0.138 | 0.114 | 84 |
| LPRM | 0.827 | 0.119 | −0.104 | 0.842 | 0.119 | −0.108 | 84 |
| JAXA | 0.851 | 0.081 | −0.023 | 0.877 | 0.118 | −0.012 | 70 |
| AMSR2 | 0.927 | 0.055 | 0.013 | 0.866 | 0.126 | 0.010 | 40 |
| A_SMOS | 0.635 | 0.081 | 0.064 | 0.556 | 0.091 | 0.053 | 106 |
| D_SMOS | 0.884 | 0.047 | −0.009 | 0.830 | 0.051 | −0.010 | 81 |
| Microwave Scale (Microwave SM) | MODIS Scale (In-Situ SM) | ||||||||
|---|---|---|---|---|---|---|---|---|---|
| NASA | LPRM | JAXA | AMSR2 | A_SMOS | D_SMOS | AMSR | A_SMOS | D_SMOS | |
| LST | −0.021 | 0.181 | 0.182 | 0.503 | 0.147 | 0.217 | 0.1115 | 0.0706 | 0.142 |
| NDVI | 0.116 | 0.560 | 0.648 | 0.591 | 0.375 | 0.389 | 0.482 | 0.442 | 0.526 |
| EVI | 0.144 | 0.619 | 0.699 | 0.627 | 0.495 | 0.426 | 0.540 | 0.475 | 0.591 |
| NDWI5 | 0.312 | 0.342 | 0.455 | 0.607 | 0.226 | 0.164 | 0.166 | 0.095 | 0.186 |
| NDWI6 | 0.336 | 0.536 | 0.656 | 0.657 | 0.268 | 0.319 | 0.316 | 0.243 | 0.351 |
| NDWI7 | 0.333 | 0.635 | 0.719 | 0.655 | 0.307 | 0.384 | 0.447 | 0.375 | 0.487 |
| Albedo | 0.013 | −0.118 | −0.080 | −0.298 | −0.131 | −0.131 | −0.073 | −0.095 | −0.068 |
| number | 717 | 790 | 457 | 288 | 939 | 559 | 5499 | 8010 | 5434 |
© 2017 by the authors. Licensee MDPI, Basel, Switzerland. This article is an open access article distributed under the terms and conditions of the Creative Commons Attribution (CC BY) license (http://creativecommons.org/licenses/by/4.0/).
Share and Cite
Jiang, H.; Shen, H.; Li, H.; Lei, F.; Gan, W.; Zhang, L. Evaluation of Multiple Downscaled Microwave Soil Moisture Products over the Central Tibetan Plateau. Remote Sens. 2017, 9, 402. https://doi.org/10.3390/rs9050402
Jiang H, Shen H, Li H, Lei F, Gan W, Zhang L. Evaluation of Multiple Downscaled Microwave Soil Moisture Products over the Central Tibetan Plateau. Remote Sensing. 2017; 9(5):402. https://doi.org/10.3390/rs9050402
Chicago/Turabian StyleJiang, Hongtao, Huanfeng Shen, Huifang Li, Fangni Lei, Wenxia Gan, and Liangpei Zhang. 2017. "Evaluation of Multiple Downscaled Microwave Soil Moisture Products over the Central Tibetan Plateau" Remote Sensing 9, no. 5: 402. https://doi.org/10.3390/rs9050402
APA StyleJiang, H., Shen, H., Li, H., Lei, F., Gan, W., & Zhang, L. (2017). Evaluation of Multiple Downscaled Microwave Soil Moisture Products over the Central Tibetan Plateau. Remote Sensing, 9(5), 402. https://doi.org/10.3390/rs9050402