Abstract
Satellite-derived soil moisture products have become an important data source for the study of land surface processes and related applications. For satellites with sun-synchronous orbits, these products are typically derived separately for ascending and descending overpasses with different local acquisition times. Moreover, diurnal variations in land surface conditions, and the extent to which they are accurately characterized in retrieval algorithms, lead to distinct systematic and random error characteristics in ascending versus descending soil moisture products. Here, we apply two independent evaluation techniques (triple collocation and direct comparison against sparse ground-based observations) to quantify (correlation-based) accuracy differences in satellite-derived surface soil moisture acquired at different local acquisition times. The orbits from different satellites are separated into two overpass categories: AM (12:00 a.m. to 11:59 a.m. Local Solar Time) and PM (12:00 p.m. to 11:59 p.m. Local Solar Time). Results demonstrate how patterns in the accuracy of AM versus PM retrieval products obtained from a variety of active and passive microwave satellite sensors vary according to land cover and across satellite products with different local acquisition times.
1. Introduction
Soil moisture is a key state variable in land and atmosphere interactions and plays a critical role in determining the partitioning of precipitation and incoming radiation at the earth’s land surface. An improved observational understanding of soil moisture will therefore contribute to better forecasting of meteorological, hydrological, and agricultural hazards [1]. The increasing scientific recognition and urgent application demand for accurate soil moisture characterization have inspired recent developments towards global surface soil moisture measurement from active and passive microwave satellites.
The Advanced Microwave Scanning Radiometer—Earth Observing System (AMSR-E) was the first passive microwave satellite program to routinely provide global surface soil moisture products [2]. It had a local equator overpass time at 1:30 a.m. (descending) and 1:30 p.m. (ascending) and was in operation from June 2002 to October 2011. Likewise, the active microwave Advanced Scatterometer (ASCAT) was launched in October 2006 and remains in operation. It crosses the equator at 9:30 a.m. and 9:30 p.m. local time for descending and ascending overpasses, respectively, and is being used to derive an operational soil moisture index product [3]. The Soil Moisture and Ocean Salinity (SMOS) was designed and launched in 2009 to measure global soil moisture at 0–5 cm depth with an ascending orbit at 6:00 a.m. and corresponding descending orbit at 6:00 p.m. local equator overpass time [4]. More recently, the Soil Moisture Active Passive (SMAP) mission was launched in January 2015 and has recently started providing radiometer measurements for global soil moisture retrievals at a 36-km spatial resolution [5]. SMAP has a local equatorial crossing time of 6:00 a.m. for its descending orbit and 6:00 p.m. for its ascending orbit. All time stamps are local equator overpass times unless explicitly specified otherwise.
Clear theoretical evidence exists that isothermal conditions found at the near-surface during nighttime (or early morning) aid in the retrieval of surface soil moisture from passive microwave radiometer radiations by limiting temperature-related errors in microwave emission modeling [6]. In addition, errors associated with the impact of Faraday rotations are expected to be minimized during the night [7]. As a result, the application of datasets from passive-based missions has generally focused on the (ascending) 6:00 a.m. overpass for SMOS and the (descending) 1:30 a.m. overpass for AMSR-E. However, other factors exist that may impact the role of acquisition time on soil moisture retrievals accuracy. For example, Aksoy and Johnson [8] found that 6:00 a.m. SMOS observations are prone to radio frequency interference (RFI) contamination over the United States and Northern Canada. Differences in the magnitude of RFI interference levels between ascending and descending overpasses can influence the relative accuracy of corresponding soil moisture retrievals [9]. Likewise, diurnally-varying water within the vegetation canopy will attenuate soil microwave emission, while adding its own emission [10,11]. In particular, during daylight hours, the vegetation canopy loses water through evapotranspiration and becomes relatively more transparent at microwave wavelengths [11,12]. Taken together, these factors imply that some advantages may be associated with afternoon and early-evening retrievals. In fact, several in situ validation studies have already demonstrated that, in certain cases, soil moisture retrievals derived from the 1:30 p.m. AMSR-E overpass are relatively superior to their 1:30 a.m. equivalents [6,13].
An improved characterization of the impact of local acquisition times on soil moisture retrievals accuracy would facilitate not only the optimal blending of global soil moisture observations from both overpasses and multi-satellites, but also aid in future satellite mission design and the parameterization of observation error variances for land data assimilation systems. Moreover, the integrated use of both ascending and descending observations is of potential value for specific applications such as diurnal temperature cycle analysis and agricultural crop yield estimation.
The recent development of large-scale evaluation techniques for surface soil moisture provides a new opportunity to evaluate the relative accuracy of AM (12:00 a.m. to 11:59 a.m. Local Solar Time) versus PM (12:00 p.m. to 11:59 p.m. Local Solar Time) soil moisture retrievals using a top-down empirical approach. Here, we examine the impact of local acquisition times and physical (isothermal) conditions in each individual retrieval algorithm on the correlation-based accuracy of satellite-derived surface soil moisture products retrieved from the application of: (1) the Land Parameter Retrieval Model (LPRM) to AMSR-E, (2) the L-Band Microwave Emission of the Biosphere (L-MEB) algorithm to SMOS, and (3) the TU-Wien change detection algorithm to ASCAT. Two different evaluation techniques are applied: triple collocation analysis [14] and direct comparison against ground-based observations acquired at sparse networks within the contiguous United States (CONUS). Unlike past research, our focus will not be on the comparison of absolute accuracy between sensors. Instead, our goal is an improved understanding of differences in the accuracy of retrievals derived from AM versus PM overpasses and how such differences vary as a function of land cover characteristics.
2. Datasets
Multiple satellite-based surface soil moisture products were assessed in this study, including passive and active microwave retrievals. Model-based soil moisture simulations, ground-based surface soil moisture records, and land cover products provided supportive information for these assessments.
2.1. Satellite-Based Surface Soil Moisture Retrievals
A nine-and-a-half year long passive microwave soil moisture dataset was derived from the AMSR-E sensor aboard the NASA EOS Aqua satellite. AMSR-E products are available from the launch of the AQUA satellite in mid-June 2002 to its failure in October 2011. With a local equator overpass time at 1:30 a.m. (descending)/1:30 p.m. (ascending), the AMSR-E sensor provided nearly daily global coverage measurements at almost 40-km horizontal resolution. Brightness temperatures measured at dual-polarized C-band (6.9 GHz) frequency allowed for the retrieval of surface soil moisture and vegetation optical depth (VOD) using the physically-based Land Parameter Retrieval Model (LPRM; [15]). In areas with significant RFI such as CONUS, Japan, and India, the method switched to the X-band channel (10.7 GHz). Here, the LPRM soil moisture products were separately processed for ascending and descending orbits and re-sampled from their original resolution onto a 0.25° regular grid. Note that LPRM is one of several alternative soil moisture retrieval schemes designed for AMSR-E data. It is chosen for this study because it is relatively well-validated with in situ campaigns [16] and has been used in earlier triple collocation studies [17,18].
The SMOS satellite was launched in November 2009 and is operated by the European Space Agency (ESA) to measure global surface soil moisture at L-band (1.4 GHz) with a 3-day revisit at the equator and ascending/descending overpasses at 6:00 a.m/6:00 p.m. [4]. The SMOS mission aims at monitoring surface soil moisture at a depth of about 3 to 5 cm with 30–50 km spatial resolution. A radiative transfer forward model called L-Band microwave emission of the biosphere (L-MEB) is applied to mimic observed brightness temperatures and soil moisture values are retrieved via minimizing a cost function [19]. Daily global maps of the SMOS level 3 surface soil moisture product produced by the Centre Aval de Traitement des Données (CATDS) were used in the study. Likewise, the ascending and descending orbits were processed separately and re-sampled from the Equal-Area Scalable Earth Grid (EASE-Grid) to a regular 0.25° grid using a nearest-neighbor sampling.
The ASCAT sensor onboard the ESA MetOp satellite is a real-aperture radar instrument operating at C-band (5.255 GHz), which was launched in October 2006. ASCAT has an equatorial local overpass time at 9:30 a.m./9:30 p.m. for descending and ascending orbits, respectively. Backscatter measurements are derived to generate surface soil moisture indices using the empirical TU-Wien soil moisture change detection algorithm (TU-Wien; [3]) with a spatial resolution of 25 km since January 2007. This dataset was also part of earlier triple collocation studies [17,20]. Ascending and descending overpasses were separately processed and, when combined, provide a near-daily soil moisture record at the equator.
Passive microwave soil moisture retrievals (AMSR-E and SMOS) are quantified in units of volumetric soil water content (m3/m3), while ASCAT soil moisture product is generated in degree of saturation (%) units. All satellite products were collected from 1 January 2007 to 31 December 2014, except for SMOS data, which started in January 2010 and AMSR-E data, which ended in October 2011.
2.2. Model-Based Surface Soil Moisture Estimates
The second phase of the North American Land Data Assimilation System (NLDAS-2) project is an integrated offline (uncoupled to the atmosphere) data assimilation system featuring four land surface models (LSMs) driven by observed and reanalysis-based atmospheric forcing data. The NLDAS-2 product spans over 30 years from January 1979 to present and provides model estimates of soil moisture (among many other variables) at a 1/8° spatial resolution over CONUS, southern Canada, and northern Mexico. A detailed description of the NLDAS-2 system can be found in [21].
In this study, the model-based surface soil moisture was extracted from the Noah LSM (Version 2.8), which has been well-evaluated [22] and applied in earlier triple collocation applications [17,23]. The Noah LSM is a one-dimensional soil-atmosphere-vegetation transfer model that simulates soil water and energy processes and their impact on the water/energy balance at the land surface interface. Noah soil profiles were spatially uniformly divided into four layers with depths of 10, 30, 60, and 100 cm. Surface soil moisture values were extracted from the top (0–10 cm) layer and converted from kg/m2 into volumetric water content (m3/m3) by dividing the soil layer thickness under the assumption that the density of water in the soil is 103 kg/m3. Hourly Noah LSM based surface soil moisture data were further aggregated into 0.25° grids from January 2007 to December 2014.
2.3. Ground-Based Surface Soil Moisture Observations
The Soil Climate Analysis Network (SCAN; [24]) is designed and managed by the U.S. Department of Agriculture (USDA) Natural Resources Conservation Service (NRCS) to provide comprehensive and nationwide soil moisture and climate information for natural resource assessments and conservation. Currently, SCAN comprises over 200 stations in U.S. and hourly observations of meteorological and hydrological variables such as precipitation, air temperature, wind speed, relative humidity, soil moisture and soil temperature are routinely collected within SCAN stations. Specifically, soil moisture and soil temperature are measured at depths of 5, 10, 20, 50, and 100 cm, and dielectric constants measured by dielectric probes are converted to volumetric soil moisture in m3/m3. The SCAN soil moisture data have been widely-applied to validate remotely-sensed and modeled soil moisture products [25].
The U.S. Climate Reference Network (USCRN; [26]) is a systematic climate observing network developed by the National Oceanic and Atmospheric Administration’s (NOAA) National Centers for Environmental Information with stations across the CONUS, Alaska, and Hawaii. It provides high-quality, long-term climate-related variables such as temperature, precipitation, and soil moisture and soil temperature observations. USCRN stations are equipped with three soil probes located around the base measuring soil moisture in a vertical profile at depths of 5, 10, 20, 50, and 100 cm. Soil dielectric measurements are sampled every 5 min at the 5-cm depth and hourly at the other four depths. Dielectric measurements are then converted to volumetric soil water content (m3/m3).
Hourly soil moisture observations at the 5 cm depth for both SCAN and USCRN were binned for the comparison of satellite ascending and descending retrievals. Within the combined SCAN/USCRN networks there are 270 sites (158 SCAN and 112 USCRN) with daily coverage from January 2007 to December 2014. In order to be included in the analysis, each site had to provide at least 80 daily observations during this time period.
2.4. Pre-Processing
LPRM AMSR-E surface soil moisture retrievals were masked when the simultaneously retrieved values of vegetation optical depth (VOD) exceeded 0.8—a level at which the soil moisture signal becomes substantially masked by the overlying vegetation [27]. Furthermore, masking was also applied in the rare cases that both the C- and X-band frequencies were deemed suspicious due to the RFI contamination—as identified by Li et al. [28]. SMOS L3 soil moisture products also provide a Data Quality Index (DQX) and RFI probability metric describing soil moisture retrieval error and observational conditions. SMOS retrievals were masked if one of the following criteria was satisfied: (a) DQX is larger than a predefined threshold (0.06); (b) DQX is the filled value; or (c) RFI probability is larger than 0.3 [20]. Three additional data fields are associated with the ASCAT product, of which the noise estimates of the soil moisture indices come from an error propagation scheme for the retrieval algorithm [3]. The ASCAT data were masked out if the surface states were frozen or if processing flags were detected as suspicious.
2.5. Normalized Difference Vegetation Index Product
The Moderate Resolution Imaging Spectroradiometer (MODIS) monthly Normalized Difference Vegetation Index (NDVI; MOD13C2) product [29] was obtained from January 2007 to December 2014 for evaluating soil moisture retrievals. To be consistent with satellite-derived soil moisture retrievals, this product was spatially-aggregated from its native 0.05° resolution to regular 0.25° grids. Monthly NDVI datasets were averaged over the whole study period (Figure 1a) or just the core-summer months (June, July, and August; Figure 1b) to represent the mean-annual or mean-summer NDVI distribution within CONUS, respectively.
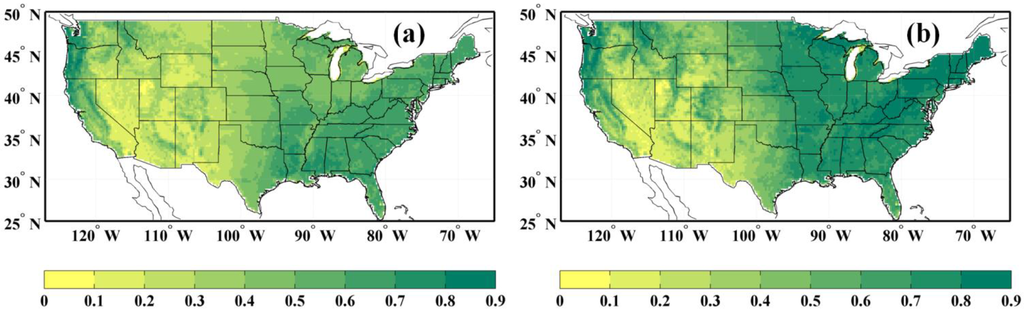
Figure 1.
Mean Moderate Resolution Imaging Spectroradiometer (MODIS) Normalized Difference Vegetation Index (NDVI) product averaged over: (a) the entire study temporal period and (b) core summer months only (June, July, and August).
3. Methodology
In data assimilation applications, the surface soil moisture anomalies are of the most interest compared to the raw time series, especially when systematic bias exists between satellite retrievals and LSM simulations [30]. Systematic biases are typically removed before data assimilation by matching observations to a reference dataset climatology [31]. Therefore, prior to the assessment of satellite surface soil moisture retrievals, all datasets including remotely-sensed retrievals, modeled estimates, and gauge records were decomposed into their seasonal climatology and seasonal anomaly components. The seasonal climatology was calculated for each day-of-year by moving window averaging of multi-year data within a 31-days window centered on that day-of-year [32]. Anomalies were then calculated by subtracting this seasonal climatology from the original dataset. The resulting soil moisture anomaly time series were evaluated by estimating their correlation-based accuracy using both triple collocation and direct comparison against sparse ground-based observations.
3.1. Triple Collocation
Triple collocation (TC) was developed by Stoffelen [33] to estimate the unknown root mean square errors (RMSEs) of three or more linearly-related measurements over the same geophysical variable with mutually independent errors. Scipal et al. [34] introduced this approach to estimate the error variances of large-scale soil moisture datasets obtained from multiple sources. Currently, TC has already been widely-explored to validate soil moisture datasets from different sources, such as thermal, passive and active microwave satellites, and reanalysis products [17,18,20,23,32,35,36]. The basic assumption is that collocated measurements are related to the underlying true state via an affine error model:
where refers to different surface soil moisture (SSM) measurements from, for instance, satellite-retrieved product (), model-based estimation (), and ground-based probe observations (). Constants and represent calibration constants and denotes random errors in the measurement system. The soil moisture RMSEs can then be derived based on the assumption that errors in the measurement triplet are mutually independent of each other and the truth . Though penetration depths vary among different soil moisture retrieval products, the representation difference would have only marginal impact on the TC-based correlation coefficient [18]. Moreover, the impact of various penetration depths can be further weakened with a seasonal climatology anomaly-based analysis of AM versus PM differences.
Here, we apply the extended version of TC method to derive correlation coefficients (RTC) of the soil moisture measurement versus [14]. Extended TC is based on the same assumptions as the classical TC method and estimates the correlation coefficient between and the measurement system as:
where , , and can be any triplet of soil moisture measurement systems satisfying TC assumptions, and is the sampled covariance between two estimates. In practice, the sign of is always assumed to be positive.
In this study, we constructed triplets based on soil moisture products derived from: passive microwave remote sensing (i.e., SMOS and AMSR-E), active microwave remote sensing (i.e., ASCAT) and the Noah land surface model. Since the physical basis of active microwave retrievals is different from that of passive microwave retrievals, the ASCAT soil moisture product was assumed to have independent error relative to (passive-based) AMSR-E and SMOS retrievals. Likewise, model-based surface soil moisture estimates suffer from a unique combination of imperfect physical process characterization, parameter and meteorological forcing uncertainties. Therefore, errors in all soil moisture triplets were assumed to be mutually-independent.
Given the temporal availability of three collocated datasets, the AMSR-E, ASCAT and Noah (AAN) soil moisture triplet is available between 1 January 2007 and 4 October 2011, and the SMOS, ASCAT and Noah (SAN) triplet is available between 1 January 2010 and 31 December 2014. To reduce unintended noise introduced by different acquisition times when calculating RTC, passive microwave overpasses were matched up with active microwave overpasses under a criterion of minimal temporal differences. That is, the Noah LSM soil moisture data were binned at the middle time of two overpasses (i.e., 11:00 a.m./11:00 p.m. for the AAN triplet and 8:00 a.m./8:00 p.m. for the SAN triplet). Grids with less than 100 collocated soil moisture observations/simulations were eliminated to avoid sample impoverishment.
3.2. Direct Comparison
According to Yilmaz and Crow [37], the two key TC assumptions of error orthogonality and zero error cross correlation may not hold for typical surface soil moisture products and the implicit circumvention of error cross correlation and non-orthogonality can cause TC to underestimate actual error magnitudes. Therefore it is worthwhile to verify TC results against another independent evaluation strategy. To this end, Pearson’s correlation coefficients based on the direct comparison (RDC) between satellite-derived soil moisture retrievals and ground-based observations were also computed to further characterize the effects of different acquisition times:
where is the total number of collocated observations and the overbar represents temporal averaging. Hourly ground-based measurements were temporally matched with different satellite overpass times. Sampled estimates of derived from Equation (3) will systematically underestimate due to the inability of sparse ground-based observations to accurately characterize soil moisture within a 0.25° grid [38]. However, our focus here is the difference between derived from AM versus PM satellite retrievals. The implicit assumption being that, based on the relative low magnitude of diurnal soil moisture variability, spatial representativeness errors in ground-based soil moisture observations will impact AM and PM retrievals equally and therefore have only a secondary impact on the difference between values of Equation (3) sampled from ascending versus descending retrievals.
For direct comparison against ground-based measurements, satellite-derived soil moisture data were extracted from the 0.25° spatial grid containing each individual ground measurement location. Relatively rare cases (<15 in total) where multiple SCAN/USCRN sites are collocated within the same 0.25° grid were addressed by averaging all stations to generate a single grid-scale average for comparison with modeling and remote sensing products. To emphasize the statistical significance of correlation-based metrics, the standard deviations of and were calculated via a bootstrapping approach [39] with 1000 separate bootstrap replicates randomly sampled from the original soil moisture time series with replacement.
4. Results
As noted above, our focus here is not on the absolute accuracy of each soil moisture product but rather the relative performance differences between the AM versus PM retrievals for each product. As a result, the two separate validation exercises described above—triple collocation (TC) and direct comparison (DC) against sparse ground-based observations—were applied to retrievals based on AM and PM overpasses separately. We then calculated the AM minus PM differences between these validation results (hereinafter, [AM−PM]) for all three satellite soil moisture products (AMSR-E LPRM, SMOS L-MEB and ASCAT TU-Wien).
4.1. Spatial Variation of Performance Differences
Figure 2 shows the spatial variability of correlation-based accuracy differences RTC[AM−PM] (first column) and RDC[AM−PM] (second column) for all three satellite products: AMSR-E (first row), SMOS (second row), and ASCAT (third row).
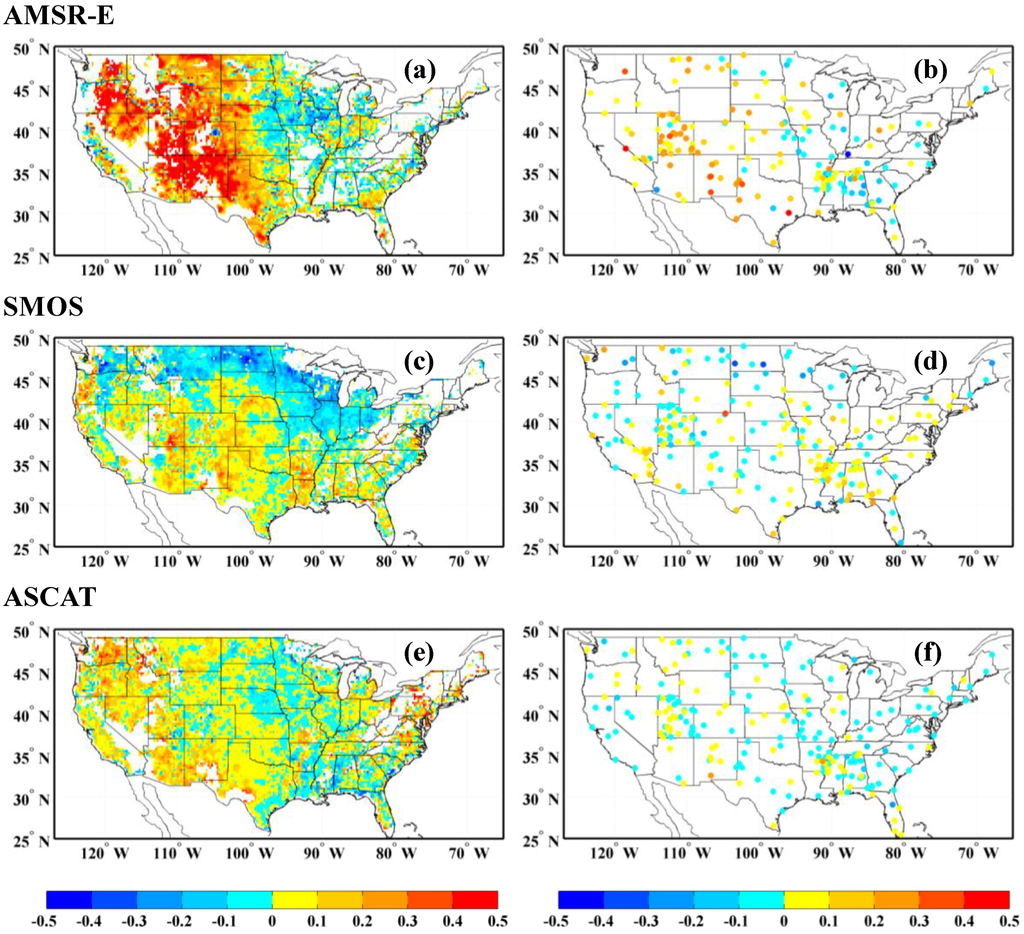
Figure 2.
(a–f) The all-year spatial distribution maps of AM (12:00 a.m. to 11:59 a.m.) minus PM (12:00 p.m. to 11:59 p.m.) differences of two correlation-based evaluation strategies for Advanced Microwave Scanning Radiometer—Earth Observing System (AMSR-E; first row), Soil Moisture and Ocean Salinity (SMOS; second row), and Advanced Scatterometer (ASCAT; third row)—namely, triple collocation (first column) and direct comparison against ground-based measurements (second column).
Triple collocation results demonstrate that the AMSR-E 1:30 a.m. overpass significantly outperforms the 1:30 p.m. overpass over the western part of CONUS (Figure 2a). This suggests that the 1:30 a.m. retrievals are generally more accurate in relatively sparsely-vegetated regions as shown in Figure 1a. This phenomenon is consistent with the expectation for more uniform surface temperature and soil moisture vertical profiles at the 1:30 a.m. overpass time, and the benefit of this homogeneity for the application of the LPRM soil moisture retrieval algorithm to measurements acquired at AMSR-E C- and X-band frequencies. However, the relative advantage of the AM retrievals degrades over more heavily-vegetated areas. For example, note that PM-based AMSR-E retrievals become marginally superior to the AM overpass within more heavily-vegetated areas of northeastern CONUS.
In addition to these TC-based evaluations, satellite retrievals are also directly compared to ground-based soil moisture measurements. AMSR-E RDC[AM−PM] results based on such comparisons exhibit consistent spatial patterns with RTC[AM−PM] results in that the AM retrievals outperform the PM overpasses in western CONUS, and the PM retrievals slightly surpass AM retrievals in eastern CONUS (Figure 2b). It should be stressed that both the TC and DC evaluation strategies require certain assumptions and are therefore potentially unreliable (see above). However, the assumptions required by each are quite different. Therefore, the two approaches can be used for mutual cross-validation when in agreement.
AM versus PM differences are slightly smaller for SMOS soil moisture retrievals relative to those observed for AMSR-E (Figure 2c,d), which may be explainable by the smaller differences in soil temperature profiles between the 6:00 a.m./6:00 p.m. overpass times of SMOS versus the 1:30 a.m./1:30 p.m. times of AMSR-E. Technically, AMSR-E and SMOS have quite different mission intentions. SMOS (as well as SMAP) was specifically designed at L-band frequency for soil moisture observations. Therefore, a 6:00 a.m./6:00 p.m. equator overpass orbit was chosen since Faraday rotation in the ionosphere is minimized at 6:00 a.m. and isothermal near-surface conditions near 6:00 a.m. were thought to be optimal for soil moisture retrieval. In contrast, AMSR-E was not designed solely for soil moisture retrieval, but rather for a range of various water-related variables. Consequently, the 1:30 a.m./1:30 p.m. AMSR-E acquisition times are potentially sub-optimal for soil moisture.
In addition, the spatial patterns of SMOS-based RTC[AM−PM] are unique. There is a relatively distinct north–south variation in TC-based RTC[AM−PM] (Figure 2c) SMOS results (as opposed to the stronger east–west variation seen earlier for AMSR-E). In particular, the SMOS 6:00 a.m. retrievals are superior to SMOS 6:00 p.m. retrievals within central and southern portions of CONUS, whereas PM retrievals are superior along a swath of Northern CONUS—most notably within heavily agricultural areas in North-Central CONUS (Figure 1). This particular spatial distribution of AM versus PM differences can be related to the vegetation water content, which will be further investigated in the Discussion section. TC-based RTC[AM−PM] patterns seen in Figure 2c are also reflected in SMOS RDC[AM−PM] differences calculated using direct comparisons with sparse, ground-based data (Figure 2d). Therefore, as with earlier AMSR-E results, SMOS DC and TC-based results appear to be qualitatively consistent.
Relative to passive-based AMSR-E and SMOS results, lower magnitudes are seen for (active) ASCAT-based RTC[AM−PM] and RDC[AM−PM] differences plotted in Figure 2e,f. This reduction in magnitude is expected since, unlike passive microwave observations, scatterometer-based ASCAT retrievals do not require the accurate estimation of surface temperature as an ancillary data input. As a result, they are more robust to the impact of strong diurnal variation in surface temperature. Instead, the scatterometer backscatter signal depends strongly on surface roughness and vegetation conditions which exhibit relatively less diurnal variation.
In order to assess the statistical significance of sampled AM versus PM differences, the standard deviations of TC and DC-based [AM−PM] for AMSR-E, SMOS, and ASCAT were computed through a bootstrapping approach. These standard deviations are generally on the order of 0.05, suggesting that sampled values of RTC[AM−PM] or RDC[AM−PM] are statistically-significant (at a two-sigma significance level) only if their absolute values are larger than about 0.10. Accordingly, Figure 2 indicates that, while areas of significant [AM−PM] are noted for both AMSR-E and SMOS, ASCAT-based [AM−PM] generally fail to rise above expected levels of sampling noise.
One potential issue is the tendency for PM to be available over a wider portion of the year relative to AM retrievals due to generally warmer PM temperature conditions and thus more-frequent non-frozen soil conditions at PM overpass times. To examine this possibility, a core-warm-season experiment was also conducted for all three satellite products utilizing only June, July, and August (JJA) data. Same masking criteria and sampling criterion of 100 collocated soil moisture retrievals were applied in the JJA experiment. While limited by the temporal coverage, the JJA scenario has slightly less valid grids than the all-year experiment. These JJA [AM−PM] results are presented in Figure 3. The basic spatial patterns seen in the all-year (Figure 2) and JJA (Figure 3) are quite analogous, demonstrating that correlation-based accuracy differences between AM and PM overpasses are not strongly-impacted by seasonal variations in the frequency of AM versus PM data availability.
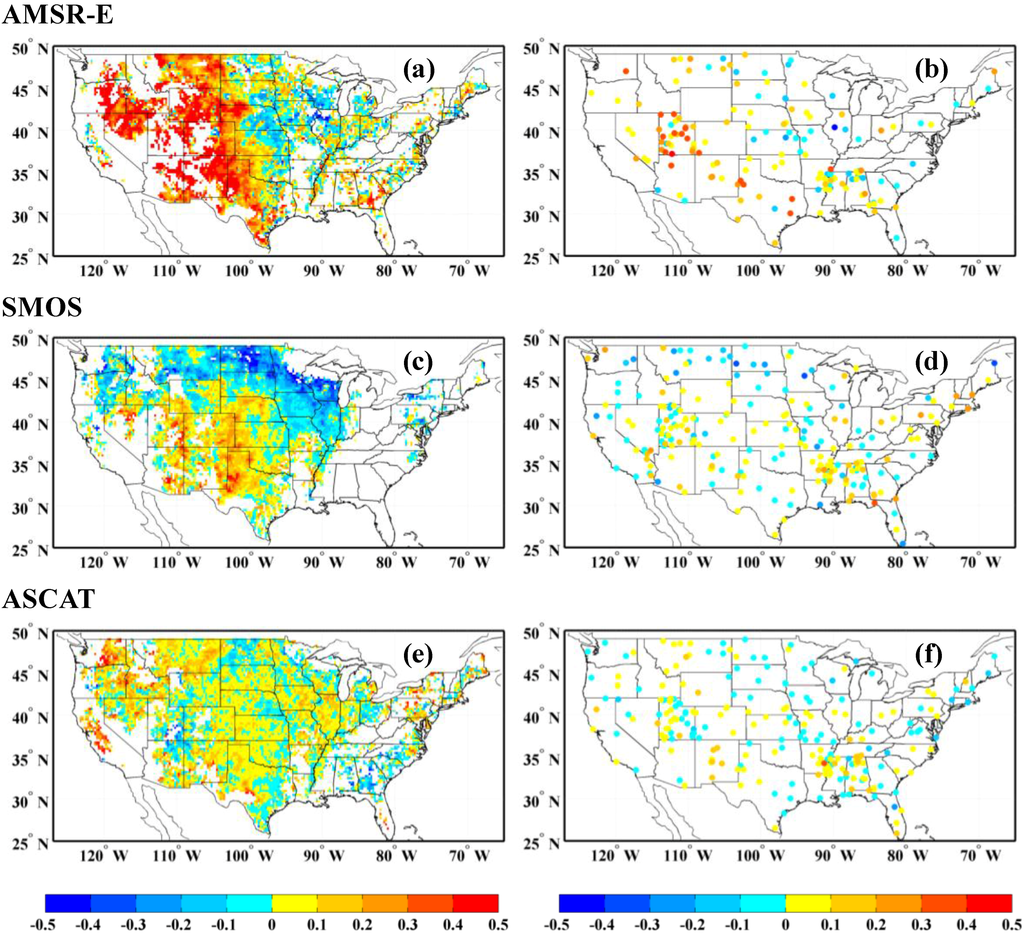
Figure 3.
(a–f) The JJA (June, July, and August) spatial distribution maps of AM minus PM differences of two correlation-based evaluation strategies for AMSR-E (first row), SMOS (second row), and ASCAT (third row)—namely, triple collocation (first column) and direct comparison against ground-based measurements (second column).
4.2. Relationship with Regard to Land Surface Conditions
As noted above, a key aspect of this analysis is the cross-verification of results obtained using both triple collocation and direct comparison against sparse ground-based observations. Figure 4 provides a direct assessment of this by plotting RTC[AM−PM] and RDC[AM−PM] for three satellite-derived soil moisture products and the two seasonal sampling experiments. Plotted values are averages obtained over six different VOD classes [35] derived from long-term averaged VOD values calculated via the application of the LPRM algorithm to AMSR-E observations from June 2002 to October 2011 (all-year or JJA). Class 1 and Class 6 contain grids with VOD values smaller than 0.1 and larger than 0.9, respectively. Classes 2 to 5 contain grids with VOD values ranging from 0.1 to 0.9 with an interval of 0.2. Limited by the sparsely-distributed sites and the pre-masking processes, here only VOD classes 2–5 have valid statistics. The correlation coefficient between the two evaluation techniques is high (R > 0.90), and, for each individual satellite products, can be even higher (R > 0.95). Such agreement offers indirect proof for the robustness of both independent validation approaches. The VOD classification in this study is constrained by the availability of simultaneous AMSR-E LPRM product that only generates a concurrent temporal coverage from 2007 to 2011, as well as the limited VOD classes. Thus, a more comprehensive NDVI-based, trend-related analysis is also conducted below.
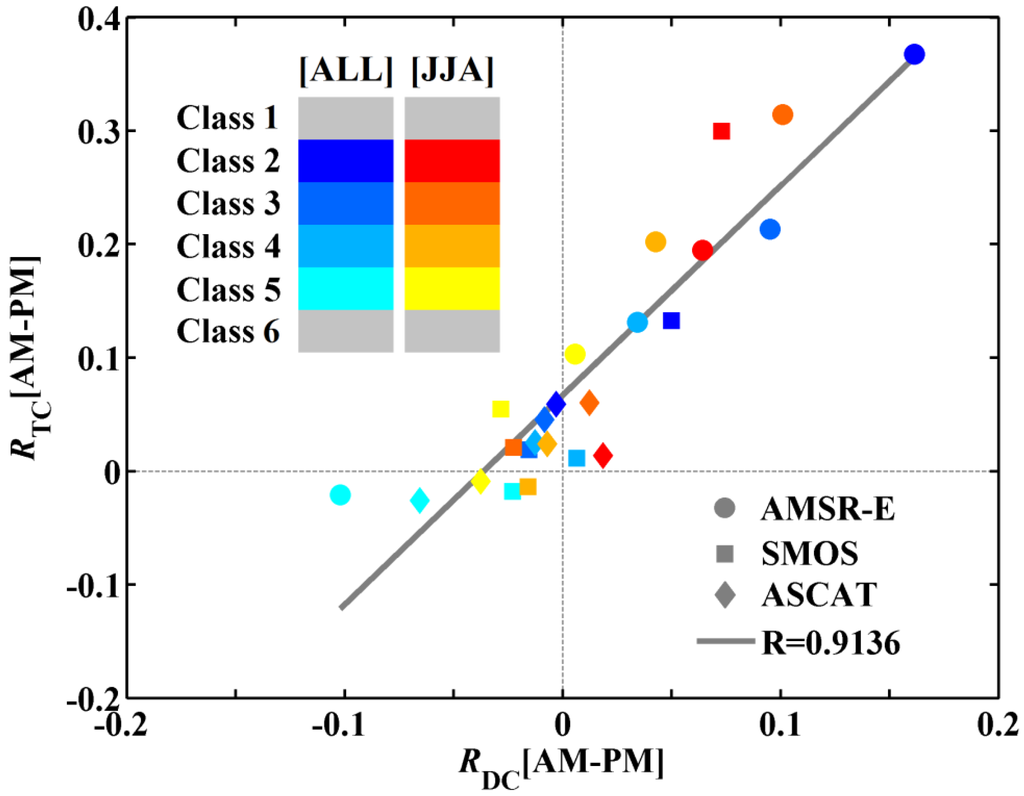
Figure 4.
The scatter plot of AM versus PM differences ([AM−PM]) via triple collocation (RTC[AM−PM]) against direct comparison (RDC[AM−PM]) for three satellite products: AMSR-E (circles), SMOS (squares), and ASCAT (diamonds). Results are aggregated and color-coded based on a vegetation optical depth (VOD) classification. Class 1 and Class 6 contain pixels with VOD values smaller than 0.1 and larger than 0.9, respectively. Classes 2 to 5 contain pixels with VOD values 0.1 to 0.9 with an interval of 0.2.
Figure 5 plots the relationship between AM and PM differences (observed for various sensors) and NDVI for ground sites and corresponding 0.25° grids. RTC and RDC for both the all-year and JJA experiments are aggregated and averaged over different NDVI classes with the interval assigned as 0.05. The quadratic polynomial fitting lines are also plotted. For any single sensor, correlation results obtained from both triple collocation and direct comparison against sparse ground stations reveal a strikingly-similar relationship with NDVI. However, markedly different relationships are obtained for different satellite soil moisture products.
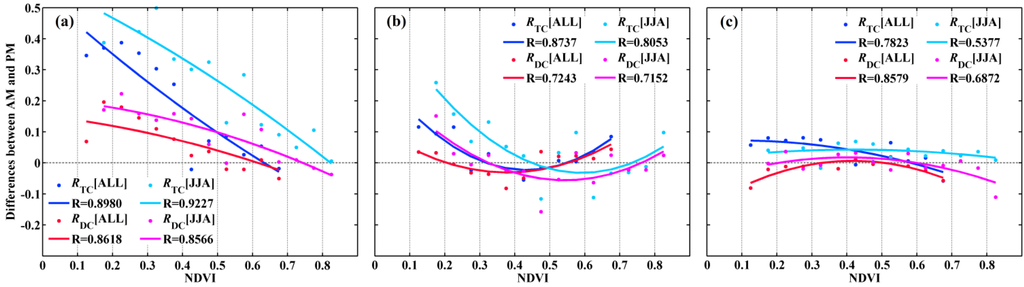
Figure 5.
Relationship between the NDVI and accuracy differences of two evaluation strategies under all-year (RTC[ALL] in blue, RDC[ALL] in red) and JJA (RTC[JJA] in cyan, RDC[JJA] in magenta) scenarios for: (a) AMSR-E, (b) SMOS, and (c) ASCAT. The “R” values are computed as the correlation coefficients between mean values and the corresponding fitting lines.
As shown in Figure 5a, AMSR-E AM soil moisture retrievals generally outperform their PM equivalents. However, as NDVI increases, the (correlation-based) accuracy difference between AM and PM retrievals [AM−PM] drops towards zero and even becomes negative for NDVI > 0.6 in the all-year scenario and NDVI > 0.8 in the JJA scenario. In contrast, the relationship between [AM−PM] of SMOS and NDVI presents another distinct functional relationship (Figure 5b), which is quite similar between the two validation strategies. That is, SMOS AM overpasses produce better soil moisture retrievals in low and highly-vegetated areas, while PM overpasses are superior at moderately-vegetated sites (0.3 < NDVI < 0.6). Note that for JJA, PM retrievals are superior for relatively heavily-vegetated areas (0.6 < NDVI < 0.8).
In addition, [AM−PM] differences for ASCAT (Figure 5c) are relatively smaller than the other two satellite products, especially AMSR-E. This suggests that ASCAT AM and PM overpasses have almost equivalent capabilities for characterizing soil moisture. This phenomenon can likely be explained by the lack of sensitivity of backscatter to soil or canopy temperature. This is in contrast to passive microwave radiometers like SMOS and AMSR-E where temperature has a strong and direct impact on the measured brightness temperature. As noted above, the fact that two independent verification methods (i.e., TC and DC), with distinct sources of comparative datasets under different seasonal sampling schemes, yield similar patterns with respect to NDVI lends further credibility to the robustness of these trends.
5. Discussion
It should be stressed that AM and PM differences noted here will—at a minimum—vary as a function of: (1) specific overpass times; (2) sensor technology (e.g., active versus passive); and (3) details of the retrieval algorithm. The three cases examined here (AMSR-E, SMOS and ASCAT) are not sufficient to fully isolate each of these effects. Nevertheless, several interesting trends can be observed. For example, results demonstrate that, as expected from theoretical considerations, passive microwave satellites (AMSR-E and SMOS) generally demonstrate better retrieval accuracy at their AM acquisition times. However, the advantage of these AM retrievals is generally-reduced as NDVI increases (especially for AMSR-E), and there are indications that PM retrievals are relatively superior in some heavily-vegetated areas (e.g., within the CONUS Corn Belt for the 6:00 p.m. SMOS overpass and the 1:30 p.m. AMSR-E overpass).
The relative advantages of the 6:00 p.m. SMOS retrievals are especially pronounced within the CONUS Corn Belt. This tendency is potentially very important for efforts to develop large-scale agricultural drought monitoring systems. The Corn Belt is intensively-cultivated with corn and soybean and represents one of the most productive agricultural regions in the world. Therefore, better characterization of soil moisture (especially during the JJA period) in this region would benefit agricultural forecasting and crop yield estimation in this region. The relatively superiority of the 6:00 p.m. SMOS/1:30 p.m. AMSR-E retrievals (versus their AM equivalents) may be linked to a diurnal minimums in vegetation water content at PM overpass times (and thus reduced canopy optical depths) [40]. In addition, high levels of nighttime/early-morning canopy dew may play a role [41]. However, these points are somewhat speculative and will need to be verified via additional study.
In contrast to the passive microwave products, AM versus PM acquisition time has a relatively smaller impact on the active microwave ASCAT soil moisture index product. Unlike brightness temperatures measured by passive microwave sensors, backscatter does not have a direct functional dependence on surface temperature and it therefore not impacted by large diurnal variations in land surface temperature. In addition, the particular soil moisture retrieval algorithm applied to ASCAT may also play a role. The ASCAT TU-Wien change detection algorithm retrieves the relative water content (degree of saturation) in the surface layer ranging from extreme dry and wet conditions over a long temporal period. The reference extreme dry and wet values are estimated from the lowest and highest backscatter extremes over the topsoil layer (<3 cm). Whereas, the dominant mechanisms contributing to backscatter measurements are volume scattering effects originated from the vegetation canopy and surface scattering from the underlying soil surface [3]. By calculating these references at specific overpass times, this empirical algorithm may be an effective bypass to avoid the influence of diurnally-varying uncertainties in radiative transfer model parameterization.
To the contrary, surface temperature plays a key role in passive soil moisture retrieval algorithms. Both AMSR-E LPRM and SMOS L-MEB are physically-based radiative transfer retrieval methods, one of the main differences between the two algorithms is the parameterization of effective surface temperature. In LPRM, the soil temperature is based on concurrent Ka-band (37 GHz observations) and assumed equal to the canopy temperature. Alternatively, SMOS L-MEB estimates the effective composite temperature explicitly for both soil and canopy based on numerical weather prediction output by taking into account different vegetation types. As shown in Parinussa et al. [35], passive microwave soil moisture retrievals can be improved when the effective temperature estimates are parameterized through alternative strategies. In future work, the presented validation framework could be used to assess the effect of alternative methods of estimating effective temperature for a given passive microwave sensor.
6. Conclusions
Remotely sensed soil moisture data are usually retrieved from satellites in sun-synchronous orbits with ascending and descending orbits that cross the earth's equator at fixed overpass times. Due to diurnal land surface variability, variations in these acquisition times can systematically impact satellite observational conditions and thus influence soil moisture retrieval errors. Here, both passive and active microwave satellite soil moisture products are assessed with respect to relative accuracy differences between AM and PM overpasses by applying both TC analysis and direct comparison against sparse ground-based observations.
To conclude, variations in the correlation-based accuracy of soil moisture retrievals derived from AM versus PM overpasses of passive microwave satellites exhibit distinct patterns and relationships to land cover characteristics. These patterns are relatively consistent regardless of whether retrievals are evaluated using triple collocation analysis or direct comparisons with ground-based soil moisture observations. The identification of such robust AM and PM differences has important implications for the design of sun-synchronous satellite orbits and the development of soil moisture retrieval strategies. In addition, a better blended and superior global soil moisture product could be achieved by taking into account both satellite orbits and their associated error variances.
Acknowledgments
This work was partially supported by Wade T. Crow’s membership on the NASA Soil Moisture Active/Passive mission science team and the Chinese Scholarship Council (CSC No. 201406270032). The authors wish to acknowledge the contribution of Alexander Gruber in the Vienna University of Technology providing ASCAT dataset and constructive guidance. The authors would like to thank Fan Chen from USDA Hydrology and Remote Sensing Laboratory for processing SCAN and USCRN ground-based measurements. The authors would also like to thank three anonymous reviewers for their constructive comments.
Author Contributions
Fangni Lei carried out the experiment and took the lead in writing this paper. Wade T. Crow proposed the main scientific ideas, considerations and comments. Huanfeng Shen offered constructive suggestions and comments. Robert M. Parinussa and Thomas R.H. Holmes provided AMSR-E LPRM datasets and assisted with interpretation of the results.
Conflicts of Interest
The authors declare no conflict of interest.
References
- Koster, R.D.; Dirmeyer, P.A.; Guo, Z.; Bonan, G.; Chan, E.; Cox, P.; Gordon, C.; Kanae, S.; Kowalczyk, E.; Lawrence, D.; et al. Regions of strong coupling between soil moisture and precipitation. Science 2004, 305, 1138–1140. [Google Scholar] [CrossRef] [PubMed]
- Njoku, E.G.; Jackson, T.J.; Lakshmi, V.; Chan, T.K.; Nghiem, S.V. Soil moisture retrieval from AMSR-E. IEEE Trans. Geosci. Remote Sens. 2003, 41, 215–229. [Google Scholar] [CrossRef]
- Naeimi, V.; Scipal, K.; Bartalis, Z.; Hasenauer, S.; Wagner, W. An improved soil moisture retrieval algorithm for ERS and METOP scatterometer observations. IEEE Trans. Geosci. Remote Sens. 2009, 47, 1999–2013. [Google Scholar] [CrossRef]
- Kerr, Y.H.; Waldteufel, P.; Wigneron, J.P.; Delwart, S.; Cabot, F.; Boutin, J.; Escorihuela, M.J.; Font, J.; Reul, N.; Gruhier, C.; et al. The SMOS mission: New tool for monitoring key elements of the global water cycle. Proc. IEEE 2010, 98, 666–687. [Google Scholar] [CrossRef]
- Entekhabi, D.; Njoku, E.G.; O’Neill, P.E.; Kellogg, K.H.; Crow, W.T.; Edelstein, W.N.; Entin, J.K.; Goodman, S.D.; Jackson, T.J.; Johnson, J.; et al. The soil moisture active passive (SMAP) mission. Proc. IEEE 2010, 98, 704–716. [Google Scholar] [CrossRef]
- Jackson, T.J.; Cosh, M.H.; Bindlish, R.; Starks, P.J.; Bosch, D.D.; Seyfried, M.; Goodrich, D.C.; Moran, M.S.; Du, J. Validation of advanced microwave scanning radiometer soil moisture products. IEEE Trans. Geosci. Remote Sens. 2010, 48, 4256–4272. [Google Scholar] [CrossRef]
- Le Vine, D.M.; Abraham, S.A.J.I. Faraday rotation and passive microwave remote sensing of soil moisture from space. In Microwave Radiometry and Remote Sensing of the Earth’s Surface and Atmosphere, 1st ed.; Pampaloni, P., Paloscia, S., Eds.; VSP: Zeist, The Netherlands, 2000; pp. 89–96. [Google Scholar]
- Aksoy, M.; Johnson, J.T. A study of SMOS RFI over North America. IEEE Geosci. Remote Sens. Lett. 2013, 10, 4210–4212. [Google Scholar] [CrossRef]
- Zhao, T.; Shi, J.; Bindlish, R.; Jackson, T.J.; Kerr, Y.H.; Cosh, M.H.; Cui, Q.; Li, Y.; Xiong, C.; Che, T. Refinement of SMOS multiangular brightness temperature toward soil moisture retrieval and its analysis over reference targets. IEEE J. Sel. Topics Appl. Earth Observ. Remote Sens. 2015, 8, 589–603. [Google Scholar] [CrossRef]
- Saleh, K.; Wigneron, J.P.; De Rosnay, P.; Calvet, J.C.; Escorihuela, M.J.; Kerr, Y.; Waldteufel, P. Impact of rain interception by vegetation and mulch on the L-band emission of natural grass. Remote Sens. Environ. 2006, 101, 127–139. [Google Scholar] [CrossRef]
- Escorihuela, M.J.; Kerr, Y.H.; De Rosnay, P.; Saleh, K.; Wigneron, J.P.; Calvet, J.C. Effects of dew on the radiometric signal of a grass field at L-band. IEEE Geosci. Remote Sens. Lett. 2009, 6, 67–71. [Google Scholar] [CrossRef]
- Rowlandson, T.L.; Hornbuckle, B.K.; Bramer, L.M.; Patton, J.C.; Logsdon, S.D. Comparisons of evening and morning SMOS passes over the Midwest United States. IEEE Trans. Geosci. Remote Sens. 2012, 50, 1544–1555. [Google Scholar] [CrossRef]
- Draper, C.S.; Walker, J.P.; Steinle, P.J.; de Jeu, R.A.; Holmes, T.R. An evaluation of AMSR-E derived soil moisture over Australia. Remote Sens. Environ. 2009, 113, 703–710. [Google Scholar] [CrossRef]
- McColl, K.A.; Vogelzang, J.; Konings, A.G.; Entekhabi, D.; Piles, M.; Stoffelen, A. Extended triple collocation: Estimating errors and correlation coefficients with respect to an unknown target. Geophys. Res. Lett. 2014, 41, 6229–6236. [Google Scholar] [CrossRef]
- Owe, M.; de Jeu, R.; Holmes, T. Multisensor historical climatology of satellite-derived global land surface moisture. J. Geophys. Res.: Earth Surf. 2008, 113, F01002. [Google Scholar] [CrossRef]
- De Jeu, R.; Wagner, W.; Holmes, T.; Dolman, A.; van de Giesen, N.; Friesen, J. Global soil moisture patterns observed by space borne microwave radiometers and scatterometers. Surv. Geophys. 2008, 29, 399–420. [Google Scholar] [CrossRef]
- Dorigo, W.; Scipal, K.; Parinussa, R.; Liu, Y.; Wagner, W.; de Jeu, R.; Naeimi, V. Error characterisation of global active and passive microwave soil moisture datasets. Hydrol. Earth Syst. Sc. 2010, 14, 2605–2616. [Google Scholar] [CrossRef]
- Draper, C.; Reichle, R.; de Jeu, R.; Naeimi, V.; Parinussa, R.; Wagner, W. Estimating root mean square errors in remotely sensed soil moisture over continental scale domains. Remote Sens. Environ. 2013, 137, 288–298. [Google Scholar] [CrossRef]
- Kerr, Y.H.; Waldteufel, P.; Richaume, P.; Wigneron, J.P.; Ferrazzoli, P.; Mahmoodi, A.; Al Bitar, A.; Cabot, F.; Gruhier, C.; Juglea, S.E.; et al. The SMOS soil moisture retrieval algorithm. IEEE Trans. Geosci. Remote Sens. 2012, 50, 1384–1403. [Google Scholar] [CrossRef]
- Al-Yaari, A.; Wigneron, J.P.; Ducharne, A.; Kerr, Y.H.; Wagner, W.; de Lannoy, G.; Reichle, R.; Al Bitar, A.; Dorigo, W.; Richaume, P.; et al. Global-scale comparison of passive (SMOS) and active (ASCAT) satellite based microwave soil moisture retrievals with soil moisture simulations (MERRA-Land). Remote Sens. Environ. 2014, 152, 614–626. [Google Scholar] [CrossRef]
- Xia, Y.; Mitchell, K.; Ek, M.; Sheffield, J.; Cosgrove, B.; Wood, E.; Luo, L.; Alonge, C.; Wei, H.; Meng, J.; et al. Continental-scale water and energy flux analysis and validation for the North American Land Data Assimilation System project phase 2 (NLDAS-2): 1. Intercomparison and application of model products. J. Geophys. Res.: Atmos. 2012, 117, D03109. [Google Scholar] [CrossRef]
- Ek, M.B.; Mitchell, K.E.; Lin, Y.; Rogers, E.; Grunmann, P.; Koren, V.; Gayno, G.; Tarpley, J.D. Implementation of Noah land surface model advances in the National Centers for Environmental Prediction operational mesoscale Eta model. J. Geophys. Res.: Atmos. 2003, 108, D22. [Google Scholar] [CrossRef]
- Hain, C.R.; Crow, W.T.; Mecikalski, J.R.; Anderson, M.C.; Holmes, T. An intercomparison of available soil moisture estimates from thermal infrared and passive microwave remote sensing and land surface modeling. J. Geophys. Res.: Atmos. 2011, 116, D15107. [Google Scholar] [CrossRef]
- Soil Climate Analysis Network Data and Products. Available online: http://www.wcc.nrcs.usda.gov/scan/ (accessed on 13 October 2015).
- Schaefer, G.L.; Cosh, M.H.; Jackson, T.J. The USDA natural resources conservation service soil climate analysis network (SCAN). J. Atmos. Oceanic Tech. 2007, 24, 2073–2077. [Google Scholar] [CrossRef]
- U.S. Climate Reference Network. Available online: http://www.ncdc.noaa.gov/crn/ (accessed on 13 October 2015).
- Meesters, A.G.; de Jeu, R.A.; Owe, M. Analytical derivation of the vegetation optical depth from the microwave polarization difference index. IEEE Geosci. Remote Sens. Lett. 2005, 2, 121–123. [Google Scholar] [CrossRef]
- Li, L.; Njoku, E.G.; Im, E.; Chang, P.S.; Germain, K.S. A preliminary survey of radio-frequency interference over the US in Aqua AMSR-E data. IEEE Trans. Geosci. Remote Sens. 2004, 42, 380–390. [Google Scholar] [CrossRef]
- MODIS Vegetation Indices Monthly L3 Global 0.05Deg CMG. Available online: https://lpdaac.usgs.gov/dataset_discovery/modis/modis_products_table/mod13c2 (accessed on 26 August 2015).
- Entekhabi, D.; Reichle, R.H.; Koster, R.D.; Crow, W.T. Performance metrics for soil moisture retrievals and application requirements. J. Hydrometeorol. 2010, 11, 832–840. [Google Scholar] [CrossRef]
- Reichle, R.H.; Koster, R.D. Bias reduction in short records of satellite soil moisture. Geophys. Res. Lett. 2004, 31, L19501. [Google Scholar] [CrossRef]
- Miralles, D.G.; Crow, W.T.; Cosh, M.H. Estimating spatial sampling errors in coarse-scale soil moisture estimates derived from point-scale observations. J. Hydrometeorol. 2010, 11, 1423–1429. [Google Scholar] [CrossRef]
- Stoffelen, A. Toward the true near-surface wind speed: Error modeling and calibration using triple collocation. J. Geophys. Res.: Ocean. 1998, 103, 7755–7766. [Google Scholar] [CrossRef]
- Scipal, K.; Holmes, T.; de Jeu, R.; Naeimi, V.; Wagner, W. A possible solution for the problem of estimating the error structure of global soil moisture data sets. Geophys. Res. Lett. 2008, 35, L24403. [Google Scholar] [CrossRef]
- Parinussa, R.; Holmes, T.; Yilmaz, M.; Crow, W.T. The impact of land surface temperature on soil moisture anomaly detection from passive microwave observations. Hydrol. Earth Syst. Sc. 2011, 15, 3135–3151. [Google Scholar] [CrossRef]
- Leroux, D.J.; Kerr, Y.H.; Richaume, P.; Fieuzal, R. Spatial distribution and possible sources of SMOS errors at the global scale. Remote Sens. Environ. 2013, 133, 240–250. [Google Scholar] [CrossRef]
- Yilmaz, M.T.; Crow, W.T. Evaluation of assumptions in soil moisture triple collocation analysis. J. Hydrometeorol. 2014, 15, 1293–1302. [Google Scholar] [CrossRef]
- Crow, W.T.; Berg, A.A.; Cosh, M.H.; Loew, A.; Mohanty, B.P.; Panciera, R.; de Rosnay, P.; Ryu, D.; Walker, J.P. Upscaling sparse ground-based soil moisture observations for the validation of coarse-resolution satellite soil moisture products. Rev. Geophys. 2012, 50, RG2002. [Google Scholar] [CrossRef]
- Efron, B.; Tibshirani, R.J. The bootstrap estimate of standard error. In An Introduction to the Bootstrap, 1st ed.; Chapman and Hall/CRC: Boca Raton, FL, USA, 1994; pp. 45–59. [Google Scholar]
- Van Emmerik, T.; Steele-Dunne, S.C.; Judge, J.; van de Giesen, N. Impact of diurnal variation in vegetation water content on radar backscatter from maize during water stress. IEEE Trans. Geosci. Remote Sens. 2015, 53, 3855–3869. [Google Scholar] [CrossRef]
- Du, J.; Jackson, T.J.; Bindlish, R.; Cosh, M.H.; Li, L.; Hornbuckle, B.K.; Kabela, E.D. Effect of dew on aircraft-based passive microwave observations over an agricultural domain. J. Appl. Remote Sens. 2012, 6, 063571-1–063571-10. [Google Scholar] [CrossRef]
© 2015 by the authors; licensee MDPI, Basel, Switzerland. This article is an open access article distributed under the terms and conditions of the Creative Commons Attribution license (http://creativecommons.org/licenses/by/4.0/).