
Response to Johnson B.A. Scale Issues Related to the Accuracy Assessment of Land Use/Land Cover Maps Produced Using Multi-Resolution Data: Comments on “The Improvement of Land Cover Classification by Thermal Remote Sensing”. Remote Sens. 2015, 7, 8368–8390


Abstract
: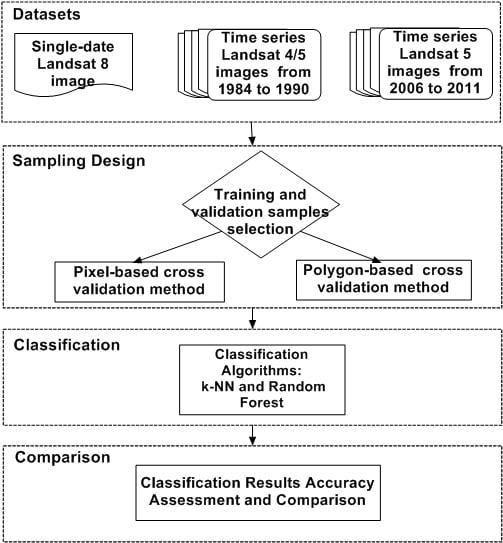
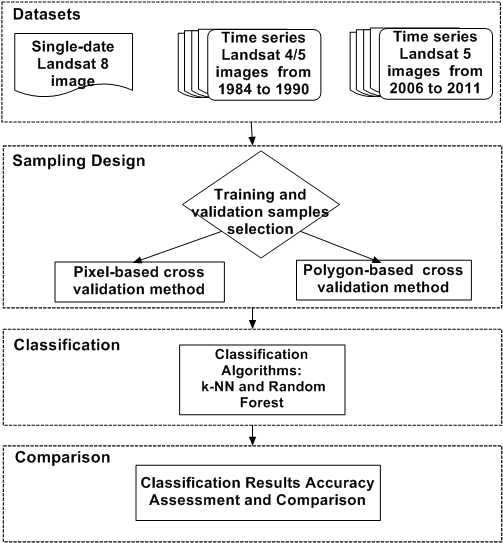
1. Introduction
2. Polygon-Based Cross Validation Method
3. Results and Discussion
3.1. Three-Level Classification Based on the Single-Date Landsat 8 Image (S1)

| Image Classification Accuracy in 2013 | Level 1 (%) | Level 2 (%) | Level 3 (%) | |||
|---|---|---|---|---|---|---|
| Assessed by Polygon-Based CV | k-NN5 | RF | k-NN5 | RF | k-NN5 | RF |
| Bands4 | 97.0 | 97.5 | 83.3 | 82.5 | 67.5 | 67.7 |
| Bands6T | 96.5 | 96.7 | 88.7 | 88.8 | 79.1 | 79.2 |
| Bands10T | 96.9 | 97.6 | 88.0 | 87.5 | 80.8 | 78.0 |
| Assessed by Pixel-Based CV | k-NN5 | RF | k-NN5 | RF | k-NN5 | RF |
| Bands4 | 98.4 | 98.5 | 86.2 | 87.2 | 76.5 | 78.2 |
| Bands6T | 98.2 | 98.4 | 92.1 | 92.9 | 87.7 | 88.1 |
| Bands10T | 98.7 | 98.6 | 93.5 | 93.5 | 89.3 | 89.2 |
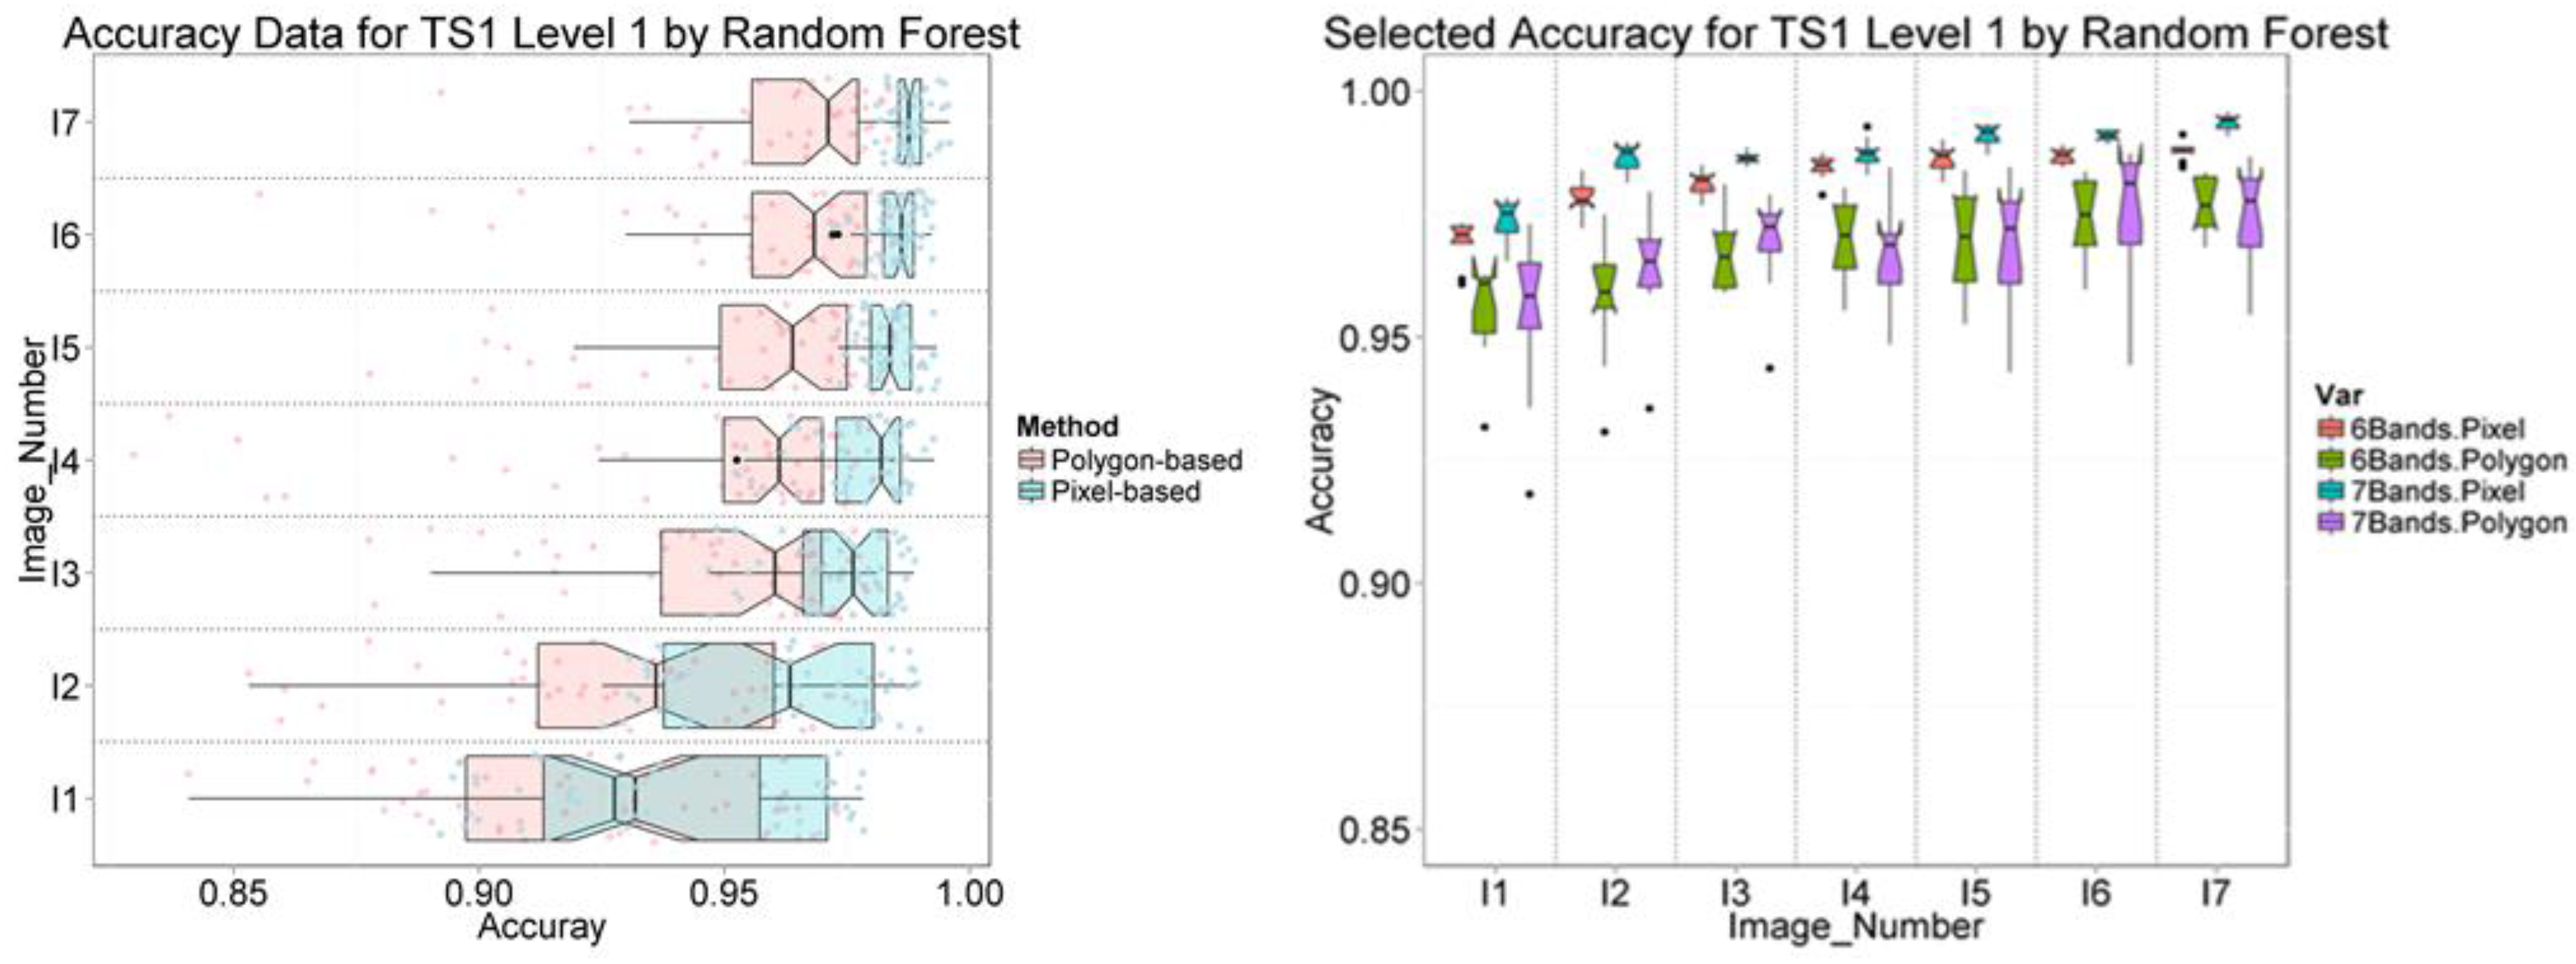
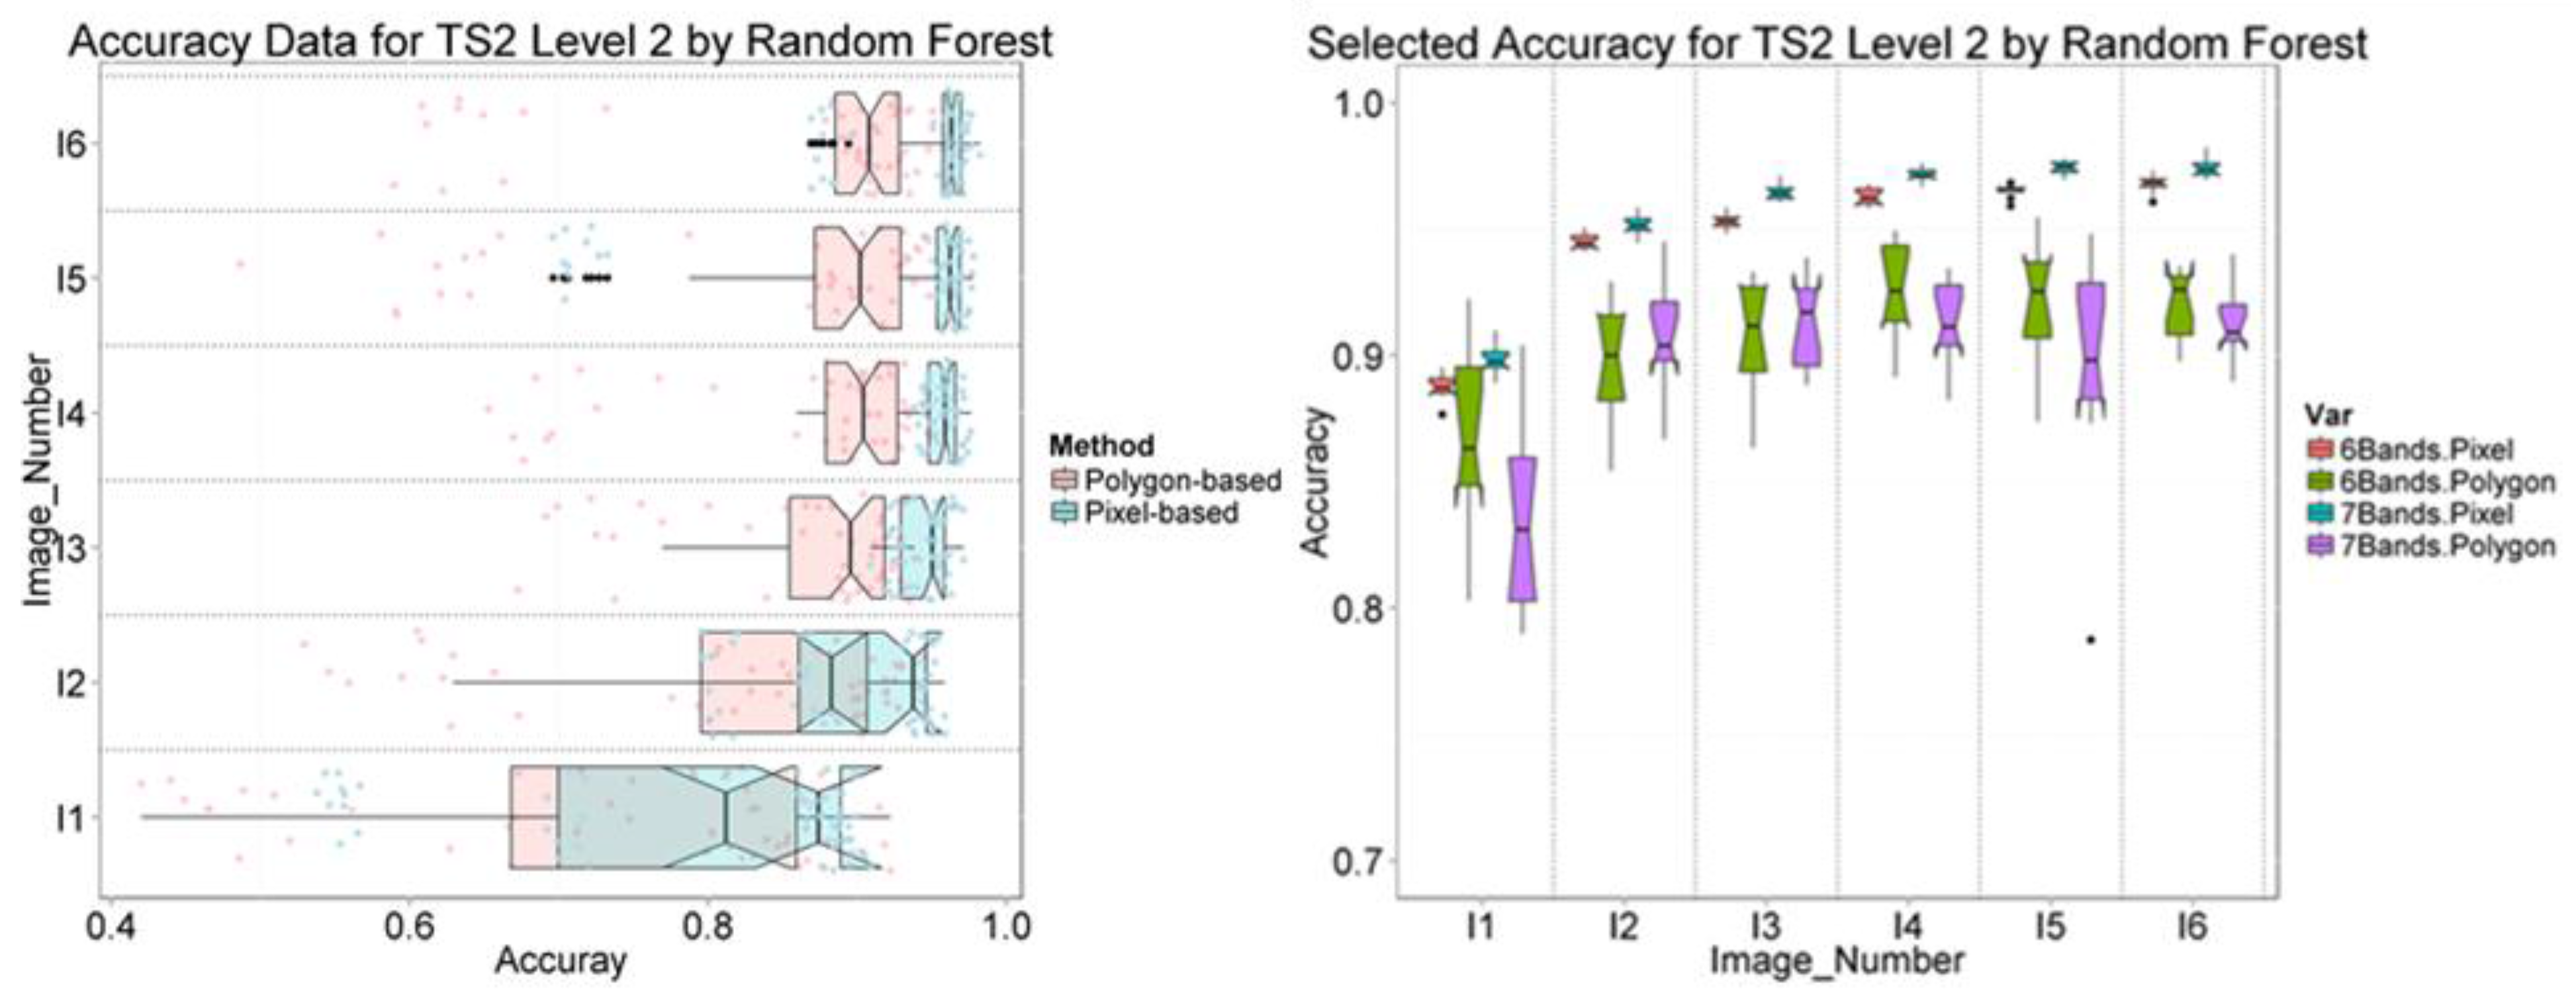
3.2. Two-Level Classification Based on Time Series of Images (TS1 and TS2)
| Image Number | B3B4 (%) | 3PC (%) | 6Bands (%) | Thermal (%) | 7Bands (%) | |||||
|---|---|---|---|---|---|---|---|---|---|---|
| k-NN | RF | k-NN | RF | k-NN | RF | k-NN | RF | k-NN | RF | |
| TS1-1 | 86.6 | 87.7 | 91.6 | 91.2 | 86.6 | 87.7 | 87.8 | 90.5 | 96.2 | 95.5 |
| TS1-2 | 91.9 | 90.9 | 94.8 | 94.4 | 95.6 | 96.2 | 88.4 | 88.8 | 96.5 | 97.0 |
| TS1-3 | 94.2 | 94.9 | 95.9 | 95.8 | 96.4 | 96.1 | 88.4 | 90.9 | 96.8 | 96.3 |
| TS1-4 | 95.6 | 96.2 | 96.8 | 96.7 | 96.4 | 97.1 | 88.7 | 87.0 | 96.8 | 96.7 |
| TS1-5 | 96.1 | 96.2 | 96.8 | 96.2 | 97.3 | 97.0 | 91.7 | 91.3 | 96.8 | 97.3 |
| TS1-6 | 96.1 | 95.9 | 97.2 | 96.3 | 96.8 | 97.4 | 91.7 | 89.3 | 96.9 | 97.1 |
| TS1-7 | 96.0 | 96.6 | 97.4 | 97.2 | 97.7 | 97.6 | 93.2 | 94.6 | 97.7 | 97.0 |
| TS2-1 | 91.4 | 91.5 | 95.6 | 94.2 | 95.8 | 95.5 | 80.0 | 86.0 | 95.9 | 95.1 |
| TS2-2 | 95.1 | 95.9 | 97.2 | 96.9 | 97.5 | 97.0 | 84.5 | 89.3 | 97.8 | 97.0 |
| TS2-3 | 97.1 | 97.2 | 98.0 | 97.6 | 98.4 | 97.8 | 92.6 | 92.7 | 98.3 | 98.2 |
| TS2-4 | 97.0 | 97.8 | 97.8 | 97.9 | 97.8 | 98.2 | 95.0 | 92.6 | 98.7 | 98.0 |
| TS2-5 | 98.1 | 97.9 | 98.7 | 98.3 | 98.0 | 99.0 | 94.2 | 94.4 | 98.3 | 98.3 |
| TS2-6 | 98.5 | 98.2 | 98.6 | 98.1 | 98.6 | 98.4 | 95.4 | 95.4 | 98.3 | 98.4 |
| Image Number | B3B4 (%) | 3PC (%) | 6Bands (%) | Thermal (%) | 7Bands (%) | |||||
|---|---|---|---|---|---|---|---|---|---|---|
| k-NN | RF | k-NN | RF | k-NN | RF | k-NN | RF | k-NN | RF | |
| TS1-1 | 63.3 | 62.0 | 73.3 | 72.2 | 79.4 | 80.3 | 39.2 | 51.6 | 79.7 | 79.4 |
| TS1-2 | 72.6 | 73.3 | 78.7 | 77.9 | 81.5 | 82.0 | 50.4 | 52.9 | 80.4 | 81.8 |
| TS1-3 | 77.9 | 76.9 | 79.3 | 81.9 | 83.4 | 82.8 | 55.4 | 57.9 | 81.9 | 83.3 |
| TS1-4 | 80.8 | 81.5 | 85.0 | 85.5 | 86.1 | 84.2 | 62.2 | 60.7 | 81.7 | 83.2 |
| TS1-5 | 82.7 | 83.7 | 84.1 | 84.5 | 84.6 | 86.1 | 66.3 | 66.3 | 83.3 | 85.2 |
| TS1-6 | 83.2 | 83.4 | 86.0 | 85.9 | 85.2 | 84.7 | 66.8 | 68.8 | 85.1 | 86.2 |
| TS1-7 | 82.9 | 83.0 | 84.4 | 85.0 | 85.1 | 86.3 | 69.9 | 72.0 | 85.4 | 86.6 |
| TS2-1 | 68.8 | 69.6 | 83.7 | 82.4 | 85.7 | 86.0 | 42.0 | 48.7 | 83.6 | 84.5 |
| TS2-2 | 79.4 | 80.3 | 88.4 | 89.8 | 90.1 | 90.9 | 57.3 | 58.5 | 90.6 | 89.8 |
| TS2-3 | 86.8 | 86.2 | 89.9 | 92.4 | 88.7 | 91.0 | 60.9 | 63.9 | 91.2 | 91.0 |
| TS2-4 | 87.8 | 89.6 | 90.6 | 91.6 | 91.8 | 91.5 | 65.7 | 64.9 | 92.7 | 91.6 |
| TS2-5 | 87.7 | 90.1 | 92.0 | 92.6 | 91.1 | 92.3 | 70.3 | 71.5 | 92.2 | 93.0 |
| TS2-6 | 89.1 | 91.3 | 92.1 | 92.3 | 90.2 | 91.9 | 74.5 | 70.4 | 92.0 | 93.3 |


4. Conclusions
Supplementary Files
Supplementary File 1Acknowledgments
Author Contributions
Conflicts of Interest
References
- Johnson, B.A. Scale issues related to the accuracy assessment of land use/land cover maps produced using multi-resolution data: Comments on “the improvement of land cover classification by thermal remote sensing”. Remote Sens. 2015, 7, 8368–8390. Remote Sens. 2015, 7, 13436–13439. [Google Scholar]
- Sun, L.; Schulz, K. The improvement of land cover classification by thermal remote sensing. Remote Sens. 2015, 7, 8368–8390. [Google Scholar] [CrossRef]
- Congalton, R.G.; Green, K. Assessing the Accuracy of Remotely Sensed Data: Principles and Practices; CRC Press/Taylor & Francis: Boca Raton, FL, USA, 2009. [Google Scholar]
- Congalton, R.G. A review of assessing the accuracy of classifications of remotely sensed data. Remote Sens. Environ. 1991, 37, 35–46. [Google Scholar] [CrossRef]
- Foody, G.M. Status of land cover classification accuracy assessment. Remote Sens. Environ. 2002, 80, 185–201. [Google Scholar] [CrossRef]
- Colditz, R.R.; Wehrmann, T.; Bachmann, M.; Steinnocher, K.; Schmidt, M.; Strunz, G.; Dech, S. Influence of image fusion approaches on classification accuracy: A case study. Int. J. Remote Sens. 2006, 27, 3311–3335. [Google Scholar] [CrossRef]
- Zhu, X.; Chen, J.; Gao, F.; Chen, X.; Masek, J.G. An enhanced spatial and temporal adaptive reflectance fusion model for complex heterogeneous regions. Remote Sens. Environ. 2010, 114, 2610–2623. [Google Scholar] [CrossRef]
- Anderson, J.R. A Land Use and Land Cover Classification System for Use with Remote Sensor Data; U.S. Government Printing Office (GPO): Washington, DC, USA, 1976. [Google Scholar]
- Eisavi, V.; Homayouni, S.; Yazdi, A.; Alimohammadi, A. Land cover mapping based on random forest classification of multitemporal spectral and thermal images. Environ. Monit. Assess. 2015, 187, 1–14. [Google Scholar] [CrossRef] [PubMed]
© 2015 by the authors; licensee MDPI, Basel, Switzerland. This article is an open access article distributed under the terms and conditions of the Creative Commons Attribution license (http://creativecommons.org/licenses/by/4.0/).
Share and Cite
Sun, L.; Schulz, K. Response to Johnson B.A. Scale Issues Related to the Accuracy Assessment of Land Use/Land Cover Maps Produced Using Multi-Resolution Data: Comments on “The Improvement of Land Cover Classification by Thermal Remote Sensing”. Remote Sens. 2015, 7, 8368–8390. Remote Sens. 2015, 7, 13440-13447. https://doi.org/10.3390/rs71013440
Sun L, Schulz K. Response to Johnson B.A. Scale Issues Related to the Accuracy Assessment of Land Use/Land Cover Maps Produced Using Multi-Resolution Data: Comments on “The Improvement of Land Cover Classification by Thermal Remote Sensing”. Remote Sens. 2015, 7, 8368–8390. Remote Sensing. 2015; 7(10):13440-13447. https://doi.org/10.3390/rs71013440
Chicago/Turabian StyleSun, Liya, and Karsten Schulz. 2015. "Response to Johnson B.A. Scale Issues Related to the Accuracy Assessment of Land Use/Land Cover Maps Produced Using Multi-Resolution Data: Comments on “The Improvement of Land Cover Classification by Thermal Remote Sensing”. Remote Sens. 2015, 7, 8368–8390" Remote Sensing 7, no. 10: 13440-13447. https://doi.org/10.3390/rs71013440
APA StyleSun, L., & Schulz, K. (2015). Response to Johnson B.A. Scale Issues Related to the Accuracy Assessment of Land Use/Land Cover Maps Produced Using Multi-Resolution Data: Comments on “The Improvement of Land Cover Classification by Thermal Remote Sensing”. Remote Sens. 2015, 7, 8368–8390. Remote Sensing, 7(10), 13440-13447. https://doi.org/10.3390/rs71013440