Due to a technical error at the Editorial Office, Figure 8 of manuscript [1] is missing in the published paper. The correct version of the figure is reproduced below. We apologize for any inconvenience caused to authors or readers of Remote Sensing.
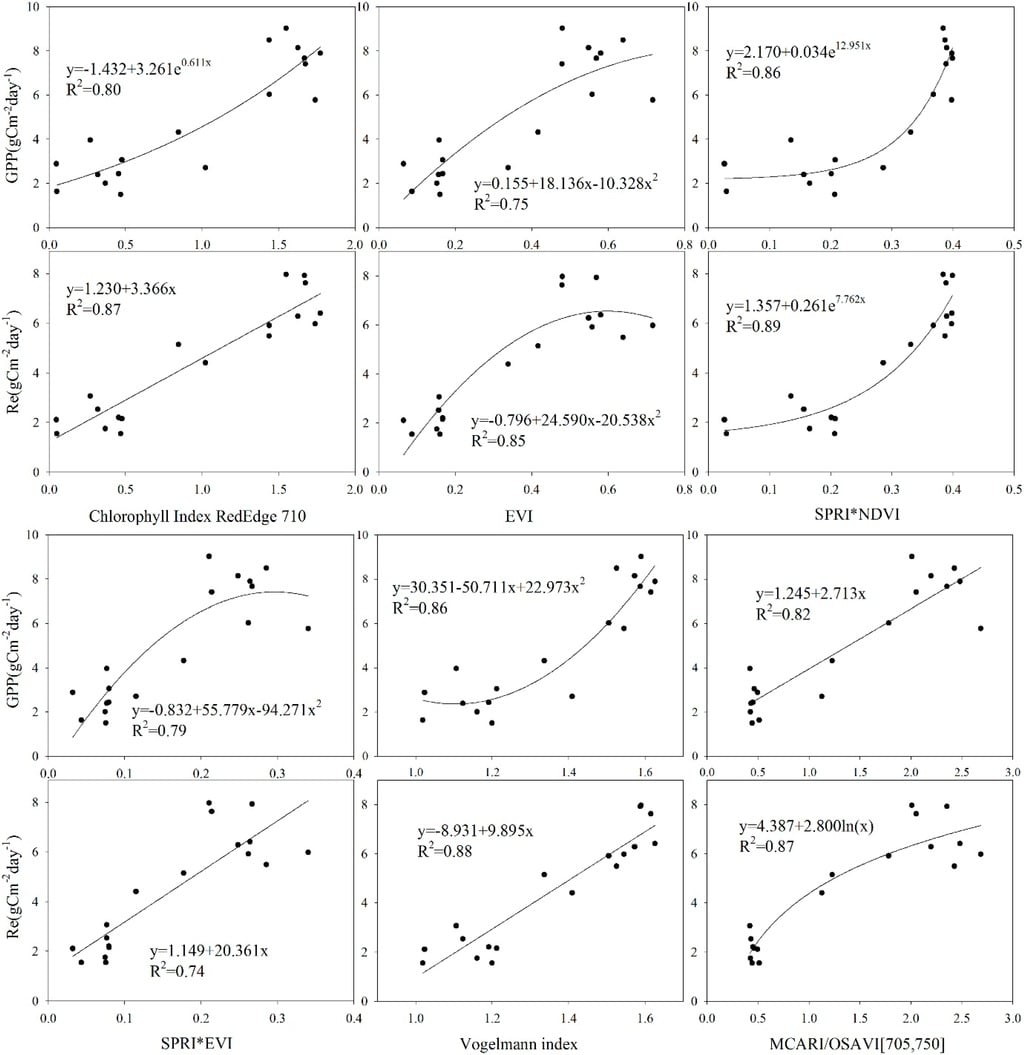
Figure 8.
Scatter plots of 6 bio-indicators and measured GPP and Re. All fitting models are significant at the 0.01 level (2-tailed).
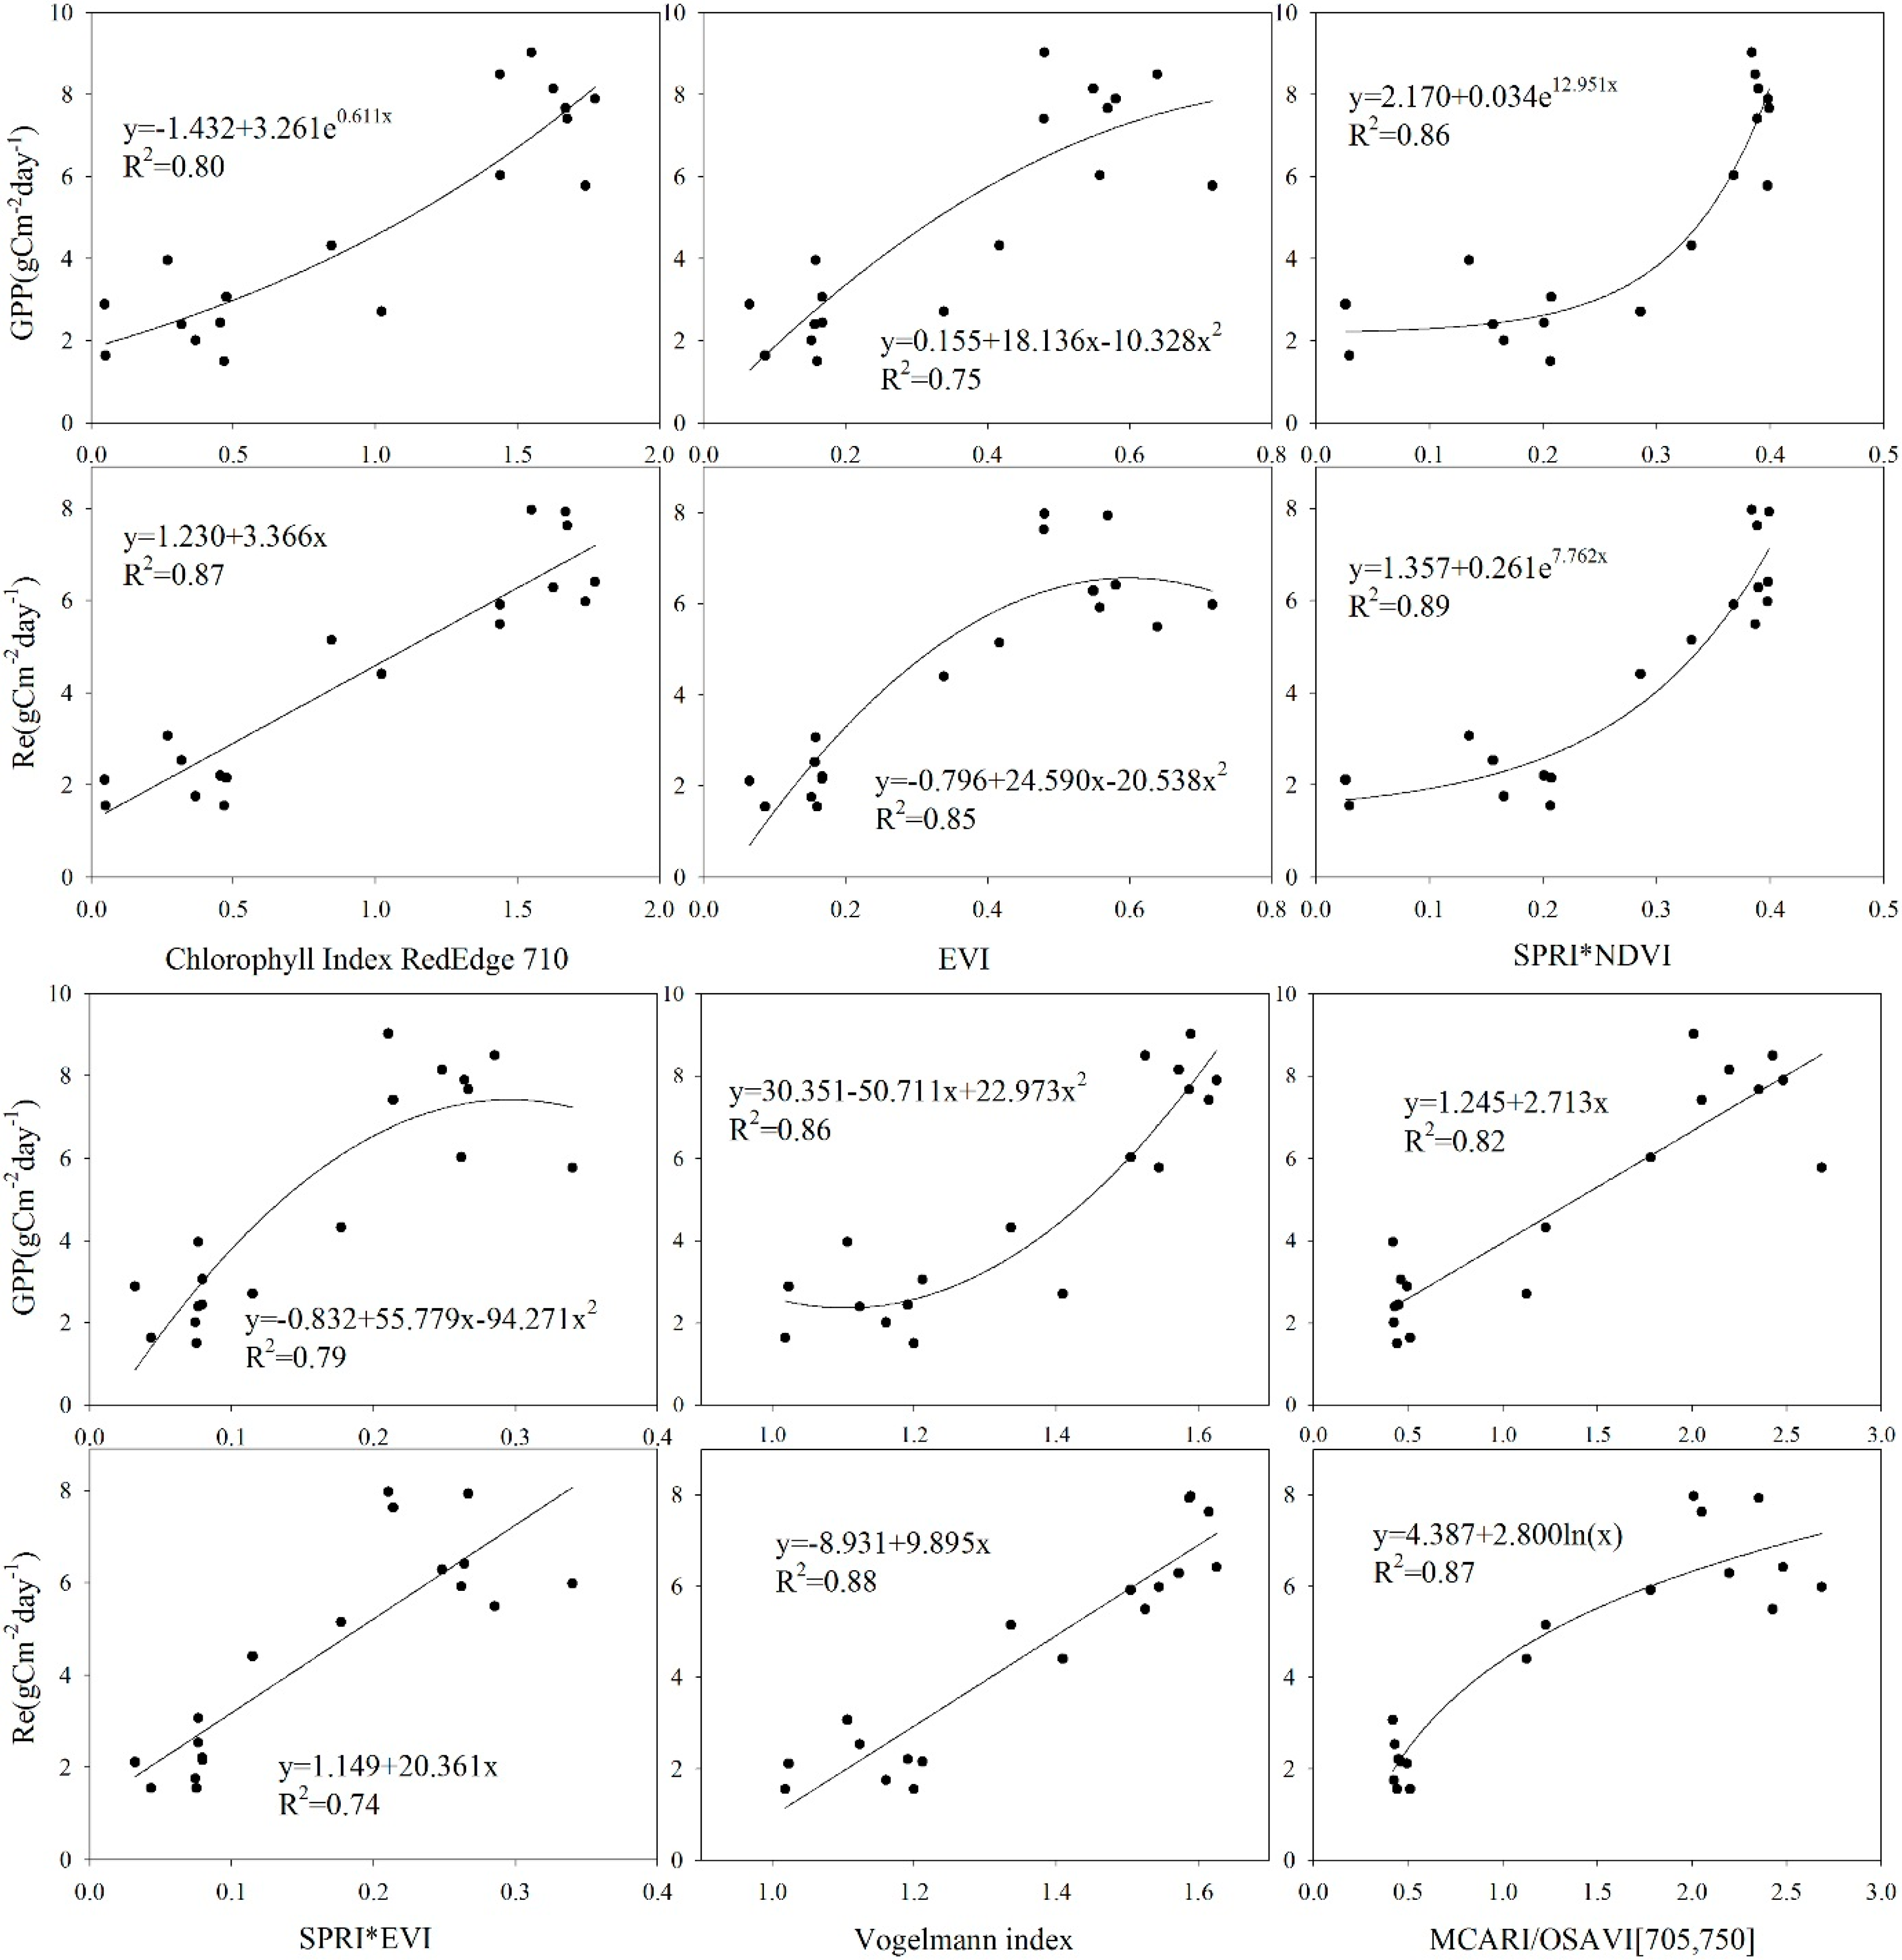
Figure 8.
Scatter plots of 6 bio-indicators and measured GPP and Re. All fitting models are significant at the 0.01 level (2-tailed).
Reference
- Yu, Q.; Wang, S.; Mickler, R.A.; Huang, K.; Zhou, L.; Yan, H.; Chen, D.; Han, S. Narrowband bio-indicator monitoring of temperate forest carbon fluxes in northeastern China. Remote Sens. 2014, 6, 8986–9013. [Google Scholar]
© 2015 by the authors; licensee MDPI, Basel, Switzerland. This article is an open access article distributed under the terms and conditions of the Creative Commons Attribution license (http://creativecommons.org/licenses/by/4.0/).