Multi-Chromatic Analysis of SAR Images for Coherent Target Detection


Abstract
: This work investigates the possibility of performing target analysis through the Multi-Chromatic Analysis (MCA), a technique that basically explores the information content of sub-band images obtained by processing portions of the range spectrum of a synthetic aperture radar (SAR) image. According to the behavior of the SAR signal at the different sub-bands, MCA allows target classification. Two strategies have been experimented by processing TerraSAR-X images acquired over the Venice Lagoon, Italy: one exploiting the phase of interferometric sub-band pairs, the other using the spectral coherence derived by computing the coherence between sub-band images of a single SAR acquisition. The first approach introduces the concept of frequency-persistent scatterers (FPS), which is complementary to that of the time-persistent scatterers (PS). FPS and PS populations have been derived and analyzed to evaluate the respective characteristics and the physical nature of the targets. Spectral coherence analysis has been applied to vessel detection, according to the property that, in presence of a random distribution of surface scatterers, as for open sea surfaces, spectral coherence is expected to be proportional to sub-band intersection, while in presence of manmade structures it is preserved anyhow. First results show that spectral coherence is well preserved even for very small vessels, and can be used as a complementary information channel to constrain vessel detection in addition to classical Constant False Alarm Rate techniques based on the sole intensity channel.1. Introduction
The Multi-Chromatic Analysis (MCA) [1] basically explores the information content of images obtained by splitting the overall range spectral bandwidth B of the transmitted Synthetic Aperture Radar (SAR) signal into Nf sub-bands of bandwidth Bp, centered at different central carrier frequencies fi. The technique has been thoroughly investigated by processing interferometric pairs of SAR images to derive a stack of sub-look interferograms, and then exploring the phase trend of each pixel as a function of the frequencies fi. This phase evolves linearly with fi, the slope being proportional to the range difference between master and slave. Therefore, MCA can be used to compute pixel-by-pixel the absolute phase, and consequently to perform phase unwrapping [2], as well as ground height retrieval. According to the feasibility study reported in [2], the technique appears optimally suited for the new generation of satellite sensors such as TerraSAR-X (TSX) or COSMO-SkyMed (CSK), which operate with large bandwidths. Recently the technique has been used to derive ground elevation by processing interferometric pairs acquired in Spotlight mode by both TSX and CSK [3,4].
However, further potential applications are possible. In particular, the MCA can be used to explore the behavior of the SAR signal along frequencies to investigate the scattering mechanism involved in the interaction between the microwave radiation and the soil. According to this analysis, targets behaving coherently along the frequencies can be selected.
For instance, within the interferometric MCA scheme, the concept of frequency-persistent scatterers (FPS) is introduced according to the multi-frequency phase error, σΦ, estimated as the root mean square difference between the interferometric phases measured at the different frequencies fi and the corresponding values computed by the linear model [2]. This stability along frequencies explored by MCA is complementary to the temporal stability, which is at the base of persistent scatterers interferometry (PSI) techniques [5]. In PSI applications, stable targets are recognized as those exhibiting temporal stability through a stack of tens of SAR images. It is then natural to try to compare the two concepts, examining the assumptions which form the basis of the two definitions, and evaluating the respective characteristics of the two populations, with the final goal of ascertaining if any synergy can be identified between the two types of object, and how possibly to take advantage from the availability of both processing techniques.
In the same multi-frequency processing scheme, the complex coherence between different sub-band images of single SAR acquisitions can be computed, leading to the measurement of the so-called spectral coherence [6]. A simple model shows that, in the presence of a random distribution of surface scatterers, this spectral coherence is proportional to the degree of sub-band intersection of the considered sub-band images. Consequently, for this ideal distribution of scatterers, spectral coherence should be unity for completely overlapping sub-bands, and fall to zero when sub-bands are completely disjointed. This model is fully verified when observing spectral coherence on open sea areas corresponding well to the scatterer distribution under concern. If scatterer distribution departs from this basic distribution, spectral coherence may be preserved in some cases. In particular spectral coherence is expected to stay high and stable for point scatterers (e.g., related to manmade structures), whatever the gap between the sub-images central frequencies. Therefore, spectral coherence appears to be optimally suited for vessel detection.
It must be noted that high spectral coherence of a scatterer in a given acquisition does not necessarily ensure temporal stability, which is instead required for interferometric processing. Consequently, the population of spectrally stable scatterers within an acquisition must not be confused with FPS population, which is a product of the standard interferometric MCA processing devoted to PU as well as ground height retrieval.
Spectral analysis of SAR images for target characterization has been already experimented in the past. For instance, in [7], a time-frequency analysis is proposed to derive the backscattering properties of pixels in high resolution SAR images. Four classes of canonical targets are defined and the behavior of their typical spectrograms is characterized. In [8], point-like scatterers are detected according to either the correlation coefficient or the entropy computed between two sub-look images. The detection of point-like scatterers is performed without including any temporal assumption. A similar approach, but taking into account the temporal axis in the detection, is introduced in [9] in the framework of multi-temporal interferometry. Finally, coherent scatterer detection by exploring the sub look images through a generalized likelihood ratio test has been recently proposed in [10,11] respectively for monitoring of urban stability and ship detection.
In this work, we experiment target analysis by exploring the information content of several sub-look SAR images through the MCA performed both on interferometric pairs and on a single images. The former configuration is used for deriving a FPS population to be compared with “temporal” coherent targets (PS) from PSI, in order to investigate the scattering properties of the two populations. The latter is, instead, used for testing the potential of spectral coherence in vessel detection. The experiments are carried out by processing two datasets consisting of both stripmap and spotlight SAR scenes, acquired by TSX over an area around the city of Venice (Italy).
The paper is organized as follows. In Section 2, the SAR data available for the experiments are presented. Section 3 is dedicated to the comparison between FPS and PS. The application of MCA spectral coherence to vessel detection is presented in section 4. Final comments are provided in the last section.
2. SAR Data
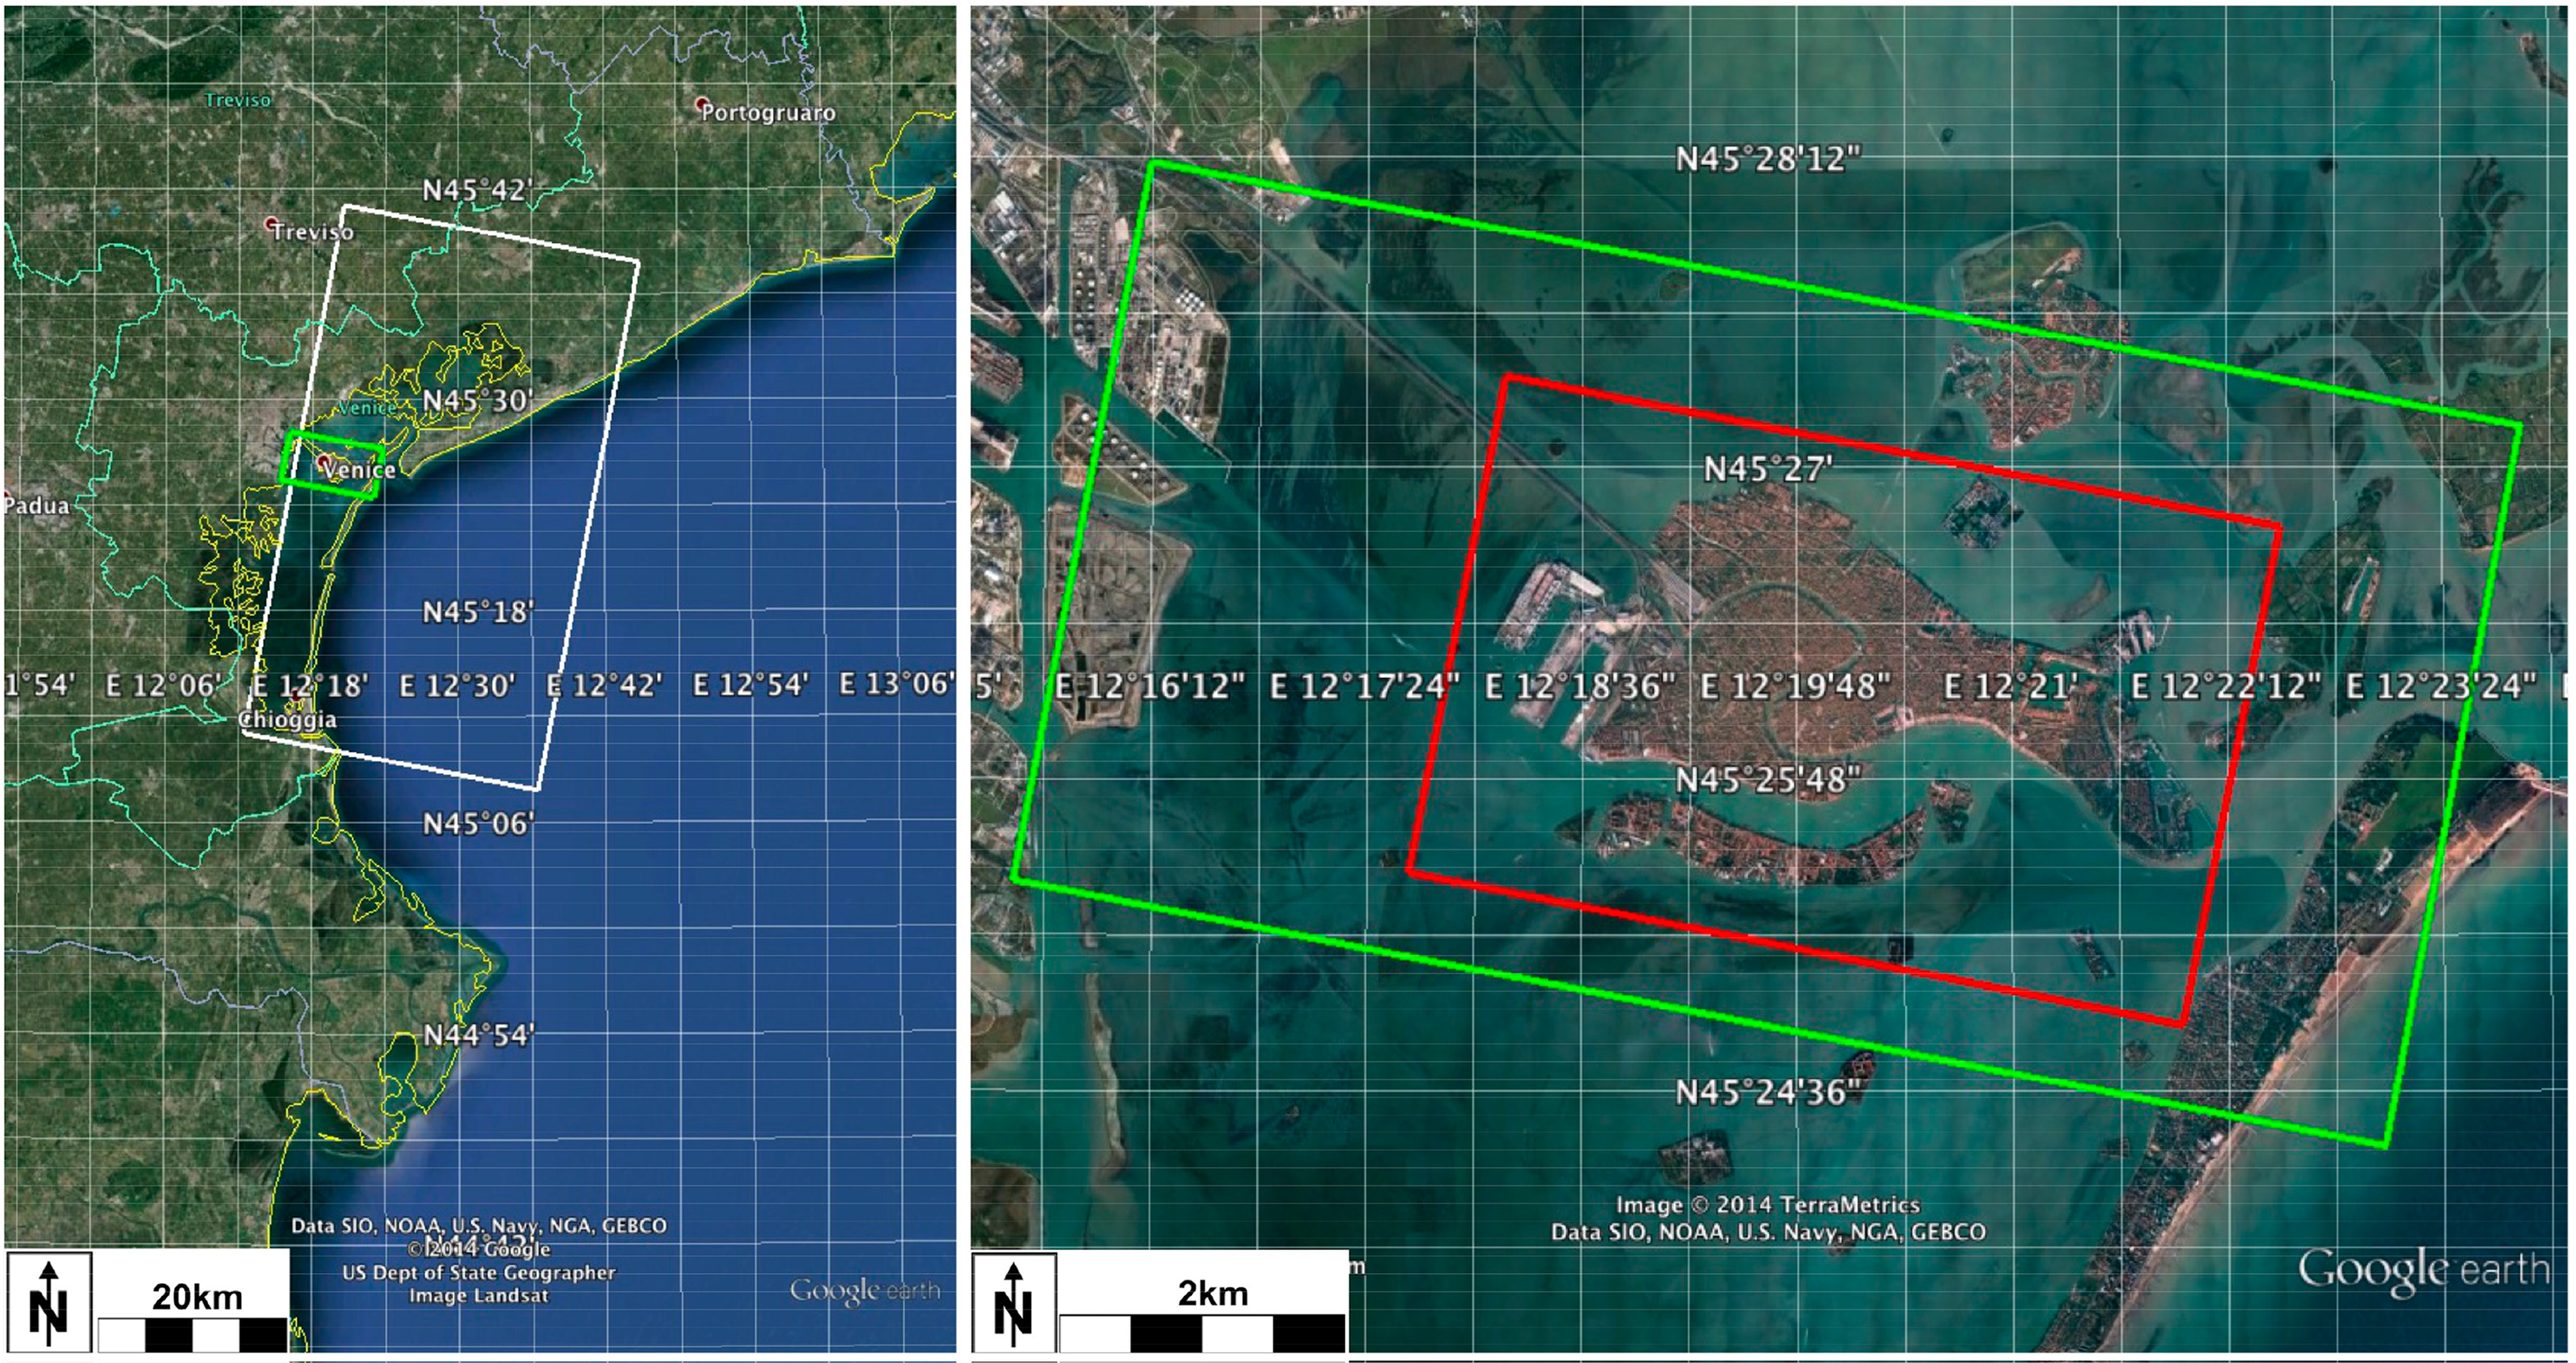
In order to perform our experiments, we selected two datasets consisting of both stripmap and spotlight SAR scenes, acquired by TSX over an area including the city of Venice (Italy). The test site was selected with the aim of experimenting both MCA applications. The scene includes the Venice town surrounded by the lagoon water. The high density of buildings in the Venice urban area is ideal for detecting stable scattering objects, and consequently for exploring the presence of both PS and FPS, while the presence of the surrounding lagoon, with its dense vessel traffic, is optimal for the vessel detection experiments. The Stripmap dataset consists of 26 single-look TerraSAR-X images acquired between 5 March 2008 and 16 December 2008, along descending orbits with a processing bandwidth of about 126 MHz, at an incidence angle in the range [27.2, 30.3] degrees and with HH polarization, and is suitable for PSI processing. The spotlight data, instead, provide the wide band needed for MCA [2]. The spotlight time series has been selected by searching for images acquired with both radiometric and geometric parameters close to those of the stripmap dataset, in order to guarantee the same scattering mechanisms for both FPS and PS targets. The spotlight dataset consists of four images acquired along descending orbits with HH polarization, with incident angles in the interval [29.4, 30.3] degrees. Figure 1 shows the ground coverage of the SAR datasets, as well as the area of interest (AOI) selected for the processing. Since the AOI is located at far range of the stripmap frame, considering the above-mentioned intervals, the incident angles of stripmap and spotlight are expected to be very close. Starting from the four spotlight images, three representative interferograms have been selected for the MCA processing, obtained by coupling the closest images in terms of temporal baseline. Table 1 reports relevant information for these three image pairs.
3. Frequency Coherent Target Investigation
This section is devoted to the comparison between the concept of frequency-stable targets (FPS), i.e., objects exhibiting interferometric stable radar returns across the frequency bandwidth Be explored by MCA, and the concept of temporally-stable targets (PS) identified by PSI techniques. Both spotlight and stripmap TSX images acquired on the Venice test site have been processed to identify FPS and PS targets by using, respectively, the standard MCA processor described in [4] and the PSI processing chain SPINUA [12].
3.1. MCA Processing for FPS Selection
From the three interferometric spotlight pairs in Table 1, we derived 3 FPS populations. All the spotlight images were coregistered w.r.t. the reference image acquired on 27 April 2009, to allow direct comparison of the final results. For each pair, the bands of the co-registered master and slave images were split to generate a stack of sub-band images, and consequently a stack of sub-band interferograms. Then, for each pixel at range r and azimuth x, a linear regression of the sub-band interferometric phase Φ along frequencies is performed, which estimates the intercept C0 and the slope C1 of the linear model fitted on the data, and the phase standard deviation σΦ [2]:
The accuracy of FPS selection depends on both the reliability of the MCA processing and, the threshold value. These issues have been fully assessed in [2,4]. In particular it was proved, both theoretically and by using real SAR data, that a reliable MCA processing requires large range bandwidth (B > 200 MHz), and according to this outcome, we selected spotlight acquisitions (B = 300 MHz) (Section2). Concerning the processing parameters, several configurations are possible depending on the explored bandwidth (Be) and the number of sub-band images (Nf). The threshold value which guarantees a reliable coherent target selection depends on both Be and Nf, and it decreases as Be or Nf decreases. The optimal parameters used for the MCA processing in the present case are: Bp = 30 MHz, Nf = 9, Be = 240 MHz. For each pair listed in Table 1, the FPS map was obtained by using . These processing values were derived, according to the procedure described in [4], by exploring the reliability of C0 estimations, which are related to the interferometric fringe distribution.
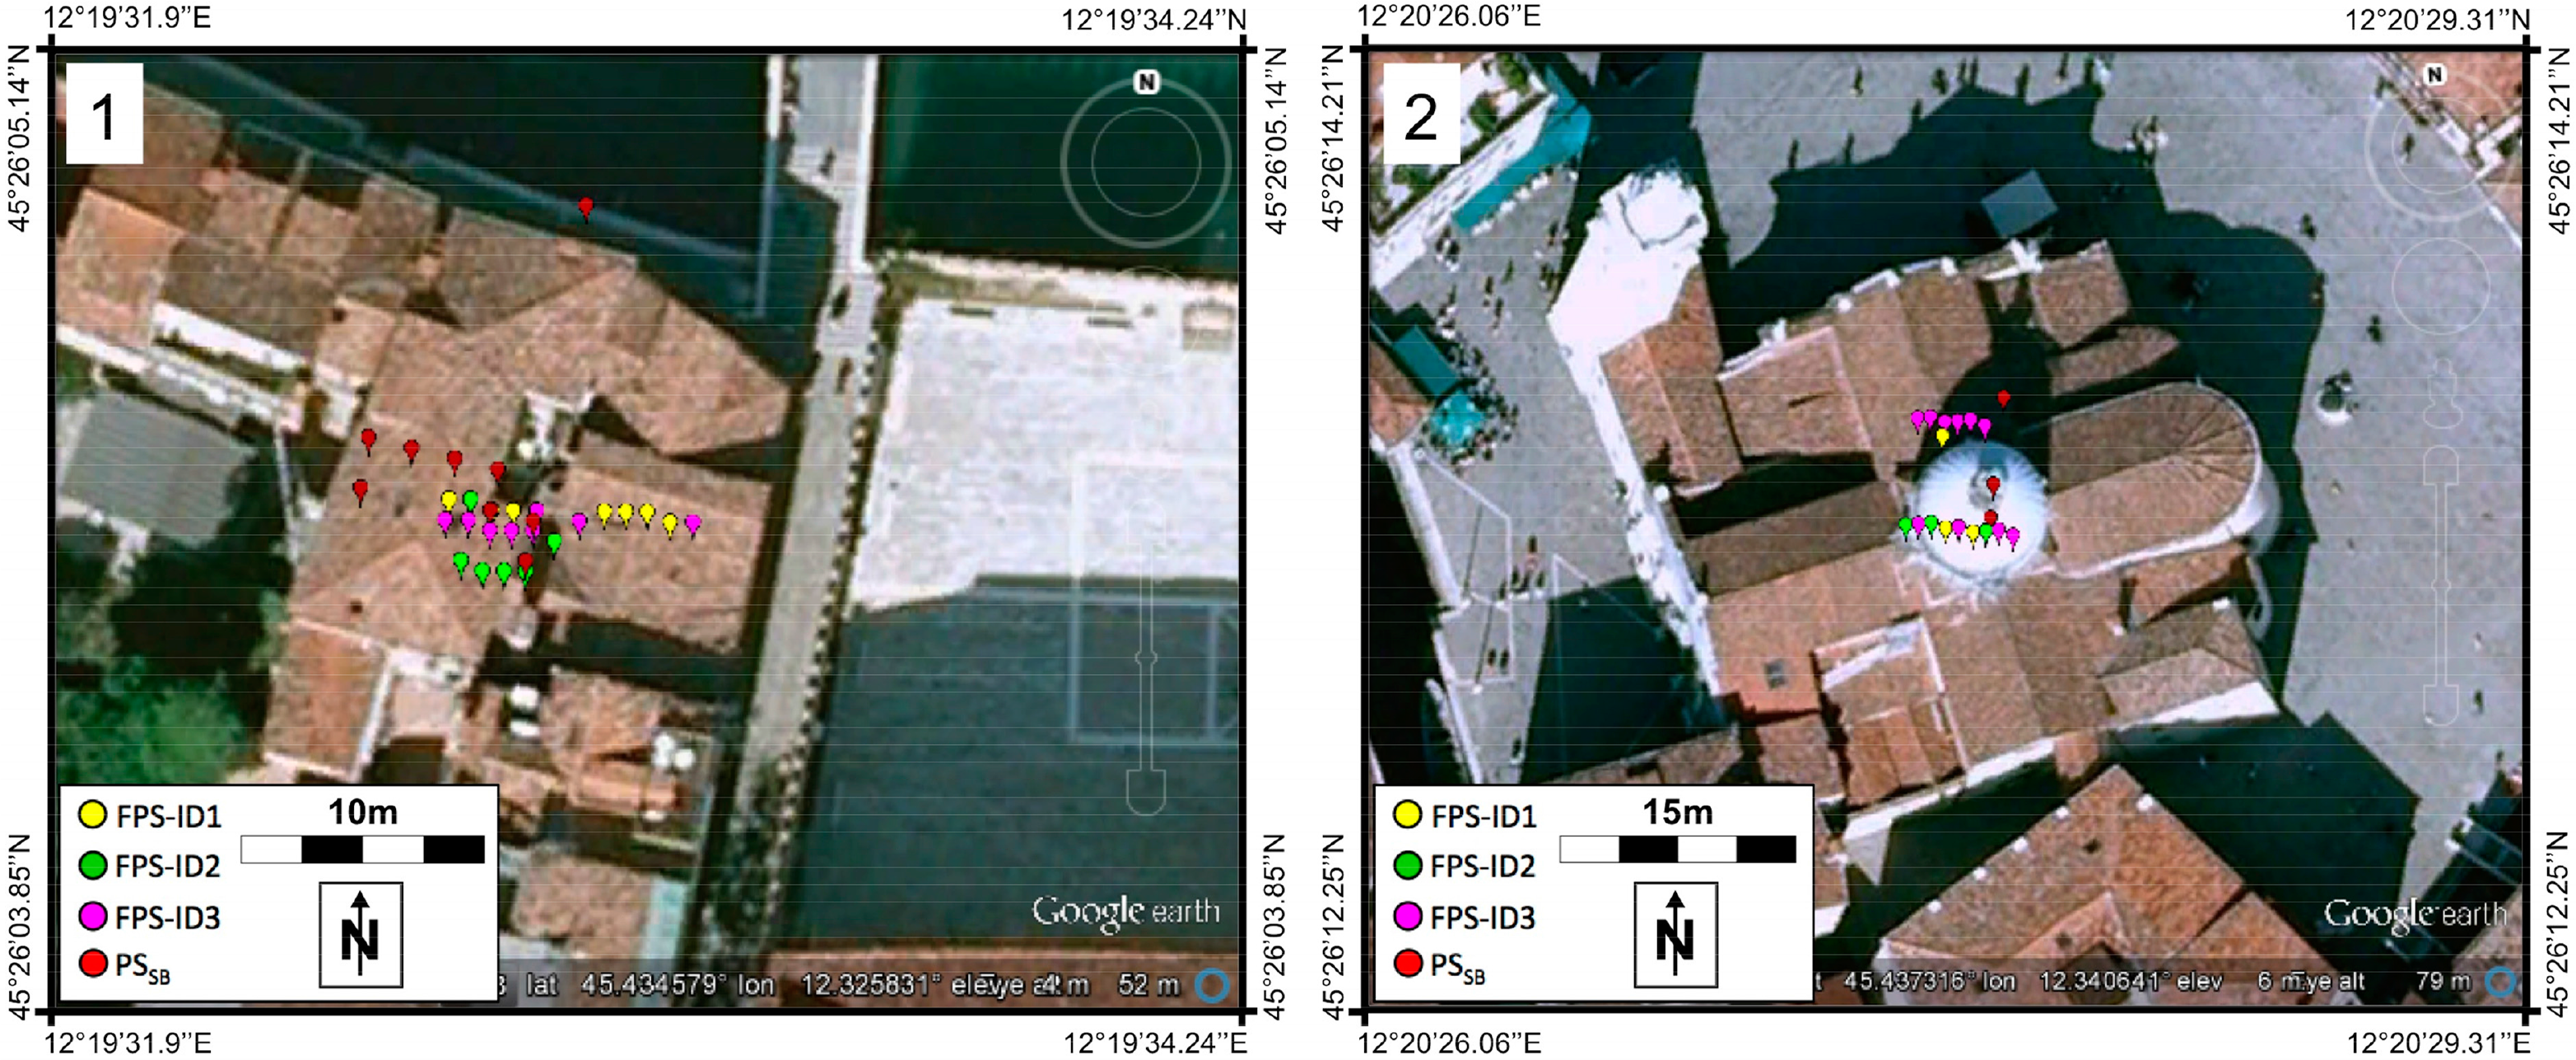
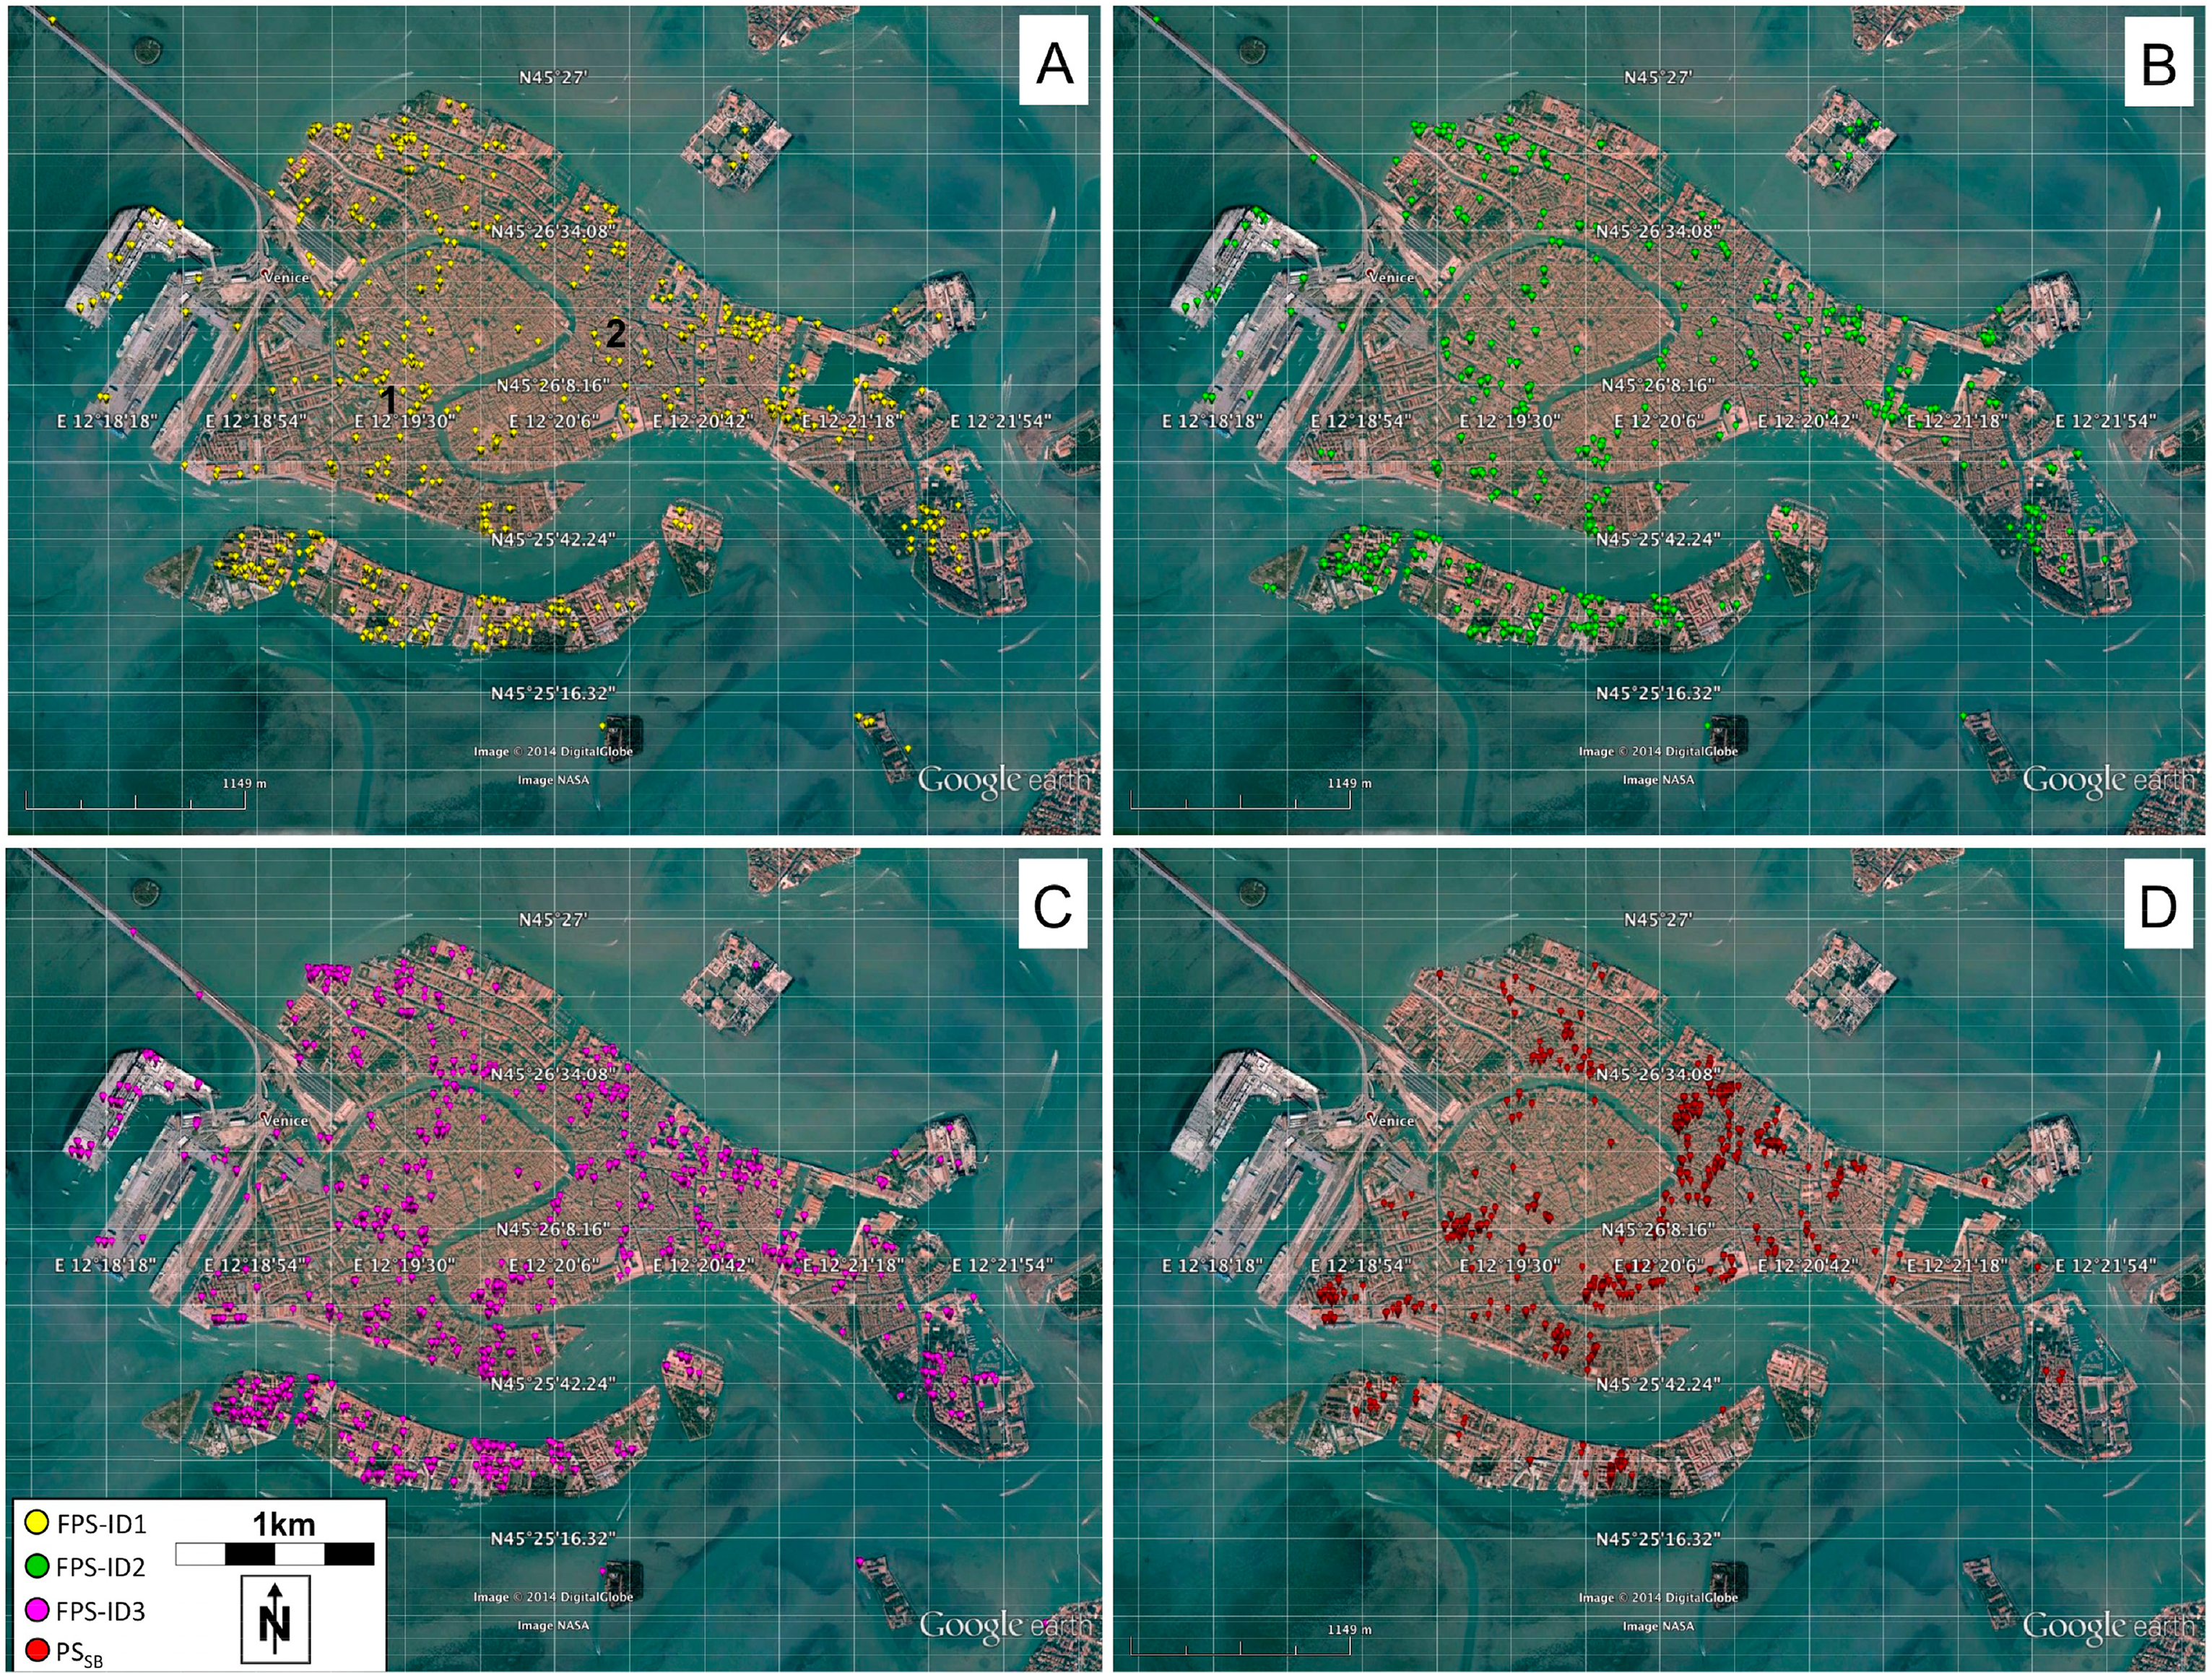
Since all the spotlight images used for the MCA processing were co-registered with respect to a reference master, all the MCA products are available as raster products sharing the same geometry. Hence, comparison among all FPS populations is straightforward and does not require any further geolocation procedure. The spatial distribution of the three FPS populations is sketched in Figure 2 (the colors yellow, green and magenta refer respectively to InSAR pairs ID-1, ID-2 and ID-3) superimposed on an optical image from Google Earth engine. The FPS spatial distributions look very similar in the three cases. FPS are distributed quite homogeneously over the Venice urban area. The absence of FPS on the sea confirms the reliability of the selection.
3.2. PS Selection
In order to derive the PS target population over the AOI, the stripmap dataset was processed by using the PSI SPINUA algorithm [12]. PS selection is usually performed by exploring the so-called temporal coherence, γ, which measures the adherence of each image pixel to the assumed ground deformation, residual topography (also known as DEM error), and atmospheric contribution:
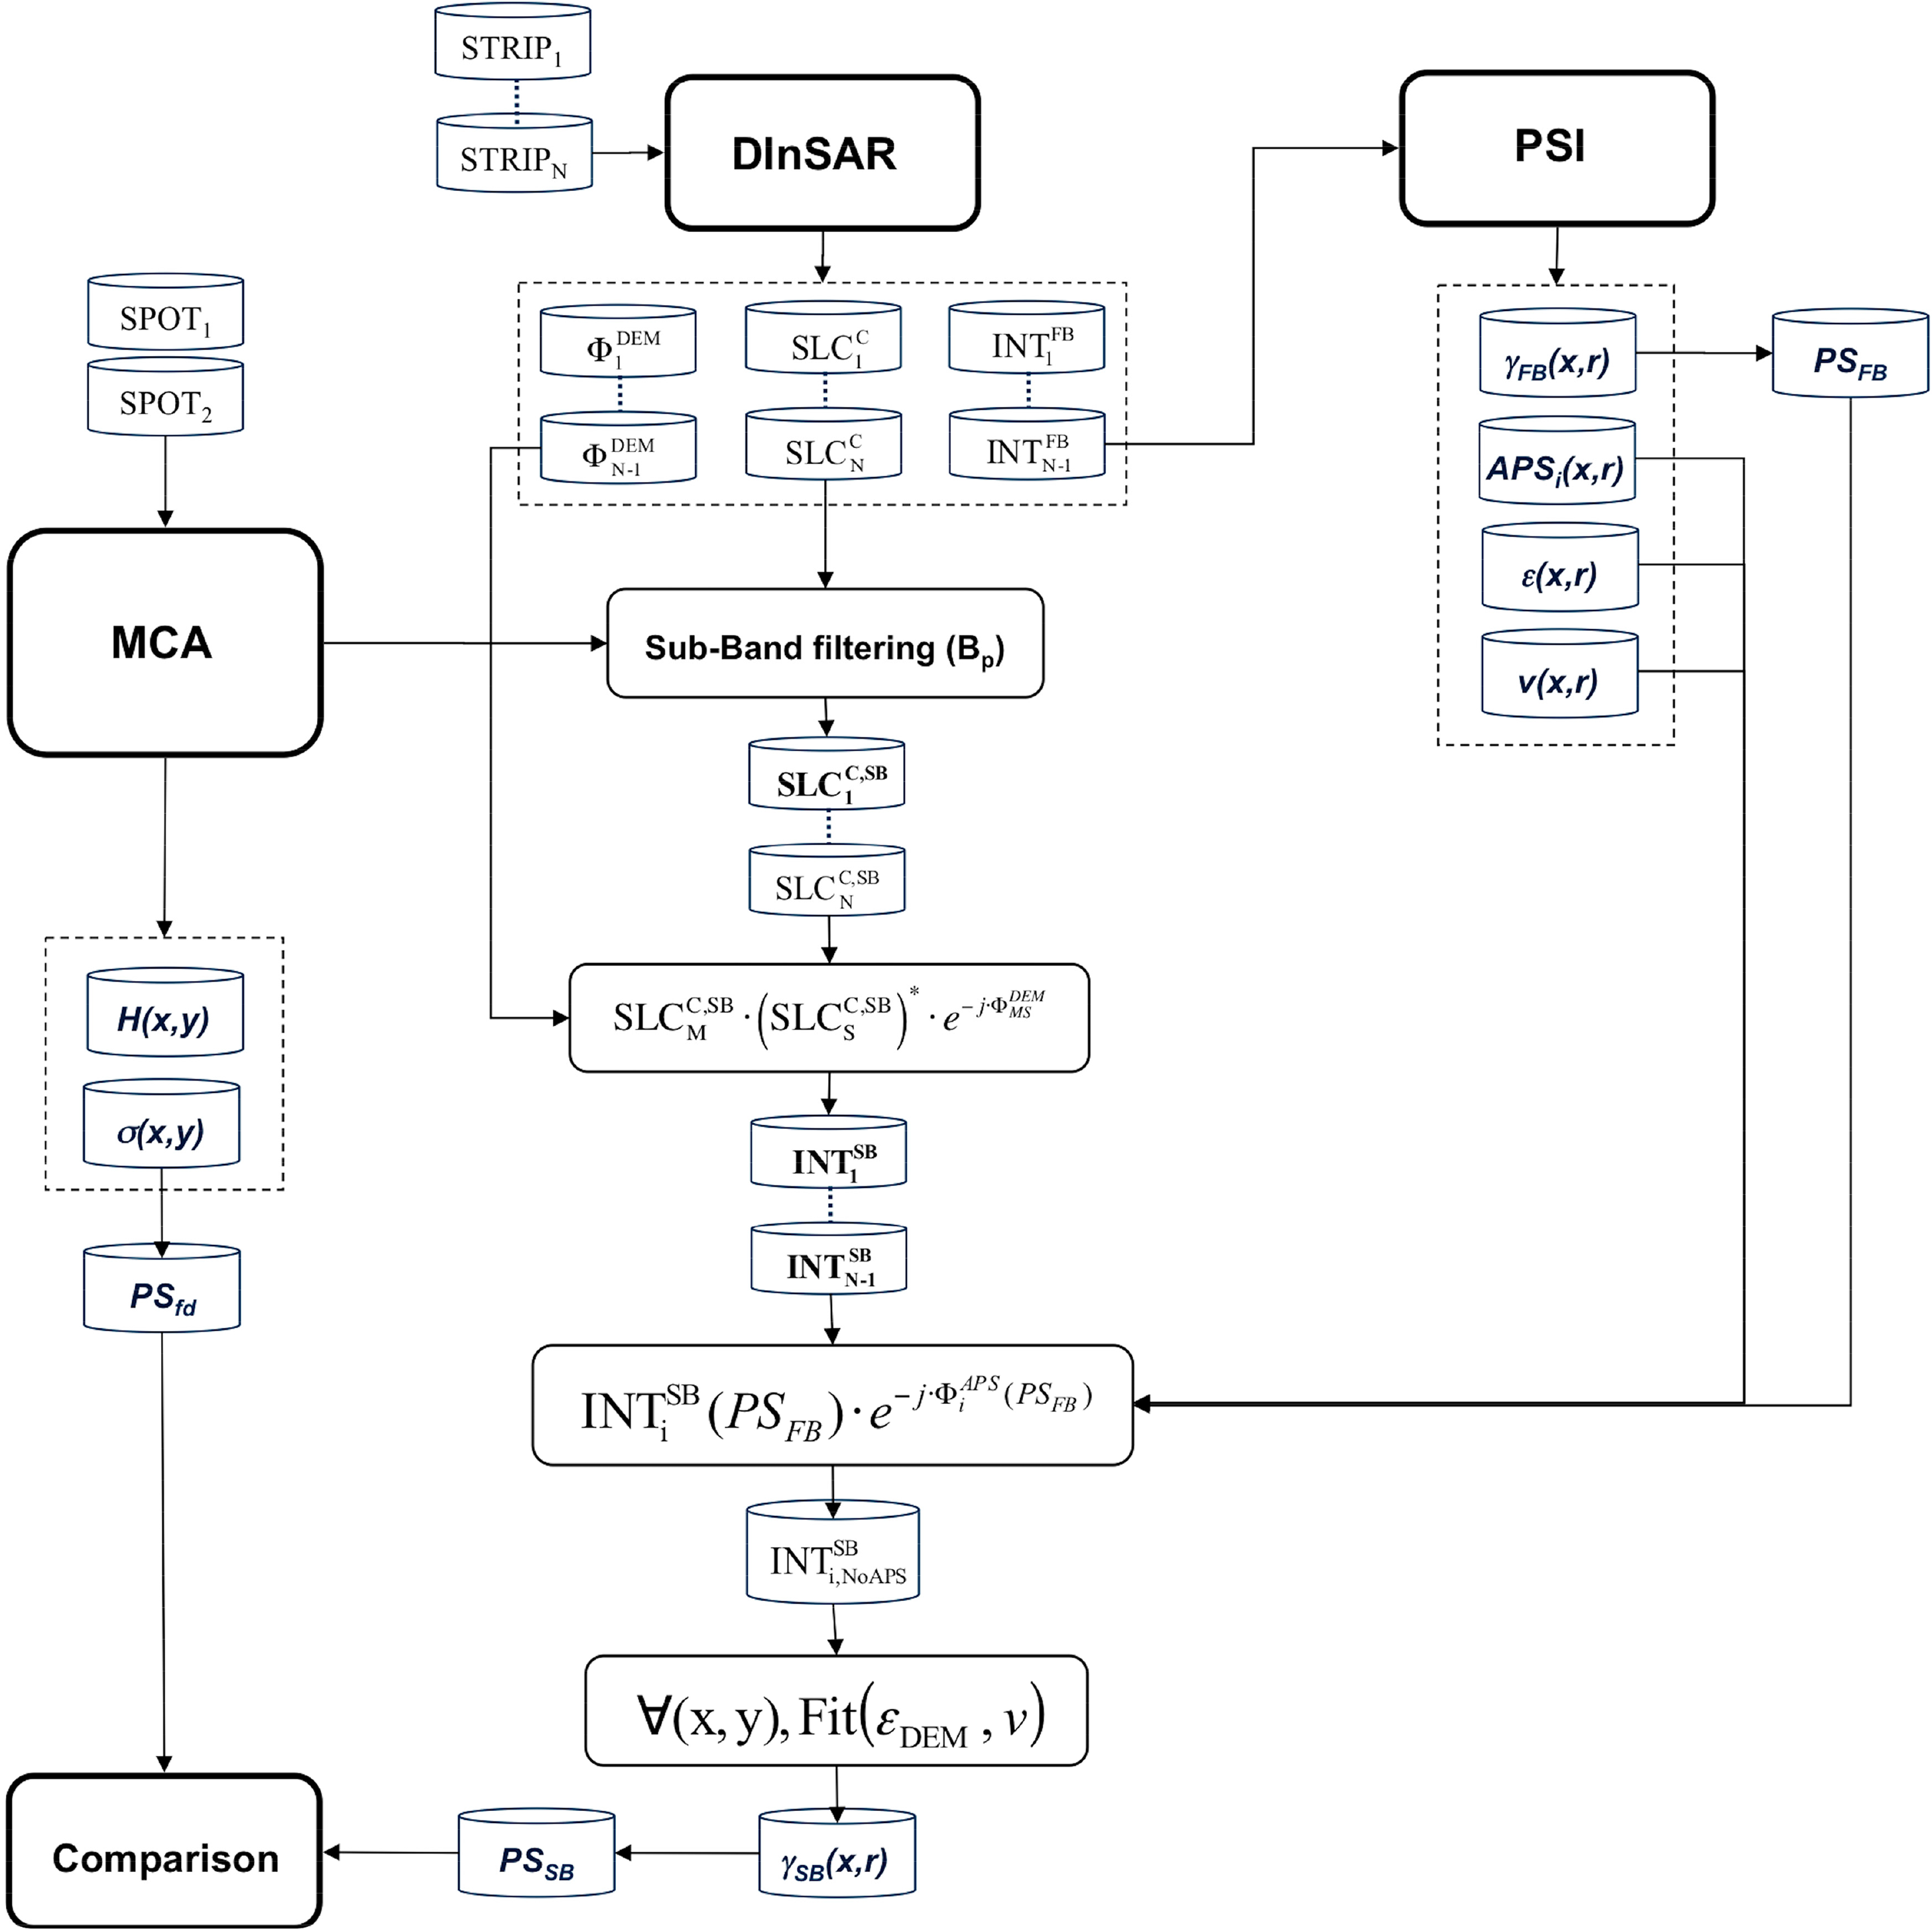
In order to perform a reliable comparison with respect to the FPS, it is necessary to take into account the resolution loss affecting the MCA products according to the sub-band bandwidth Bp used for the processing. A reduction of the spatial resolution corresponds to an increase in the ground area corresponding to each image pixel, and therefore of the clutter contribution to the backscattering with respect to the dominant scatterer in each pixel behaving as persistent scatterer. Therefore, a decrease of the number of temporal PS is expected, if only a portion Bp of the whole range bandwidth is processed as in MCA. In view of these considerations, and starting from the available full-band PSI products, we derived, by using the same sub-band bandwidth used by the MCA processing, a set of PS. Hereafter, the products derived at sub-band will be identified by the label SB, while those derived at full-band by the label FB. We developed an ad hoc processing scheme, sketched in Figure 3, to estimate approximately the PSSB population, by using the estimates of the atmospheric signal and the temporal coherence performed at full band, thus avoiding to perform the whole PSI processing (which requires time and computational resources) for the sub-band images stack.
In the hypothesis of a reliable inference of the signal components, the contribution of processing inaccuracies can be neglected, and the temporal coherence provides an estimate of the phase noise affecting the target. This noise component depends on both the spatial resolution, and the ground surface characteristics, which define the scattering mechanism. In order to compute the temporal coherence, or, equivalently, the residual phase noise at sub-band, first a stack of sub-band differential interferograms ( ) is generated: the full-band co-registered SLC images are band-pass filtered, by using a bandwidth Bp centered on the chirp carrier frequency. Then, in the assumption that {PSSB} ⊂ {PSFB}, a set of PSFB is selected according to a certain temporal coherence threshold: PSFB = {(x,r)|γFB(x,r)≥γth}. The interferometric sub-band phase of each full-band coherent target ( ) can be then rephased by removing the DEM error, the target displacement rate and the atmospheric contribution estimated through PSI at full-band. In the present test case, characterised by urban ground coverage, while the atmospheric signals estimated at full-band can be assumed to be practically the same also in the case of SB processing due to their spatial smoothness, the DEM error values can change, since the scattering center can change its position within the resolution cell, which is wider at sub-band. In case of very local displacements affecting urban structures, changes can also occur to the target displacements velocity values, which are smoothed as the resolution cell size increases at sub-band. Therefore, the interferometric sub-band phase is first rephased by removing the full-band atmospheric signal estimated for each interferogram, then, for each PSFB, the target displacement velocities and DEM errors are estimated at sub-band. The final residual phase is derived for each PSFB pixel by using the atmospheric signal derived by the full-band processing and the new estimations of the target velocity and DEM error computed at sub-band. This residual phase, known for each PSFB pixel, is used to compute a new coherence map at sub-band, γSB(x,y). Then, the sub-band set of persistent scatterers is obtained as PSSB = {(x,r)|γSB(x,r)≥γth}.
According to this processing scheme, the stripmap dataset was processed by using the same sub-band bandwidth of 30 MHz selected for the MCA processing. The temporal coherence measured in the case of the sub-band processing decreases strongly, leading to values even lower than 0.4, while the minimum coherence value for the full band coherence is 0.95. A threshold of 0.95 for the coherence was used to select the persistent scatterers for both the full-band and the sub-band processing. The PSFB populations consists of 86,000 pixels covering the entire Venice urban area, while, as expected, the number of PS detected at sub-band decreases considerably, being only about 1.5% of those from full band processing. Basically, PSSB are organized in clusters located in areas where the ground conditions are less sensitive to the resolution loss.
3.3. Comparison of FPS and PSSB Populations
In order to compare the FPS populations with the PSSB population, which come from different datasets, we projected both final point cloud products on a common geographic coordinate system WGS84. Figure 2 shows the spatial distribution of the three FPS maps and the PSSB. Yellow, green and magenta dots refer to FPS from InSAR pairs ID-1, ID-2 and ID-3, respectively, while PSSB are represented by red dots. The spatial distributions of the two classes of objects are quite similar. In particular, several areas on the ground show both PSSB and FPS. There are also areas where only one of the two kinds of scatterers is present. This depends on the characteristics of the predominant scattering mechanism in the area. Close-ups of FPS and PSSB clusters over urban a few structures are provided in Figure 4. Clustered detections are sometimes visible. This effect could be due to the mixing of signals backscattered by neighboring urban structures. A possible improvement in the detection can be provided by the approach proposed in [13] used to eliminate the contribution coming from side lobes.
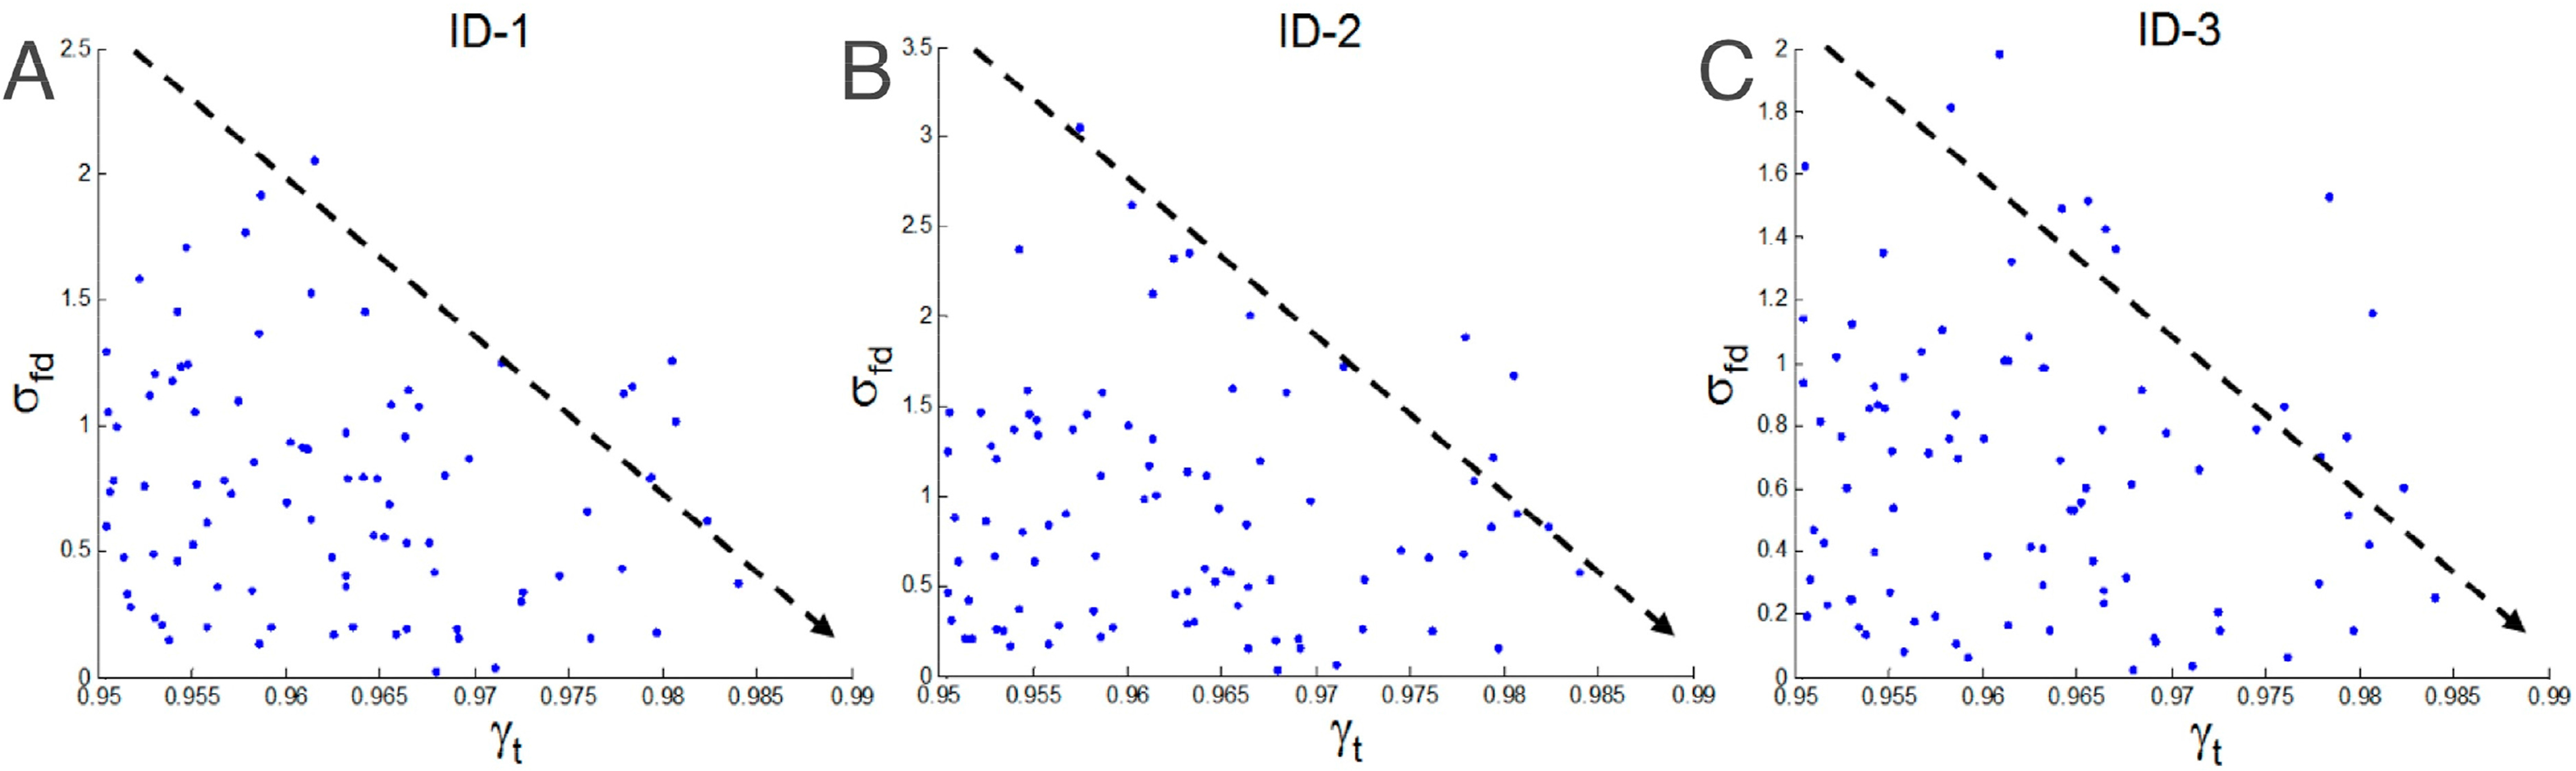
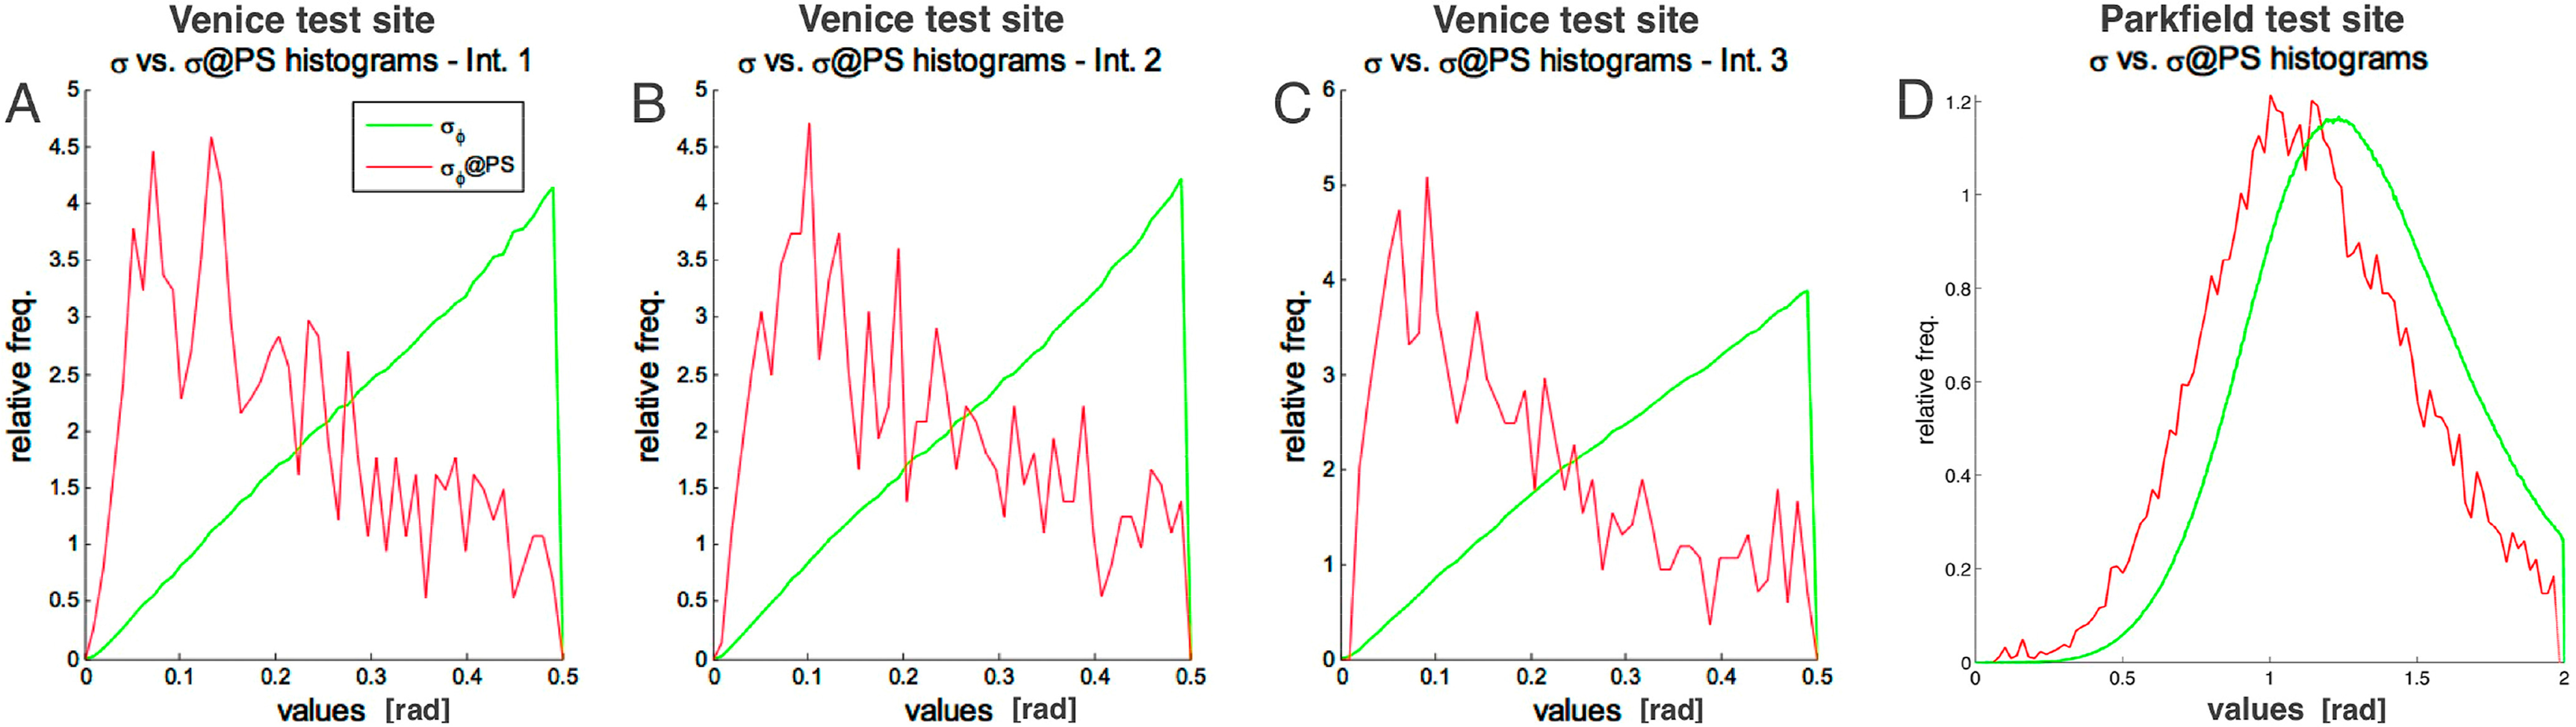
To investigate the characteristic of the populations, we compared the values of the figures adopted for their selection: σΦ and γ Figure 5 shows, for the three InSAR pairs, the scatter plots of MCA σΦ vs. γ, computed for those pixels selected as PSSB. It can be seen that, as the coherence increases, the maximum MCA σΦ decreases, meaning that a threshold on the temporal coherence γ ensures low values of the MCA variance σΦ. We also computed the MCA σΦ for all the pixels, and then for those pixels selected as PSSB ( ). The normalized distributions of both σΦ and are sketched in green and red in Figure 6 (plots A, B, C refer respectively to the InSAR pairs ID-1, ID-2 and ID-3). It is interesting to observe that the distribution has a maximum centered around low σΦ values, meaning that the PSSB selection is also effective in isolating FPS targets. More specifically, we can say that, in the case of the Venice test site, the PS selection criterion also selects pixels with low MCA phase variance with respect to the others. Of course, PS pixels occur also where the MCA phase variance does not guarantee sufficient coherence in the frequency domain. As we discuss later, this depends on the scattering properties of the resolution cell.
These results can be fruitfully compared to previous results obtained using 33 COSMO/SkyMed Spotlight images acquired over an area around Parkfield (California, USA). Differently from the Venice test site, where the land is covered mostly by urban structures, the Parkfield test site shows a surface coverage consisting mainly of bare soil, which makes distributed scattering the most common scattering mechanism. Results presented in [14] show that frequency coherent targets are located mainly on, or close to man-made structures, while temporally-coherent targets are numerous and located also over bare soil. In the case of the Parkfield test site, the difference between PSSB and FPS populations indicates that the criterion on temporal coherence, adopted by PSI, and that on the frequency coherence, adopted by MCA, seem to select different backscattering properties, which lead to not comparable pixel populations, differently from what experimented in the case of Venice test site.
This can be further confirmed by looking at the normalized distribution of the MCA σΦ for the Parkfield test site, computed, as for the Venice test site, for all the pixels, and then for those pixels selected close to PSSB (Figure 6D). In fact, the distribution of σΦ over the PSSB points (red line) has a shape similar to that of all the pixels (green line), with only a slightly lower mode. Therefore, in this case, we can conclude that temporal coherence and frequency-coherence are unable to select comparable pixel populations, differently from what experimented in the case of the Venice test site.
These results can be interpreted in terms of the spectral analysis performed by the two techniques. By definition, a PS is a pixel behaving coherently along the analyzed stack of images. This implies a persistence of the backscattered signal along time, as well as along the different orbital positions defined by the spatial baselines. Thanks to the well-known wavenumber shift principle [15], to each position, or, equivalently, each look angle (θ), corresponds a specific ground reflectivity spectral frequency investigated. Thus, for the PS approach, the ground reflectivity bandwidth explored ( ) depends on the range of spatial baseline values, B⊥, of the interferometric stack:
This means that the temporal PS stability condition does not necessarily imply frequency stability within the whole bandwidth, and consequently only a fraction of the targets selected as PS would behave coherently along the wide bandwidth explored by the MCA. This fraction depends on , ΔB⊥ and on the scattering mechanisms involved by the land cover. For the Venice test site, where the urban setting guarantees point-like scattering, the FPS and PSSB populations are quite similar. On the contrary, for the Parkfield test site, where the land cover is characterized mostly by bare soil, distributed scattering dominates and consequently only a small number of targets is common to both populations. According to these results, MCA can be used to investigate the scattering mechanism involved in the interaction between the microwave radiation and the soil, in parallel to other image analysis techniques devoted to target classification.
4. MCA for Vessel Detection
The previous sections have shown how splitting a single wide-band SAR acquisition into chromatic views allows analyzing phase stability of scatterers with respect to wavelength (or with central carrier frequency) to detect spectrally stable scatterers. This phase stability may be estimated performing a classical coherence measurement between only two spectral sub-views, as is done in classical InSAR between two acquisitions. In practice, the interferometric phase is demodulated taking into account the central frequency shift between sub-bands before coherence estimation. It has been shown [6] that this spectral coherence is related to local scatterers distributions and scattering processes, thus being a promising tool for classifying scene features in a single acquisition. The simple coherence model developed in [6] shows that, for uniformly distributed, uncorrelated surface scatterers, spectral coherence is strictly equal to the proportion of sub-band superposition:
Therefore, for this kind of scatterers, spectral coherence should fall linearly from 1, for complete overlapping, to zero for non-overlapping sub-bands. If scatterers distribution departs from that typical of fully-developed speckle, spectral coherence may be preserved to a certain degree even for low or null degrees of sub-band overlap, depending on the divergence with respect to this ideal distribution.
This aspect was investigated in the frame of a targeted application, i.e., vessel detection in the frame of maritime surveillance. This topic is part of Europe’s seventh Framework Programme (FP7) security theme, devoted to intelligent surveillance and border security, including coastal borders and wide critical maritime areas. Spectral coherence is expected to be a good additional indicator for this purpose. Open sea can be assimilated to a uniformly-distributed, uncorrelated surface, while man-made structures like vessels can be considered as a set of scatterers very far from this distribution, and thus prone to be spectrally coherent. Consequently, in a single acquisition, spectral coherence between small-overlap SBs on water bodies and sea surface will be negligible, while it is expected to be well preserved on man-made structures; in this case, vessels.
Nowadays, typical maritime surveillance systems based on SAR imagery consist of several stages [16]: land masking, pre-processing, pre-screening, discrimination. Land masking allows restricting the area of interest. Pre-processing consist generally in performing some speckle filtering to ease detection of wakes or targets. Pre-screening is the detection process in itself, while discrimination scores potential targets and performs a selection of those considered as ships, minimizing false alarms, based on specific criteria.
Advantages of SAR for maritime surveillance are evident: Space-borne SAR sensors offer all-weather, day/night observations and cover generally wide areas with medium to high resolution [16–19]. With the increasing need of maritime surveillance, particularly for maritime security and safety, SAR imagery is now widely used as an important information channel in near-real time operational ship monitoring systems, e.g., the Ocean Monitoring Workstation (OMW), the Alaska SAR Demonstration (AKDEMO) system or the European Community Joint Research Centre (JRC) system [17]. In each of these monitoring systems, ship detection based on the SAR intensity channel is used as a prescreening system. Potential targets are localized either automatically or through a simple visual inspection of SAR images, before or after σ0 calibration [17].
At pre-screening level, interferometric method have already been proposed by Arnaud [19]. It is based on azimuth sub-looking of SAR images in order to generate two SAR scenes from a single acquisition. Selecting two non-overlapping parts of the azimuth spectra allows generating a “front” and a “rear” image of a given scene separated of a few milliseconds and observing the scene along two different squint angles. Performing an interferometric processing of both sub-looks and measuring local coherence allows detecting features having a temporal phase stability longer than the time lap between sub-looks and keeping a stable phase response with azimuth viewing angle. On maritime scenes, sea clutter has a short temporal coherence and a rapidly varying phase response with viewing angle. Therefore, coherence between azimuth sub-looks allows segmenting sea clutter from stable targets. At discrimination level, a coherence threshold, in line with a backscattering intensity threshold can be used to score stable targets and help in locating vessels. However, if the target is moving, they will have different phase history in both looks and be focused with wrong Doppler centroid and Doppler rate. As a consequence, a moving target will be defocused and shifted differently in both looks. This will also lead to a coherence loss on the target. Consequently, this interferometric technique may fail in case of moving targets [20].
Ouchi proposed a similar technique, however not using the phase information, in which a measurement of a correlation coefficient between multilook intensity images is used to perform pre-screening [21,22].
Spectral coherence is proposed here as an additional detection or prescreening technique using the phase information channel of SAR acquisitions. In its principle, the proposed method is similar than the one proposed in [19] while working along the range spectral dimension in place of the azimuth one. In addition to offering a large spectral diversity, working on the range spectrum allows also to alleviate the above-mentioned problem of moving targets.
In [11], sub-look coherence, here named spectral coherence, is also mentioned as being a candidate technique for vessel detection, in line with other techniques, namely sub-look cross-correlation, sub-look entropy and Generalized Likelihood Ratio Test (GLRT). The two last ones are using several sub-views issued from non-overlapping or partially overlapping spectra to improve the detectability of vessels candidates. In this paper, as discussed hereafter, we also intent to use spectral coherence between several sub-band splitting scheme as a prescreening technique.
4.1. Spectral Coherence Definition and Model Validation
The aim being to detect spectrally stable targets, we can consider that, with respect to the developed model, the important point is to compute spectral coherence at a sub-band separation bigger than the sub-band bandwidth, the carrier frequency of the master sub-view being of less importance. Two parameters drive thus the process: the sub-band bandwidth and the frequency gap between sub-bands.
Therefore, the process algorithm we developed is designed to compute spectral coherence at constant gap, with several values of the center sub-band frequencies. In this way, for a given frequency gap, several spectral coherence images may be computed and averaged to increase signal to noise ratio. The developed processor computes the geometrical and arithmetical averages for all possible spectral coherence images relative to a given frequency gap. In addition, intensity images issued from each sub-band and their average are also computed, in order to have several measurements at hand to evaluate the ability of using spectral coherence in a prescreening process for vessel detection and maritime surveillance.
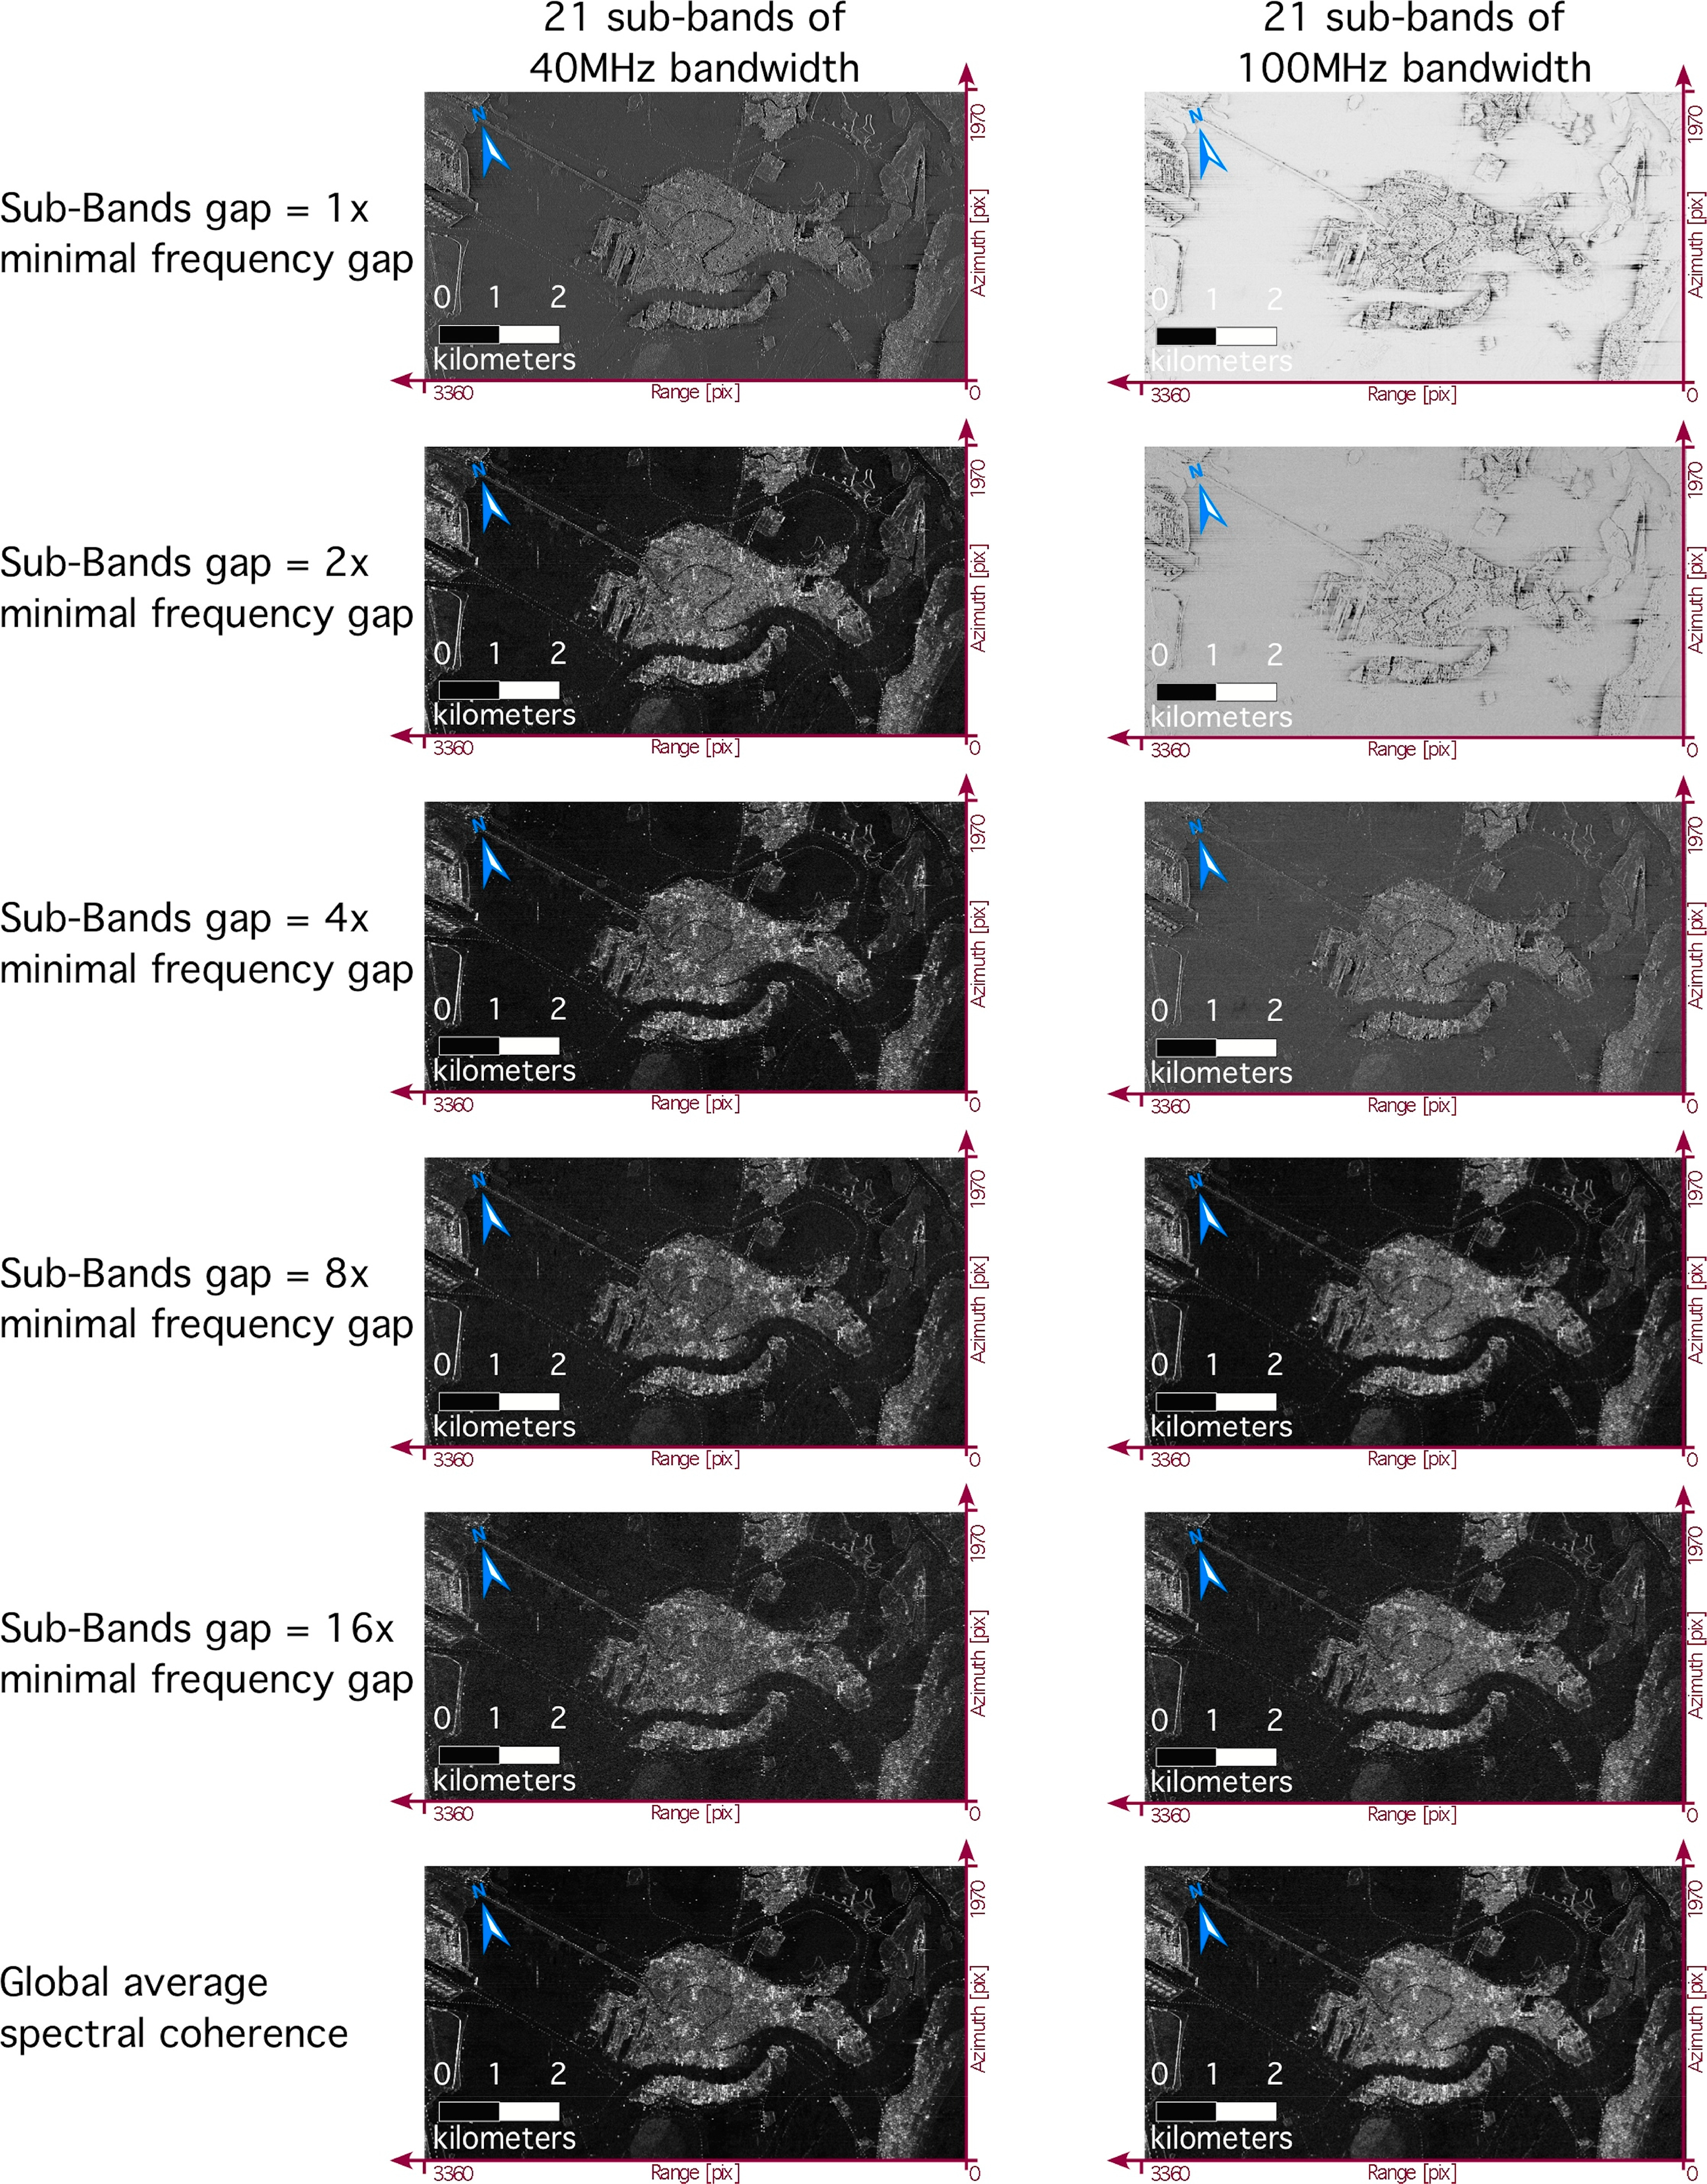
In the present experiment, the 4 TerraSAR-X spotlight images listed in Table 1 have been used. All images were co-registered with respect to the May 2009 acquisition, which was used to perform a first spectral coherence analysis. Two splitting schemes are presented hereafter: 21 SBs of 40 MHz width, and 21 sub-bands of 100 MHz width. In each case, spectral coherence was estimated using a moving window of 5 × 5 pixels and a box-averaging window of 3 × 3 pixels. Figure 7 shows average spectral coherence images computed at constant gap for these two splitting schemes. Five constant gaps are shown: 1, 2, 4, 8 and 16 times the minimal gap.
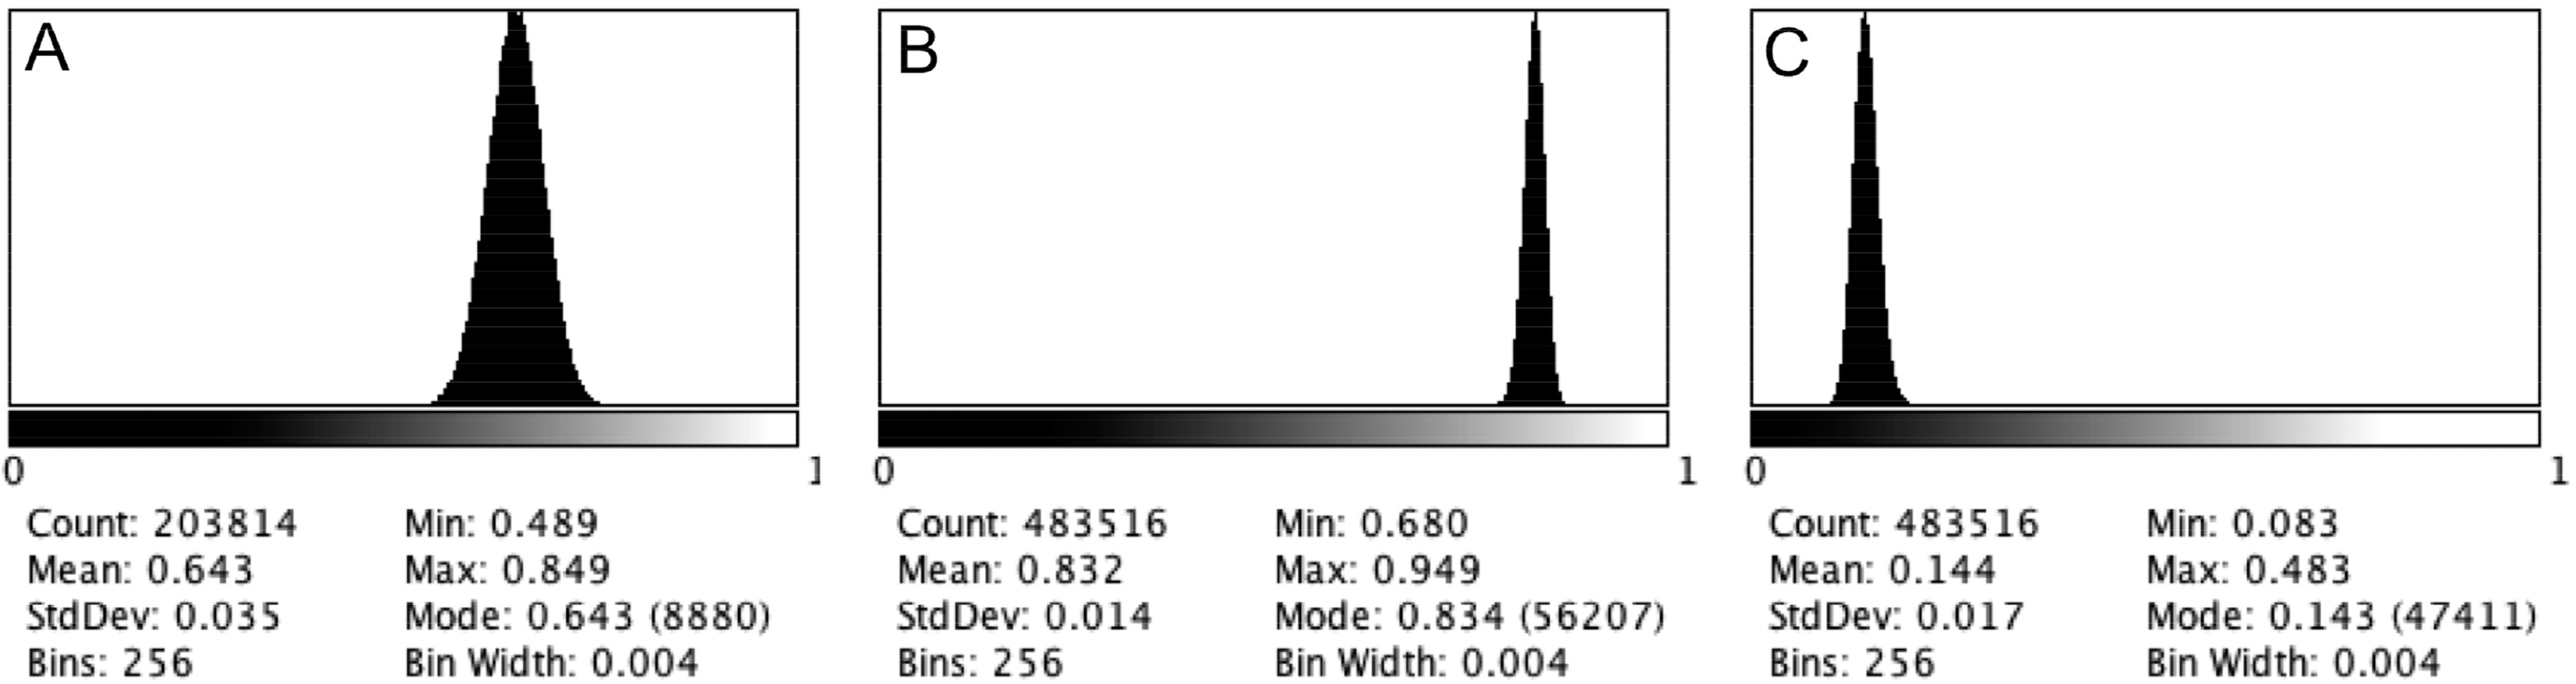
For the first splitting scheme, the minimal sub-band separation is of about 12.5 MHz (= (300 − 40)/21). Consequently, when the gap is the minimal frequency separation, sub-band overlap is about two thirds of the sub-band bandwidth. Therefore, there is a high correlation between sub-images everywhere, with a high spectral coherence on open sea surfaces. Spectral coherence histogram on open sea surfaces in Figure 8A shows a sharp peak centered on a value of 0.65, equal to the sub-band bandwidth overlapping, confirming fully the spectral coherence model developed in [6]. Spectral coherence standard deviation is σ = 0.035, confirming that for uniformly and randomly distributed surface scatterers, spectral coherence is strictly equal to sub-band overlap. It can be noted that on different scatterers distribution, i.e., on urbanized areas, point scatterers, or structured terrains, a higher spectral coherence is observed.
This behavior is much more pronounced in the second splitting scheme. In that case, minimal sub-band separation is only ∼9 MHz while sub-band bandwidth is 100 MHz. Consequently, if considering this separation as constant gap, sub-band overlap is about 90%; for this reason, spectral coherence appears very high everywhere on the scene. If considering for example a sub-band separation of 2 times the minimal sub-band gap, overlapping of SBs is of about 82%, which, with respect to the model, should lead to a 0.82 coherence on open sea surface (Figure 8B). However, in that case also, image areas with land cover that does not correspond to a random and uniform distribution of surface scatterers show a different, generally lower, spectral coherence than the one given by the model. As in the previous case, the spectral coherence level of these frequency-stable scatterers stays roughly constant whatever the gap, thus overtaking, for large band separations, the spectral coherence value on open sea areas, which instead falls to very small spectral coherence values, conforming strictly to the distributed scatterer model.
It should be noted that, even if we consider a gap such that no overlap occurs between sub-bands, spectral coherence values do not fall exactly to zero, but stays around 0.15 (Figure 8C). This is due to the well-known bias in the interferometric coherence estimator, which is in fact about 0.1 for a 5 × 5 estimation window [23].
As shown on Figure 7, once we reach a gap inducing no overlap between sub-bands, we get a clear and contrasted separation between areas with randomly distributed surface scatterers and other types of surfaces. Moreover, since other scatterer distributions appears clearly whatever the sub-band overlap, the global average of all spectral coherences computed at all gaps gives also a still better contrasted result, separating random surface scatterers from others. In the specific frame of vessel detection it is thus this latter product that appears to be the best to perform a prescreening process.
Best contrast is observed using 21 sub-bands of 40 MHz bandwidth. This splitting scheme also gives a good balance between resolution loss and spectral coherence contrast. Consequently, this combination was chosen for vessel detection evaluation.
4.2. Spectral Coherence Versus Temporal Coherence
Having coregistered all images with respect to the May 2009 acquisition, we also performed a classical interferometric processing to estimate the temporal coherence, to compare it with the spectral coherence derived from the sole May acquisition.
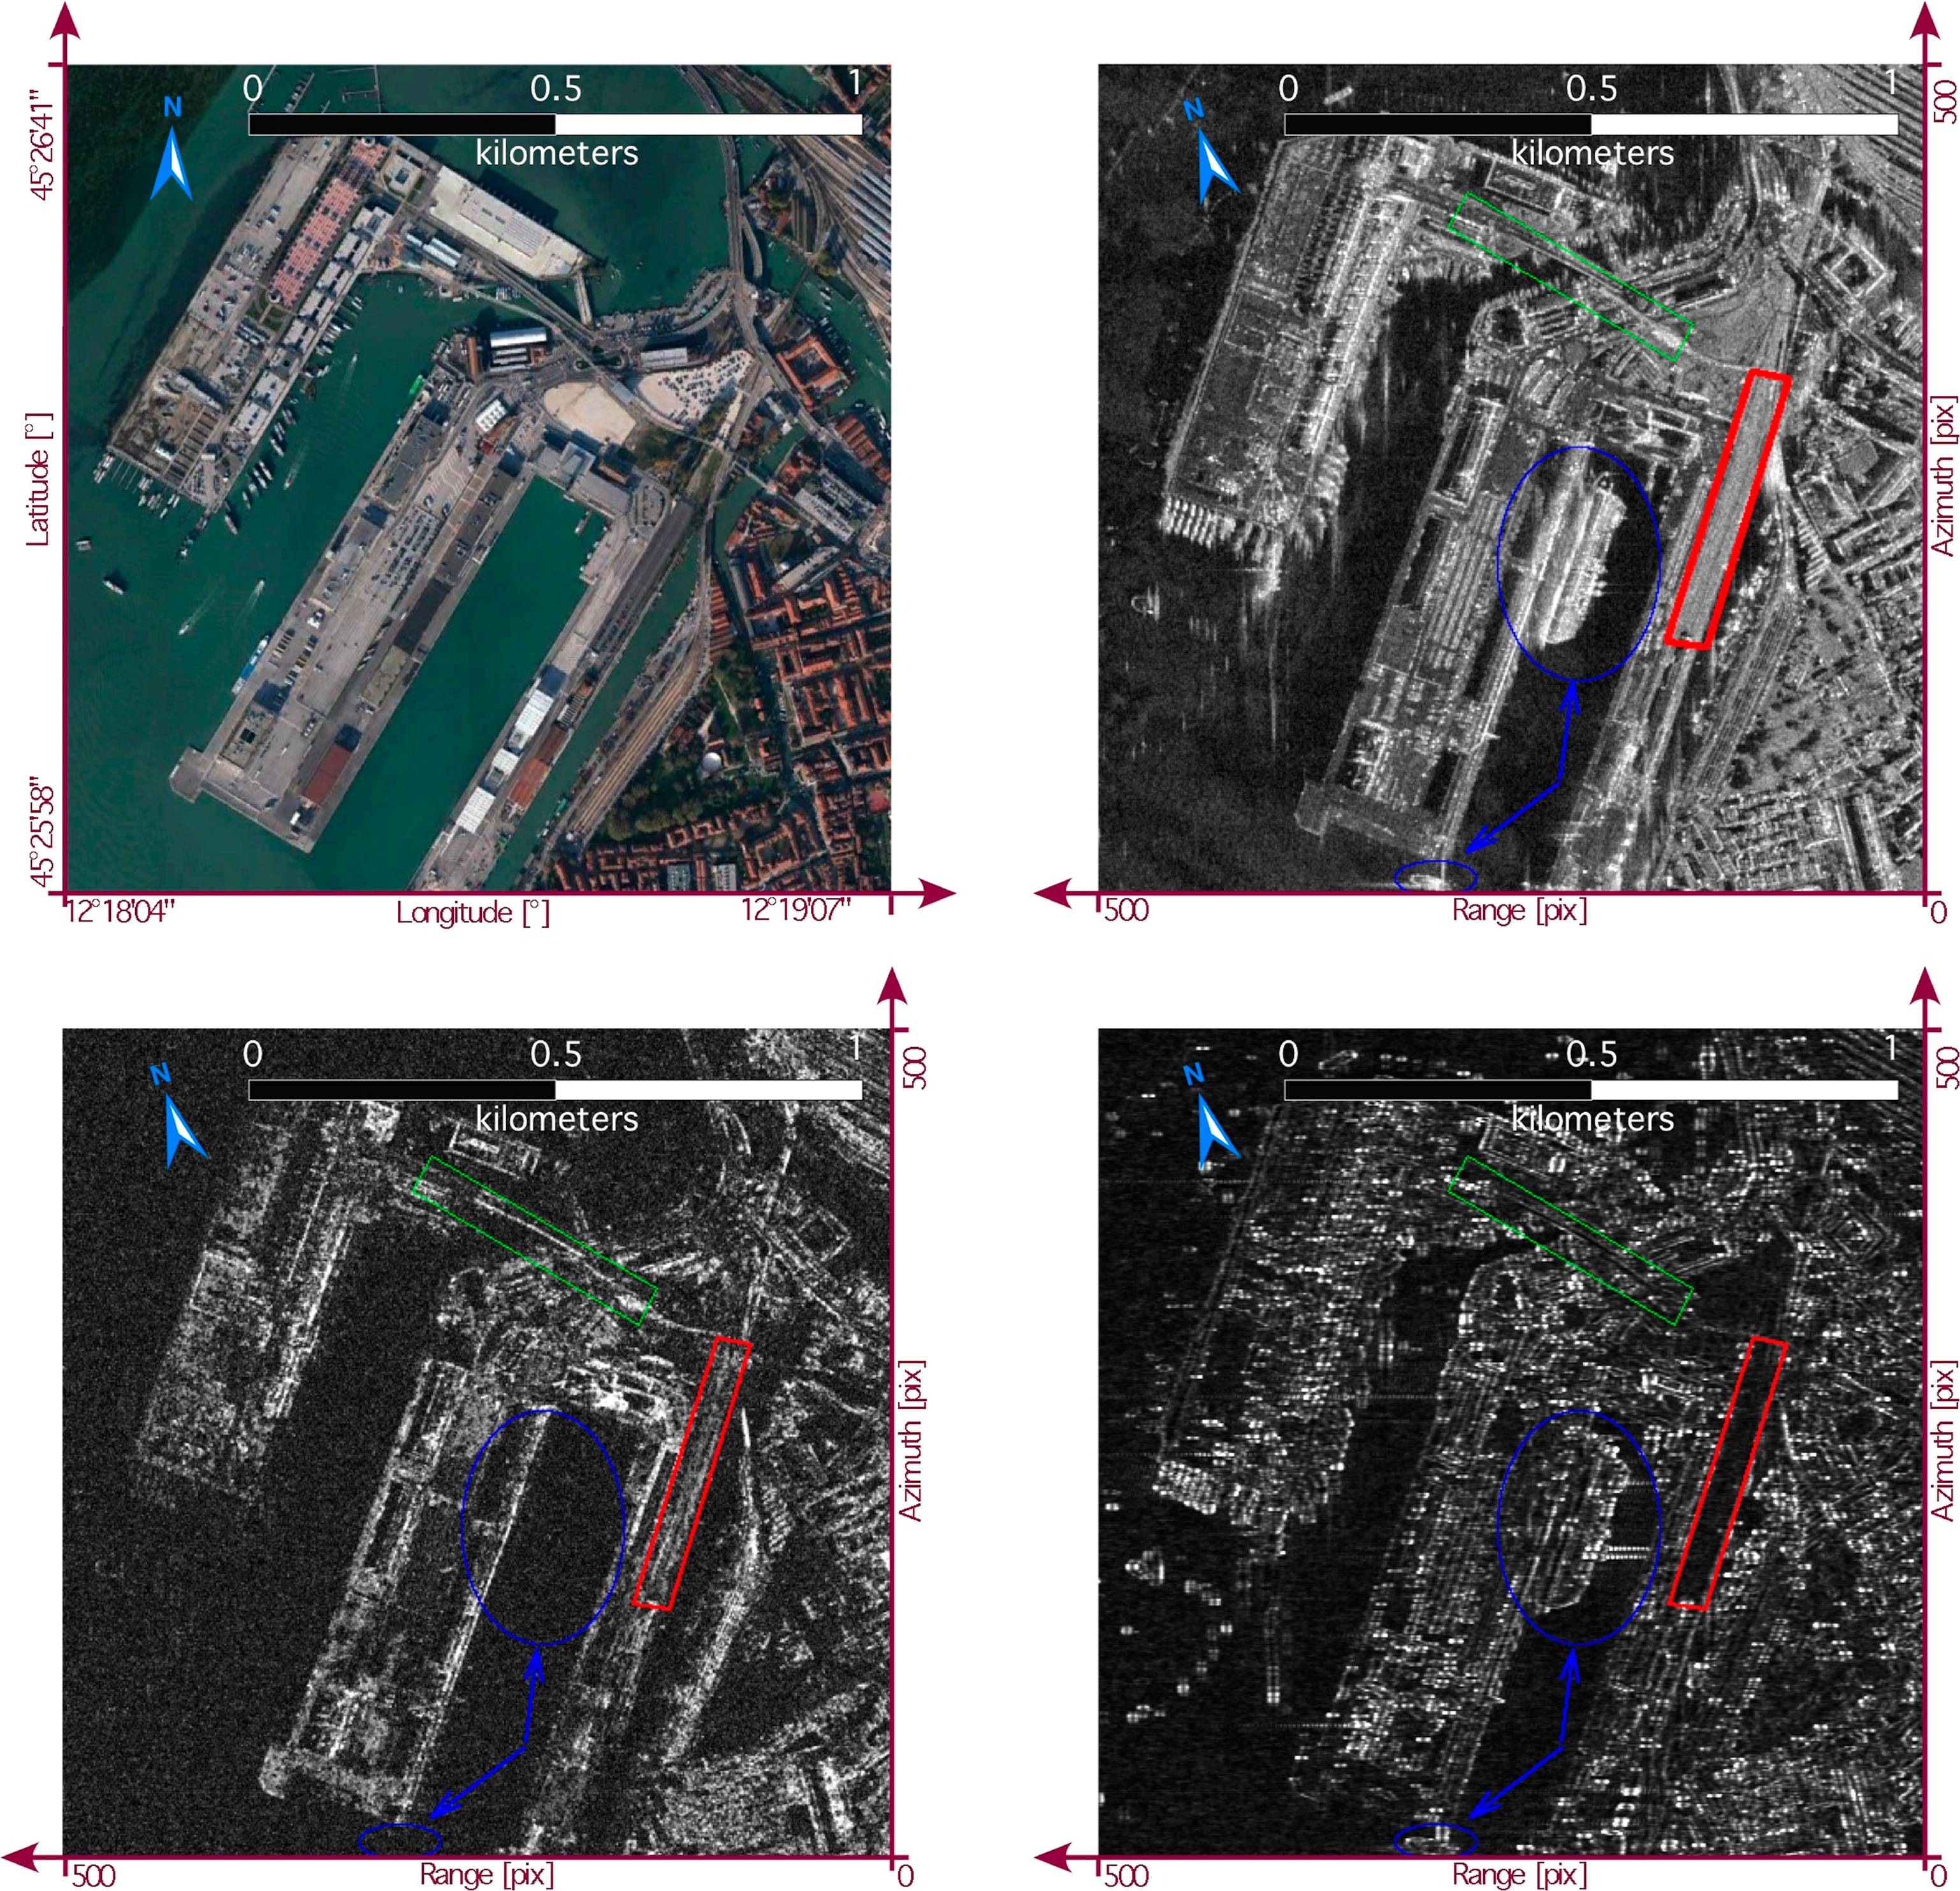
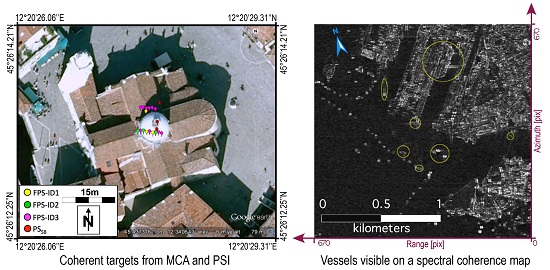
First of all, we observe that features that are present in a single image may lead to high spectral coherence while features that change or move between interferometric acquisitions lead to a complete loss of temporal coherence. This is the aspect that drives the present work: detect high spectral coherence spots on sea clutter in a single acquisition. This is clearly visible on Figure 9. This figure shows a cut of the full-resolution intensity image of the May acquisition (Figure 9B), the corresponding average of the three temporal coherence images (Figure 9C), and the spectral coherence image of the May acquisition (Figure 9D). The area is located near the Venice railway station and shows the docks of the Venice harbor as visible in the optical image from Google Earth sketched in the inset (Figure 9A).
Blue ellipses show the location of two vessels, one large cruise ship and a smaller boat, clearly visible on the intensity image. As expected, since those vessels are only visible within the May acquisition, there is no temporal coherence at that places, while spectral coherence stays high, confirming that manmade structures like boats and vessels are spectrally coherent. Moreover, the spectral coherence image shows a complementary but not identical structure with respect to the intensity image. In other words, spectral coherence may allow adding supplementary structural information that could be useful not only for vessel detection but also for vessel identification.
Finally, there are some places where temporal coherence is preserved while spectral coherence drops to negligible values (red and green polygons). This suggests that those scatterers may be stable with time, while not stable with respect to frequency, confirming the fact that temporal and spectral coherence channels contain different information. Again, it appears that the simple spectral coherence model for random surface fully complies with the observations: spectral coherence falls to negligible values on areas with random distribution of surface scatterers as water surfaces, but also on some uniform surfaces like the one shown in the red polygon in Figure 9. Other similar places are also observable elsewhere on the data (not shown here for brevity): comparing the SAR amplitude image with Google Earth images, we observed areas that are also losing spectral coherence, corresponding to empty parking lots, roads or bare soil areas; i.e., surface types that can also be considered as random distribution of surface scatterers.
4.3. Spectral Coherence for Vessel Tracking
From what precedes, it is clear that spectral coherence is a good indicator for vessel detection and tracking, and can be efficiently used in addition to the intensity channel.
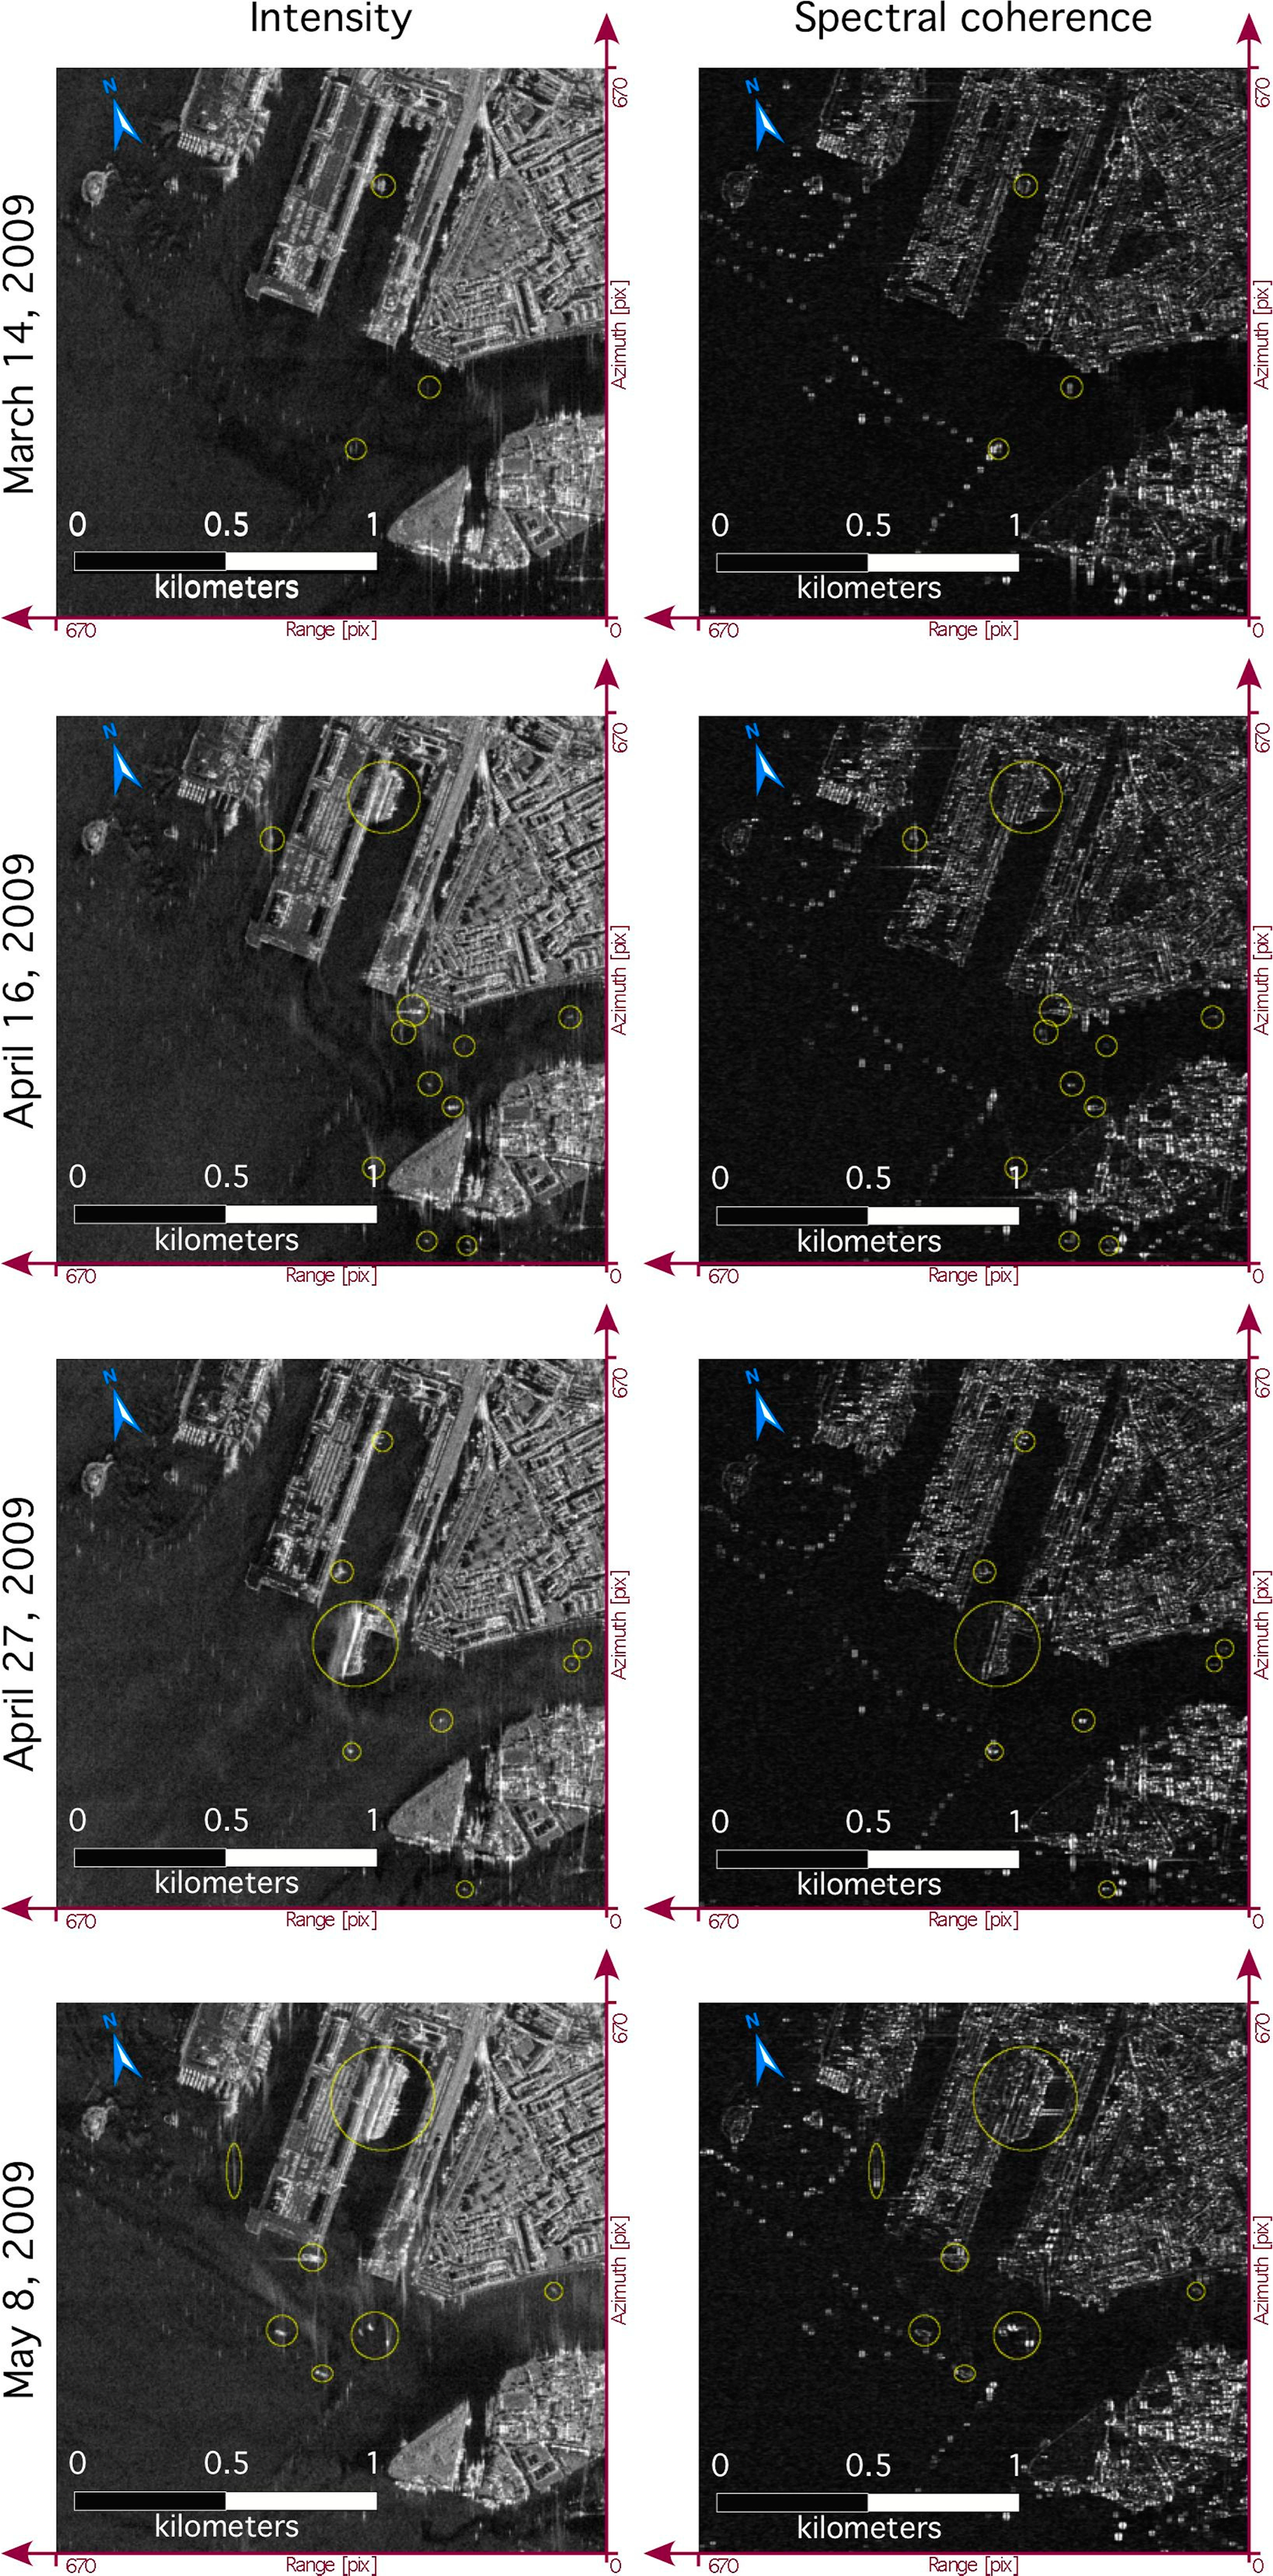
Figure 10 shows in parallel the intensity and the spectral coherence of a sample of the scene for the four acquisition dates. Comparing the intensity images allows us to locate vessels that are present in a single acquisition. As can be seen, each vessel identified within an intensity image has a clear signature in the corresponding spectral coherence image. In some case, it is easier to locate first the candidate vessel in the spectral coherence image, and then find its signature in the intensity image.
Of particular interest is the vessel located at the left of acquisition of May 8. We see a line in the intensity image, probably corresponding to the wake of a high-speed small boat. The line is also visible in the spectral coherence, but in addition, spectral coherence shows a high spot signature at the probable location of the boat.
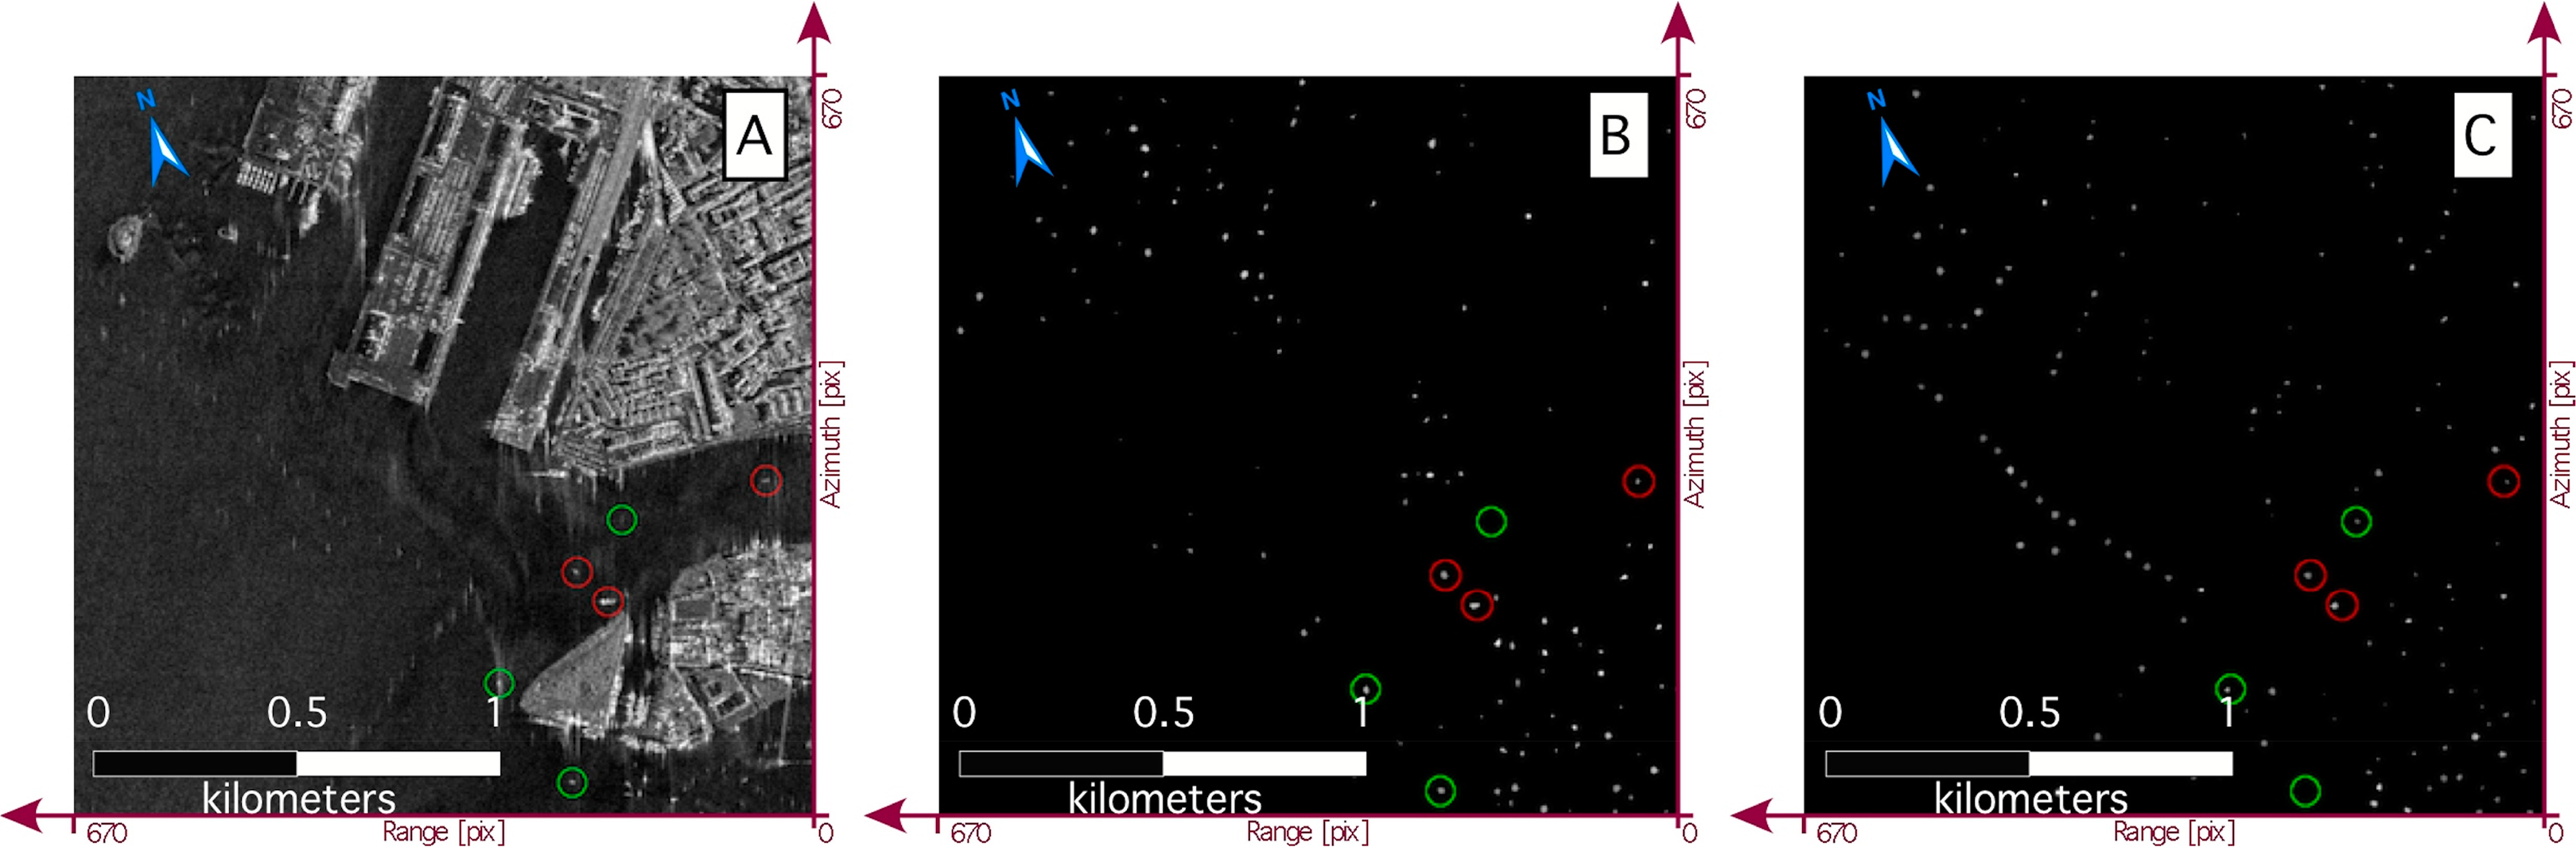
We developed a basic Constant False Alarm Rate processor (CFAR) [16] to perform some tests and compare vessels detectability in both the intensity and the spectral coherence channel. Several tests were made using boxes of different size and with different factors for both channels. Globally, it is possible to perform the same detection in one or the other channel adapting conveniently the detector parameters. Figure 11 shows an example of CFAR detection applied to both channels using the April 16 acquisition. Circles locate targeted vessels for detection. As can be seen, some vessels may be detected using the intensity channel but not when using the spectral coherence channel, and conversely.
Whatever the used parameters, we have observed that CFAR detection using the spectral coherence channel always gives better results, especially in the detection of very faint signals issued from small manmade structures like the many pylons located in the water channels around Venice.
It is interesting to observe that we detect small objects while sub-bands of 40 MHz induce a resolution loss of a factor of 7.5 with respect to the full band data. However, it appears that the spectral coherence loss on open sea is sufficiently high to lead to a good signal to noise ratio allowing to detect inside the pixel the spectrally coherent components of small objects on the background. Consequently, spectral coherence may be considered as a very good additional information channel to detect very small vessels on noisy sea background. Concerning the accuracy of the proposed procedure, it depends on the capability of the spectral coherence to discriminate between sea surface and vessels. The model proposed in [6] that relates the spectral coherence to the scattering processes, has been validated in this paper providing an evident matching between the coherence value foreseen by the model an that measured on real data. This outcome provides also an indication on the sensitivity of the pixel selection obtained through spectral coherence. The efficiency of the whole vessel detection chain could be evaluated in term of detection accuracy provided that a large dataset and ground truth are available. This is out of the scope of the paper which aims at providing a preliminary check of the possible applications of the MCA concept apart from the height measurements and phase unwrapping already validated.
5. Conclusions
The Multi Chromatic Analysis (MCA) technique recently has been proved to be used for phase unwrapping as well as ground height retrieval. The MCA principle consists in processing portions of SAR range spectrum and then exploring the interferometric phase obtained at sub-bands. In order to perform reliable estimations, frequency coherent targets are identified according the phase stability along the sub-bands. This concept can be used to characterize the targets and in this work we investigated two potential applications of MCA devoted to target analysis. To this aim the information content of several sub-look SAR images have been explored by processing both interferometric pairs and single images acquired over Venice, Italy by TerraSAR-X.
In particular, we performed MCA on interferometric pairs for identifying frequency-coherent targets to be compared with temporally-coherent targets derived from PSI. The comparison revealed a difference in the backscatter stability requirements associated with the two processing chains: in PSI processing, performed along the temporal axis, the ground reflectivity spectrum explored is that spanned by the available spatial baseline distribution, which is smaller than that involved in the MCA processing. Therefore, the former phase stability constraint is less stringent than the latter meaning that the temporal PS stability condition does not necessarily imply frequency stability within the whole bandwidth. Consequently, only a fraction of the targets selected as PS would behave coherently along the wide bandwidth explored by the MCA,depending on the explored bandwidth, on the spatial interferometric baselines, and on the scattering mechanisms involved by the land cover. According to these results, the MCA can be used to provide a reliable preliminary map of persistent scatterers to support PSI processing only where the land cover guarantees point-like scattering. This occurs mainly in urban setting where, however, the PSI algorithms show the best performances and do not require further support. Anyway, the MCA phase stability appears a promising tool to investigate the scattering mechanism involved in the interaction between the microwave radiation and the soil, and future studies will be devoted to assess the use of this MCA product for target classification.
In the framework of MCA, spectral coherence can also be derived. It is to say that interferometric coherence between sub-images issued from different sub-bands in a single SAR acquisition can be estimated. We showed here that this information channel can efficiently be used as a pre-screening and detection levels for vessel detection. A simple model shows that, in the presence of a random distribution of surface scatterers, spectral coherence must be proportional to sub-band intersection of considered sub-images. Consequently, for this distribution of scatterers, spectral coherence must fall to zero when sub-bands are disjointed. We showed that this model is fully verified when observing measured spectral coherence on open sea areas, which correspond well to the scatterer distribution under concern. If scatterers distribution departs from this basic distribution, spectral coherence is shown to be partially preserved. This is especially the case in presence of manmade structures whatever the central frequency gap between the used sub-band images. Therefore, spectral coherence information channel appears perfectly suited to perform vessel detection on sea background. Sea background tends to lead to very low spectral coherence levels, while this quantity is well preserved on vessels, even very small ones, despite the inherent resolution loss of the process. A first analysis, using a Constant False Rate Alarm detection algorithm, shows that all vessels observable in intensity images are easily detected in the spectral coherence images. It follows that spectral coherence can be considered a very good complementary information channel for vessel detection.
Acknowledgments
Work supported by ESA ESTEC Contr. N. 21319/07/NL/HE. TerraSAR-X data are provided by DLR in the frame of the TerraSAR-X General AO Project MTH0432.
Author Contributions
Fabio Bovenga is the principal author of this paper. All authors worked on MCA methodology, SAR data processing, and interpretation of the results. Fabio Bovenga, Fabio Michele Rana, Alberto Refice and Nicola Veneziani contributed mainly to Section 3. Dominique Derauw and Christian Barbier contributed mainly to Section 4.
Conflicts of Interest
The authors declare no conflict of interest.
References
- Veneziani, N.; Bovenga, F.; Refice, A. A wide-band approach to absolute phase retrieval in SAR interferometry. Multidimension. Syst. Sign. Proc 2003, 14, 183–205. [Google Scholar]
- Bovenga, F.; Giacovazzo, V.M.; Refice, A.; Veneziani, N. Multi-chromatic analysis of InSAR data. IEEE Trans. Geosci. Remote Sens 2013, 51, 4790–4799. [Google Scholar]
- Bovenga, F.; Giacovazzo, V.M.; Refice, A.; Veneziani, N.; Derauw, D.; Vitulli, R. Interferometric multi-chromatic analysis of TerraSAR-X data. In Proceedings of 2011 4th TerraSAR-X Science Team Meeting, Oberpfaffenhofen, Germany, 14–16 February 2011.
- Bovenga, F.; Rana, F.M.; Refice, A.; Veneziani, N. Interferometric multi-chromatic analysis of satellite wideband SAR data. IEEE Geosci. Remote Sens. Lett 2014, 11, 1767–1771. [Google Scholar]
- Ferretti, A.; Prati, C.; Rocca, F. Permanent Scatterers in SAR Interferometry. IEEE Trans. Geosci. Remote Sens 2001, 39, 8–20. [Google Scholar]
- Derauw, D.; Orban, A.; Barbier, C. Wide band SAR sub-band splitting and inter-band coherence measurements. Remote Sens. Lett 2010, 1, 133–140. [Google Scholar]
- Spigai, M.; Tison, C.; Souyris, J.C. Time-frequency analysis in high-resolution SAR imagery. IEEE Trans. Geosci. Remote Sens 2011, 49, 2699–2711. [Google Scholar]
- Schneider, R.Z.; Papathanassiou, K.P.; Hajnsek, I.; Moreira, A. Polarimetric and interferometric characterization of coherent scatterers in urban areas. IEEE Trans. Geosci. Remote Sens 2006, 44, 971–984. [Google Scholar]
- Iglesias, R.; Mallorqui, J.; López-Dekker, P. DInSAR pixel selection based on sublook spectral correlation along time. IEEE Trans. Geosci. Remote Sens 2014, 52, 3788–3799. [Google Scholar]
- Sanjuan-Ferrer, M. J.; Hajnsek, I.; Papathanassiou, K.P. Detection of coherent scatterers in SAR data: Application for urban environments. In Proceedings of 2014 IEEE 10th European Conference on Synthetic Aperture Radar (EUSAR), Berlin, Germany, 3–5 June 2014.
- Marino, A.; Sanjuan-Ferrer, M.J.; Hajnsek, I.; Ouchi, K. Ship detectors exploiting spectral analysis of SAR images. In Proceedings of 2014 the IEEE International Geoscience and Remote Sensing Symposium (IGARSS), Quebec City, PQ, Canada, 13–18 July 2014.
- Bovenga, F.; Refice, A.; Nutricato, R.; Guerriero, L.; Chiaradia, M.T. SPINUA: A flexible processing chain for ERS/ENVISAT long term interferometry. In Proceedings of 2004 ENVISAT & ERS Symposium, Salzburg, Austria, 6–10 September 2004.
- Iglesias, R.; Mallorqui, J.J. Side-lobe cancelation in D-InSAR pixel selection with SVA. Geosci. Remote Sens. Lett 2013, 10, 667–671. [Google Scholar]
- Bovenga, F.; Rana, F.M.; Refice, A.; Nitti, O.D; Veneziani, N. Frequency coherent vs. temporally coherent targets. In Proceedings of 2013 the IEEE International Geoscience and Remote Sensing Symposium (IGARSS), Melbourne, Australia, 21–26 July 2013; pp. 105–108.
- Gatelli, F.; Guamieri, A.; Parizzi, F.; Pasquali, P.; Prati, C.; Rocca, F. The wavenumber shift in SAR interferometry. IEEE Trans. Geosci. Remote Sens 1994, 32, 855–865. [Google Scholar]
- Crisp, D. The State-of-the-Art in Ship Detection in Synthetic Aperture Radar Imagery; Intelligence, Surveillance and Reconnaissance Division (ISRD): Edinburgh, SA, Australia, 2004. [Google Scholar]
- Lehner, S.; Brusch, S.; Fritz, T. Ship surveillance by joint use of SAR and AIS. In Proceedings of 2009 Oceans 2009-Europe, Bremen, Germany, 11–14 May 2009.
- Silva, V.M.G.; Greidanus, H. JRC-SAR Satellite Small Boat Detection Campaign-Portoroz-Slovenia; Publications Office of the European Union: Luxembourg, the Grand Duchy of Luxembourg, 2011. [Google Scholar]
- Arnaud, A. Ship detection by SAR interferometry. In Proceedings of 1999 the IEEE International Geoscience and Remote Sensing Symposium (IGARSS), Hamburg, Germany, 28 June–2 July 1999; pp. 2616–2618.
- Vachon, P.W. Ship detection in synthetic aperture radar imagery. In Proceedings of 2006 the Third Workshop on Coastal and Marine Applications of SAR, St. John’s, NL, Canada, 23–25 October 2006.
- Ouchi, K.; Tamaki, S.; Yaguchi, H.; Iehara, M. Ship detection based on coherence images derived from cross correlation of multi-look SAR images. Geosci. Remote Sens. Lett 2004, 1, 184–187. [Google Scholar]
- Ouchi, K.; Burge, R. Speckle cross-correlation function in multi-look SAR images of moving discrete scatterers. Int. J. Remote Sens 1991, 12, 1933–1946. [Google Scholar]
- López-Martínez, C.; Pottier, E. Coherence estimation in synthetic aperture radar data based on speckle noise modeling. Appl. Opt 2006, 46, 544–558. [Google Scholar]


| TSX Spotlight Dataset: InSAR Pairs | |||
|---|---|---|---|
| ID | Acquisition Times | B ⊥ (m) | Bt (Days) |
| 1 | 27.04.2009 | −86 | −44 |
| 14.03.2009 | |||
| 2 | 27.04.2009 | −118 | −11 |
| 16.04.2009 | |||
| 3 | 27.04.2009 | −14 | 11 |
| 08.05.2009 | |||
© 2014 by the authors; licensee MDPI, Basel, Switzerland This article is an open access article distributed under the terms and conditions of the Creative Commons Attribution license (http://creativecommons.org/licenses/by/3.0/).
Share and Cite
Bovenga, F.; Derauw, D.; Rana, F.M.; Barbier, C.; Refice, A.; Veneziani, N.; Vitulli, R. Multi-Chromatic Analysis of SAR Images for Coherent Target Detection. Remote Sens. 2014, 6, 8822-8843. https://doi.org/10.3390/rs6098822
Bovenga F, Derauw D, Rana FM, Barbier C, Refice A, Veneziani N, Vitulli R. Multi-Chromatic Analysis of SAR Images for Coherent Target Detection. Remote Sensing. 2014; 6(9):8822-8843. https://doi.org/10.3390/rs6098822
Chicago/Turabian StyleBovenga, Fabio, Dominique Derauw, Fabio Michele Rana, Christian Barbier, Alberto Refice, Nicola Veneziani, and Raffaele Vitulli. 2014. "Multi-Chromatic Analysis of SAR Images for Coherent Target Detection" Remote Sensing 6, no. 9: 8822-8843. https://doi.org/10.3390/rs6098822
APA StyleBovenga, F., Derauw, D., Rana, F. M., Barbier, C., Refice, A., Veneziani, N., & Vitulli, R. (2014). Multi-Chromatic Analysis of SAR Images for Coherent Target Detection. Remote Sensing, 6(9), 8822-8843. https://doi.org/10.3390/rs6098822