Article

Temporal and Spatial Variations in the Thermal Front in the Beibu Gulf in Winter

1
Hainan Institute, Zhejiang University, Sanya 572024, China
2
Hainan Observation and Research Station of Ecological Environment and Fishery Resource in Yazhou Bay, Sanya 572024, China
3
Ocean College, Zhejiang University, Zhoushan 316000, China
*
Author to whom correspondence should be addressed.
Remote Sens. 2025, 17(3), 469; https://doi.org/10.3390/rs17030469
Submission received: 19 December 2024 / Revised: 24 January 2025 / Accepted: 25 January 2025 / Published: 29 January 2025

Abstract

:
Using satellite-observed data and reanalysis data, we studied the spatiotemporal variation characteristics and dynamic mechanisms of thermal fronts in the Beibu Gulf (TFIBG). TFIBG occur in December, reach their strongest point in January in the following year, and then gradually weaken until they completely disappear in May. Their formation is related to the bathymetry of the Beibu Gulf. In winter, the seawater in shallow-water areas (deep-water areas) cools down more (less), and Ekman currents concurrently transport warm water from the central basin of the Beibu Gulf to the west coast, which results in the formation of a thermal front at the junction of cold and warm water. The interannual variation in TFIBG intensity is related to the northeast monsoon. The strengthened (weakened) Ekman current caused by the northeast monsoon transports more (less) warm water from the central basin of the Beibu Gulf to the west coast, forming a strong (weak) thermal front at the junction of cold and warm water on an interannual scale. The upward trend of TFIBG intensity may be related to the regional heterogeneity of climate warming. This research systematically studied TFIBG, which will help improve people’s understanding of the thermal front in the South China Sea (SCS).

1. Introduction

Beibu Gulf, located in the northwest of the South China Sea (SCS), is surrounded by the Chinese Mainland, Indochina Peninsula, and Hainan Island (Figure 1). It is directly connected to the SCS in the south and to the SCS through the Qiongzhou Strait in the north. Beibu Gulf is a shallow bay on the continental shelf, its average depth is 46 m, and its maximum depth does not exceed 100 m [1]. Under the influence of the northeast monsoon in winter, the Beibu Gulf typically features cyclonic circulation [2,3,4]. There are many freshwater runoff inflows distributed along the coast of the Beibu Gulf, which can affect the marine environment of the Beibu Gulf [1,5]. Due to the influence of bathymetry, wind, river flushing freshwater, and external seawater, the ocean dynamic environment in the Beibu Gulf is very complex [2,3,4]. Meanwhile, the Beibu Gulf is an important economic belt and fishing ground, which has a significant impact on coastal ecology and economy [1,4]. Therefore, studying the ocean dynamic environment of the Beibu Gulf has important social and scientific significance.
The frontal region refers to the sea area where the spatial gradient of the main thermodynamic characteristics is relatively high. Frontal circulation, vertical mixing, and sea–air interaction in the frontal region can significantly affect the transport of substances, biological production, and the spatiotemporal distribution of sea temperature in the ocean, thus attracting widespread attention from oceanographers [6,7,8,9,10,11,12]. A deep understanding of the formation and dynamic mechanisms of thermal fronts is an important part of ecosystem forecasting and prediction [6,11]. The formation mechanism of thermal fronts is complex and diverse, mainly related to thermal advection, topography, upwelling, and so on [6,9,12,13,14,15,16]. There are many thermal fronts in the SCS, and they are mainly distributed in the northern SCS, the sea area around Hainan Island, the sea area east of Vietnam, and the sea area west of Luzon Island, which often exhibits significant seasonal and interannual variations [13,14,15,16,17,18].
Thermal fronts in the Beibu Gulf (TFIBG) are one of the thermal fronts in the northern SCS, which is mainly located along the west coast of the Beibu Gulf [17] (Figure 1). Wang et al. (2001) first discovered TFIBG and explored their spatiotemporal variation using 8 years of satellite-observed sea surface temperature (SST) data [17,19]. However, the seasonal and long-term variation characteristics of the TFIBG are still unclear. Currently, satellite-observed SST data have been accumulated over 40 years, and we believe it is necessary to re-examine the TFIBG to reveal their seasonal variation, interannual variation, and long-term trend characteristics, and their dynamic mechanisms. Solving the questions above can effectively improve people’s understanding of the thermal front in the SCS and contribute to the prediction and forecasting of the marine ecosystem in the Beibu Gulf. The rest of this paper is organized as follows: Section 2 introduces the datasets and methods, Section 3 presents the research results, and Section 4 and Section 5 provide the Discussion and Conclusions, respectively.

2. Data and Methods

2.1. Data

Daily SST values were from the Optimal Interpolation SST (OISST) datasets provided by the National Centers for Environmental Information (NCEI) of the National Oceanic and Atmospheric Administration (NOAA). OISST integrates SST observation data from multiple platforms, such as satellites, buoys, ships, Argo floats, etc., and then interpolates these data to a regular global grid. Both the satellite observation data and ship observation data have been corrected by buoy observation data. The temporal and spatial resolutions are 1 day and 0.25° × 0.25°, respectively. The time span is from 1 January 1982 to the present [20].
Wind vector datasets were from Cross-Calibrated Multi-Platform (CCMP) version 2.1, and the ocean wind vector were data provided by Remote Sensing Systems (RSS). CCMP wind vectors integrate in-site observation data, model data, and satellite observation data, and interpolate these data onto a global regular grid. They underwent quality control and error corrections [21]. The datasets span from January 1 1981 to the present, and their spatial and temporal resolutions were 0.25° × 0.25° and 6 h, respectively [22]. The datasets have been widely used for oceanographic research [15,16,23].
Ocean current data were from Ocean Surface Current Analyses Real-time (OSCAR), which was a NASA funded research project and global surface current database and provided by Earth and Space Research (ESR). The OSCAR datasets were calculated from multiple satellite observation datasets using a simplified physical model of an upper-ocean turbulent mixed layer. The data used by OSCAR included ocean vector winds, satellite-sensed sea surface height gradients, and SST fields. The total velocity was composed of a geostrophic term, a wind-driven term, and thermal wind adjustment using a geostrophic relationship, the wind-driven Ekman current theory, and thermal wind theory [24]. The datasets spanned from 1 January 1993 to 31 December 2020, and their spatial and temporal resolutions were 0.25° × 0.25° and one day, respectively. OSCAR datasets have been widely used for oceanography and atmospheric research [25].

2.2. Methods

2.2.1. Identification of the Thermal Fronts in the Beibu Gulf

The recognition methods for thermal fronts mainly included image edge detection methods and gradient calculation methods [10,15,26]. We chose the gradient calculation method to calculate the thermal front in the Beibu Gulf, whose calculation formula is described as follows [15]:
G M = ( T x ) 2 + ( T y ) 2
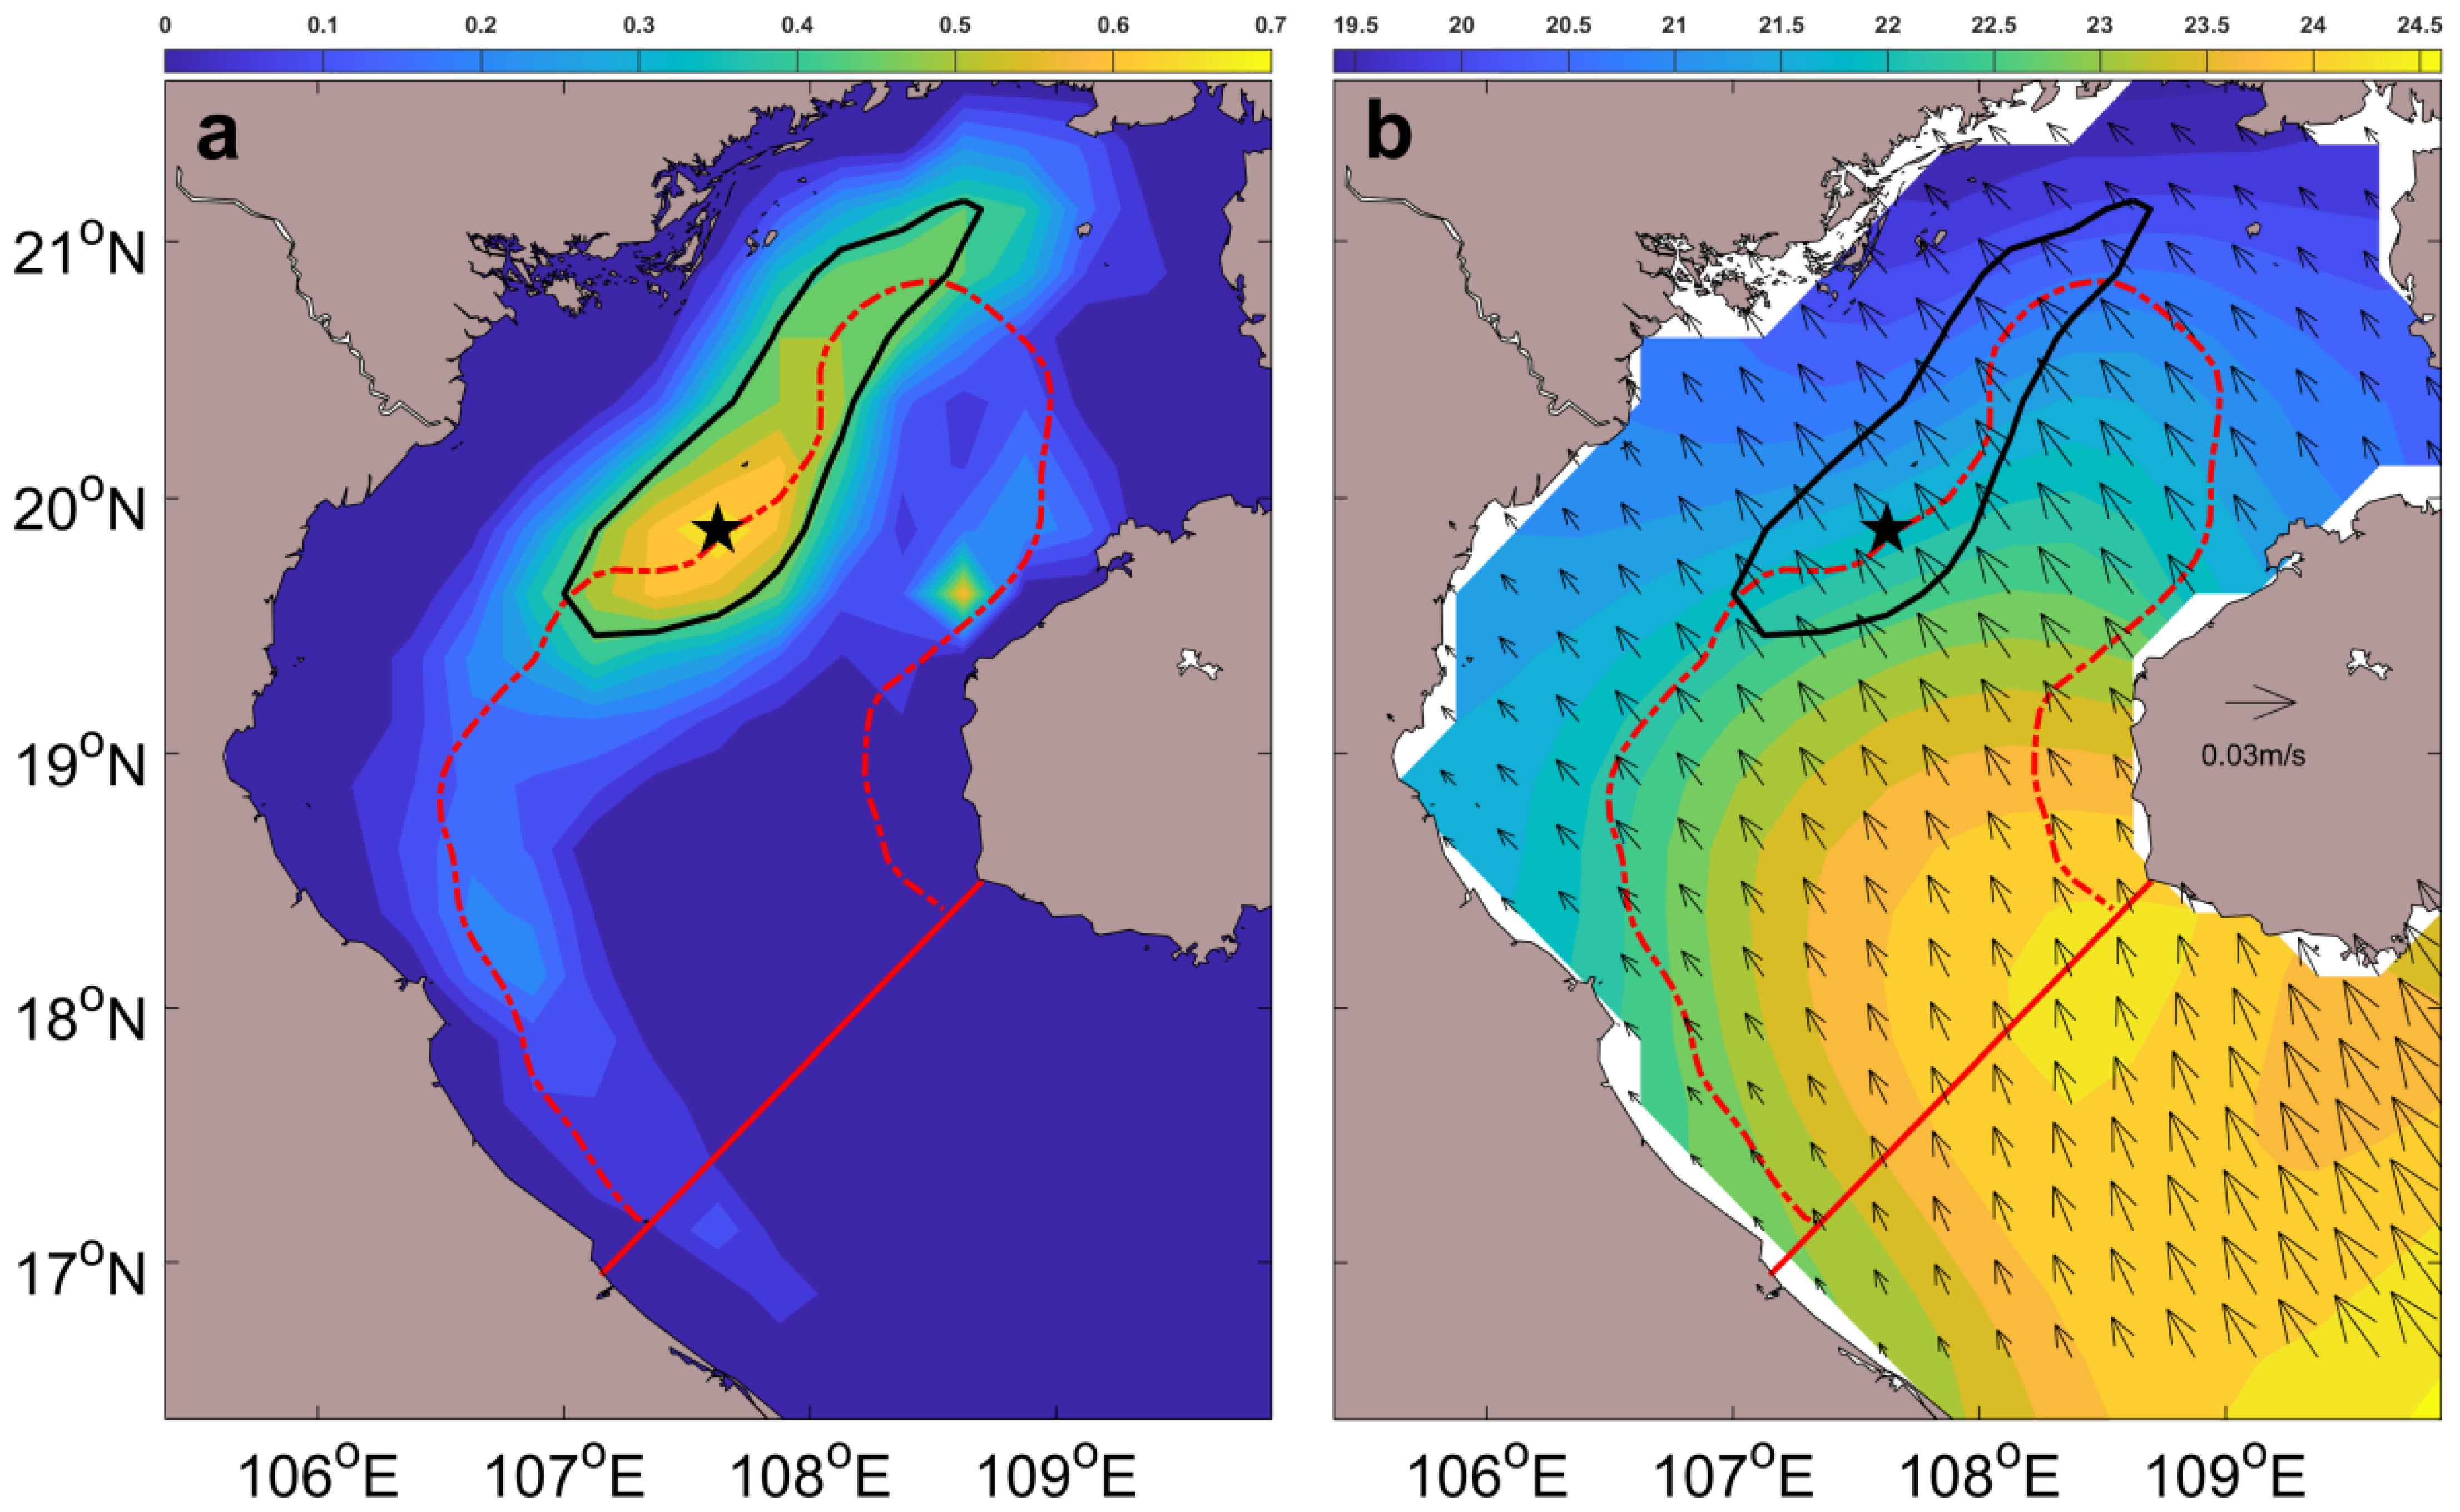
where G M represents the gradient magnitude; T is the S S T ; and x and y are east–west and north–south coordinates in the Cartesian coordinates, respectively. There is no unified threshold for the thermal front, and the selection of the thermal front threshold is usually based on the spatial distribution of the thermal front and the research purpose [13,15,16]. The value of 0.2 °C/10 km is the minimum that can continuously surround the high-value area of the G M (Figure 1b) and can surround the region with the highest occurrence rate of the G M (Figure 2a), so 0.2 °C/10 km was chosen as the threshold for the thermal front.

2.2.2. Definition of Thermal Front Intensity in the Beibu Gulf

TFIBG mainly occur in winter, and their range and values exhibit significant seasonal and interannual variations, which will be discussed in detail in the Section 3. However, the location of TFIBG is relatively fixed, mainly distributed in a strip on the west side of the Beibu Gulf, with a relatively concentrated area in the northwest of the Beibu Gulf (Figure 1b and Figure 2a). Figure 2a shows that TFIBG mainly occur within the outermost envelope of the TFIBG in winter. Based on the analysis above, we defined the average GM value of the area enclosed by the outermost envelope (the black solid line in Figure 1b and Figure 2) of the TFIBG as the intensity of the TFIBG.

2.2.3. Definition of Differences in SSTs Between Shallow-Water and Deep-Water Areas in the Beibu Gulf

In winter, the characteristics of low coastal SSTs and high deep-water SSTs in the Beibu Gulf are significant, which are speculated in this paper to cause the formation of TFIBG. It is necessary to construct an index to characterize the difference in SSTs between the shallow-water areas and deep-water areas in the Beibu Gulf. Previous studies have indicated that the deep-water tidal mixing front separating the well-mixed water from stratified water is generally about 40 m to 50 m isobaths long [18,27,28,29]. Figure 2b shows that there is a large SST gradient along the 40 m isobaths in the Beibu Gulf, which is reflected in the spatial distribution of the GM in Figure 1b. We believe that, due to the influence of the dynamic environment of the Beibu Gulf, the tidal mixing front in the Beibu Gulf is roughly located at the 40 m isobaths. Therefore, the 40 m isobaths were chosen as the boundary between the shallow-water areas and deep-water areas of the Beibu Gulf. The index that characterizes the difference in SSTs between the shallow-water areas and deep-water areas in the Beibu Gulf can be expressed as follows:
I n d e x d i f f = S S T d e e p   w a t e r S S T s h a l l o w   w a t e r
where S S T d e e p   w a t e r and S S T s h a l l o w   w a t e r represent the average SST in the deep-water and shallow-water areas of the Beibu Gulf, respectively.

2.2.4. Method for Separating Interannual Variation and Trend Variation

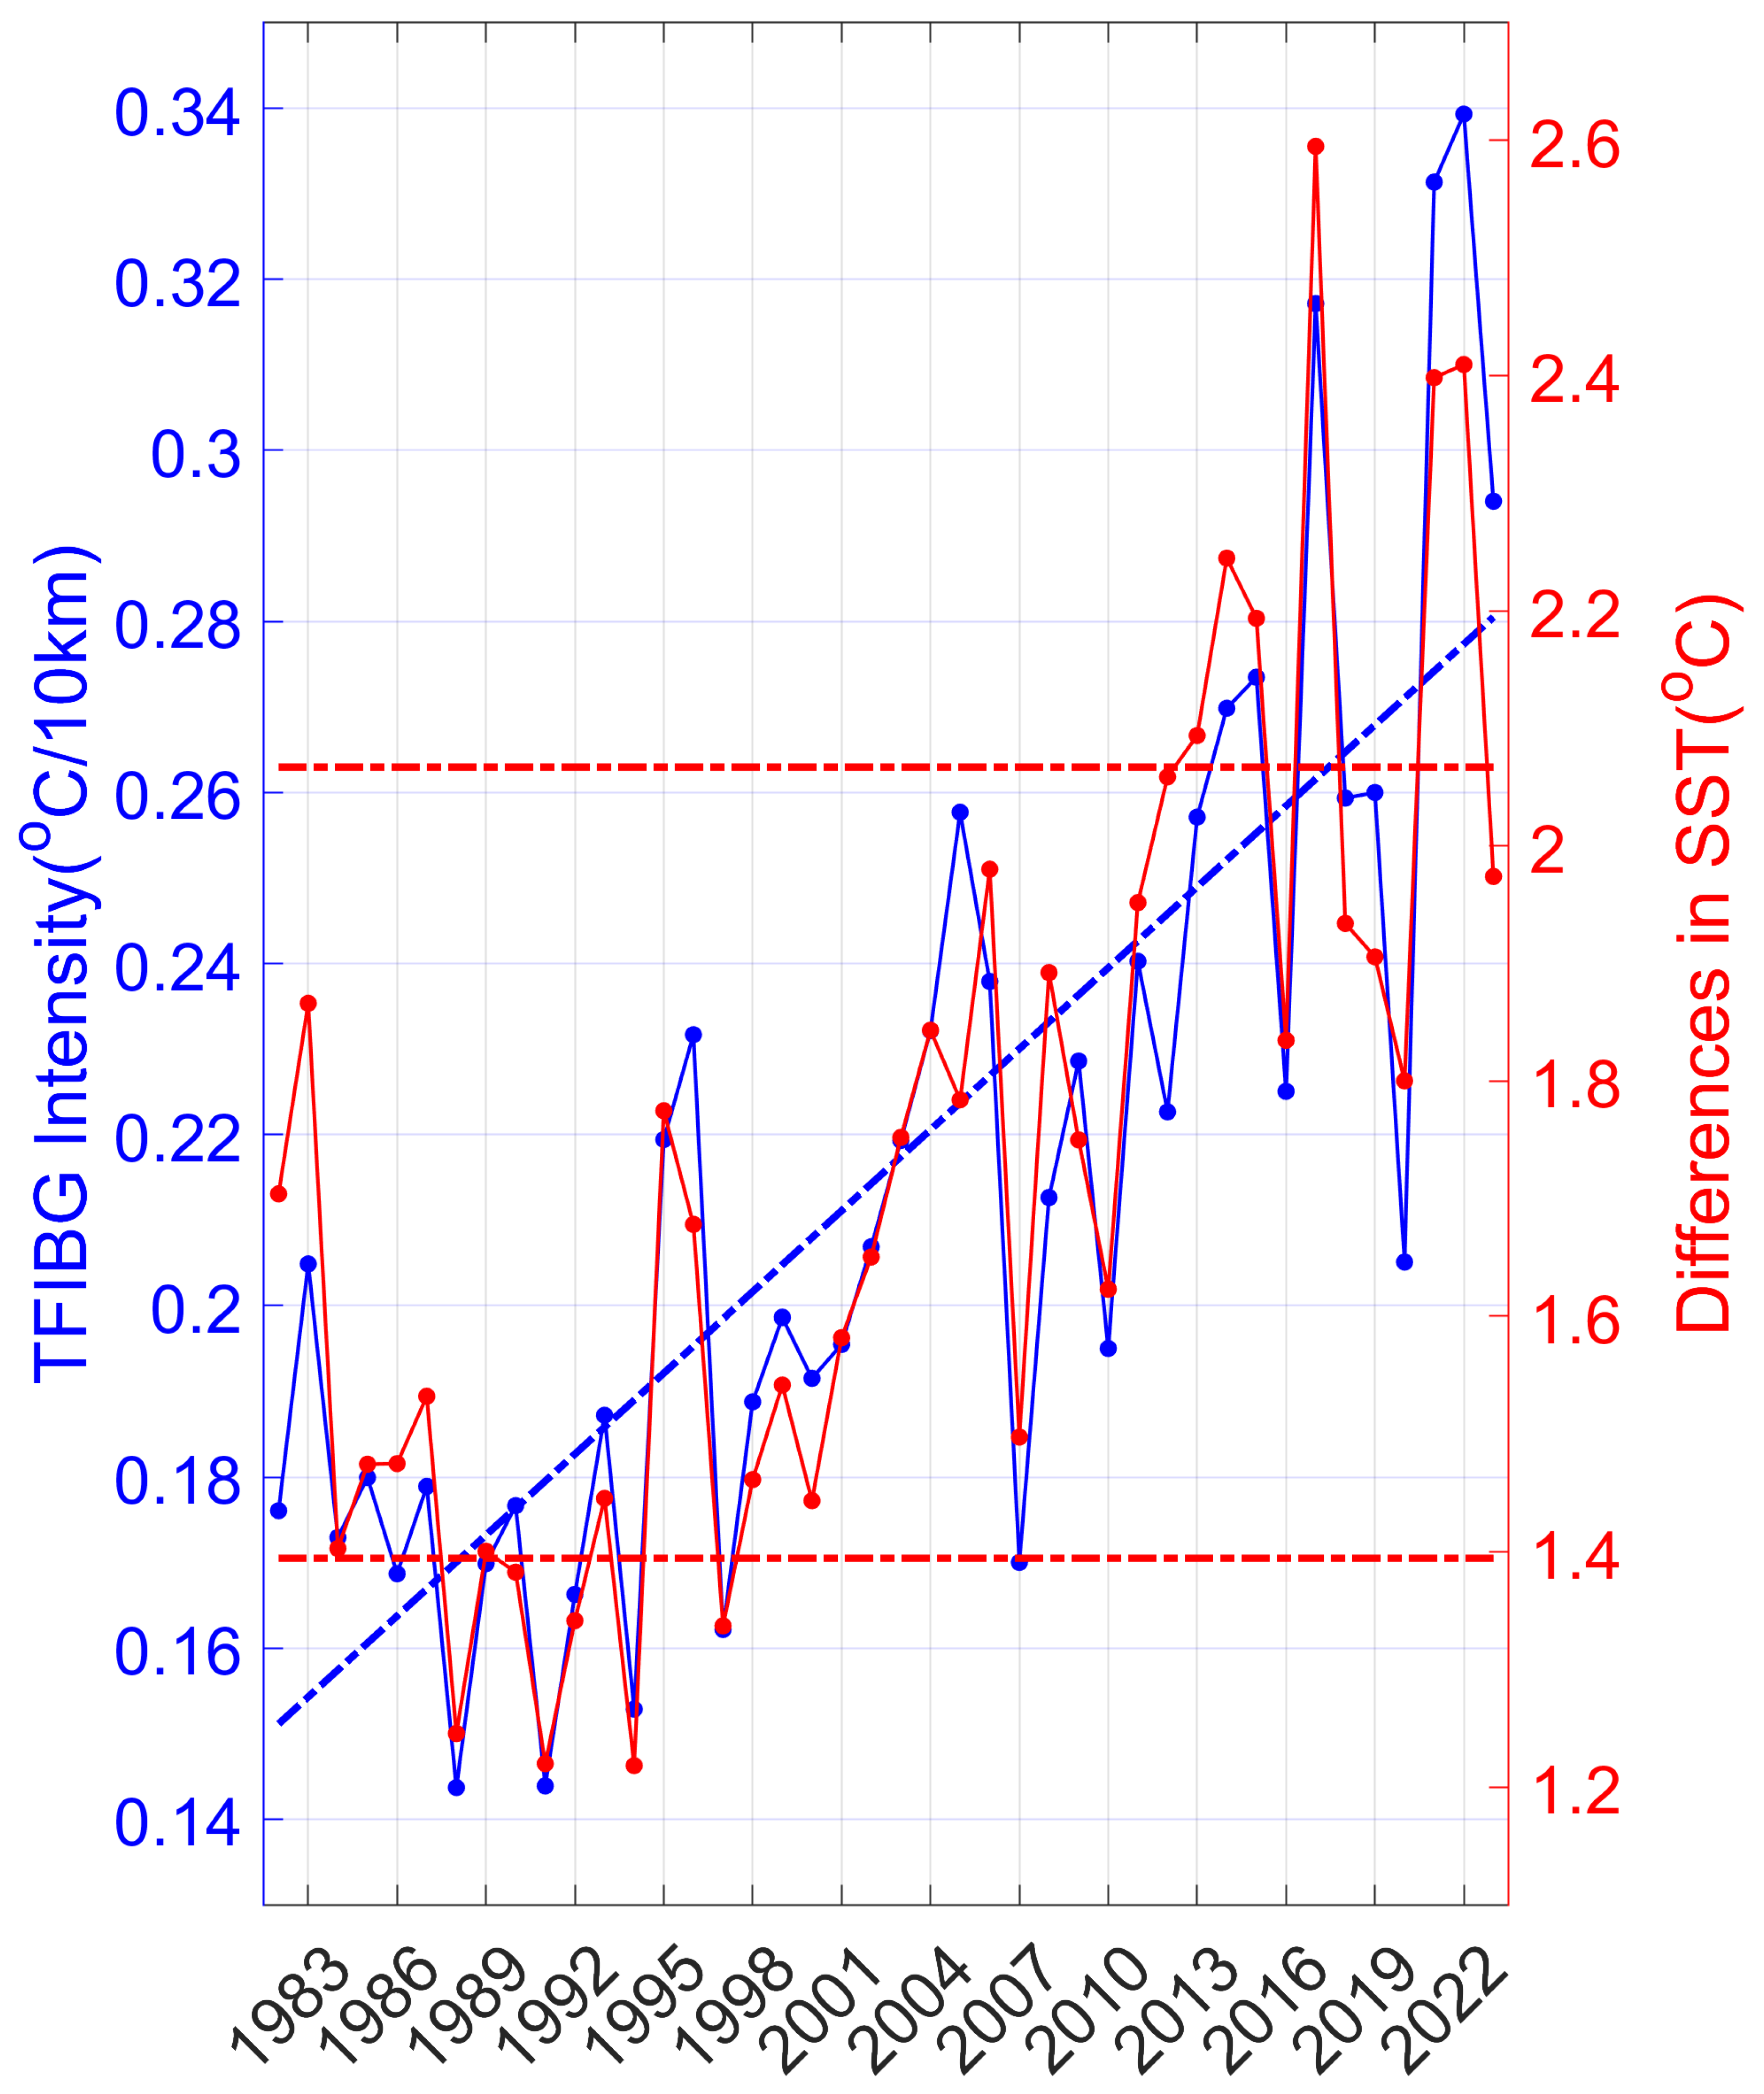
Taking the time variation of the TFIBG intensity as an example, the annual variation in TFIBG intensity shows that the TFIBG intensity has both interannual and linear trend characteristics (Figure 3). We extracted the linear trend variation (blue dotted line in Figure 3) through linear fitting, and we subtracted the linear trend variation from the original time series to obtain the interannual variation, which can be expressed as follows:
I n t e r a n n u a l   v a r i a t i o n = O r i g i n a l   t i m e   s e r i e s L i n e a r   t r e n d   v a r i a t i o n
The methods for extracting interannual and linear trend variations from other variables in this paper are the same as those described above.

3. Results

3.1. Formation Mechanism of the TFIBG

Previous studies have verified that the bathymetric effect can cause the formation of a thermal front in the continental shelf, and the thermal advection caused by ocean currents can enhance the thermal front [9,30,31]. TFIBG are also a continental shelf front, so we speculate that the formation of and variation in TFIBG are related to the bathymetric effect and thermal advection of ocean currents. There is a good correlation between the difference in SSTs between shallow-water areas and deep-water areas and TFIBG intensity, with a correlation coefficient of up to 0.93 between the two (Figure 3), and the center of the TFIBG is roughly located at the junction of shallow-water areas and deep-water areas (Figure 1b), which indicates that the formation of the TFIBG is related to the difference in SSTs between shallow-water areas and deep-water areas.
The formation mechanism of TFIBG can be described as follows: the shallow-water areas in the Beibu Gulf are well-mixed by tidal mixing and wind stirring in winter, so the SST in the shallow-water areas is very low against the backdrop of severe cooling in winter. However, the SST in the deep-water areas is relatively high, which is because the thermal inertia of a water column in the deep-water areas is linearly proportional to the lowest depth: deep water cools much more slowly than shallow water, and hence stays warmer [9,30]. Therefore, a significant thermal gradient is generated at the junction of the shallow-water areas and deep-water areas. Concurrently, the Ekman current caused by the northeast monsoon transports warm water from the center of the basin to the west coast of the Beibu Gulf, which strengthens the thermal gradient at the junction of shallow-water areas and deep-water areas [6,17] (Figure 2b). The combined effect of isobaths and the Ekman current leads to the formation of TFIBG at the junction of shallow-water areas and deep-water areas.
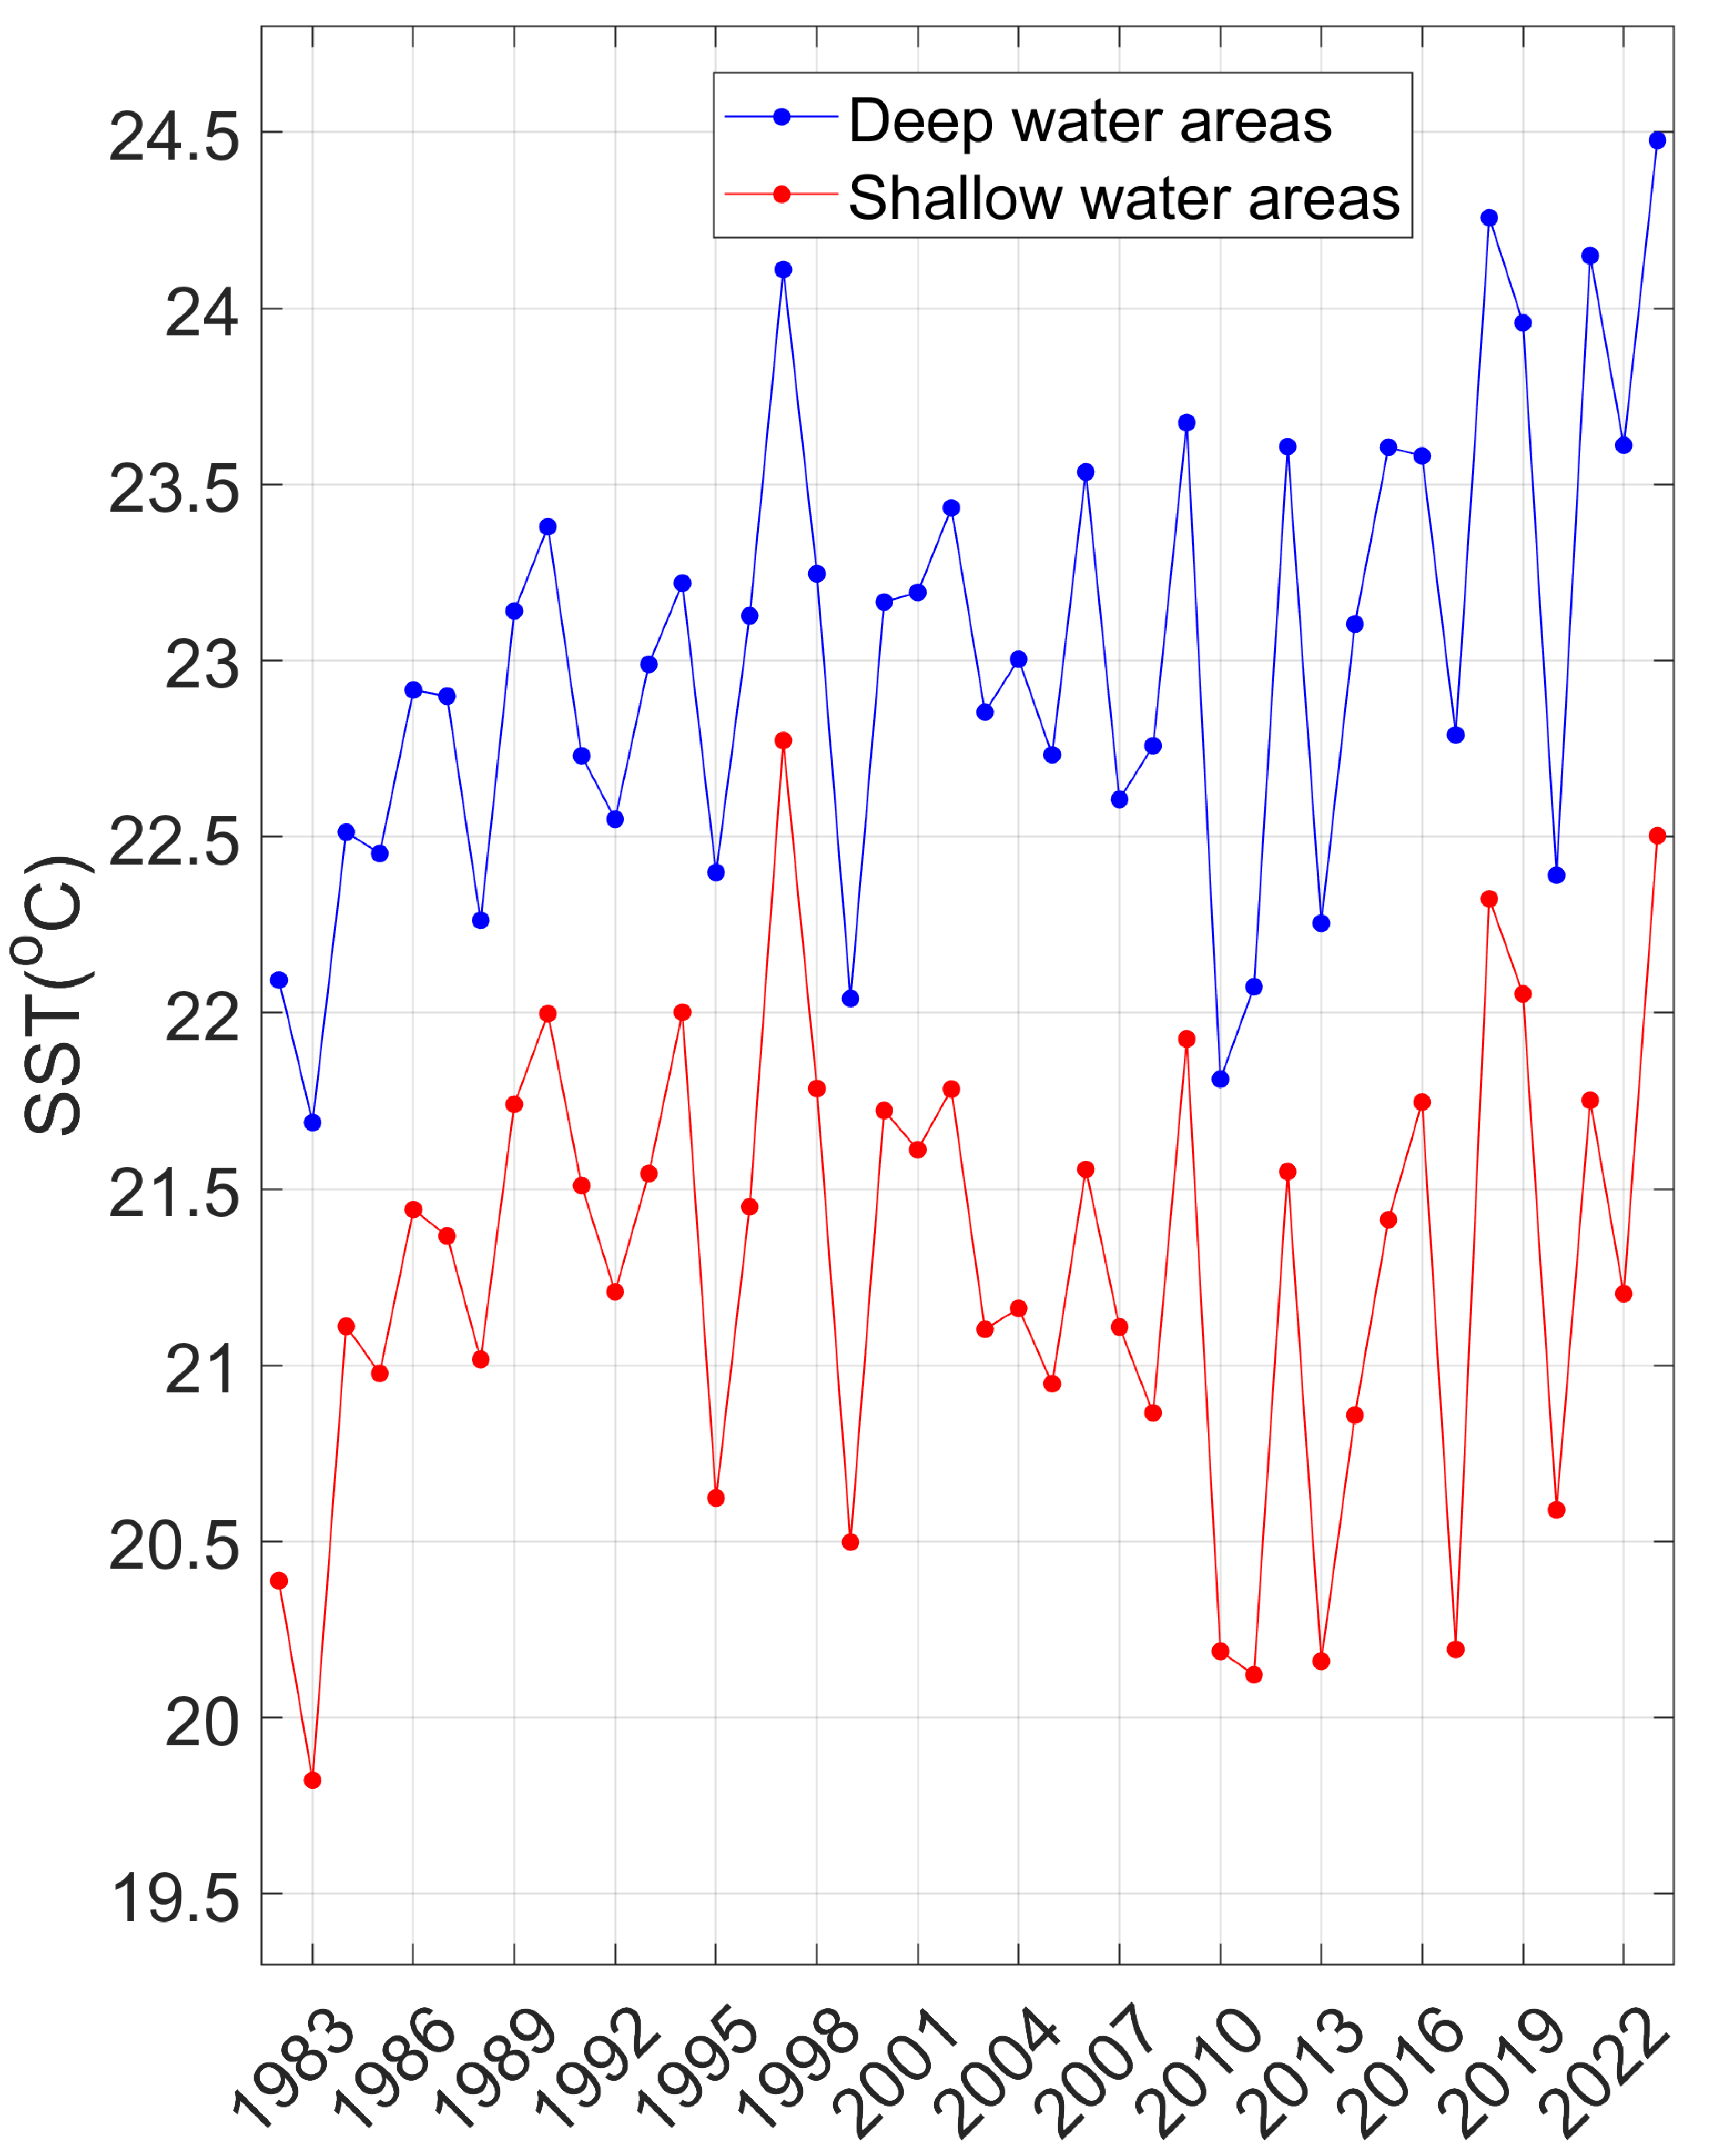
The formation mechanism of the TFIBG can be confirmed by the variation patterns of shallow-water and deep-water SSTs. Figure 4 shows that, although variations in the patterns of SSTs in shallow-water areas and SSTs in deep-water areas are very similar, their values are significantly different in such a small area as the Beibu Gulf, with an average difference of up to 1.8 °C, indicating that their values have independent controlling factors, which corresponds to the formation mechanism of the TFIBG caused by the variations in the SST in shallow-water areas and SST in deep-water areas.

3.2. Seasonal Variation in the TFIBG

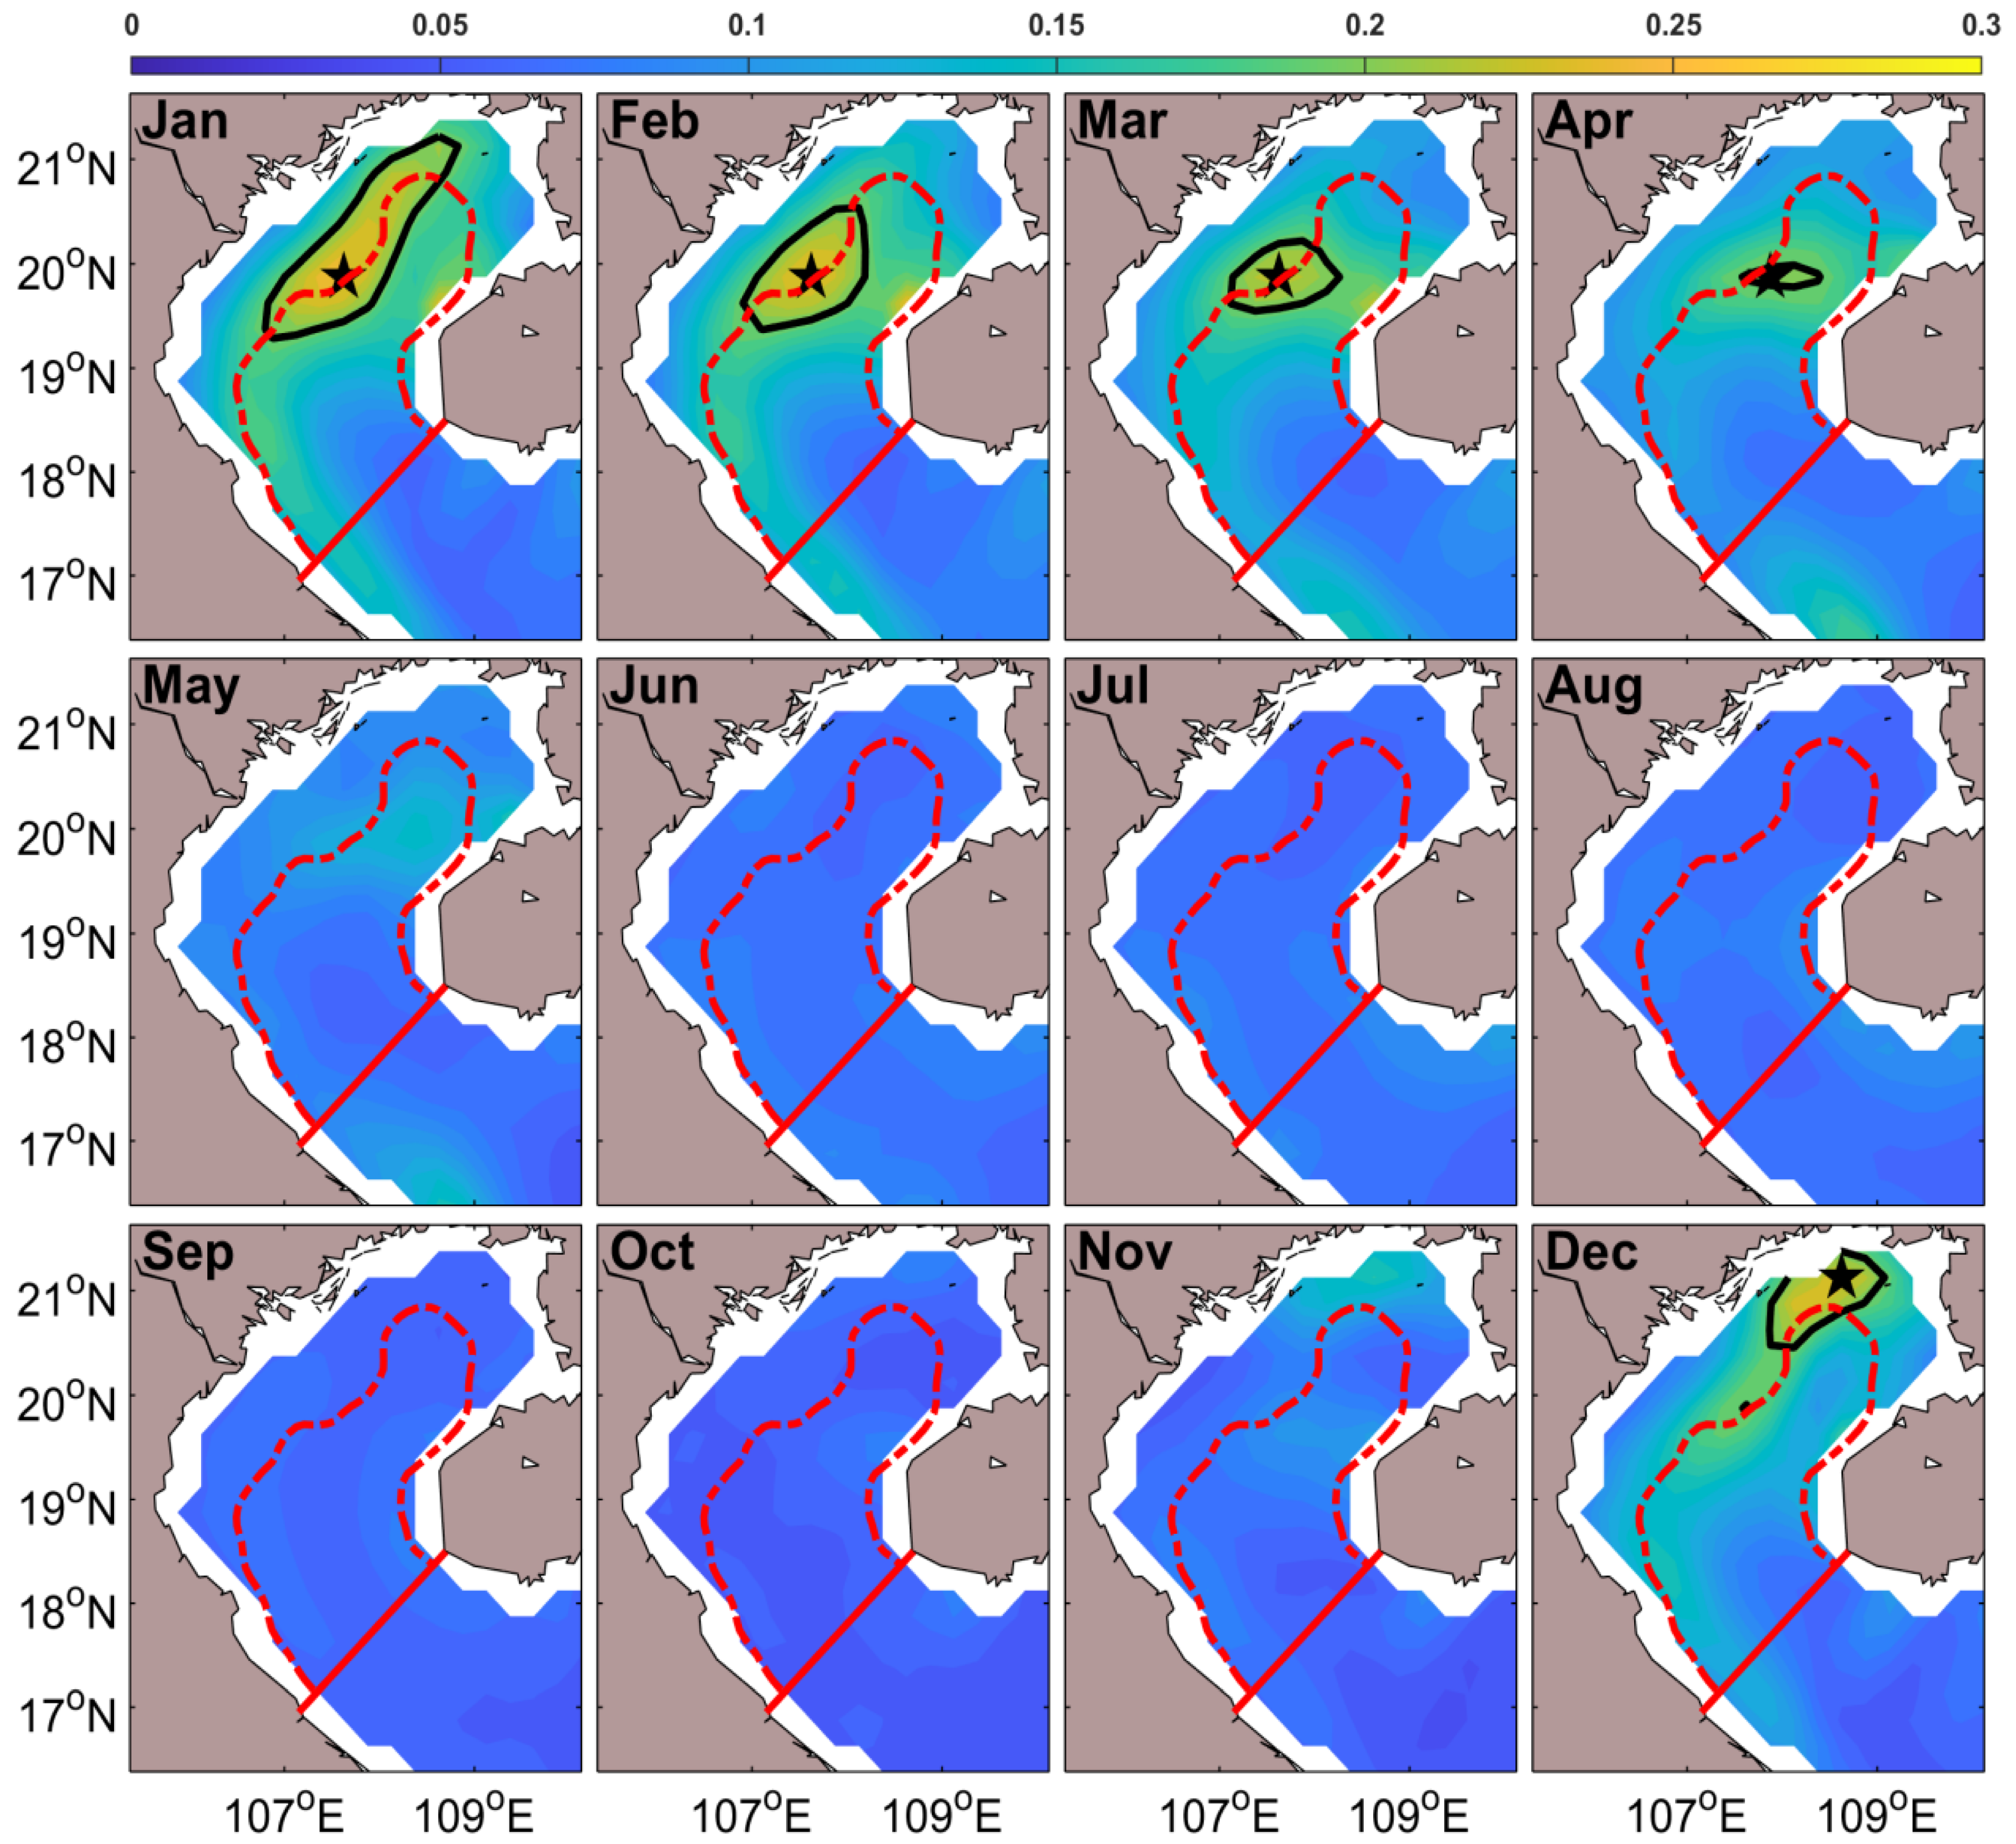
Figure 5 shows that TFIBG mainly occur from December to April of the following year. Their position is mainly in the central part of the Beibu Gulf from January to April, except for the center position in the northern part of the Beibu Gulf in December. Figure 5 also shows that the intensity and area of the TFIBG exhibit significant seasonal variations, which are quantitatively presented in Figure 6. Figure 6 shows that the intensity of the TFIBG gradually strengthens from December, reaches its strongest point in January of the following year, then gradually weakens from February, and finally disappears completely in May. The variation in the TFIBG area is similar to the variation in the TFIBG intensity. SST cooling and the northeast monsoon in the Beibu Gulf are the strongest in winter, which leads to the strongest TFIBG in winter, while SST cooling and the northeast monsoon weaken in spring, which leads to a gradual weakening of the TFIBG.

3.3. Interannual Variation in the TFIBG

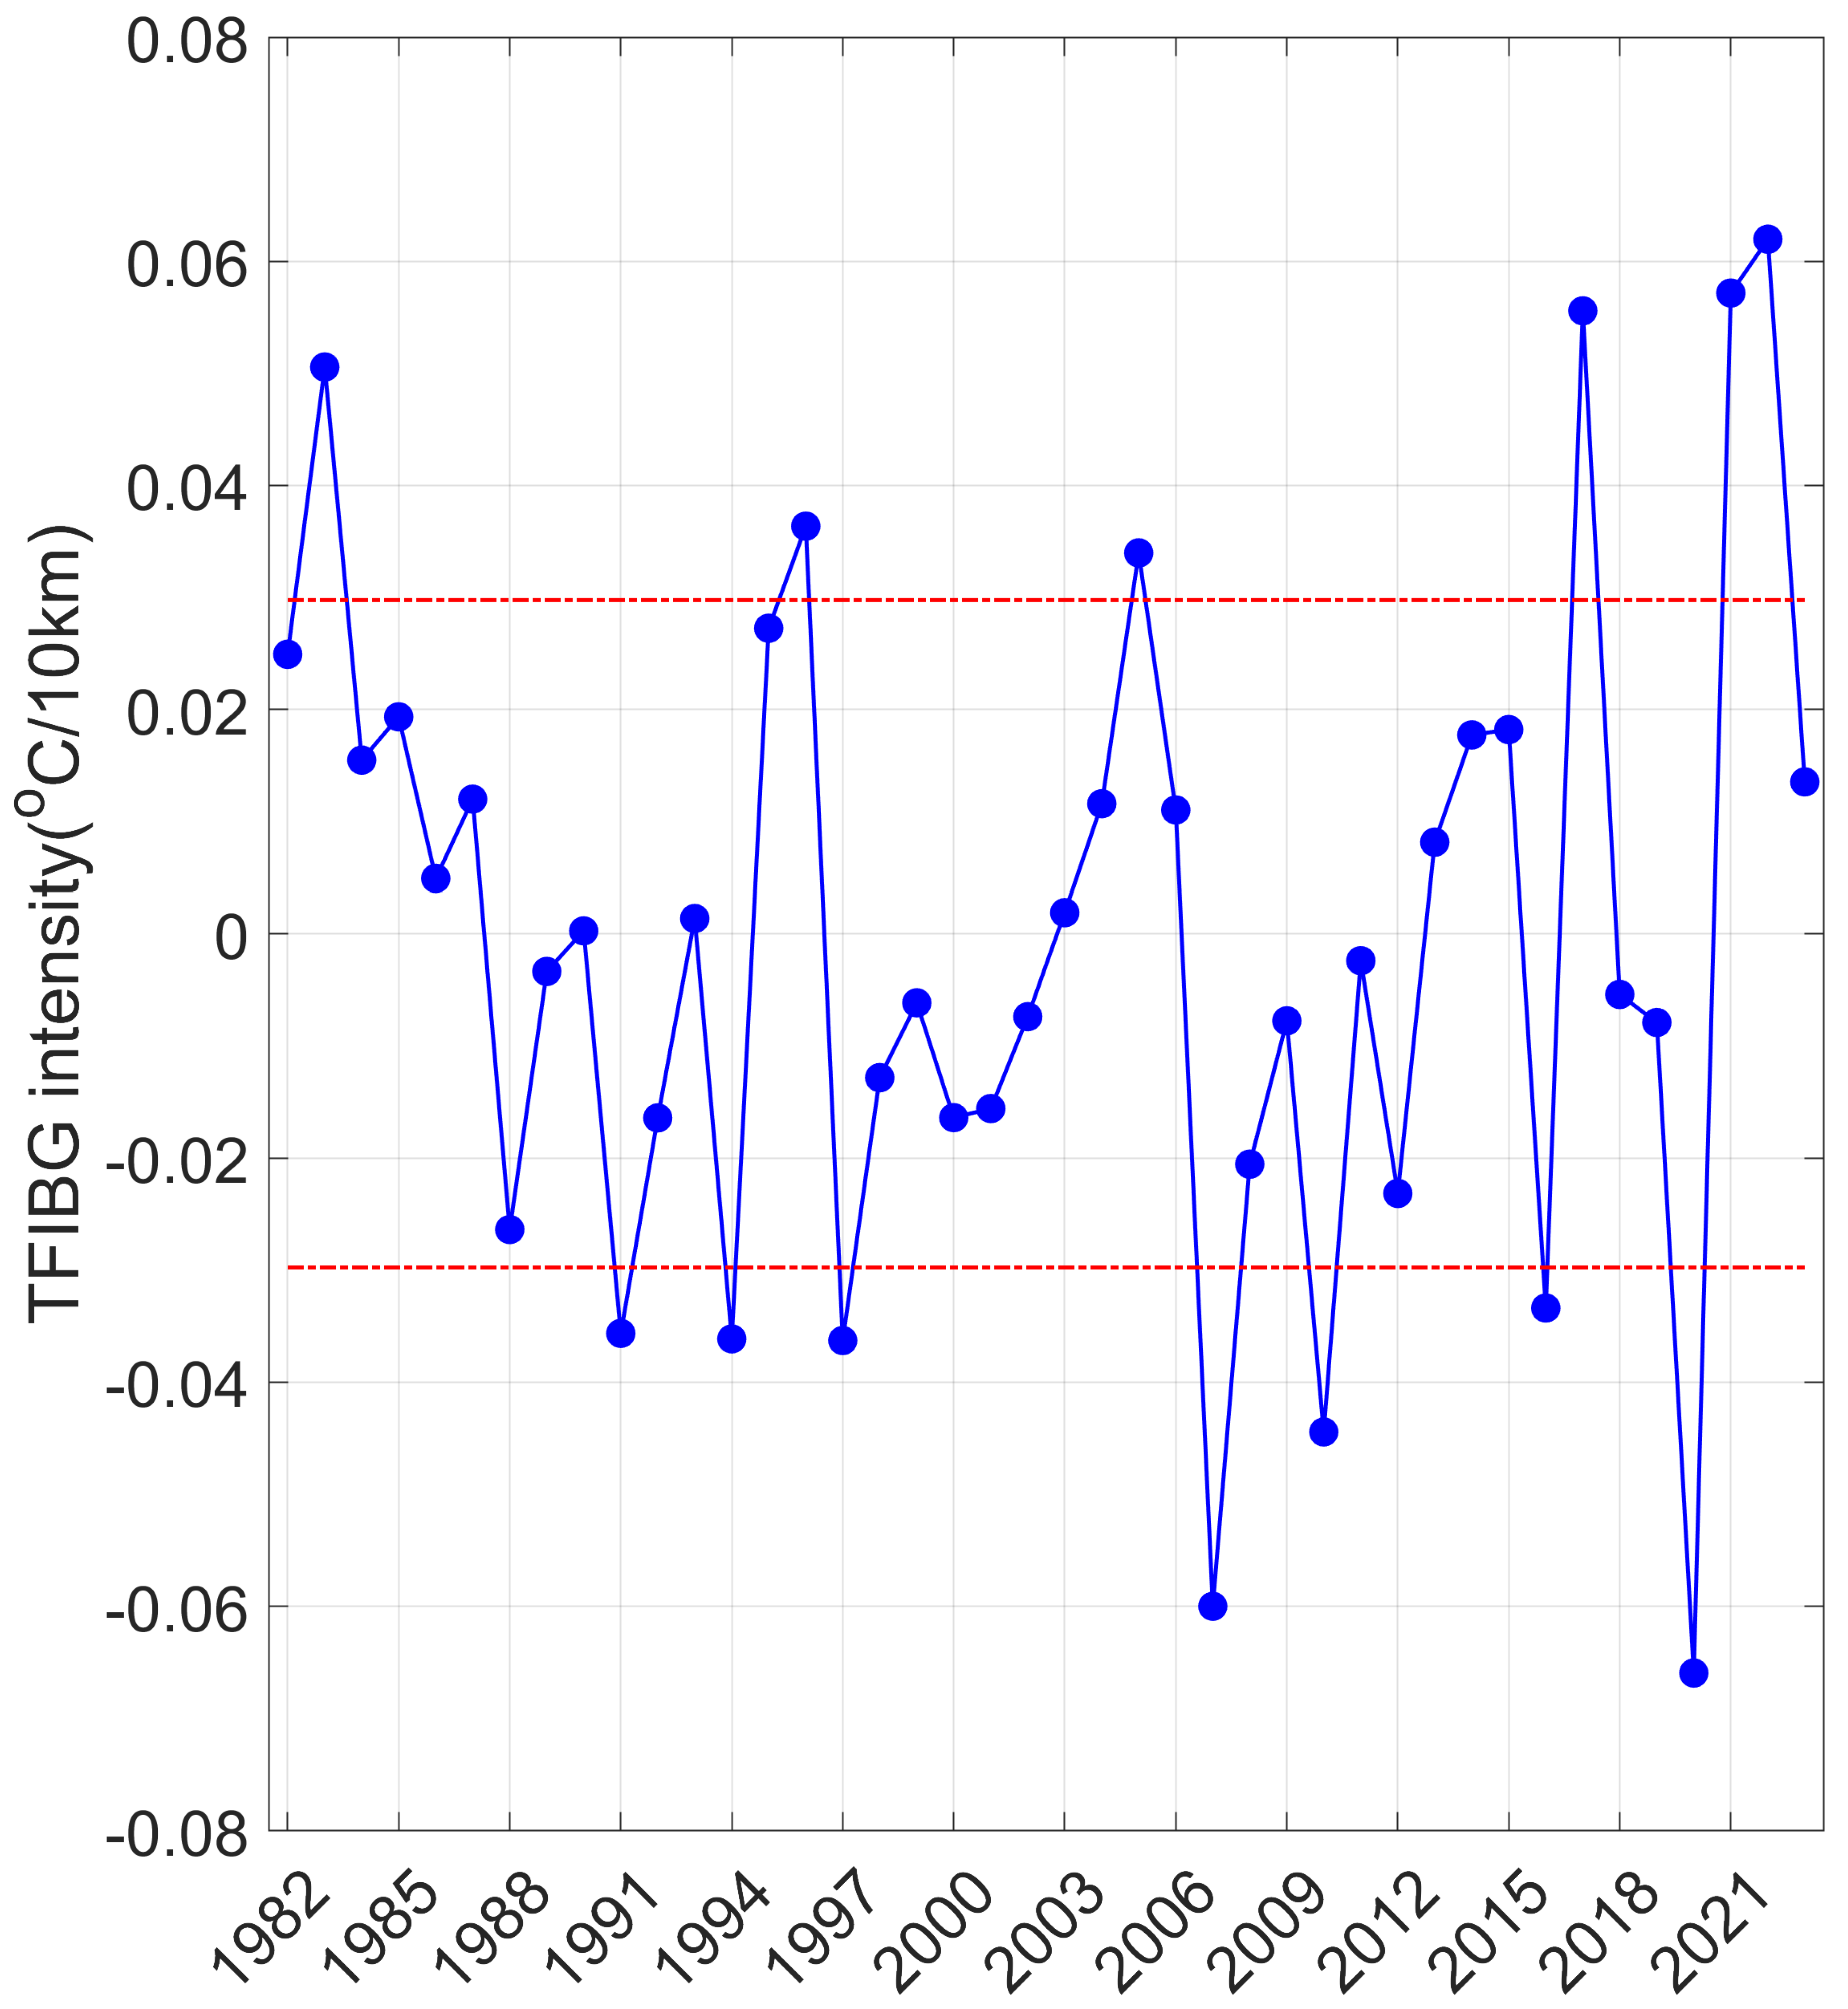
TFIBG mainly occur in winter, and are also the strongest in winter, so we take the wintertime TFIBG as the object to study the interannual variation in the TFIBG. Figure 7 shows that TFIBG intensity has significant interannual variability, with some years being stronger, such as 1983, 1996, 2005, 2017, 2021, and 2022, and some years being weaker, such as 1991, 1994, 1997, 2007, 2010, and 2020. Figure 8a1,a2 show that the TFIBG in the strong years are significantly stronger than the one in the weak years (Figure 8a3), and their average difference within the envelope of the climatic TFIBG can reach 0.094 °C/10 km.
The interannual variability in TFIBG intensity was related to the intensity of the northeast monsoon. The northeast monsoon is stronger in years with strong TFIBG (Figure 8a1–a3). The strong northeast monsoon causes a strong westward Ekman current, transporting warm water from the center of the Beibu Gulf to the coast (Figure 8b1–b3). At the same time, the strong northeast monsoon caused strong mixing near the coast, resulting in a decrease in the SST near the coast (Figure 8b1–b3), thus leading to a strong GM at the junction of cold and warm waters (Figure 8a1–a3).
If the conclusion above is correct, then the GM should be strong (weak) in the years with a strong (weak) northeast monsoon. Figure 8c1–c3 show that, in the years with a strong (weak) northeast monsoon, the GM in the Beibu Gulf is strong (weak), which verifies the conclusion above.

3.4. Rising Trend of TFIBG

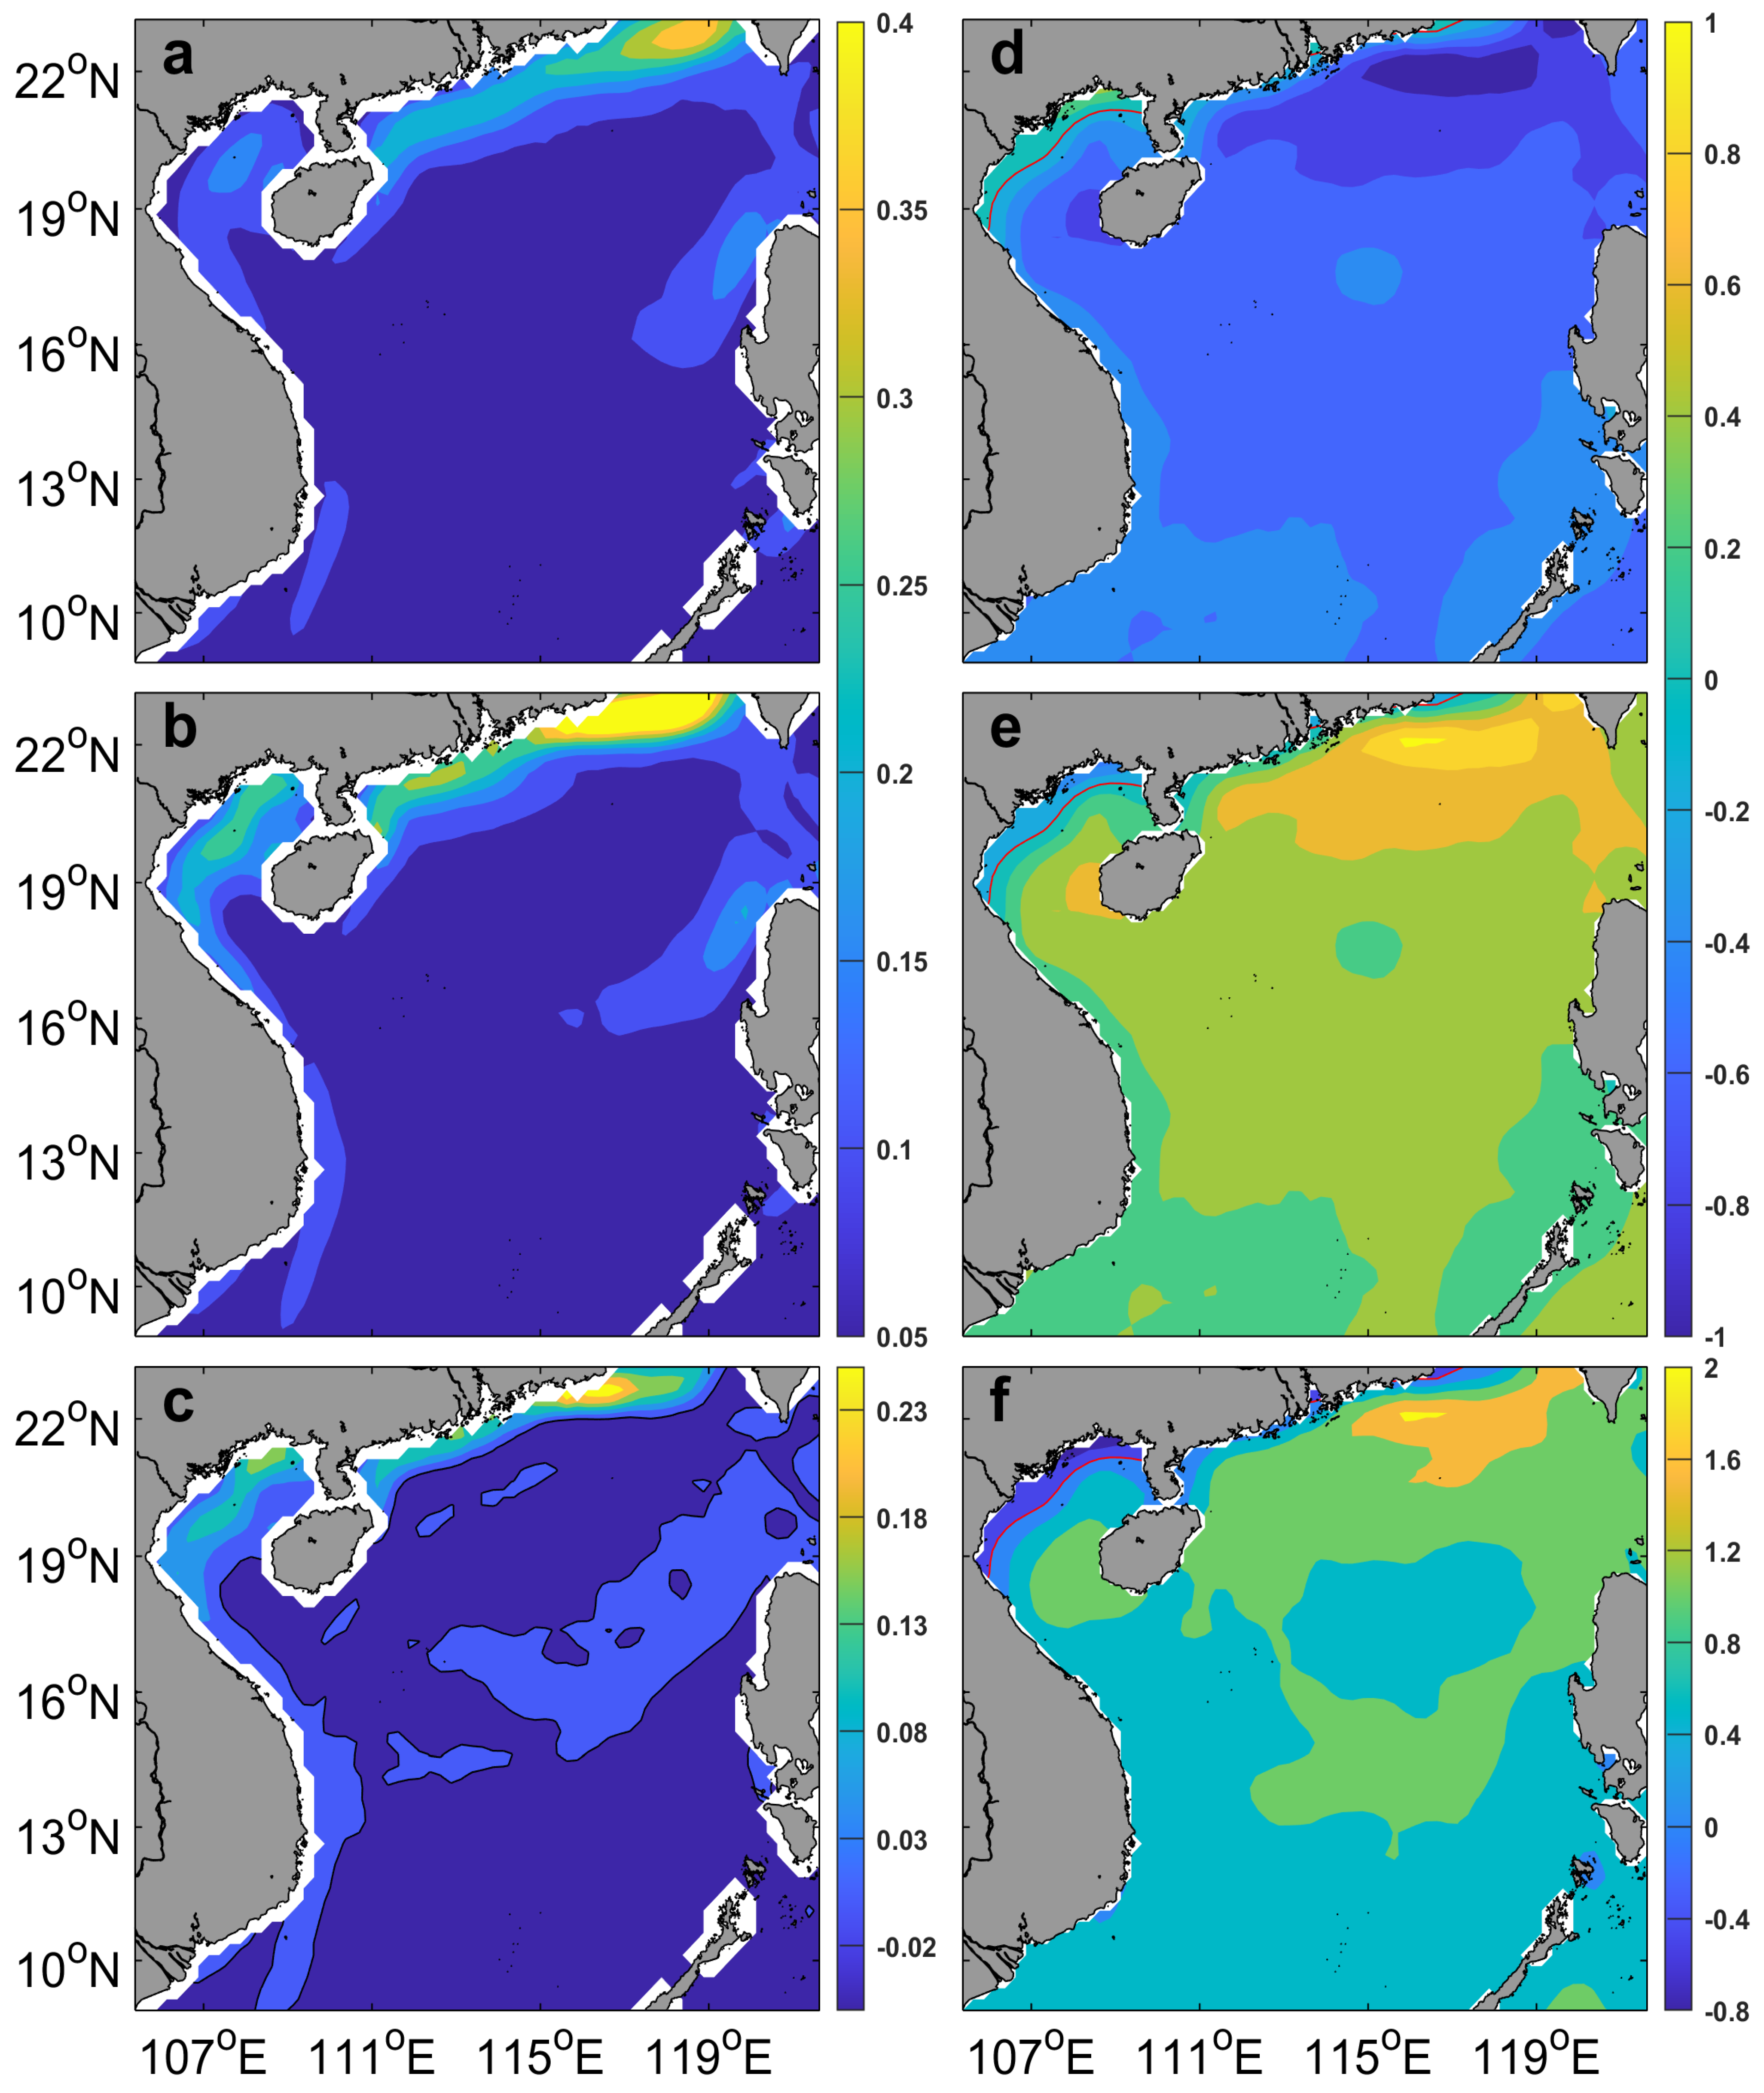
The annual variation in TFIBG shows that, in addition to interannual variations, there is also a linear trend variation in TFIBG (Figure 3 and Figure 7). The difference between the maximum and minimum values of the linear trend variation in TFIBG can reach 0.13 °C/10 km (Figure 3). Figure 9a–c show that TFIBG in recent years are significantly stronger than those in the 1980s, and their average difference within the envelope of the climatic TFIBG can reach 0.12 °C/10 km (Figure 9c).
The linear trend variation in TFIBG may be related to the regional heterogeneity of global warming. Figure 9d shows that the SST near the coast of the Beibu Gulf (Central Sea Basin) is abnormally high (low) in the 1980s. However, in the context of global warming, the SST near the coast of the Beibu Gulf (Central Sea Basin) has been abnormally low (high) in recent years (Figure 9e). This indicates that, in the context of global warming, the SST in the SCS is generally increasing, except for the decrease in the SST along the west coast of the Beibu Gulf (Figure 9d–f), which has led to the strengthening of the TFIBG and further caused an upward trend in TFIBG from 1992 to 2022.

4. Discussion

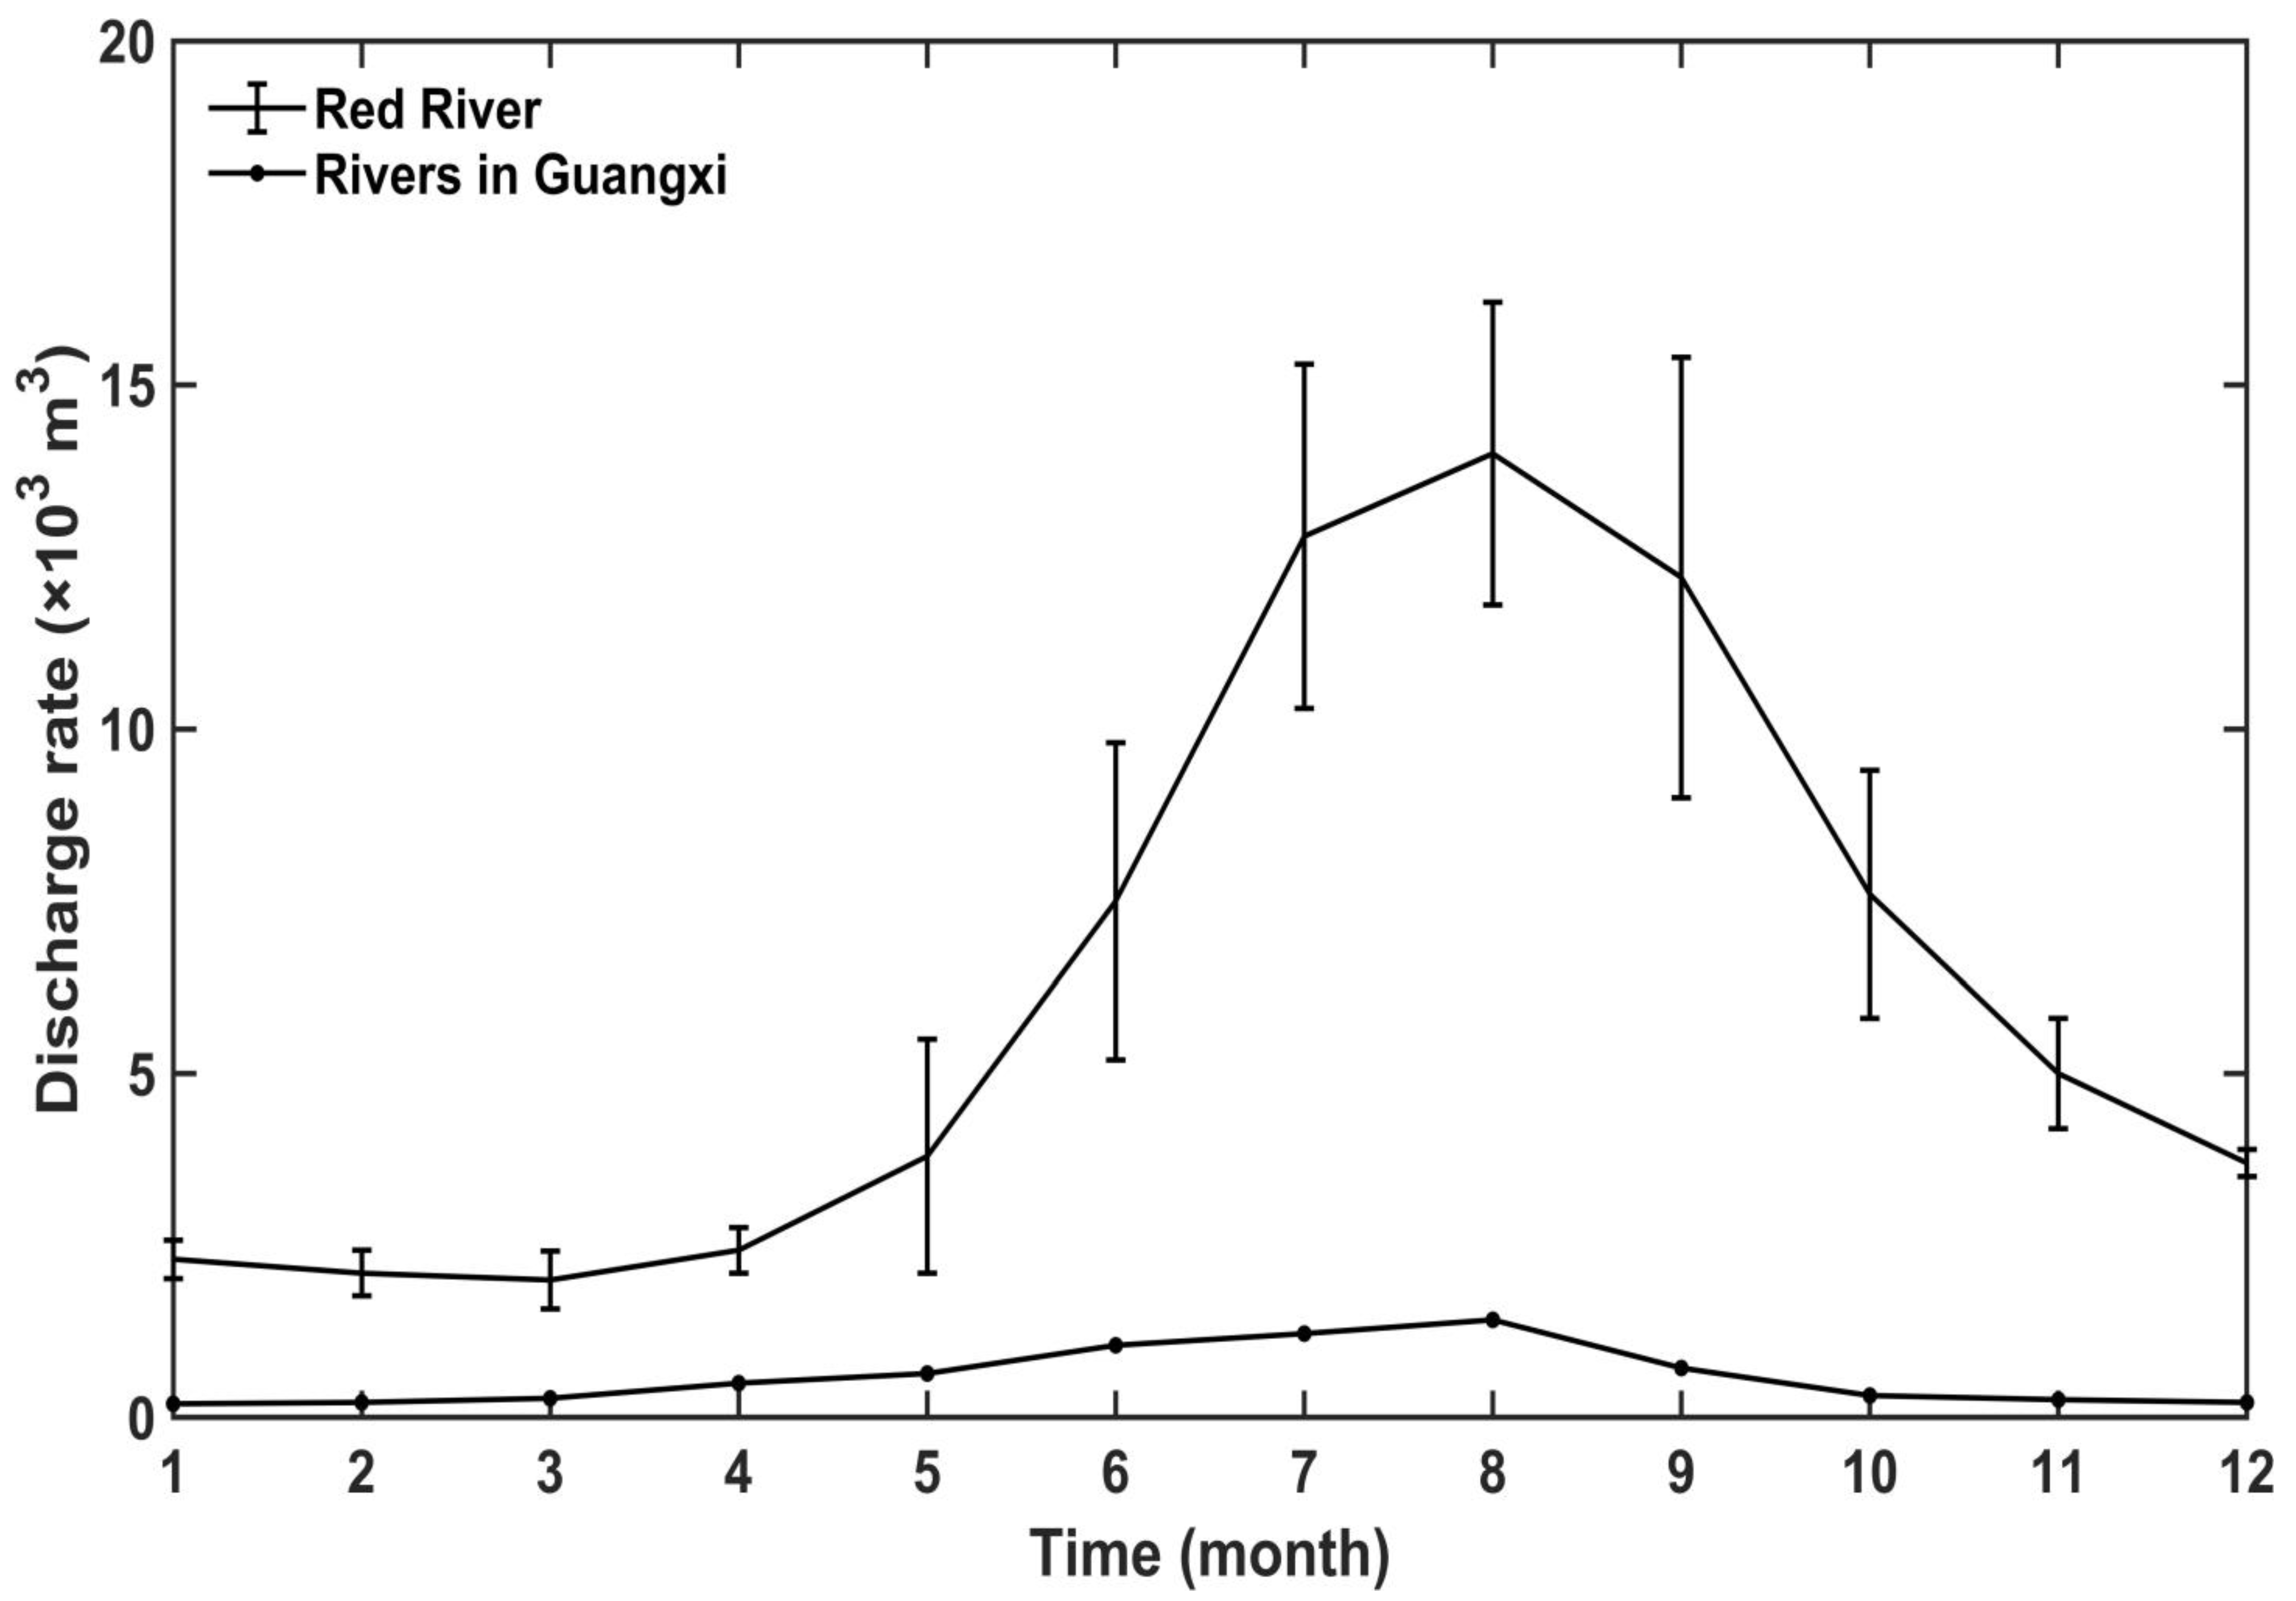
There is some freshwater runoff along the coast of the Beibu Gulf, which can affect the marine environment of the Beibu Gulf. Wang et al. (2001) mentioned that the strengthening of the thermal front along the Beibu Gulf coast is related to the plume of the Red River in spring [17]. Shi et al. (2022) pointed out that the inflow of the Red River in Vietnam and the inflow along the coast of Guangxi, China, have significant impacts on the ecological environment in the northern Beibu Gulf [1]. However, the specific impact of freshwater runoff along the Beibu Gulf coast on TFIBG is still unclear. The observation data show that the runoff flow of the Red River and the coastal runoff flow along the coast of Guangxi are the greatest in summer and the smallest in winter, with a difference of nearly five times between the two [1,3,5] (Figure 10). Previous studies have pointed out that, in some sea areas (such as the Gulf of Thailand), the intensity of thermal fronts is related to the intensity of freshwater runoff [18]. And the impact of wintertime runoff into the Beibu Gulf is limited to a location closer to the shore [1], while TFIBG are located at a distance from the shore. Therefore, we believe that the impact of wintertime runoff into the Beibu Gulf on TFIBG is limited. Due to the lack of high-resolution ocean in-site observations on freshwater runoff, reliable high-resolution reanalysis data on freshwater runoff, and the inability of numerical models to simulate fine freshwater runoff in the Beibu Gulf [32,33,34], our study on the effect of freshwater runoff on the thermal front in the Beibu Gulf can only be limited to speculation based on the existing theories. Of course, we will continue to conduct in-depth research on the impact of freshwater runoff on TFIBG in the future.
The water exchange between the Beibu Gulf and the SCS will affect ocean circulation in the northern part of the Beibu Gulf, thereby affecting the spatial distribution of the SST in the northern part of the Beibu Gulf, and may also affect TFIBG [2,4,15,33,34,35,36,37,38]. Therefore, it is worth studying in the future the impact of water exchange between the Beibu Gulf and the SCS on the marine environment in the northern part of the Beibu Gulf.

5. Conclusions

Based on the satellite-observed data and reanalysis data, we studied the spatiotemporal variation characteristics and dynamic mechanisms of TFIBG. TFIBG were mainly distributed in the northwest of the Beibu Gulf in a band-like pattern. Their formation mechanism is related to bathymetry and ocean circulation. The SST in the shallow-water areas of the Beibu Gulf is low due to tidal mixing and wind stirring in winter, while the SST in the deep-water areas is relatively high due to its large water depth. Therefore, a significant thermal gradient is generated at the junction of the shallow-water areas and deep-water areas. Concurrently, the Ekman current transports warm water from the center to the west coast of the Beibu Gulf, which strengthens the thermal gradient at the junction of shallow-water areas and deep-water areas. The combined effect of isobaths and the Ekman current led to the formation of TFIBG at the junction of shallow water and deep water.
TFIBG exhibit significant seasonal variation, interannual variation, and linear rising trends. They occur in December, reach their peak in January of the following year, then gradually weaken and disappear completely by May. The interannual variability in TFIBG intensity was related to the intensity of the northeast monsoon. The strong northeast monsoon can cause more warm water to be transported from the center to the west coast of the Beibu Gulf through the Ekman current and can cause a decrease in SSTs in the shallow-water areas of the Beibu Gulf by strengthening mixing, which strengthens TFIBG on an interannual scale.
The difference between the maximum and minimum values of the linear rising trend of the TFIBG can reach 0.12 °C/10 km, which may be related to the regional heterogeneity of global warming. Under the background of global warming, the SST in the SCS is generally increasing, except for a decrease in the SST along the west coast of the Beibu Gulf, which has led to the rising trend of the TFIBG from 1982 to 2023.
The impact of wintertime runoff into the Beibu Gulf is limited to a location closer to the shore, while TFIBG are located at a distance from the shore. Therefore, we believe that the impact of wintertime runoff into the Beibu Gulf on TFIBG is limited. The exchange of water between the Beibu Gulf and the SCS through the Qiongzhou Strait can affect ocean circulation in the Beibu Gulf, thereby affecting the spatial distribution of SSTs [2,4,15,33,34,35,36,37,38]. Therefore, it is worth studying in the future the impact of water exchange between the Beibu Gulf and the SCS on the marine environment in the northern part of the Beibu Gulf.
Due to the lack of large-scale and high-resolution ocean in-site observation data, reliable high-resolution reanalysis data, and the inability of numerical models to simulate fine dynamic processes and freshwater runoff in the Beibu Gulf, our study of the detailed dynamic processes of TFIBG is severely limited. At present, we can only speculate the formation mechanism of TFIBG based on the existing research results and theories. We will pay attention to the collection of high-resolution in-site observation data in the Beibu Gulf and attempt to further study the formation mechanism of TFIBG through numerical model experiments in the future.

Author Contributions

Conceptualization, R.S.; methodology, R.S.; validation, R.S. and Y.G.; formal analysis, R.S. and X.S.; investigation, R.S.; resources, R.S. and C.Z.; data curation, R.S.; writing—original draft preparation, R.S. and X.S.; writing—review and editing, R.S. and S.H.; supervision, R.S.; project administration, R.S.; funding acquisition, Y.G. and P.L. All authors have read and agreed to the published version of the manuscript.

Funding

This research was funded by the Project of Sanya Yazhou Bay Science and Technology City, Grant No: SKJC-JYRC-2024-68; Research Startup Funding from Hainan Institute of Zhejiang University, Grant No: HZY20210801; and National Key R&D Program of China, Grant No: 2022YFC3103402.

Data Availability Statement

We acknowledge several datasets used in this paper. Wind vector datasets were obtained from Remote Sensing Systems (www.remss.com, accessed on 1 August 2024). OISST datasets were provided by the NCEI of NOAA (https://www.ncei.noaa.gov/thredds/catalog/OisstBase/NetCDF/V2.1/AVHRR/catalog.html). Ocean current datasets were provided by the ESR of NASA (https://www.esr.org/research/oscar/oscar-surface-currents/).

Conflicts of Interest

The authors declare no conflicts of interest.

References

  1. Shi, M.; Chen, B.; Zhang, J. Research status and prospect of runoff in the Beibu Gulf. Guangxi Sci. 2022, 29, 1026–1032. [Google Scholar] [CrossRef]
  2. Chen, Z.H. Numerical Simulation on Seasonal Variation of Ocean Circulation and Its Dynamic Mechanism in the Beibu Gulf. Ph.D. Thesis, Ocean University of China, Qingdao, China, 2013. [Google Scholar]
  3. Ding, Y. Investigation on the Circulation and Coastal Trapped Waves in the Northern South China Sea. Ph.D. Thesis, Ocean University of China, Qingdao, China, 2015. [Google Scholar]
  4. Chen, B.; Shi, M. Advances in study of Beibu Gulf circulation. Guangxi Sci. 2019, 26, 595–603. [Google Scholar]
  5. Chen, C.; Lai, Z.; Beardsley, R.C.; Xu, Q.; Lin, H.; Viet, N.T. Current Separation and Upwelling over the Southeast Shelf of Vietnam in the South China Sea. J. Geophys. Res. Ocean. 2012, 117, C03033. [Google Scholar] [CrossRef]
  6. Chen, D.; Liu, W.T.; Tang, W.; Wang, Z. Air-Sea Interaction at an Oceanic Front: Implications for Frontogenesis and Primary Production. Geophys. Res. Lett. 2003, 30, 1745. [Google Scholar] [CrossRef]
  7. Belkin, I.M.; Cornillon, P.C.; Sherman, K. Fronts in Large Marine Ecosystems. Prog. Oceanogr. 2009, 81, 223–236. [Google Scholar] [CrossRef]
  8. Belkin, I.M. Remote Sensing of Ocean Fronts in Marine Ecology and Fisheries. Remote Sens. 2021, 13, 883. [Google Scholar] [CrossRef]
  9. Huang, D.; Zhang, T.; Zhou, F. Sea-Surface Temperature Fronts in the Yellow and East China Seas from TRMM Microwave Imager Data. Deep Sea Res. Part II Top. Stud. Oceanogr. 2010, 57, 1017–1024. [Google Scholar] [CrossRef]
  10. Wang, Y.; Yu, Y.; Zhang, Y.; Zhang, H.-R.; Chai, F. Distribution and Variability of Sea Surface Temperature Fronts in the South China Sea. Estuar. Coast. Shelf Sci. 2020, 240, 106793. [Google Scholar] [CrossRef]
  11. Liu, D.; Lü, T.; Lin, L.; Wei, Q.-S. Review of Fronts and Its Ecological Effects in the Shelf Sea of China. Adv. Mar. Sci. 2022, 40, 725–741. [Google Scholar]
  12. Zhang, H.-R.; Yu, Y.; Gao, Z.; Zhang, Y.; Ma, W.; Yang, D.; Yin, B.; Wang, Y. Seasonal and Interannual Variability of Fronts and Their Impact on Chlorophyll-a in the Indonesian Seas. J. Phys. Oceanogr. 2023, 53, 2847–2859. [Google Scholar] [CrossRef]
  13. Jing, Z.; Qi, Y.; Du, Y.; Zhang, S.; Xie, L. Summer Upwelling and Thermal Fronts in the Northwestern South China Sea: Observational Analysis of Two Mesoscale Mapping Surveys. J. Geophys. Res. Oceans 2015, 120, 1993–2006. [Google Scholar] [CrossRef]
  14. Jing, Z.; Qi, Y.; Fox-Kemper, B.; Du, Y.; Lian, S. Seasonal Thermal Fronts on the Northern South China Sea Shelf: Satellite Measurements and Three Repeated Field Surveys. J. Geophys. Res. Oceans 2016, 121, 1914–1930. [Google Scholar] [CrossRef]
  15. Sun, R.; Li, P.; Zhai, F.; Gu, Y.; Bai, P. New Insight Into the Formation Mechanism of Wintertime Thermal Front West of Luzon Island. J. Geophys. Res. Oceans 2024, 129, e2023JC020774. [Google Scholar] [CrossRef]
  16. Zhang, L.; Sun, R.; Li, P.; Ye, G. Seasonal and Interannual Variabilities of the Thermal Front East of Gulf of Thailand. Front. Mar. Sci. 2024, 11, 1398791. [Google Scholar] [CrossRef]
  17. Wang, D.; Liu, Y.; Qi, Y.; Shi, P. Seasonal Variability of Thermal Fronts in the Northern South China Sea from Satellite Data. Geophys. Res. Lett. 2001, 28, 3963–3966. [Google Scholar] [CrossRef]
  18. Belkin, I.; Cornillon, P. SST Fronts of the Pacific Coastal and Marginal Seas. Pac. Oceanogr. 2003, 1, 90–113. [Google Scholar]
  19. Luo, L.; Wang, X.; Liu, Y.; Li, S. Seasonal and interannual variation of thermal fronts in Beibu Gulf, South China Sea. J. Trop. Oceanogr. 2003, 22, 60–67. [Google Scholar]
  20. Huang, B.; Liu, C.; Banzon, V.; Freeman, E.; Graham, G.; Hankins, B.; Smith, T.; Zhang, H.-M. Improvements of the Daily Optimum Interpolation Sea Surface Temperature (DOISST) Version 2.1. J. Clim. 2021, 34, 2923–2939. [Google Scholar] [CrossRef]
  21. Atlas, R.; Hoffman, R.N.; Ardizzone, J.; Leidner, S.M.; Jusem, J.C.; Smith, D.K.; Gombos, D. A Cross-Calibrated, Multiplatform Ocean Surface Wind Velocity Product for Meteorological and Oceanographic Applications. Bull. Am. Meteorol. Soc. 2011, 92, 157–174. [Google Scholar] [CrossRef]
  22. Mears, C.A.; Scott, J.; Wentz, F.J.; Ricciardulli, L.; Leidner, S.M.; Hoffman, R.; Atlas, R. A Near-Real-Time Version of the Cross-Calibrated Multiplatform (CCMP) Ocean Surface Wind Velocity Data Set. J. Geophys. Res. Oceans 2019, 124, 6997–7010. [Google Scholar] [CrossRef]
  23. Sun, R.; Ling, Z.; Chen, C.; Yan, Y. Interannual Variability of Thermal Front West of Luzon Island in Boreal Winter. Acta Oceanol. Sin. 2015, 34, 102–108. [Google Scholar] [CrossRef]
  24. Dohan, K. Ocean Surface Current Analyses Real-Time (OSCAR) Surface Currents—Near Real Time 0.25 Degree (Version 2.0). User’s Handbook; Earth and Space Research; PO.DAAC: Pasadena, CA, USA, 2021. [Google Scholar]
  25. Dohan, K.; Kao, H.-Y.; Lagerloef, G.S.E. The Freshwater Balance: Over the North Atlantic SPURS Domain from Aquarius Satellite Salinity, OSCAR Satellite Surface Currents, and Some Simplified Approaches. Oceanography 2015, 28, 86–95. [Google Scholar] [CrossRef]
  26. Chang, Y.; Shieh, W.-J.; Lee, M.-A.; Chan, J.-W.; Lan, K.-W.; Weng, J.-S. Fine-Scale Sea Surface Temperature Fronts in Wintertime in the Northern South China Sea. Int. J. Remote Sens. 2010, 31, 4807–4818. [Google Scholar] [CrossRef]
  27. Lin, L.; Liu, D.; Luo, C.; Xie, L. Double Fronts in the Yellow Sea in Summertime Identified Using Sea Surface Temperature Data of Multi-Scale Ultra-High Resolution Analysis. Cont. Shelf Res. 2019, 175, 76–86. [Google Scholar] [CrossRef]
  28. Belkin, I.M.; Cornillon, P.C. Surface thermal fronts of the Okhotsk Sea. Pac. Oceanogr. 2004, 2, 6–19. [Google Scholar]
  29. Ullman, D.S.; Cornillon, P.C. Satellite-Derived Sea Surface Temperature Fronts on the Continental Shelf off the Northeast U.S. Coast. J. Geophys. Res. Oceans 1999, 104, 23459–23478. [Google Scholar] [CrossRef]
  30. Xie, S.-P.; Hafner, J.; Tanimoto, Y.; Liu, W.T.; Tokinaga, H.; Xu, H. Bathymetric Effect on the Winter Sea Surface Temperature and Climate of the Yellow and East China Seas. Geophys. Res. Lett. 2002, 29, 81-1–81-4. [Google Scholar] [CrossRef]
  31. Huang, D.; Fan, X.; Xu, D.; Tong, Y.; Su, J. Westward Shift of the Yellow Sea Warm Salty Tongue. Geophys. Res. Lett. 2005, 32, L24613. [Google Scholar] [CrossRef]
  32. Gao, J.; Shi, M.; Chen, B.; Guo, P.; Zhao, D. Responses of the Circulation and Water Mass in the Beibu Gulf to the Seasonal Forcing Regimes. Acta Oceanol. Sin. 2014, 33, 1–11. [Google Scholar] [CrossRef]
  33. Gao, J.; Chen, B.; Shi, M. Summer Circulation Structure and Formation Mechanism in the Beibu Gulf. Sci. China Earth Sci. 2015, 58, 286–299. [Google Scholar] [CrossRef]
  34. Chen, Z.; Qiao, F.; Xia, C.; Wang, G. The Numerical Investigation of Seasonal Variation of the Cold Water Mass in the Beibu Gulf and Its Mechanisms. Acta Oceanol. Sin. 2015, 34, 44–54. [Google Scholar] [CrossRef]
  35. Shi, M.; Chen, C.; Xu, Q.; Lin, H.; Liu, G.; Wang, H.; Wang, F.; Yan, J. The Role of Qiongzhou Strait in the Seasonal Variation of the South China Sea Circulation. J. Phys. Oceanogr. 2002, 32, 103–121. [Google Scholar] [CrossRef]
  36. Chen, B.; Xu, Z.; Ya, H.; Chen, X.; Xu, M. Impact of the Water Input from the Eastern Qiongzhou Strait to the Beibu Gulf on Guangxi Coastal Circulation. Acta Oceanol. Sin. 2019, 38, 1–11. [Google Scholar] [CrossRef]
  37. Chen, Y.; Song, D.; Wang, N.; Ding, Y.; Shi, M.; Chen, B.; Bao, X. Baroclinic Responses of Qiongzhou Strait Throughflow to Different Forcings. Estuar. Coast. Shelf Sci. 2024, 308, 108938. [Google Scholar] [CrossRef]
  38. Zheng, Q.; Wang, H.; Li, S.; Cao, Z.; Bao, M. Dynamics of Currents in the Qiongzhou Strait during Spring and Summer Based on a Numerical Simulation. Front. Mar. Sci. 2024, 11, 1367145. [Google Scholar] [CrossRef]
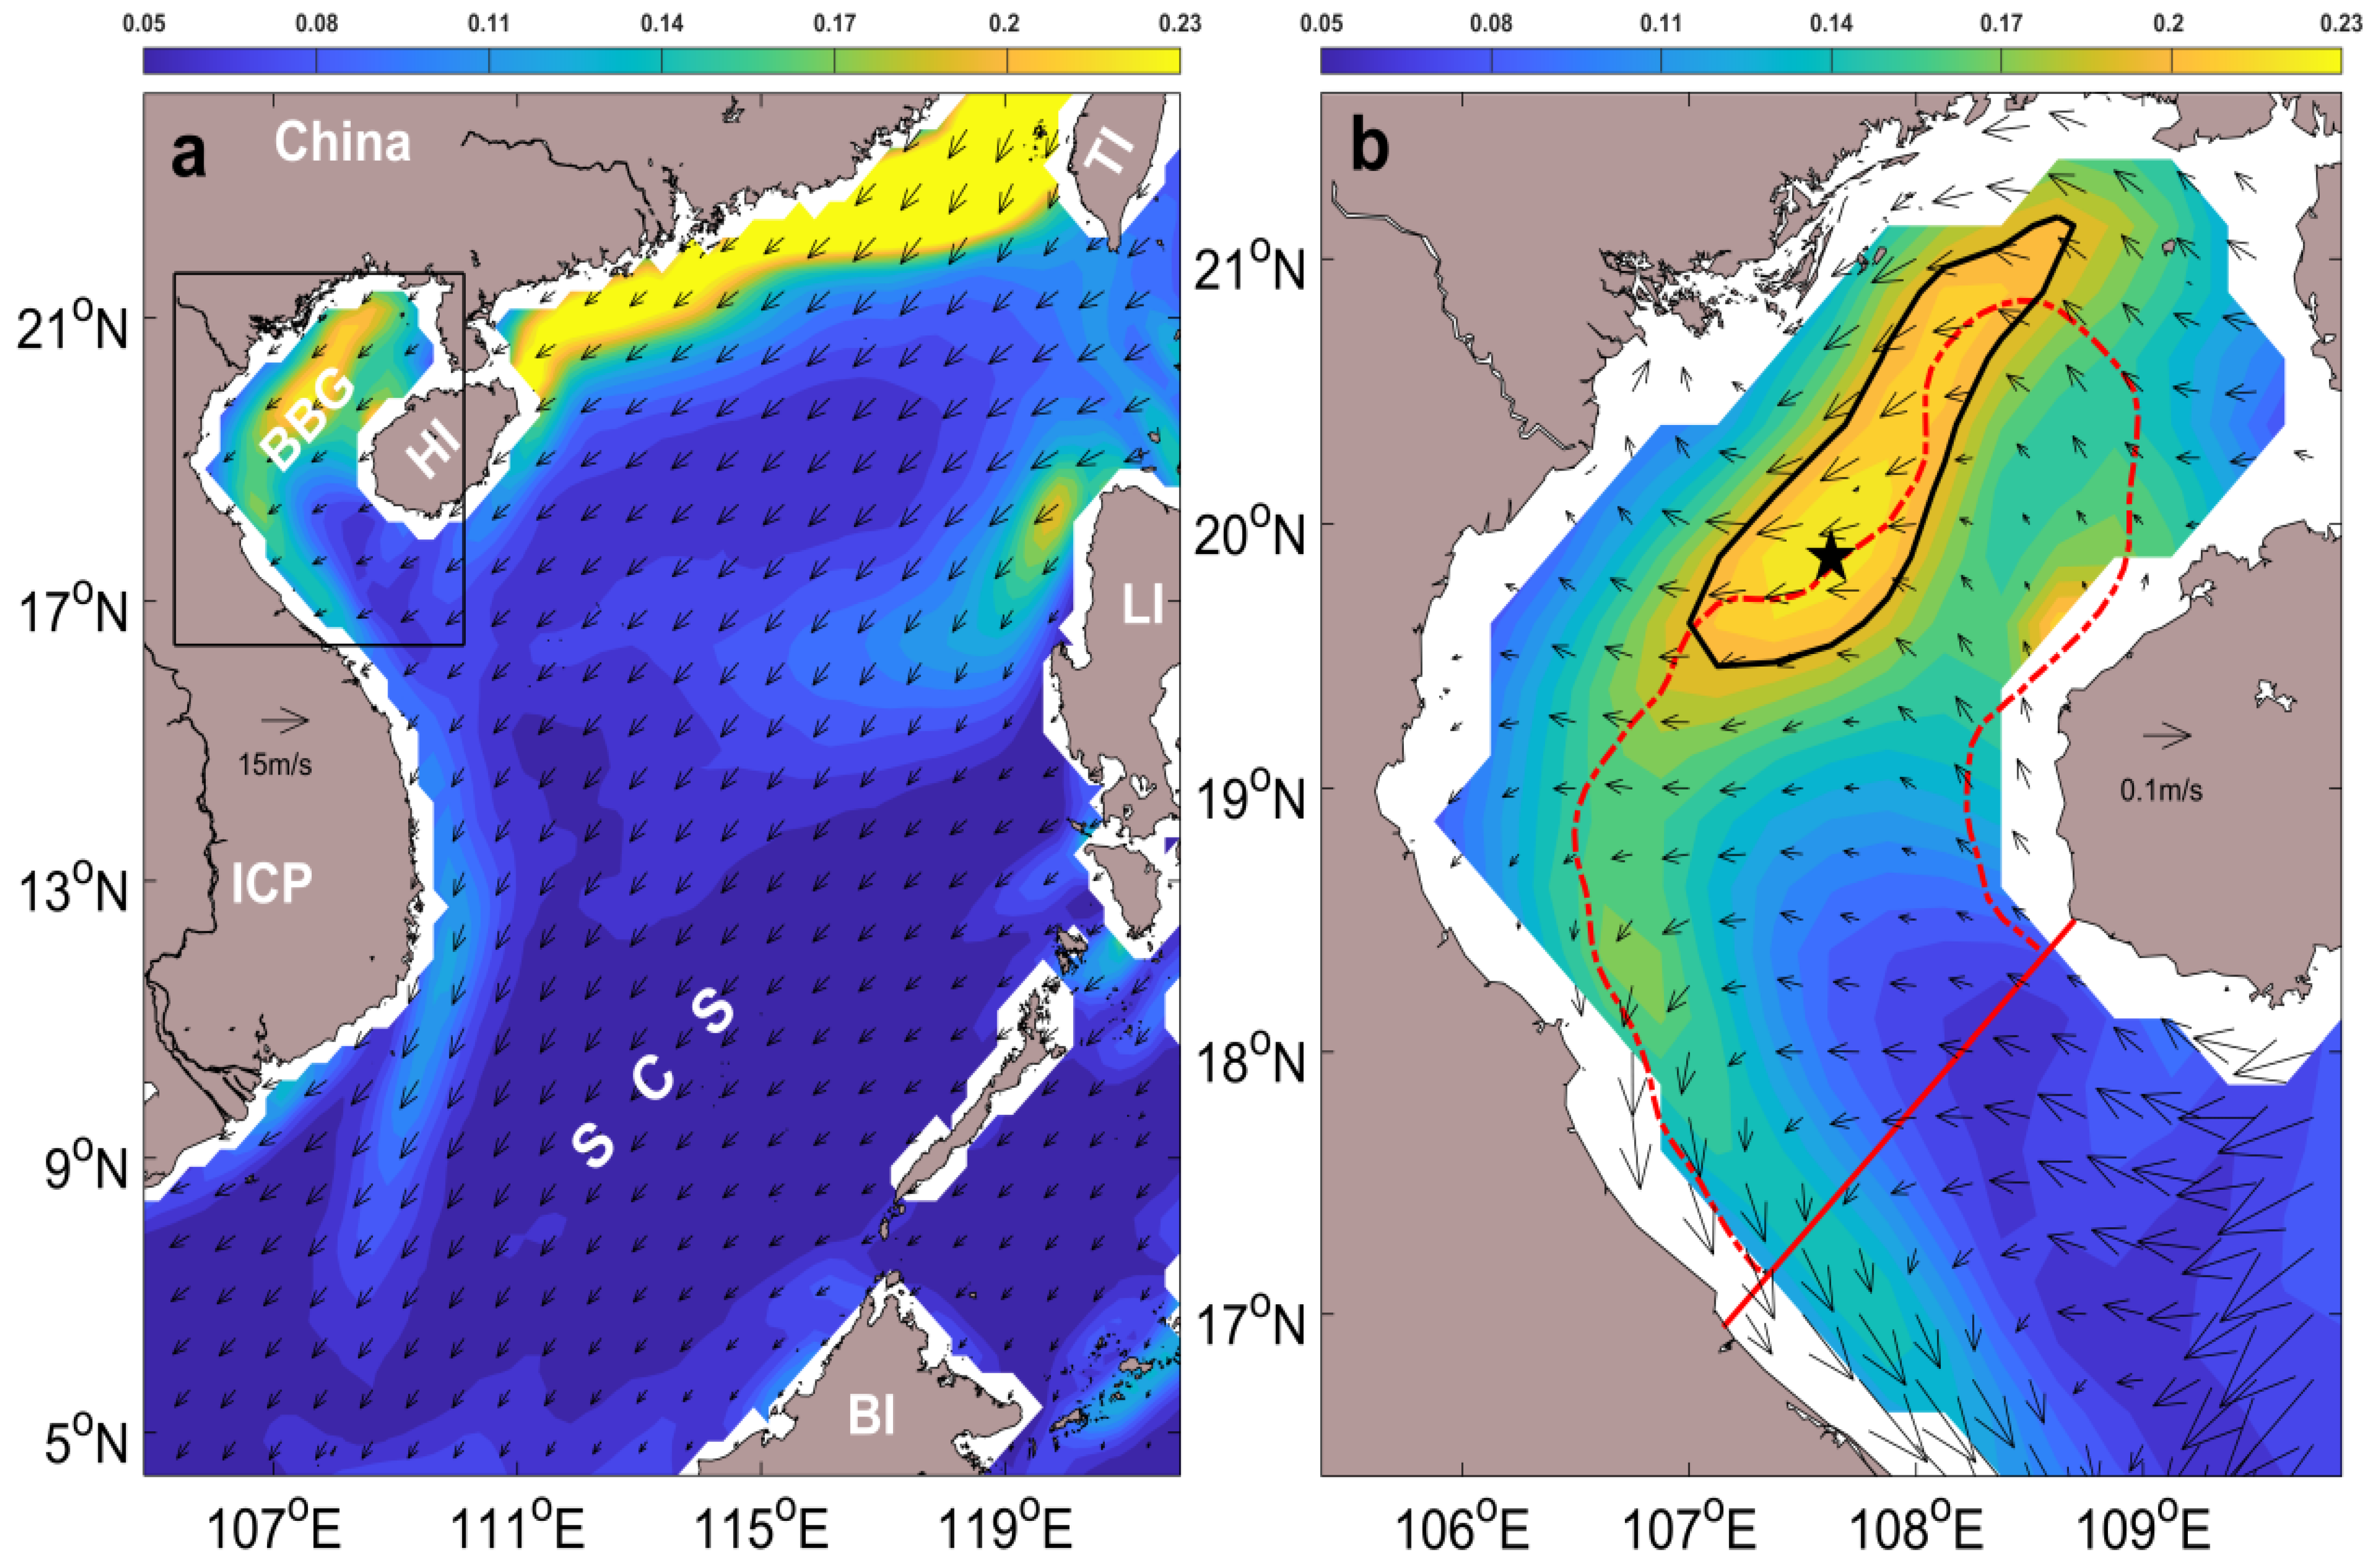
Figure 1. Spatial distribution of the gradient magnitude (GM; °C/10 km; shading) in the South China Sea (SCS) in winter. (a) Spatial distribution of GM (°C/10 km; shading) and wind vectors (m/s; vectors). HI: Hainan Island; ICP: Indochina Peninsula; BI: Borneo Island; LI: Luzon Island; TI: Taiwan Island; SCS: South China Sea; BBG: Beibu Gulf. (b) Spatial distribution of the GM (°C/10 km; shading) and ocean current (m/s; vectors) in the Beibu Gulf. The black solid line represents the 0.2 °C/10 km contour line of the GM, which represents the outermost envelope of the thermal fronts in the Beibu Gulf (TFIBG); the red dotted line represents the 40 m isobath; the red solid line represents the southern boundary of the Beibu Gulf; the black five-pointed star represents the position of the maximum point of the GM.
Remotesensing 17 00469 g001
Figure 2. (a) Spatial distribution of the occurrence rate (%; shading) of the TFIBG; (b) spatial distribution of the sea surface temperature (SST) (°C; shading) and Ekman current (vectors; m/s) in the Beibu Gulf. The red dotted line and the red solid line represent the 40 m isobaths and the southern boundary of the Beibu Gulf, respectively. The black solid line represents the 0.2 °C/10 km contour line of the GM, and the black five-pointed star represents the position of the maximum point of the GM.
Remotesensing 17 00469 g002
Figure 3. Annual variation in TFIBG intensity and difference in SSTs between shallow-water areas and deep-water areas, which is I n d e x d i f f described in Section 2.2.3. The blue dotted line represents the linear trend variation through linear fitting. The upper and lower red lines represent the sum and difference of the mean and standard deviation, respectively.
Remotesensing 17 00469 g003
Figure 4. Annual variation in wintertime SSTs in the shallow-water areas and deep-water areas of the Beibu Gulf.
Remotesensing 17 00469 g004
Figure 5. Seasonal variation in the GM (°C/10 km; shading) in the Beibu Gulf. The black solid line represents the 0.2 °C/10 km contour line of the GM; the red dotted line represents the 40 m isobath; the red solid line represents the southern boundary of the Beibu Gulf; the black five-pointed star represents the position of the maximum point of the GM.
Remotesensing 17 00469 g005
Figure 6. Seasonal variation in intensity ((a); unit: °C/10 km) and area ((b); unit: grid points) of the TFIBG. The red solid line represents the difference in the SST (Unit: °C) between the shallow-water areas and deep-water areas of the Beibu Gulf. The area of the TFIBG is calculated by counting the number of data points surrounded by the TFIBG.
Remotesensing 17 00469 g006
Figure 7. Interannual variation in TFIBG intensity, which has removed the linear trend variation based on the method described in Section 2.2. The upper and lower red lines represent the sum and difference of the mean and standard deviation, respectively.
Remotesensing 17 00469 g007
Figure 8. Correspondence between the GM and wind vectors on an interannual scale. (a1,a2) GM (shading; °C/10 km) and wind vector (vectors; m/s) in the strong and weak years of TFIBG intensity, respectively, and (a3) represents the difference between (a1,a2); (b1,b2) represent SST (shading; °C) and Ekman vectors (vectors; m/s) in the strong and weak years of TFIBG intensity, respectively, and (b3) represents the difference between (b1,b2); (c1,c2) represent the GM (shading; °C/10 km) and wind vector (vectors; m/s) in the strong and weak years of wind speed in the northern SCS, respectively, and (c3) represents the difference between (c1,c2). The black box in subfigure (c1) represents the northern region of the SCS. (a1,a2,b1,b2,c1,c2) have all removed the linear trend variations.
Remotesensing 17 00469 g008
Figure 9. Spatial distribution of the GM (°C/10 km) and sea surface temperature anomaly (SSTA) (°C) based on the trend variation in the TFIBG. (a,b) GMs in the first four years and the last four years of the period from 1982 to 2023, and their difference is shown in (c). (df) are the same as (ac), respectively, but for the SSTA. The black solid lines represent zero contour lines.
Remotesensing 17 00469 g009
Figure 10. Seasonal variation in the freshwater flow of the Red River in Vietnam and rivers along the Guangxi coast of China [1].
Remotesensing 17 00469 g010
Disclaimer/Publisher’s Note: The statements, opinions and data contained in all publications are solely those of the individual author(s) and contributor(s) and not of MDPI and/or the editor(s). MDPI and/or the editor(s) disclaim responsibility for any injury to people or property resulting from any ideas, methods, instructions or products referred to in the content.