Highlights
What are the main findings?
- An automated framework achieves 96.3% frame-wise accuracy, 87.7% Edit score, and F1@50 of 83.0% for diffuse aurora identification and temporal segmentation in long ASI videos.
- Large-scale statistical analysis of 358,560 all-sky images reveals a robust diurnal pattern of diffuse aurora occurrence, with a consistent peak around 07:00 UT and a minimum near 11:00 UT across multiple years.
What are the implications of the main findings?
- The results demonstrate that physics-informed, vision-based methods can reliably extract physically meaningful auroral statistics from massive remote sensing video archives without manual inspection.
- The derived occurrence statistics provide quantitative observational support for established diffuse aurora particle precipitation and drift mechanisms, enabling scalable studies of magnetosphere-ionosphere coupling.
Abstract
Diffuse aurora is a widespread and long-lasting auroral emission that plays an important role in diagnosing magnetosphere-ionosphere coupling and magnetospheric plasma transport. Despite its scientific significance, diffuse aurora remains challenging to identify automatically in all-sky imager (ASI) observations due to its weak optical intensity, indistinct boundaries, and gradual temporal evolution. These characteristics, together with frequent cloud contamination, limit the effectiveness of conventional keogram-based or morphology-driven detection approaches and hinder large-scale statistical analyses based on long-term optical datasets. In this study, we propose an automated framework for the identification and temporal segmentation of diffuse aurora from untrimmed all-sky auroral videos. The framework consists of a frame-level coarse identification module that combines weak morphological information with inter-frame temporal dynamics to detect candidate diffuse-auroral intervals, and a snippet-level segmentation module that dynamically aggregates temporal information to capture the characteristic gradual onset-plateau-decay evolution of diffuse aurora. Bidirectional temporal modeling is employed to improve boundary localization, while an adaptive mixture-of-experts mechanism reduces redundant temporal variations and enhances discriminative features relevant to diffuse emission. The proposed method is evaluated using multi-year 557.7 nm ASI observations acquired at the Arctic Yellow River Station. Quantitative experiments demonstrate state-of-the-art performance, achieving 96.3% frame-wise accuracy and an Edit score of 87.7%. Case studies show that the method effectively distinguishes diffuse aurora from cloud-induced pseudo-diffuse structures and accurately resolves gradual transition boundaries that are ambiguous in keograms. Based on the automated identification results, statistical distributions of diffuse aurora occurrence, duration, and diurnal variation are derived from continuous observations spanning 2003–2009. The proposed framework enables robust and fully automated processing of large-scale all-sky auroral images, providing a practical tool for remote sensing-based auroral monitoring and supporting objective statistical studies of diffuse aurora and related magnetospheric processes.
1. Introduction
Aurora is a luminous phenomenon resulting from high-energy charged particles precipitating along magnetic field lines into the Earth’s polar ionosphere, where collisions with atmospheric atoms and molecules generate characteristic emissions [1,2]. Aurora is a direct manifestation of solar-terrestrial interactions in the polar regions, particularly magnetosphere-ionosphere coupling, and serves as a key observational window for studying space weather events [3,4,5,6,7,8]. Ground-based all-sky auroral observations have revealed two major types of aurora based on morphological and dynamic characteristics: discrete aurora and diffuse aurora [9]. Discrete aurora is short-lived and exhibits well-defined luminous structures, including arcs, bands, curls, and rays [10,11,12]. In contrast, diffuse aurora generally displays weak, uniform brightness, indistinct morphology, long duration, slow drift, and periodic pulsations [13]. Different auroral types correspond to distinct magnetospheric processes, and studying them separately is essential for understanding auroral mechanisms.
Diffuse aurora is a persistent and gradually evolving phenomenon in the polar ionosphere, mainly produced by the continuous precipitation of magnetospheric electrons [14,15,16,17]. Unlike discrete aurora, which appears as transient and localized arcs, diffuse aurora exhibits smooth temporal transitions and broad spatial coverage [18,19,20,21]. Its identification and temporal characterization require large-scale data analysis over long observation sequences, motivating automated approaches for detecting gradual transitions and distinguishing them from discrete auroral forms.
Diffuse aurora remains challenging to identify and characterize in practice. Although particle spectrograms from satellites such as the Defense Meteorological Satellite Program (DMSP) can indicate precipitation events, they often fail to capture the full temporal and spatial evolution of diffuse aurora. As demonstrated in our YRS-DMSP case (Figure 1), the all-sky optical images clearly show the emergence of diffuse aurora at lower latitudes between 08:10 and 08:20 UT, whereas the corresponding particle spectrogram exhibits no distinct enhancement during the same interval. This discrepancy arises because the satellite, moving from higher to lower latitudes, observes only a narrow portion of the precipitation region and may miss early-stage developments visible in ground-based imagery. In addition, particle data are prone to local disturbances and instrumental uncertainties, such as around 08:13 UT, which can obscure the gradual transitions typical of diffuse aurora. In contrast, optical imagery provides a continuous, wide-field record of auroral morphology, making it a more reliable basis for identifying diffuse auroral evolution. Therefore, leveraging computer vision to objectively detect and segment diffuse aurora from large-scale all-sky video archives is both scientifically justified and operationally essential.
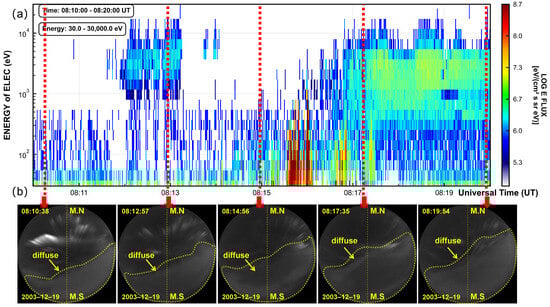
Figure 1.
Joint YRS optical and DMSP in situ observations illustrating the correspondence between diffuse-aurora evolution and source-region particle precipitation (19 December 2003, 08:10–08:20 UT). (a) DMSP electron energy-flux spectrogram; vertical red dashed lines mark the sampling times of the co-temporal all-sky images in (b).
Identifying and segmenting diffuse aurora in untrimmed all-sky videos can be formulated as a temporal action segmentation problem, where the goal is to assign frame-wise labels to continuous sequences with gradual transitions. This formulation naturally fits the diffuse aurora scenario, which evolves continuously rather than through abrupt onsets. Existing video understanding methods can be broadly categorized into three groups: (i) frame-based models that infer temporal relations among per-frame features [22,23,24,25,26,27,28], (ii) two-stage frameworks that first extract frame features and then build long-range temporal context [29,30], and (iii) parallel models that simultaneously learn frame-level and sequence-level representations with bidirectional interaction [31].
Frame-based methods represent the foundational paradigm in temporal action segmentation. The MS-TCN (Multi-Stage Temporal Convolutional Network) [24] utilizes multi-stage dilated temporal convolutions to learn frame-level feature representations, achieving progressive feature refinement through its hierarchical architecture. However, due to the inherent limitations of convolutional receptive fields, this method struggles to capture long-range temporal dependencies beyond the receptive field and is prone to over-segmentation artifacts. ASFormer [26] replaces temporal convolutions with a Transformer architecture to enhance long-range temporal modeling capability. Nevertheless, owing to the high computational complexity of standard self-attention mechanisms, this approach adopts windowed temporal attention, which still constrains its capacity to model global temporal relationships across extended sequences. Two-stage methods attempt to decouple frame-level and action-level representation learning. UVAST (Unified Video Action Segmentation Transformer) [29] adopts a sequence-to-sequence framework, where the first stage computes frame-level features and the second stage constructs action-level representations based on these features to generate predictions. However, this method fuses the two-stage prediction outputs only at the final stage, failing to fully exploit the complementary information between frame-level and action-level features for iterative optimization. Parallel methods represent a more recent paradigm that enables continuous interaction between different representation levels. FACTM (Frame-Action Cross-attention Temporal Modeling) [31] jointly learns morphological representations and temporal dynamics through bidirectional interaction between the frame branch and the action branch. Compared to two-stage methods, this parallel architecture enables continuous mutual optimization of frame-action features across multiple processing stages.
Given that diffuse aurora exhibits weak spatial contrast, slow temporal evolution, and quasi-periodic modulations, we adopt the parallel paradigm. This parallel modeling strategy enables mutual reinforcement between spatial cues (useful for suppressing clouds, stars, and background noise) and temporal dynamics, which is essential for capturing the gradual onset, development, and decay of diffuse auroral emissions.
Building on this perspective, we develop an automatic framework for identifying and segmenting diffuse aurora from continuous all-sky image sequences. The framework is grounded in the physical nature of diffuse aurora: its spatial morphology is weak and unstructured, while its temporal evolution is gradual and often intertwined with transitions to or from discrete aurora. To address these challenges, our method performs collaborative modeling between spatial morphology and temporal dynamics. The intra-frame branch focuses on morphological cues—enhancing sensitivity to faint, diffuse emissions and suppressing background contamination from clouds and stars—whereas the inter-frame branch captures long-term temporal continuity, slow drifts, and quasi-periodic modulations characteristic of diffuse aurora. The bidirectional interaction between these two representations allows the system to recognize diffuse auroral activity even under complex observing conditions, improving the determination of onset and termination phases in a physically interpretable way. The main contributions of this study are as follows:
(1) Physics-informed video segmentation of diffuse aurora. We design a segmentation and identification framework guided by the physical characteristics of diffuse aurora. Expert-driven feature selection enhances sensitivity to weak auroral structures, while snippet-level aggregation captures gradual temporal transitions. These designs enable reliable localization and classification of diffuse-auroral intervals in long untrimmed ASI videos. Its performance is shown in Figure 2.
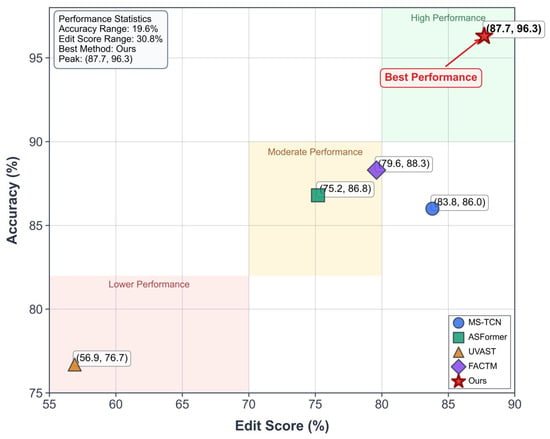
Figure 2.
Comparison of the proposed method with existing methods in identifying and delineating diffuse auroral activities. The evaluation is performed on long-duration all-sky auroral image sequences using frame-wise accuracy (Acc) and Edit score. The proposed method attains the highest performance (96.3% Acc and 87.7% Edit), indicating its enhanced capability in tracing the spatially extended, weakly structured emissions and gradual temporal evolution of diffuse aurora, as well as in resolving their indistinct morphological boundaries.
(2) Scalable detection and statistical characterization. By applying the trained model to long-term video archives, we automatically extract diffuse auroral episodes across multiple years, enabling large-sample analyses of their occurrence rate, duration, and temporal variations—providing new opportunities for data-driven auroral climatology and for linking optical observations with magnetospheric particle dynamics.
(3) Improved operational utility for auroral monitoring. The proposed framework reduces reliance on manual labeling and subjective interpretation, offering a reproducible and objective means of monitoring diffuse aurora at scale—potentially supporting coordinated studies with in situ satellite measurements such as DMSP or THEMIS.
2. Observations and Dataset
2.1. All-Sky Imaging System
The auroral data employed in this study were acquired by the All-Sky Imager (ASI) system at the Arctic Yellow River Station (YRS) in Ny-Ålesund, Svalbard. The station is located at geographic coordinates 78.92°N, 11.93°E, with a corrected geomagnetic latitude of 76.24° and magnetic local time MLT = UT + 3 h. As shown in Figure 3a, the YRS optical system consists of three identical ASI cameras capturing auroras at wavelengths of 427.8 nm, 557.7 nm, and 630.0 nm during the polar night period (November through February). Each frame is acquired with a 7 s exposure time at 10 s intervals between consecutive frames [32]. Figure 3b presents the internal structure of the CCD camera employed in the ASI system, highlighting the sensor configuration and key optical components, including the fish-eye lens, relay lens, filter lens, and focus lens.
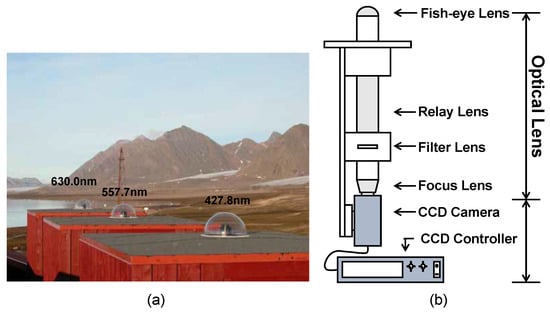
Figure 3.
Observational data and construction of diffuse aurora samples. (a) Geographic location of the Arctic YRS, Ny-Ålesund, Svalbard, and the optical system equipped with three all-sky imagers operating at 427.8, 557.7, and 630.0 nm; (b) Internal structure of the CCD camera used in the all-sky imagers.
Previous long-term observational studies have shown that diffuse aurora is most prominently and consistently observed in the 557.7 nm band, whereas discrete aurora typically exhibits strong emissions across multiple wavelength bands [13]. As a result, the green-line channel provides the highest contrast and signal-to-noise ratio for diffuse auroral structures, while effectively suppressing contamination from bright discrete arcs, airglow, and background illumination. By restricting the dataset to 557.7 nm observations, we impose a wavelength-level physical prior at the data selection stage. This constraint does not rely on geomagnetic indices or external parameters, but ensures that the visual manifestations of diffuse aurora are maximally preserved, thereby providing a reliable and consistent foundation for subsequent morphology- and dynamics-based analysis.
The raw observational data undergo the following preprocessing pipeline [33]: dark current subtraction, intensity stretching (16-bit to 8-bit grayscale conversion), rotation alignment to magnetic north, edge noise removal, and cropping of highly distorted circular peripheral regions, ultimately yielding 440 × 440 pixel images suitable for subsequent analysis.
2.2. Diffuse Aurora Dataset
To support the development of the automated diffuse aurora identification and segmentation framework, we constructed an annotated dataset based on all-sky auroral images at 557.7 nm wavelength from the YRS optical system.
2.2.1. Aurora Dataset 1 (AD1)
AD1 comprises 40 long sequences, each containing approximately 1000 frames (totaling 40,002 images), collected from December 2003 to December 2007. This dataset is used for model training and quantitative evaluation. The 40 sequences were not randomly selected but were systematically curated according to the following criteria to ensure representativeness and diversity: (1) Temporal coverage: The selected sequences span multiple observing seasons from December 2003 to December 2007. (2) Diversity of observing conditions: The sequence selection intentionally includes the following representative scenarios: pure diffuse aurora events under clear sky backgrounds, observing scenes with cloud contamination, complex scenarios where diffuse aurora coexists with discrete aurora, and different morphological subtypes of diffuse aurora (veiling, patchy, pulsating, etc.). (3) Annotation feasibility: Priority was given to sequences with relatively clear boundaries and high inter-expert annotation consistency to ensure training label quality. Ground-truth frame-level labels were manually annotated by experienced auroral physicists following a consistent protocol according to the morphological and dynamical definitions of diffuse aurora [9]: (i) identifying the onset, mature, and decay phases of each diffuse auroral event; (ii) ensuring temporal precision within ±1–2 frames (10–20 s); (iii) merging ambiguous micro-gaps to maintain physically meaningful event continuity. Inter-annotator disagreements were resolved through joint review and discussion. In each sequence, frame-by-frame annotations were classified into two categories: diffuse aurora and others. The diffuse aurora category is characterized by weak structural morphological features such as uniform luminosity and diffuse boundaries, along with dynamic features including slow quasi-periodic pulsations and gradual evolution patterns. As shown in Figure 4a–c, three typical subtypes of diffuse aurora are presented. The “others” category encompasses discrete auroral structures and background/cloud contamination. Discrete auroral structures, as shown in Figure 4d, exhibit sharp emission boundaries and rapid temporal variability. Cloud motion, depicted in Figure 4e, displays weak structural features superficially similar to diffuse aurora but demonstrates distinct dynamic characteristics of random advection and rapid texture deformation.
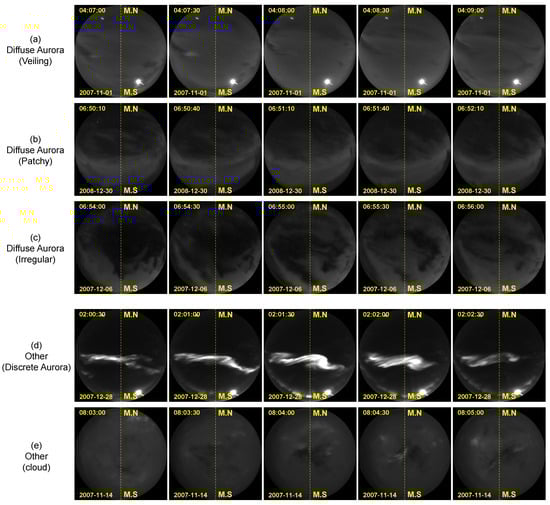
Figure 4.
Representative temporal evolution sequences of different auroral and non-auroral phenomena used for dataset construction. (a) Diffuse Aurora (Veiling); (b) Diffuse Aurora (Patchy); (c) Diffuse Aurora (Irregular); (d) Other (Discrete Aurora); (e) Other (cloud).
2.2.2. Geomagnetic Conditions of AD1
We performed a statistical analysis of the geomagnetic conditions corresponding to the AD1 dataset. The Kp index (Planetarische Kennziffer) is a standardized measure of global geomagnetic activity that quantifies disturbances in the horizontal component of Earth’s magnetic field [34]. The Kp index has a direct physical connection to diffuse aurora occurrence through its influence on plasmasphere configuration and cold plasma distribution, which in turn affects the generation efficiency of plasma waves responsible for scattering electrons into the loss cone [35,36].
Figure 5a presents the histogram of sample distribution as a function of Kp index, and Figure 5b illustrates the proportions of samples under different geomagnetic activity levels through a pie chart. The statistical results indicate that the majority of samples in the dataset (61.8%) were acquired under geomagnetically quiet conditions (Kp = 0–2), with the remainder mainly occurring during moderate activity levels (Kp = 3–4, 35.7%). Only a small fraction of samples (2.5%) correspond to geomagnetically active conditions (Kp ≥ 5).
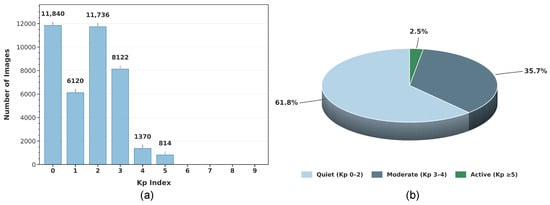
Figure 5.
Geomagnetic condition statistics of the AD1 dataset. (a) Histogram showing the distribution of samples as a function of Kp index; (b) pie chart illustrating the proportion of samples under different geomagnetic activity levels (quiet: Kp 0–2, moderate: Kp 3–4, active: Kp ≥ 5).
This outcome is physically meaningful rather than coincidental. Diffuse aurora is more readily observable during quiet periods because: (1) an extended plasmasphere provides favorable cold plasma conditions for efficient wave–particle scattering; (2) reduced discrete auroral activity makes weaker diffuse emissions easier to identify; (3) the auroral oval contracts to higher latitudes, providing clearer contrast between diffuse aurora boundaries and the background. These physical considerations informed our dataset construction and support the representativeness of AD1 for diffuse aurora studies.
2.2.3. Aurora Dataset 2 (AD2)
AD2 comprises continuous ASI observations collected from October 2008 to December 2009, totaling 358,560 images. This dataset is used for statistical analysis of diffuse auroral events based on automatically identified results. Specifically, observations covering 48 days (October to December 2008) and 35 days (October to December 2009) were selected for statistical analysis of diffuse auroral events based on automatic identification results. The dataset is partitioned into training, validation, and test subsets with no temporal overlap to prevent scene-level data leakage.
3. Methods
3.1. Overview Architecture
We adopt an enhanced FACT-based architecture [31] tailored to the specific challenges of diffuse-aurora event detection from long untrimmed all-sky video sequences. As shown in Figure 6, our framework consists of three major components: input processing, Frame-level Coarse Identification Module (FCIM), and Snippet-level Gradual-transition Segmentation Module (SGSM).
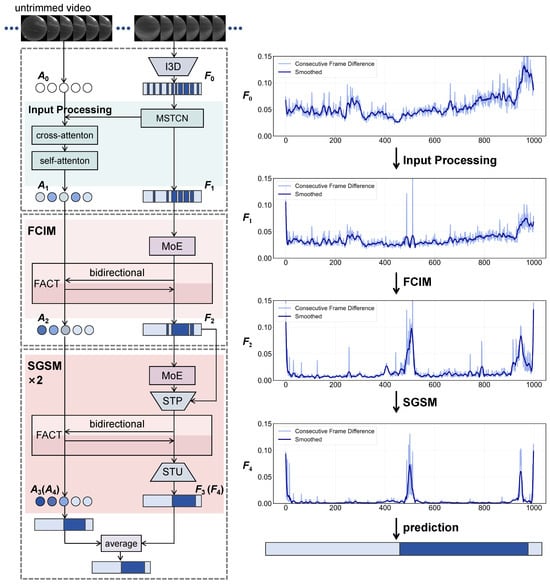
Figure 6.
Framework for automatic diffuse aurora identification and segmentation, consisting of input processing, Frame-level Coarse Identification Module (FCIM), and Snippet-level Gradual-Transition Segmentation Module (SGSM).
In the input processing stage, raw auroral video sequences are first passed through feature extraction and preprocessing pipelines to produce frame-level embeddings and initial action tokens. Let denote the initial frame features pre-extracted by an Inflated 3D ConvNet (I3D) [37] and let denote the action tokens initialized as . is fed into a Multi-Stage Temporal Convolutional Network (MSTCN) [24] to capture multi-scale temporal dependencies:
In this FCIM stage, before feeding frame features into FACT, we pass them through a Mixture-of-Experts (MoE) module that is specially configured for auroral imagery. This MoE enhancement enables the FACT layer to better distinguish diffuse-aurora characteristics (e.g., weak morphology, slow drift, varied background) when performing coarse interval identification.
This architectural design builds on FACT’s original capability for frame-action cross-attention temporal modeling, but adds aurora-specific logic (MoE gating, snippet-pooling with GRU context, adaptive sampling) to improve detection sensitivity to the gradual transitions and weak structural signatures of diffuse aurora. The right panel of Figure 6 visualizes the inter-frame feature differences extracted after each stage. From the initial input to the final stage, the difference patterns gradually evolve from scattered fluctuations to clear and localized peaks. This visualization reflects how the hierarchical processing enhances temporal distinctiveness—frame-to-frame variations that were previously indistinct become increasingly concentrated around transition intervals. Such progression intuitively explains how the network transforms raw sequential data into structured temporal cues suitable for diffuse-aurora segmentation.
3.2. Frame-Level Coarse-Grained Identification
The Frame-level Coarse-grained Identification Module (FCIM) is designed for the coarse identification of candidate diffuse-aurora segments in long, untrimmed all-sky video sequences. At its core, FCIM adopts the Frame-Action Cross-Attention Temporal (FACT) modeling [31] to jointly learn frame-wise morphological representations and action-level temporal dynamics. Unlike conventional frame-only architectures, FACT maintains two interactive branches: a frame branch that encodes spatial morphology within each frame, and an action-token branch that abstracts temporal semantics across frames. Through alternating cross-attention operations, the two branches co-learn complementary cues: the frame branch refines its local structure with temporal context from the tokens, while the token branch acquires temporally coherent action descriptors from the evolving frame features. This bidirectional information exchange allows the model to understand not only what the auroral pattern looks like at each instant, but also how it evolves through time.
Such a mechanism is particularly suitable for diffuse aurora, whose spatial appearance often resembles thin cloud layers in still images but diverges dramatically once motion is considered. While clouds exhibit random advection and rapid texture deformation, diffuse aurora evolve through wave-like intensity modulations and gradual drifts governed by magnetospheric dynamics. FACT’s explicit disentanglement between per-frame morphology and inter-frame temporal tokens provides a natural way to capture these subtle but physically meaningful transitions. The action tokens summarize long-range temporal dependencies—such as slow brightenings or fading arcs—whereas the frame features retain fine-scale spatial structures (diffuse boundaries, filamentary texture). Consequently, the FCIM can separate true auroral motion from background cloud or brightness fluctuations, yielding a robust coarse-level identification of auroral activity segments.
Before entering the FACT block, the frame features are first processed by a Mixture-of-Experts (MoE) [38,39] layer tailored for auroral data, as shown in Figure 6. Auroral imagery presents strong variability in brightness, noise level, and morphological type (uniform glow, patchy bands, or pulsating structures). The MoE introduces multiple lightweight expert networks, each specializing in different feature statistics, while a gating network dynamically assigns each frame or sequence to the most suitable experts. By integrating MoE-enhanced frame features with action tokens through FACT, the FCIM learns complementary morphological and dynamical representations. This enables coarse-grained localization of candidate diffuse aurora segments while filtering out irrelevant background and redundant temporal patterns, laying the foundation for segmentation.
3.3. Snippet-Level Gradual-Transition Segmentation
The SGSM takes the frame features and action tokens produced by the previous stage as input and explicitly models the gradual onset–plateau–decay behavior of diffuse aurora by operating on temporally aggregated snippets rather than isolated frames. Conceptually, SGSM answers the question: when auroral intensity changes slowly over many frames, how can we form temporally coherent representations that expose true gradual transitions while suppressing noise? Figure 7 illustrates an example of diffuse aurora with gradual transitions, highlighting the challenge of precisely determining event start and end frames from visual inspection alone. Such gradual transitions, if processed frame-by-frame, can lead to noisy predictions or misclassification of the early and late stages of the event.
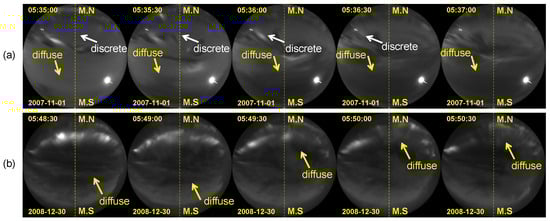
Figure 7.
All-sky aurora images obtained at 30 s sampling frequency during the (a) onset and (b) decay phases of diffuse aurora.
The module proceeds through two successive refinement iterations (as shown in the lower-left of Figure 6). Each iteration contains MoE enhancement, snippet-based pooling, contextual modeling, FACT-based refinement, and temporal restoration. Let denote the action tokens and frame features output from the previous stage. We write for the frame feature sequence and for the action tokens. The incoming frame features are first passed through the MoE. Using preliminary frame labels from the previous stage, consecutive frames with identical coarse labels are grouped into snippets. Each snippet represents a short, semantically consistent interval obtained through average pooling along the temporal axis. This step effectively downsamples the long frame sequence into a shorter sequence of snippet-level descriptors, reducing redundancy and emphasizing gradual transitions rather than frame-to-frame noise. To capture how diffuse aurora evolves across time, the snippet sequence is processed by a Bi-directional GRU (BiGRU) [40], which integrates temporal dependencies from both past and future snippets. This allows the model to interpret smooth intensity changes or fading boundaries that are not obvious when viewed frame-by-frame. After contextual enhancement, snippet-level features are fed into a FACT block for cross-attention between frame features and action tokens. The snippet representations are then upsampled back to the frame-level resolution (by assigning each snippet’s refined descriptor to its constituent frames). The process is illustrated in Figure 8.
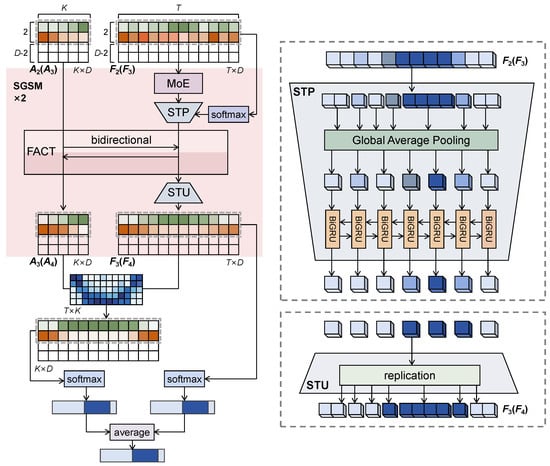
Figure 8.
Illustration of snippet-based pooling and BiGRU processing in SGSM. Similar frames (indicated by similar color) are grouped into snippets through snippet-based pooling and processed as unified temporal units.
The final classification is used to achieve the final prediction. A linear classifier maps frame features to per-frame logits . The token-level logits are aligned to the frame timeline by the FACT attention alignment matrix (the softmax attention weights computed in the action → frame pass). If has shape , token logits are projected to frame space by:
producing token-informed, frame-aligned logits. The two sources are combined by a small fusion weight :
The per-frame label is the argmax of . This fusion preserves both local, morphology-driven cues and longer-range, token-level context.
4. Results
4.1. Experiment Data and Setting
4.1.1. Implementation Details
All experiments are implemented in Python 3.8.20 and PyTorch 2.4.1 with CUDA 11.8. Models are trained for 1,000 epochs using a batch size of 2. Optimization follows the Adam optimizer [41] with an initial learning rate of 0.001, weight decay of 0.0001, and gradient clipping at a maximum norm of 10.0. The learning rate decays by a factor of 0.1 every 20 epochs. The loss function combines cross-entropy loss [42] with matching loss [24] to enforce temporal consistency. The FACT backbone adopts 512-dimensional hidden representations with 6 attention layers, each configured with 8 self-/cross-attention heads, and 0.3 dropout probability. The MoE module is configured with 6 experts, activating k = 2 experts per forward pass, and is applied in both FCIM and SGSM modules. The action-token pathway uses 5 action tokens with frame positional encoding.
4.1.2. Evaluation Metrics
To ensure consistent evaluation of both identification and segmentation performance, three standard temporal action segmentation metrics [29,43] are employed: (1) Frame-wise Accuracy (Acc), (2) Segmental F1 score (F1@{10, 25, 50}), and (3) Edit distance score, providing complementary assessments of per-frame correctness, boundary localization, and temporal structural consistency [44].
4.2. Comparison with Existing Methods
We compare our method with representative temporal action segmentation approaches for diffuse aurora identification. Existing methods can be broadly grouped into three categories: (1) frame-based methods, which learn temporal relations from frame-level features; (2) two-stage methods, which separately construct frame-level and action-level representations; and (3) parallel methods, which jointly refine frame and action features through iterative interaction.
Table 1 presents quantitative comparisons between our method and representative approaches from each category: MS-TCN [24], ASFormer [26], UVAST [29], and FACTM [31], which represent the most competitive frame-based, two-stage, and parallel methods, respectively. Our method achieves superior performance across all evaluation metrics, attaining 96.3 ± 0.4% accuracy, 87.7 ± 0.2% edit distance score, and F1@{10, 25, 50} scores of 86.8 ± 0.5%, 86.6 ± 0.5%, and 83.0 ± 0.4%, respectively. Notably, our method exhibits the smallest standard deviations across all metrics among the evaluated approaches, indicating consistent and stable performance over multiple independent runs. In contrast, the two-stage method UVAST demonstrates considerably higher variance (e.g., Edit score standard deviation of 5.3), suggesting less stable training convergence. The low variability of our method can be attributed to the explicit modeling of gradual temporal evolution through the SGSM, which provides robust regularization against stochastic training fluctuations.

Table 1.
Performance comparison of our method with current mainstream action segmentation approaches on the diffuse aurora identification and segmentation task. Results are reported as mean ± standard deviation over five independent runs. The best results are highlighted in bold.
Frame-based methods (MS-TCN, ASFormer) mainly capture local temporal dependencies and rely heavily on frame-level morphology, making them unsuitable for modeling the long, slowly evolving nature of diffuse aurora. Two-stage methods (UVAST) fuse features only at the final stage, leading to weak interaction between morphological and temporal cues. Parallel methods (FACTM) improve temporal reasoning through bidirectional refinement, yet they do not explicitly model the onset-plateau-decay evolution of diffuse aurora and struggle with long-duration temporal redundancy. Our method addresses these limitations through a two-stage coarse-to-fine design. The FCIM stage integrates intra-frame morphology and inter-frame dynamics to produce robust coarse segmentation. The SGSM stage further models the characteristic gradual evolution of diffuse aurora using snippet-level temporal aggregation and a BiGRU, enabling accurate onset and decay boundary refinement. Additionally, an MoE-based adaptive enhancement mechanism suppresses redundant temporal information and strengthens discriminative representations. This combination yields the most accurate and stable identification of diffuse aurora events among all evaluated methods.
To further validate the effectiveness of our method in diffuse aurora segmentation tasks, we conducted comprehensive qualitative analysis experiments. Figure 9 presents a comparative visualization of segmentation results obtained by applying our method and four mainstream methods to the same untrimmed all-sky auroral video (total length of 1000 frames). As observed in the figure, the frame-based methods MS-TCN and ASFormer both exhibit minor segmentation errors at auroral event boundaries, manifested as misclassification between true positive (TP) and true negative (TN) regions, as well as confusion between false positive (FP) and false negative (FN) instances. The two-stage method UVAST demonstrates severe over-segmentation phenomena, generating numerous erroneous boundaries across multiple temporal intervals, which results in continuous diffuse aurora events being incorrectly partitioned into separate events. The parallel method FACTM reduces local segmentation errors through its frame-action bidirectional information exchange mechanism; however, due to the intrinsic gradual evolution characteristics of diffuse aurora, its boundary localization accuracy remains insufficient during the onset and decay phases. In contrast, the segmentation results of our method exhibit high consistency with the ground truth annotations, achieving the most precise temporal segmentation of diffuse aurora events.
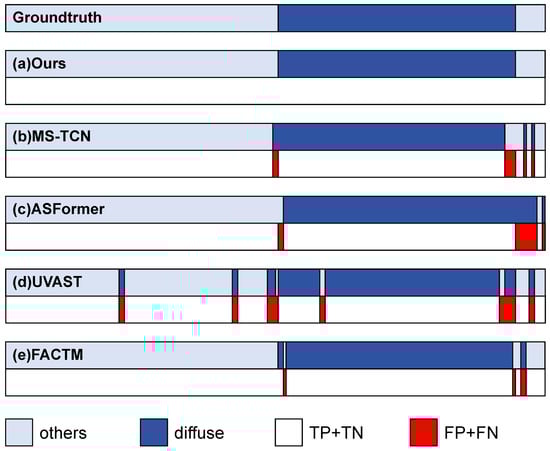
Figure 9.
Qualitative comparison of identification and segmentation results for diffuse aurora using different methods. (a) Our proposed method; (b) MS-TCN; (c) ASFormer; (d) UVAST; (e) FACTM.
Figure 10 further visualizes the frame-to-frame feature differences extracted by each method, where the vertical axis represents the normalized consecutive inter-frame feature difference intensity. Analysis reveals that our method generates clear and sharp feature difference peaks at true diffuse aurora event boundaries, indicating its capability to effectively capture critical temporal transition points of diffuse aurora phenomena. In comparison, MS-TCN exhibits relatively smooth inter-frame difference signals with low sensitivity to boundary features, leading to ambiguous temporal localization. Although ASFormer shows feature difference responses at certain boundaries, the overall signal contains substantial noise components that may induce misclassifications. UVAST’s feature difference distribution is unstable, with numerous spurious peaks throughout the sequence, which fundamentally explains the underlying cause of its severe over-segmentation phenomenon. While the FACTM method displays inter-frame difference responses at major boundaries, the peak prominence is insufficient, and considerable interference signals exist in non-boundary regions, constraining its boundary localization accuracy. In summary, through explicit modeling of the gradual evolution patterns of diffuse aurora and adaptive feature enhancement mechanisms, our method achieves precise characterization of event boundaries at the feature representation level, thereby demonstrating superior segmentation performance in both qualitative and quantitative evaluations.
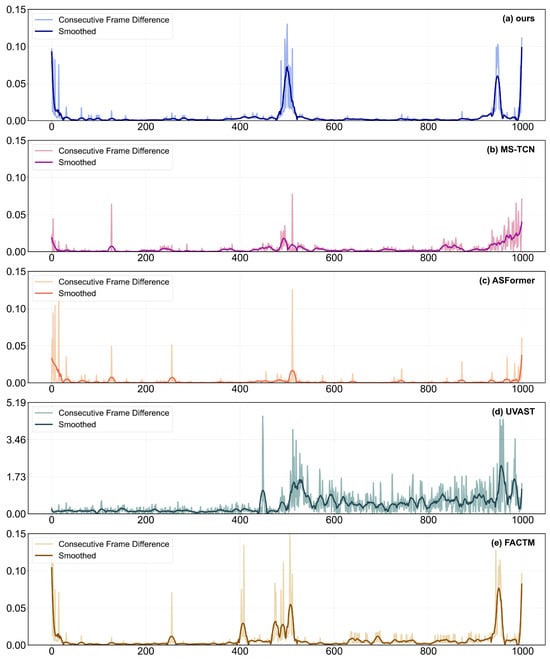
Figure 10.
Comparative of inter-frame differences for the identification and segmentation of diffuse auroras using different methods. (a) Our proposed method; (b) MS-TCN; (c) ASFormer; (d) UVAST; (e) FACTM.
4.3. Ablation and Sensitivity Analysis
4.3.1. Effectiveness of Modules
To validate the effectiveness of each module in our method and their contributions to overall performance, we conducted systematic ablation experiments. The experimental design first establishes a baseline model that directly processes initial video frame features extracted by the I3D network to learn preliminary representations of action tokens and frame features. Building upon this baseline, we progressively integrate the FCIM and SGSM to evaluate their individual effects and synergistic contributions to model performance.
The quantitative results of the ablation experiments are presented in Table 2. When the FCIM and SGSM are independently integrated into the baseline model, all major evaluation metrics achieve significant improvements. Specifically, the integration of the FCIM alone yields the most substantial improvement in Acc, elevating it from the baseline’s 80.1% to 90.1%, whereas the addition of the SGSM alone produces a more pronounced enhancement in the Edit metric, improving it from the baseline’s 70.6% to 78.6%. This differential improvement stems from the distinct functional emphases of the two modules: the FCIM employs an iterative bidirectional information exchange mechanism that addresses the weak structural morphological characteristics of diffuse aurora by supplementing morphological cues with rich dynamic features, capturing inter-frame correlation features across the entire temporal range, and thereby significantly enhancing overall recognition accuracy; in contrast, the SGSM focuses on fine-grained characterization of the onset and decay phases of diffuse aurora, introducing snippet descriptor aggregation and BiGRU temporal context modeling mechanisms to enhance snippet-level semantic guidance specifically tailored to the gradual evolution characteristics of diffuse aurora, making it particularly suitable for gradual boundary refinement tasks and thus exhibiting superior performance in Edit. When both the FCIM and SGSM are simultaneously integrated into the network, both Acc and Edit scores achieve further improvements, reaching 89.6% and 80.7%, respectively; however, the F1@0.50 score remains at a relatively low level, indicating that the model has not yet achieved optimal stability in boundary localization.
Table 2.
Ablation study on the contributions of the proposed FCIM and SGSM. Results are reported as mean ± standard deviation over five independent runs. “✓” and “–” indicate the presence and absence of the MoE module, respectively. The best results are highlighted in bold.
Our method achieves optimal performance across all evaluation metrics by simultaneously integrating the FCIM with the two-step cascaded SGSM, with Acc, Edit, and F1@{10, 25, 50} reaching 96.3%, 87.7%, 86.8%, 86.6%, and 83.0%, respectively. This architectural design first achieves deep interaction between morphological and dynamic features in the FCIM to generate initial candidate segmentation results, then explicitly models the gradual evolution behavior of diffuse aurora through a two-step cascaded refinement process in the SGSM, providing fine-grained processing of onset and decay phase boundaries, and ultimately producing accurate and physically interpretable temporal segmentation results.
Figure 11 further illustrates a comparison of diffuse aurora identification and segmentation results in the same video sequence when only the FCIM is added (Baseline + FCIM) versus when both the FCIM and SGSM are fully integrated (Baseline + FCIM + SGSM). We selected a video containing two representative snippets for visualization analysis—corresponding to a pulsating aurora scenario and a complex scenario where diffuse aurora coexists with discrete auroral structures. The results demonstrate that because the FCIM emphasizes feature modeling across the entire temporal range, the frame-by-frame processing approach generates considerable noisy predictions when confronted with highly similar consecutive frames, leading to spurious segmentation phenomena in ambiguous scenarios. In contrast, the complete method effectively suppresses the influence of temporal noise information through the application of BiGRU processing to snippet-level descriptors in the SGSM, while simultaneously enhancing the representation capability for gradual transition features, thereby achieving accurate identification of gradual onset and decay boundaries. The visualization results clearly show that our method can accurately capture the true boundaries of diffuse aurora events, whereas the configuration using only FCIM produces boundary offset errors of four frames and two frames, validating the critical role of the SGSM in boundary refinement tasks.
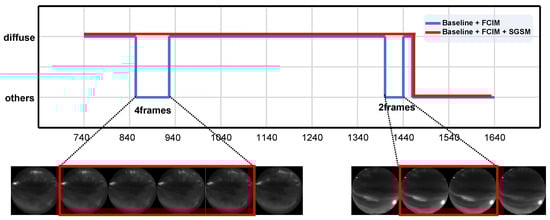
Figure 11.
Comparative analysis of segmentation results between FCIM-only and FCIM + SGSM integrated models. The red boxes highlight ASI frames corresponding to time intervals where the two models produce different detection results.
4.3.2. Effectiveness of MoE
This section delves into the effectiveness of the MoE mechanism across different modules and its contribution to model performance. Specifically, we add and remove the MoE mechanism in the FCIM and SGSM separately, and systematically evaluate the architectural design that achieves optimal performance by comparing experimental results of different configuration combinations.
As shown in Table 3, compared to the baseline configuration without the MoE mechanism, when MoE is independently integrated into either the FCIM or SGSM alone, model performance metrics improve but have not yet reached optimal performance. Specifically, introducing MoE only in the FCIM achieves 95.2% Acc and 85.1% Edit, whereas introducing MoE only in the SGSM achieves 95.9% Acc and 86.7% Edit. The MoE mechanism, based on the intrinsic characteristics of diffuse aurora’s extended duration and slow evolution, adaptively selects and integrates specialized expert pathways that focus on morphological feature extraction, motion feature capture, or background noise suppression through gating networks, thereby achieving enhancement of discriminative features and suppression of redundant information. However, introducing the MoE mechanism in only a single module cannot adequately address the feature redundancy problem generated at different stages during the learning process, limiting further performance improvement. Experimental results demonstrate that simultaneously integrating the MoE mechanism in both the FCIM and SGSM achieves optimal performance metrics. This complete configuration effectively addresses the core challenges of weak structural morphological features of diffuse aurora, highly redundant inter-frame features caused by gradual onset and decay processes, and difficulties in boundary localization, achieving precise identification and temporal segmentation of diffuse aurora events in untrimmed all-sky auroral video sequences through adaptive focus on key frame features.
Table 3.
Ablation study on the integration strategies of the Mixture of Experts (MoE) mechanism within the FCIM and SGSM. Results are reported as mean ± standard deviation over five independent runs. “✓” and “–” indicate the presence and absence of the MoE module, respectively. The best results are highlighted in bold.
Figure 12 presents the performance of the MoE mechanism across different module configurations as a three-dimensional performance surface, clearly illustrating the trends of Acc and Edit as functions of the MoE integration status in the FCIM and SGSM. The visualization results intuitively demonstrate that when both the FCIM and SGSM employ the MoE mechanism, model performance reaches a global optimum, achieving significant improvement compared to the configuration without MoE. The gradient distribution of the performance surface reveals the synergistic enhancement effect of the MoE mechanism in the two modules: introducing MoE in either module alone can bring performance improvement, but only the dual-module synergistic configuration can fully exploit the comprehensive advantages of adaptive feature selection and multi-scale redundancy suppression.
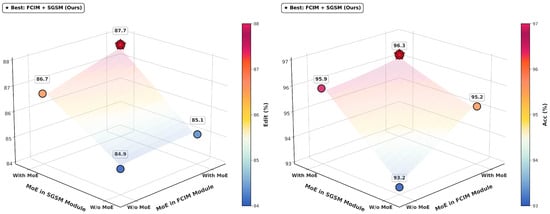
Figure 12.
Three-dimensional performance visualization of MoE mechanism integration across different modules. Colored circles denote different MoE configurations, where the color indicates the corresponding performance value as shown by the colorbar. The star marker highlights the best configuration (FCIM + SSGM).
To further intuitively demonstrate the feature enhancement performance of the MoE mechanism in focusing on key frames and suppressing redundant information, we conducted a comparative analysis of the temporal evolution characteristics of frame-by-frame features in untrimmed all-sky auroral video sequences before and after applying the MoE mechanism. Figure 13a,b show frame-level feature analysis results under two different auroral activity scenarios, where the blue and red curves represent the feature evolution states before and after applying the MoE mechanism, respectively. Each set of visualization results contains two subplots: the upper plot shows normalized inter-frame feature difference analysis, characterizing the magnitude of feature changes between consecutive frames; the lower plot shows cosine similarity analysis of inter-frame features, quantifying the consistency degree of feature representations between adjacent frames. The results indicate that before applying the MoE mechanism, inter-frame features exhibit highly complex and unstable temporal evolution patterns, primarily attributable to the intrinsic weak structural morphological characteristics of diffuse aurora, background noise interference, and slowly gradual evolution characteristics, resulting in blurred event boundary signals that are difficult to precisely localize. After enhancement by the MoE mechanism, frame-level features dynamically select and weight-fuse specialized expert pathways through gating networks, effectively suppressing redundant temporal information and background noise interference while adaptively focusing on more discriminative key frame features, thereby achieving precise characterization of diffuse aurora event boundaries at the feature representation level. Specifically, this manifests as at event boundaries, inter-frame difference signals exhibit sharper peak responses, while during stable phases within events, feature similarity maintains higher stability with significantly reduced noise fluctuations. This feature enhancement mechanism fundamentally improves the model’s representation capability for the gradual transition characteristics of diffuse aurora, establishing a solid foundation for achieving high-precision temporal segmentation.
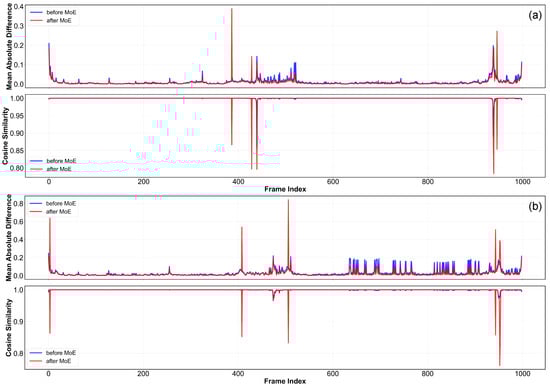
Figure 13.
Comparison of per-frame feature stability before and after the application of the MoE. (a,b) show two example sequences.
4.4. Case Studies of Challenging Diffuse Aurora Events
Diffuse aurora presents several characteristics that make automated identification and segmentation particularly challenging: its luminosity is weak and often spatially uniform, its boundaries are fuzzy and slowly evolving, and its temporal behavior can include quasi-periodic modulations such as pulsating patches. These properties not only weaken the contrast within individual frames, but also cause substantial ambiguity when diffuse structures coexist with bright discrete aurora or when cloud motion introduces similar large-scale smooth patterns in all-sky images.
To demonstrate the robustness of our method under these conditions, Figure 14 presents a set of representative challenging cases. (a) Intra-class diversity: Diffuse aurora itself exhibits substantial variability in brightness, spatial extent, and temporal evolution—including classical diffuse sheets and pulsating diffuse structures. Our method successfully identifies these diverse patterns, capturing both stable and rapidly modulated diffuse emissions. (b) Hard negative cases: Diffuse aurora is easily confused with weak discrete arcs or cloud-covered scenes, both of which produce smooth, low-contrast signatures that resemble diffuse luminosity in single-frame observations. The model effectively suppresses these hard negatives by leveraging temporal evolution cues and expert-guided feature modulation, yielding correct rejections in these ambiguous intervals. (c) Overlapping phenomena: When diffuse aurora coexists with bright discrete structures, the diffuse component may appear extremely subtle and is prone to omission by traditional keogram-based inspection. Our method still retrieves the diffuse intervals by consolidating long-range temporal continuity and weak structural cues, producing consistent identification even when diffuse signatures are visually dominated by discrete emissions. These case studies highlight the method’s capability to handle complex real-world auroral scenes that challenge both manual keogram inspection and conventional vision-based approaches, demonstrating its practical utility for large-scale auroral video analysis.
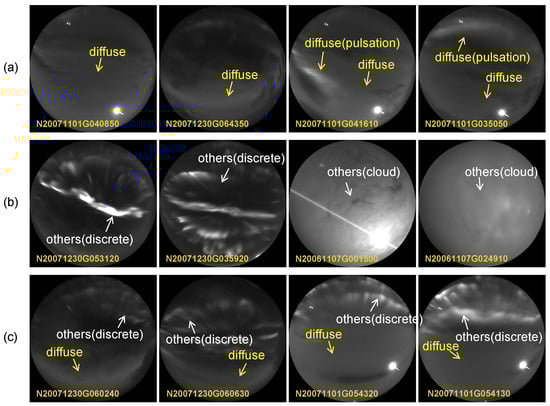
Figure 14.
Representative challenging cases for diffuse-aurora identification. (a) Large intra-class variation in brightness, extent, and motion, all correctly identified. (b) False-positive-prone scenes with weak discrete arcs or cloud cover, where our method remains stable. (c) Coexisting diffuse and discrete aurora, where weak diffuse emission is still successfully detected.
A further challenge of diffuse aurora identification lies in its gradual temporal evolution: the onset is typically weak and spatially inconspicuous, and the transition between growth, plateau, and decay often lacks sharp visual boundaries. To illustrate how our method performs under this condition, we present two representative sequences, each arranged in a consistent diagnostic layout: from top to bottom, the keogram for the same time interval (geomagnetic north–south column stacked in time), the automated identification and segmentation generated by our framework, and a small set of all-sky frames at physically meaningful moments (onset, plateau, decay, or ambiguous background conditions). The keogram offers a compact view of large-scale temporal structure, the segmentation band beneath it shows the frame-wise labels produced by our model, and the selected image snapshots make the physical interpretation explicit.
Figure 15 shows the results for the 28 December 2007 sequence (06:00–10:00 UT). In the early stages of diffuse-emission development, the luminous patch exhibits both small spatial extent and low radiance, producing only subtle traces in the keogram. As the event evolves, remnants of discrete structures intermittently appear and complicate the temporal profile, making human inspection of keograms prone to imprecise onset and termination markings. In contrast, the proposed method leverages both the morphological signature of diffuse emission (broad, uniform, and slowly varying bands) and its temporal behavior (extended duration without rapid structural transitions). These two cues reinforce one another, enabling our framework to produce an onset estimate that aligns with the physical scene observed in the image frames.
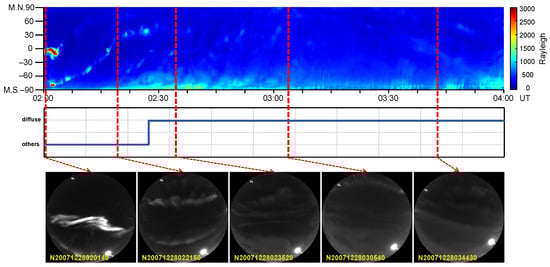
Figure 15.
Results for 28 December 2007 (06:00–10:00 UT). The keogram (top panel) exhibits diffuse-like signatures; however, the proposed method correctly classifies the interval as non-diffuse. The blue curve in the middle panel denotes the automatically identified diffuse aurora label over time. Red dashed vertical lines indicate the time instants selected from the keogram, and the corresponding all-sky imager (ASI) frames are shown in the bottom panel, as highlighted by the red arrows. The ASI images confirm that the observed emissions are dominated by cloud cover rather than true diffuse aurora.
Figure 16 presents the identification and segmentation results for the all-sky auroral sequence recorded on 14 November 2007 (02:00–04:00 UT). A keogram-only inspection could easily misinterpret the entire interval as diffuse aurora, since the stacked intensity pattern resembles a weak, persistent band. However, our method labels the entire duration as non-diffuse. Inspection of the all-sky frames confirms that the scene is dominated by cloud cover rather than auroral emission. This case highlights a common pitfall of keogram-based screening: cloud-induced brightness variations may mimic the large-scale temporal smoothness of diffuse aurora, whereas our model, operating on full-frame spatial information and learned morphological cues, correctly rejects such false positives.
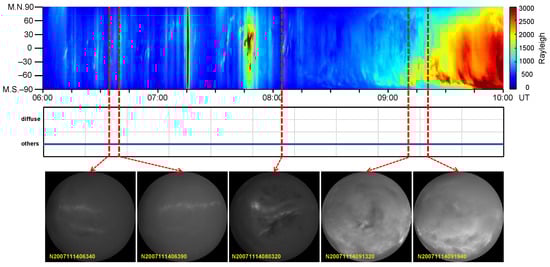
Figure 16.
Diffuse-aurora identification on 14 November 2007 (02:00–04:00 UT). The blue curve denotes the automatically identified diffuse aurora label, and red dashed lines on keogram indicate the time instants of the displayed ASI frames.
4.5. Method Validation Across Different Geomagnetic Activity Levels
The occurrence of diffuse aurora is closely linked to geomagnetic activity, as its generation mechanisms—primarily involving wave-particle interactions with whistler-mode chorus waves and electron cyclotron harmonic (ECH) waves—are modulated by magnetospheric dynamics [7,15]. The Kp index (Planetarische Kennziffer) is a standardized measure of global geomagnetic activity that quantifies disturbances in the horizontal component of Earth’s magnetic field [34,36]. This index is derived from weighted averages of observations from 13 mid-latitude geomagnetic observatories worldwide and represents a 3 h quasi-logarithmic local index. The Kp index has a direct physical connection to diffuse aurora occurrence through its influence on plasmasphere configuration and cold plasma distribution, which in turn affects the generation efficiency of plasma waves responsible for scattering electrons into the loss cone [35]. To evaluate the applicability of the proposed method under different geomagnetic conditions, we conducted systematic experiments across three representative geomagnetic activity states: geomagnetically quiet periods, moderate-to-active periods, and substorm intervals. These conditions were characterized using the Kp index and the SuperMAG SML index, respectively.
4.5.1. Case Study: Method Performance During Geomagnetically Quiet Conditions
Figure 17 presents an all-sky auroral observation sequence from YRS during 00:00–12:00 UT on 29 November 2006. The panels from top to bottom display: keogram showing auroral intensity evolution; classification results from the proposed method (diffuse aurora versus other types); Kp index variation represented as a color-coded bar chart, where yellow indicates geomagnetically quiet conditions and orange indicates moderate activity; and representative all-sky images at key moments. The Kp index evolution during this interval was 2.3 → 3.7 → 2.0 → 0.7, exhibiting a complete geomagnetic activity cycle transitioning from quiet conditions through moderate activity and returning to quiet conditions.
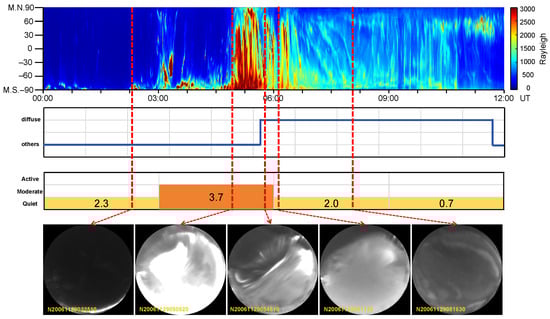
Figure 17.
Method validation during geomagnetically quiet-to-moderate conditions: Case study of 29 November 2006 (00:00–12:00 UT). The yellow and orange intervals indicate periods of quiet and moderate geomagnetic conditions, respectively. The annotated numbers denote the Kp index. The blue curve denotes the automatically identified diffuse aurora label, and red dashed lines on keogram indicate the time instants of the displayed ASI frames.
Initial phase (Kp = 2.3, 00:00–03:00 UT): despite the quiet-level Kp index, the keogram during this phase indicates weak auroral activity, with no distinct diffuse aurora signatures visible in the all-sky images. The proposed method achieves accurate identification based on actual morphological and dynamical characteristics, demonstrating that it does not erroneously classify intervals as diffuse aurora solely due to low Kp values.
Moderate activity phase (Kp = 3.7, 03:00–06:00 UT): As the Kp index increases, magnetospheric disturbances intensify, resulting in significantly enhanced auroral intensity. The keogram reveals pronounced high-intensity regions, indicating the emergence of discrete auroral structures. The corresponding all-sky images show a transition from intense discrete auroral events to a mixed state where discrete emission structures coexist with diffuse aurora. This phase, characterized by the coexistence of discrete and diffuse auroral morphologies, poses challenges for automated detection algorithms, as strong discrete emissions may partially obscure or locally dominate the weaker diffuse background. Despite these challenges, the proposed method successfully identifies diffuse auroral occurrences prior to 05:45 UT. The method focuses on the slowly varying, spatially extended emission patterns characteristic of diffuse aurora, while being less sensitive to the rapidly evolving and highly localized structures associated with discrete aurora. As a result, diffuse auroral activity can still be detected during this mixed phase, even when discrete auroral emissions are present and visually dominant.
Pure diffuse aurora phase (Kp = 2.0 → 0.7, 06:00–12:00 UT): As geomagnetic activity weakens, discrete auroral structures gradually diminish, and diffuse aurora becomes the dominant emission type. The keogram and all-sky images show a transition toward spatially extended, low-contrast, and slowly evolving auroral emissions, which are characteristic of diffuse aurora. During this phase, the proposed method consistently identifies diffuse auroral activity and accurately delineates its temporal extent, demonstrating its ability to capture the gradual onset and decay processes typical under geomagnetically quiet conditions.
4.5.2. Case Study: Method Performance During Geomagnetically Active Conditions
Figure 18 presents an all-sky auroral observation sequence during 03:00–15:00 UT on 6 January 2005. The panels show: (a) a keogram illustrating the temporal evolution of auroral intensity; (b) classification results produced by the proposed method; (c) the corresponding Kp index variation; and (d) representative all-sky images at selected times.
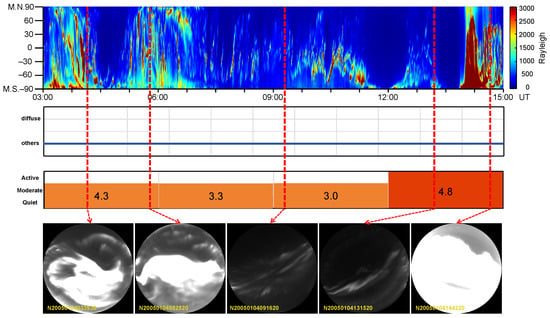
Figure 18.
Method validation during geomagnetically active conditions: Case study of 6 January 2005 (03:00–15:00 UT). The orange and red intervals indicate periods of moderate and active geomagnetic conditions, respectively. The annotated numbers denote the Kp index, which decreases from 4.3 to 3.3 and 3.0 during the moderate phase and subsequently increases to 4.8 during the active phase. The blue curve denotes the automatically identified diffuse aurora label, and red dashed lines on keogram indicate the time instants of the displayed ASI frames.
During this interval, the Kp index varies from 4.3 to 3.3 and 3.0 and then increases again to 4.8, indicating persistently moderate to active geomagnetic conditions. Visual inspection of the all-sky images shows that the field of view is dominated by intense, spatially structured discrete auroral emissions. In several periods, extended diffuse-like glow regions are also visible, which may appear morphologically similar to diffuse aurora in terms of spatial smoothness and reduced edge contrast.
However, when examined in the temporal context provided by the keogram and image sequence, these diffuse-like regions are closely associated with rapid intensity fluctuations and structural reconfigurations of nearby discrete auroral forms, rather than exhibiting the gradual drift and quasi-periodic modulation commonly observed in diffuse aurora. The proposed method leverages joint morphological and temporal cues to distinguish such cases and does not identify diffuse aurora during this interval. This case illustrates the method’s ability to avoid false positive detections of diffuse aurora under geomagnetically active conditions where discrete auroral activity dominates.
4.6. Case Study: Method Performance During Substorm Intervals
Figure 19 presents a typical moderate-intensity substorm event ( nT) that occurred from 23:43 UT on 30 November 2007 to 02:08 UT on 1 December 2007. The panels from top to bottom display (a) SML index evolution with three substorm phases annotated; (b) keogram showing auroral intensity evolution; (c) classification results from the proposed method (diffuse aurora versus other types); and (d) representative all-sky images at key moments.
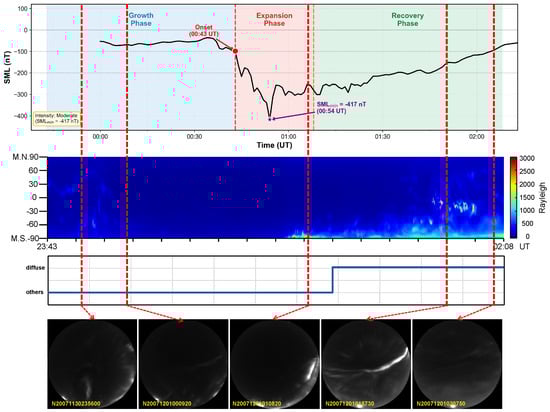
Figure 19.
Method validation during a substorm event: Case study of 30 November–1 December 2007 (23:43–02:08 UT). The blue curve denotes the automatically identified diffuse aurora label, and red dashed lines on keogram indicate the time instants of the displayed ASI frames.
The all-sky images reveal the following characteristics across the substorm evolution: Growth-to-expansion phase transition (00:20–00:43 UT)—as wave-particle interactions intensify, discrete auroral structures begin to brighten. Expansion phase (00:43–01:00 UT): Bright discrete arc structures dominate the field of view, exhibiting rapid morphological changes. Recovery phase (01:00–02:08 UT): Although discrete arc structures persist initially, diffuse aurora gradually recovers and becomes the dominant type, displaying pronounced pulsation characteristics.
During the transition from the expansion phase to the recovery phase, the all-sky images show a gradual shift from dominant discrete aurora to a mixed state where discrete and diffuse aurora coexist. The gradual evolution of diffuse aurora combined with the influence of bright discrete auroral structures poses challenges for accurate onset localization of diffuse auroral events. The classification results demonstrate that the proposed method accurately captures the timing of diffuse aurora emergence, with the transition boundary precisely localized through the SGSM’s snippet-level temporal aggregation and BiGRU contextual modeling.
During this event, YRS was located at approximately 03:43–05:08 MLT (post-midnight to dawn sector), positioned precisely in the region where injected electrons drift eastward following substorm onset. This observational location and temporal configuration are consistent with the characteristics described by [2,45], who reported that diffuse aurora occurrence peaks in the post-midnight sector approximately 30–40 min after substorm onset. This agreement validates the effectiveness of the proposed method in physically reasonable substorm–diffuse aurora association scenarios.
4.7. Statistical Study of Diffuse Auroral Events
To investigate the temporal distribution patterns of diffuse aurora, we applied the model trained on manually labeled all-sky aurora video data from 2003 to 2007 to automatically identify and segment unlabeled all-sky aurora data from 2008 and 2009. Specifically, we selected all-sky aurora observation data covering 48 days (October to December 2008) and 35 days (October to December 2009) for automatic identification and segmentation. To more intuitively present the temporal distribution patterns of diffuse aurora, we divided the 12 h period from 03:00 UT to 15:00 UT into intervals of 6 min each, creating a total of 120 intervals. Given that the temporal resolution of consecutive all-sky aurora images is 10 s, each time interval corresponds to 36 aurora frames. The number of frames identified as diffuse aurora in each interval was counted, and their occurrence probability across different time periods was calculated, thereby intuitively revealing their distribution patterns.
Figure 20 presents the temporal distribution statistics of diffuse aurora for 2008 and 2009. Figure 20 show the results for each year, respectively. The bars (colored from light blue to deep blue) reflect the number of frames in which diffuse aurora was identified within each time interval, with color intensity proportional to frame count, while the red curves illustrate the temporal variation trends of diffuse aurora occurrence rate. Statistical results indicate that diffuse auroras occur significantly more frequently in the morning than in the afternoon, with the peak appearing at approximately 07:00 UT and the minimum at approximately 11:00 UT This pattern is consistently observed in both years’ data. This temporal distribution pattern is consistent with the particle precipitation physical mechanism of diffuse aurora. Diffuse aurora is primarily caused by hot electrons associated with substorm activity and injected into the central plasma sheet. After injection near midnight, these hot electrons predominantly drift toward the dawnside. During the drift process, a portion of the hot electrons is scattered into the loss cone via wave-particle interaction, subsequently precipitating and exciting diffuse aurora; meanwhile, the number density of the source electron population gradually diminishes. Since auroral emission intensity is proportional to the precipitating electron flux, the decline in electron number density in the source region directly leads to a reduction in the effective electron flux capable of producing visible aurora. Therefore, from midnight to noon, the number density of source electrons continuously decreases during the drift process. Although wave-particle interaction still causes some electron precipitation near noon (around 11:00 UT), the emission intensity has diminished to a level that is difficult to clearly identify by conventional observation equipment, resulting in the trough in diffuse aurora occurrence rate during this period. Conversely, during the morning hours of the drift process (around 07:00 UT), the source electron number density remains relatively high, capable of effectively exciting diffuse aurora over a larger spatial extent, thereby explaining the formation of the occurrence rate peak. The observed distribution pattern is consistent with the diffuse aurora behavior reported in previous studies [9], validating the effectiveness of the method presented in this work.
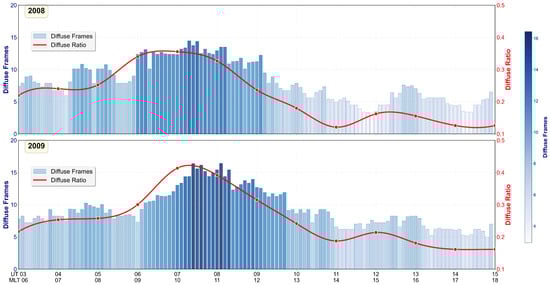
Figure 20.
Occurrence distributions of diffuse aurora based on automatically identified results. The bars (colored from light blue to deep blue) show the number of frames in which diffuse aurora is identified within each time interval. The red curves illustrate the temporal variation of the diffuse aurora occurrence rate, while the red dots denote the values at exact hourly timestamps.
5. Discussions
This study demonstrates that diffuse aurora can be reliably identified and temporally segmented from long, untrimmed all-sky auroral image sequences by explicitly modeling its weak spatial morphology and gradual temporal evolution. The consistently high identification accuracy achieved across diverse observational conditions indicates that the proposed framework captures key phenomenological characteristics of diffuse aurora that have long challenged traditional analysis methods.
Previous studies have primarily relied on keograms, visual inspection, or heuristic morphological criteria to identify diffuse auroral intervals. While effective for qualitative analysis and selected case studies, such approaches are inherently limited when handling weak optical signatures, gradual onset and decay, or complex scenarios where diffuse aurora coexists with discrete auroral structures. In particular, keogram-based methods collapse two-dimensional spatial information into a single latitudinal slice, which can obscure subtle spatial–temporal patterns and introduce ambiguity. By contrast, our framework operates directly on full all-sky image sequences and enforces temporal continuity, enabling more robust discrimination and more precise localization of diffuse auroral onset and decay.
The observed performance gains can be interpreted in the context of the physical nature of diffuse aurora. Unlike discrete aurora, which is characterized by sharp spatial boundaries and rapid intensity variations, diffuse aurora reflects prolonged precipitation processes associated with magnetospheric transport and wave–particle interactions. Its optical manifestation is therefore weakly structured in space but coherent over extended time scales. The snippet-based temporal aggregation and bidirectional temporal modeling adopted in this work align naturally with the gradual evolution of diffuse aurora, providing a physically meaningful abstraction of its onset–development–decay behavior rather than a purely mathematical segmentation.
Statistical analysis shows that a substantial fraction of the diffuse aurora events in our dataset occur under geomagnetically quiet to mildly disturbed conditions (low to moderate Kp), which is consistent with established observations that such conditions are favorable for diffuse auroral precipitation. Notably, additional case studies demonstrate that the proposed method remains effective across a range of geomagnetic activity levels. Under moderately active conditions, the method can still identify diffuse aurora embedded within mixed auroral scenes, while under persistently active conditions dominated by intense discrete aurora, it avoids falsely labeling diffuse-like background emissions as genuine diffuse aurora. These results suggest that the method does not rely on geomagnetic indices as explicit inputs, but instead learns discriminative visual–temporal patterns that remain stable across varying geomagnetic environments.
Several limitations should nevertheless be acknowledged. The refinement stage depends on the quality of coarse candidate intervals generated during initial identification, which may lead to error propagation in extremely ambiguous cases. Optical observations are also affected by atmospheric conditions, cloud cover, and instrumental sensitivity, introducing unavoidable uncertainty. In addition, annotation ambiguity is non-negligible for weak or transitional auroral states, and finite temporal resolution may limit boundary precision during rapid transitions.
6. Conclusions
This study presents an automated framework for the identification and temporal segmentation of diffuse aurora from long, untrimmed all-sky auroral video sequences. By modeling diffuse aurora as a video segmentation problem and tailoring the framework to its weak morphology and gradual temporal evolution, the proposed method achieves reliable identification and accurate boundary localization under complex observational conditions.
Experimental results on multi-year 557.7 nm all-sky imaging data from the Arctic YRS demonstrate strong performance in both identification and segmentation, achieving 96.3% frame-wise accuracy and an Edit score of 87.7%. The method effectively handles challenging scenarios including cloud contamination, low-brightness emissions, and the coexistence of diffuse and discrete aurora.
Based on the automated results, large-scale statistical analyses of diffuse aurora occurrence and temporal distribution were conducted, revealing consistent diurnal patterns across multiple years. These results confirm the feasibility of using intelligent, vision-based approaches for systematic analysis of long-term auroral observations. The proposed framework provides a practical tool for efficient processing of extensive auroral image archives and supports future data-driven investigations of auroral dynamics and magnetosphere-ionosphere coupling.
Author Contributions
Conceptualization, Q.W., P.H. and H.P.; methodology, Q.W. and P.H.; software, P.H.; validation, P.H.; formal analysis, P.H. and H.P.; data curation, P.H.; writing—original draft preparation, P.H.; writing—review and editing, Q.W.; visualization, P.H.; supervision, Q.W. and H.P.; project administration, Q.W. and H.P.; funding acquisition, Q.W. All authors have read and agreed to the published version of the manuscript.
Funding
This work was supported by the National Natural Science Foundation of China (Grant No. 41874173), the Aviation Key Laboratory of Science and Technology on Aerospace Vehicle (Grant No. J2025-STAV-03-001), and the National Key Laboratory of Science and Technology on Space-Born Intelligent Information Processing (Grant No. TJ-04-23-03).
Data Availability Statement
Data will be made available on request.
Acknowledgments
The authors would like to thank the Polar Research Institute of China for providing the auroral data.
Conflicts of Interest
All authors declare that they have no conflicts of interest related to this work.
References
- Newell, P.T.; Wing, S.; Meng, C.-I.; Sigillito, V. The Auroral Oval Position, Structure, and Intensity of Precipitation from 1984 Onward: An Automated On-Line Data Base. J. Geophys. Res. Space Phys. 1991, 96, 5877–5882. [Google Scholar]
- Meng, C.-I.; Rycroft, M.J.; Frank, L.A. Auroral Physics; Cambridge University Press: Cambridge, UK, 1991. [Google Scholar]
- Frey, H.U.; Phan, T.D.; Fuselier, S.A.; Mende, S.B. Continuous Magnetic Reconnection at Earth’s Magnetopause. Nature 2003, 426, 533–537. [Google Scholar] [CrossRef] [PubMed]
- Newell, P.T.; Sotirelis, T.; Wing, S. Diffuse, Monoenergetic, and Broadband Aurora: The Global Precipitation Budget. J. Geophys. Res. Space Phys. 2009, 114, A09207. [Google Scholar] [CrossRef]
- Ni, B.; Liang, J.; Thorne, R.M.; Angelopoulos, V.; Horne, R.B.; Kubyshkina, M.; Spanswick, E.; Donovan, E.F.; Lummerzheim, D. Efficient Diffuse Auroral Electron Scattering by Electrostatic Electron Cyclotron Harmonic Waves in the Outer Magnetosphere: A Detailed Case Study. J. Geophys. Res. Space Phys. 2012, 117, A01218. [Google Scholar] [CrossRef]
- Sandholt, P.E.; Farrugia, C.J. Does the Aurora Provide Evidence for the Occurrence of Antiparallel Magnetopause Reconnection? J. Geophys. Res. Space Phys. 2003, 108, 1466. [Google Scholar] [CrossRef]
- Thorne, R.M.; Ni, B.; Tao, X.; Horne, R.B.; Meredith, N.P. Scattering by Chorus Waves as the Dominant Cause of Diffuse Auroral Precipitation. Nature 2010, 467, 943–946. [Google Scholar] [CrossRef]
- Ni, B.; Thorne, R.M.; Zhang, X.; Bortnik, J.; Pu, Z.; Xie, L.; Hu, Z.-J.; Han, D.; Shi, R.; Zhou, C.; et al. Origins of the Earth’s Diffuse Auroral Precipitation. Space Sci. Rev. 2016, 200, 205–259. [Google Scholar] [CrossRef]
- Han, D.-S. Dayside Diffuse Aurora and the Cold-Plasma Structuring: A Brief Review. Front. Astron. Space Sci. 2021, 8, 725677. [Google Scholar] [CrossRef]
- Feldstein, Y.I.; Vorobjev, V.G.; Zverev, V.L.; Förster, M. Investigations of the Auroral Luminosity Distribution and the Dynamics of Discrete Auroral Forms in a Historical Retrospective. Hist. Geo Space Sci. 2014, 5, 81–134. [Google Scholar] [CrossRef]
- Sandholt, P.E.; Farrugia, C.J.; Moen, J.; Noraberg, Ø.; Lybekk, B.; Sten, T.; Hansen, T. A Classification of Dayside Auroral Forms and Activities as a Function of Interplanetary Magnetic Field Orientation. J. Geophys. Res. Space Phys. 1998, 103, 23325–23345. [Google Scholar] [CrossRef]
- Wang, Q.; Bai, W.; Zhang, W.; Shi, J. Automatically Sketching Auroral Skeleton Structure in All-Sky Image for Measuring Aurora Arcs. J. Geophys. Res. Space Phys. 2024, 129, e2023JA031778. [Google Scholar] [CrossRef]
- Han, D.-S.; Chen, X.-C.; Liu, J.-J.; Qiu, Q.; Keika, K.; Hu, Z.-J.; Liu, J.-M.; Hu, H.-Q.; Yang, H.-G. An Extensive Survey of Dayside Diffuse Aurora Based on Optical Observations at Yellow River Station. J. Geophys. Res. Space Phys. 2015, 120, 7447–7465. [Google Scholar] [CrossRef]
- Lou, Y.; Cao, X.; Ni, B.; Tu, W.; Gu, X.; Fu, S.; Xiang, Z.; Ma, X. Diffuse Auroral Electron Scattering by Electrostatic Electron Cyclotron Harmonic Waves in the Dayside Magnetosphere. Geophys. Res. Lett. 2021, 48, e2020GL092208. [Google Scholar] [CrossRef]
- Ni, B.; Thorne, R.M.; Horne, R.B.; Meredith, N.P.; Shprits, Y.Y.; Chen, L.; Li, W. Resonant Scattering of Plasma Sheet Electrons Leading to Diffuse Auroral Precipitation: 1. Evaluation for Electrostatic Electron Cyclotron Harmonic Waves. J. Geophys. Res. Space Phys. 2011, 116, A04218. [Google Scholar] [CrossRef]
- Nishimura, Y.; Lessard, M.R.; Katoh, Y.; Miyoshi, Y.; Grono, E.; Partamies, N.; Sivadas, N.; Hosokawa, K.; Fukizawa, M.; Samara, M.; et al. Diffuse and Pulsating Aurora. Space Sci. Rev. 2020, 216, 4. [Google Scholar] [CrossRef]
- Frahm, R.A.; Winningham, J.D.; Sharber, J.R.; Link, R.; Crowley, G.; Gaines, E.E.; Chenette, D.L.; Anderson, B.J.; Potemra, T.A. The Diffuse Aurora: A Significant Source of Ionization in the Middle Atmosphere. J. Geophys. Res. Atmos. 1997, 102, 28203–28214. [Google Scholar] [CrossRef]
- Wang, Q.; Jing, S.; Yang, R.; Liu, Z.; Tang, Y.; Pan, H. Loosen Attention: Integrating Localized Channel and Coarse Spatial Attention for Enhanced Analysis of Complex Aurora Images. Eng. Appl. Artif. Intell. 2025, 160, 111907. [Google Scholar] [CrossRef]
- Wang, Q.; Shi, J.; Liu, J.; Fan, J. Weakly Supervised Vortex Detection for Studying Correlation Between Multiscale Auroral Events. IEEE Geosci. Remote Sens. Lett. 2025, 22, 7500105. [Google Scholar] [CrossRef]
- Yang, Q.; Wang, J.; Su, H.; Xing, Z. Automatic Recognition and Localization of Poleward Moving Auroral Forms (PMAFs) from All-Sky Auroral Videos. Earth Space Sci. 2023, 10, e2023EA002843. [Google Scholar] [CrossRef]
- Tang, Y.; Niu, C.; Dong, M.; Ren, S.; Liang, J. Poleward Moving Aurora Recognition with Deep Convolutional Networks. In Proceedings of the Chinese Conference on Pattern Recognition and Computer Vision (PRCV), Xi’an, China, 8–11 November 2019; pp. 551–560. [Google Scholar]
- Ahn, H.; Lee, D. Refining Action Segmentation with Hierarchical Video Representations. In Proceedings of the IEEE/CVF International Conference on Computer Vision (ICCV), Virtual, 11–17 October 2021; pp. 16302–16310. [Google Scholar]
- Aziere, N.; Todorovic, S. Multistage Temporal Convolution Transformer for Action Segmentation. Image Vis. Comput. 2022, 128, 104567. [Google Scholar] [CrossRef]
- Farha, Y.A.; Gall, J. MS-TCN: Multi-Stage Temporal Convolutional Network for Action Segmentation. In Proceedings of the IEEE/CVF Conference on Computer Vision and Pattern Recognition (CVPR), Long Beach, CA, USA, 15–20 June 2019; pp. 3575–3584. [Google Scholar]
- Singhania, D.; Rahaman, R.; Yao, A. Coarse to Fine Multi-Resolution Temporal Convolutional Network. arXiv 2021, arXiv:2105.10859. [Google Scholar] [CrossRef]
- Yi, F.; Wen, H.; Jiang, T. ASFormer: Transformer for Action Segmentation. arXiv 2021, arXiv:2110.08568. [Google Scholar] [CrossRef]
- Liu, Y.; Huo, J.; Peng, J.; Sparks, R.; Dasgupta, P.; Granados, A.; Ourselin, S. SKIT: A Fast Key Information Video Transformer for Online Surgical Phase Recognition. In Proceedings of the IEEE/CVF International Conference on Computer Vision (ICCV), Paris, France, 1–6 October 2023; pp. 21074–21084. [Google Scholar]
- Yu, F.; Koltun, V. Multi-Scale Context Aggregation by Dilated Convolutions. arXiv 2015, arXiv:1511.07122. [Google Scholar]
- Behrmann, N.; Golestaneh, S.A.; Kolter, Z.; Gall, J.; Noroozi, M. Unified Fully and Timestamp Supervised Temporal Action Segmentation via Sequence to Sequence Translation. In Proceedings of the European Conference on Computer Vision (ECCV), Tel Aviv, Israel, 23–27 October 2022; pp. 52–68. [Google Scholar]
- Jiang, B.; Jin, Y.; Tan, Z.; Mu, Y. Video Action Segmentation via Contextually Refined Temporal Keypoints. In Proceedings of the IEEE/CVF International Conference on Computer Vision (ICCV), Paris, France, 1–6 October 2023; pp. 13836–13845. [Google Scholar]
- Lu, Z.; Elhamifar, E. FACT: Frame-Action Cross-Attention Temporal Modeling for Efficient Action Segmentation. In Proceedings of the IEEE/CVF Conference on Computer Vision and Pattern Recognition (CVPR), Seattle, WA, USA, 17–21 June 2024; pp. 18175–18185. [Google Scholar]
- Hu, Z.-J.; Yang, H.; Huang, D.; Araki, T.; Sato, N.; Taguchi, M.; Seran, E.; Hu, H.; Liu, R.; Zhang, B.; et al. Synoptic Distribution of Dayside Aurora: Multiple-Wavelength All-Sky Observation at Yellow River Station in Ny-Ålesund, Svalbard. J. Atmos. Sol.-Terr. Phys. 2009, 71, 794–804. [Google Scholar] [CrossRef]
- Wang, Q.; Liang, J.; Hu, Z.-J.; Hu, H.-H.; Zhao, H.; Hu, H.-Q.; Gao, X.; Yang, H. Spatial Texture Based Automatic Classification of Dayside Aurora in All-Sky Images. J. Atmos. Sol.-Terr. Phys. 2010, 72, 498–508. [Google Scholar] [CrossRef]
- Matzka, J.; Stolle, C.; Yamazaki, Y.; Bronkalla, O.; Morschhauser, A. The Geomagnetic Kp Index and Derived Indices of Geomagnetic Activity. Space Weather 2021, 19, e2020SW002641. [Google Scholar] [CrossRef]
- Meredith, N.P.; Horne, R.B.; Thorne, R.M.; Summers, D.; Anderson, R.R. Substorm Dependence of Plasmaspheric Hiss. J. Geophys. Res. Space Phys. 2004, 109, A06209. [Google Scholar] [CrossRef]
- Thomsen, M.F. Why Kp Is Such a Good Measure of Magnetospheric Convection. Space Weather 2004, 2, S11004. [Google Scholar] [CrossRef]
- Carreira, J.; Zisserman, A. Quo Vadis, Action Recognition? A New Model and the Kinetics Dataset. In Proceedings of the IEEE/CVF Conference on Computer Vision and Pattern Recognition (CVPR), Honolulu, HI, USA, 21–26 July 2017; pp. 6299–6308. [Google Scholar]
- Niu, Z.; Zhong, G.; Yue, G.; Wang, L.-N.; Yu, H.; Ling, X.; Dong, J. Recurrent Attention Unit: A New Gated Recurrent Unit for Long-Term Memory of Important Parts in Sequential Data. Neurocomputing 2023, 517, 1–9. [Google Scholar] [CrossRef]
- Zhang, Y.; Wu, R.; Dascalu, S.M.; Harris, F.C., Jr. A Novel Extreme Adaptive GRU for Multivariate Time Series Forecasting. Sci. Rep. 2024, 14, 2991. [Google Scholar] [CrossRef]
- Cho, K.; Van Merriënboer, B.; Gulcehre, C.; Bahdanau, D.; Bougares, F.; Schwenk, H.; Bengio, Y. Learning Phrase Representations Using RNN Encoder-Decoder for Statistical Machine Translation. In Proceedings of the Conference on Empirical Methods in Natural Language Processing (EMNLP), Doha, Qatar, 25–29 October 2014; pp. 1724–1734. [Google Scholar]
- Kingma, D.P. Adam: A Method for Stochastic Optimization. arXiv 2014, arXiv:1412.6980. [Google Scholar]
- Goodfellow, I. Deep Learning; MIT Press: Cambridge, MA, USA, 2016. [Google Scholar]
- Lea, C.; Flynn, M.D.; Vidal, R.; Reiter, A.; Hager, G.D. Temporal Convolutional Networks for Action Segmentation and Detection. In Proceedings of the IEEE/CVF Conference on Computer Vision and Pattern Recognition (CVPR), Honolulu, HI, USA, 21–26 July 2017; pp. 156–165. [Google Scholar]
- Caba Heilbron, F.; Escorcia, V.; Ghanem, B.; Carlos Niebles, J. ActivityNet: A Large-Scale Video Benchmark for Human Activity Understanding. In Proceedings of the IEEE/CVF Conference on Computer Vision and Pattern Recognition (CVPR), Boston, MA, USA, 7–12 June 2015; pp. 961–970. [Google Scholar]
- Newell, P.T.; Gjerloev, J.W. Evaluation of SuperMAG Auroral Electrojet Indices as Indicators of Substorms and Auroral Power. J. Geophys. Res. Space Phys. 2011, 116, A12211. [Google Scholar] [CrossRef]
Disclaimer/Publisher’s Note: The statements, opinions and data contained in all publications are solely those of the individual author(s) and contributor(s) and not of MDPI and/or the editor(s). MDPI and/or the editor(s) disclaim responsibility for any injury to people or property resulting from any ideas, methods, instructions or products referred to in the content. |
© 2026 by the authors. Licensee MDPI, Basel, Switzerland. This article is an open access article distributed under the terms and conditions of the Creative Commons Attribution (CC BY) license.