Highlights
What are the main findings?
- The MODIS legacy sensors have experienced electronic crosstalk in the photovoltaic bands from pre-launch.
- The MODIS characterization support team developed an algorithm to correct the electronic crosstalk contamination and implemented it in its official Level-1B product. The strategy greatly improves image quality.
What is the implication of the main finding?
- All MODIS Level-1B products are crosstalk-corrected and therefore have little-to-no striping in their Earth view imagery. Additionally, the crosstalk correction helps reduce long-term drifts in the data records.
Abstract
The photovoltaic (PV) bands on the mid-wave and long-wave infrared (MWIR and LWIR) cold focal plane assemblies of Terra and Aqua MODIS have suffered from gradually increasing electronic crosstalk contamination as both instruments have continued to operate in their extended missions, respectively. This contamination has considerable impact, particularly for the PV LWIR bands, which includes image striping and radiometric bias in the Level-1B (L1B)-calibrated radiance products as well as higher level (and mostly atmospheric but also land and oceanic) products (e.g., cloud phase particle, cloud mask, land and sea surface temperatures). The crosstalk was characterized early in the mission, and test corrections were developed then. Ultimately, the groundwork for a robust electronic crosstalk correction algorithm was developed in 2016 and implemented in MODIS Collection 6.1 (C6.1) back in 2017 for the Terra MODIS PV LWIR bands. It was later introduced in Aqua MODIS C6.1 for the same group of bands in April 2022. Additional improvements were made in MODIS Collection 7 (C7) to better characterize the electronic crosstalk in the PV LWIR bands, and the electronic crosstalk correction algorithm was also extended to select detectors in the MODIS MWIR bands. This work will describe the electronic crosstalk correction algorithm and its application on the MODIS L1B product, the differences in application between C6.1 and C7, as well as additional improvements made to enhance the contamination correction and improve image quality for the Aqua MODIS PV LWIR bands. The electronic crosstalk correction coefficient time series for the MODIS PV bands will be discussed, and some cases will be presented to illustrate how image quality improves on the L1B and Level 2 products after the correction is applied. Lastly, experiences gained regarding the PV bands electronic crosstalk and the strategy used to correct it will be discussed to provide future data users and scientists with an insight as to how to improve on the legacy record that the Terra and Aqua MODIS sensors will leave behind after both spacecrafts are decommissioned.
1. Introduction
The Moderate Resolution Imaging Spectroradiometer (MODIS) onboard the Terra (launched in 1999) and Aqua (launched in 2002) spacecraft is a key instrument of the NASA Earth Observing System [1]. MODIS produces images of the Earth in 36 spectral bands that range in wavelength from 0.4 μm to 14.2 μm [2,3]. The MODIS bands are classified into two wavelength-based groups: the Reflective Solar Bands (RSBs) and the Thermal Emissive Bands (TEBs). These bands or channels consist of linear arrays of detectors that are separated into four focal plane assemblies (FPA) for the visible (VIS), near-infrared (NIR), short- and mid-wave infrared (S/MWIR), and long-wave infrared (LWIR) bands. While the scan-mirror rotates, an image is projected onto the FPA and is sampled by the detectors at a rate that matches the scan-mirror rotation rate, producing a continuous image. Along with the Earth-view imagery, the scan-mirror also brings into view a set of onboard calibrators (OBC) and deep space during each scan-mirror rotation—these provide on-orbit calibration data and the background signal, respectively. Each of the TEBs are calibrated on-orbit using a blackbody (BB) target.
The MODIS MWIR bands, 20–25, and LWIR bands, 27–36, are located on two cold FPA with controlled temperatures of 83 K. Bands 20–30 have photovoltaic (PV) detectors. Some of the PV MWIR bands are used for land surface temperature (20, 23), fire detection (21), and ice cloud (24) products. The PV LWIR bands are used to measure water vapor distribution (27, 30), cloud properties (27, 28), land/ocean temperatures (29), and ozone concentrations (30). The bands within each respective band group (PV MWIR or PV LWIR) share the same sampling electronics used for readout of the detector signals and are sampled in succession for each MODIS pixel. The use of shared sampling electronics gives rise to the potential for electronic crosstalk between the PV detectors. This issue was characterized during pre-launch testing and monitored before the launch of the Terra spacecraft. As the mission has progressed, the effects of electronic crosstalk among the PV LWIR bands have become progressively apparent through sudden gain changes in the detectors, increases in the noise-equivalent differential temperature [3], image striping, and the presence of land/water boundary features in the atmospheric channels that were not present early in the mission [4,5,6,7,8]. While generally stable for the MWIR detectors, the electronic crosstalk amongst this band group has shown noticeable out-of-family behavior for specific detectors that has led to considerable image striping. All these effects have significant impacts on the MODIS data products dependent on these bands [8].
Electronic crosstalk is a known problem that has affected several space-based imaging instruments [9,10,11,12]. Generally, by directly illuminating individual bands on the instrument, the impact of electronic crosstalk can be measured on each of the affected bands. Correction coefficients can then be derived. A similar strategy was used during the pre-launch phase for MODIS, demonstrating electronic crosstalk, albeit at a lower level. However, significant on-orbit changes prevented the MODIS characterization support team (MCST) from using these characterizations to correct the MODIS data. Thus, in the case of Aqua and Terra MODIS, observations of the Moon through the space-view port are used to characterize the crosstalk contamination [4,5,6,7,8,13,14,15,16,17,18]. For both instruments, signal contamination in the lunar images can clearly be observed for RSBs 1, 2, 5–7, 26, and TEBs 20–30. Terra MODIS bands 32–36 also have signal contamination in the form of optical crosstalk, which can also be observed in the lunar images. For most of these bands, the impact on the Level-1B (L1B) data is small. However, for the PV LWIR bands, the contamination levels have increased significantly as the MODIS missions have advanced, with steep increases following safe-mode events in February of 2016 and April of 2022 for Terra and Aqua, respectively. Although the instrument and electronics are nominally identical and electronic crosstalk is likewise observed for the PV LWIR bands in Aqua MODIS, the impact on the L1B data, however, is much smaller than what is seen for Terra, and the contamination level changes over time are significantly smaller. For the MWIR detectors that are greatly affected by electronic crosstalk, the radiometric bias can reach up to 10 K at the coldest temperature scenes. When it comes to the PV LWIR bands, bands 27 and 30 are the most affected. For band 27, the radiometric bias can reach up to 1 K, while for band 30 it can reach somewhere between 2 and 3 K. For bands 28 and 29, the radiometric bias is around 0.5 K. When it comes to the atmospheric products, an example is the cloud phase product. As it pertains to the liquid and ice phases, the electronic crosstalk effects induce an underrepresentation of the ice phase and overrepresentation of the liquid phase of around 200 counts. An example of the ocean surface temperature products that use band 29 (amongst others) indicate that electronic crosstalk causes warmer temperatures by roughly 0.4 K.
The method for correcting the electronic crosstalk effect is based on a linear model, like in previous works [4,5,6,7], where the correction signal is linearly proportional to the measured signal from the detectors sending the contamination. These derived coefficients are then applied to the MODIS Level-1A data from which the L1B and higher-level data products are generated. The groundwork for an operational MODIS electronic crosstalk correction algorithm was developed in 2016 and originally implemented in MODIS Collection 6.1 (C6.1) back in 2017 for the Terra MODIS PV LWIR bands only [16]. It was later introduced in Aqua MODIS C6.1 for the same group of bands in April 2022. Additional improvements were made in MODIS Collection 7 (C7) to better characterize the electronic crosstalk in the PV LWIR bands, and the electronic crosstalk correction algorithm was also extended to select detectors in the MODIS MWIR bands [19,20,21,22]. Overall, the crosstalk correction provides significant improvements to the MODIS L1B and Level 2 (L2) data.
When it comes to the PV LWIR bands, the long-term effects of the electronic crosstalk corrections are significant. For band 27, these correct a 1.5-K drift, whereas for band 29, the correction is around 1 K in the time series. For band 30, the correction effect is much more significant and around 3 K long-term. Band 28 is the least affected, with a correction smaller than 0.5 K in its times series. These effects are scene- and brightness-temperature-dependent and much larger in magnitude for the colder scenes. Therefore, the corrections are largely necessary in order to maintain the MODIS sensors not only consistent between themselves, but also when compared to other sensors such as AIRS and IASI. MODIS Collections 6.1 and 7 are therefore essential to the science community to perpetuate long-term Earth records for the thermal emissive channels. The application of the electronic crosstalk correction is crucial for any Level 2 (and higher) products that depend on any of the PV bands affected by it. By applying the correction, MCST can ensure, at the calibration level, that the science community has access to well-calibrated MODIS Level 1B products. Over the last 5 years, especially after the initial development of Collection 7, multiple science teams have collaborated with MCST in efforts to make sure that the MODIS C7 L1B products provide accurately calibrated radiance data. Examples of these collaborative efforts include assessing cloud phase, water vapor, and ocean temperature products as well as inter-sensor comparisons with IASI and AIRS. The impact of the electronic crosstalk correction on the PV bands is vast, since it will allow for continuous, well-calibrated data for over 25 years that can be used for long-term climate trend studies and can be extended by the VIIRS sensors in orbit as well as those yet to be launched.
In this manuscript, Section 2 will describe the electronic crosstalk correction algorithm and its application on the MODIS L1B product, the differences in the correction application between C6.1 and C7, and the additional improvements made to enhance the contamination correction and improve image quality for the Aqua MODIS PV LWIR bands. The results in Section 3 include the electronic crosstalk correction coefficient time series for the MODIS PV bands and some cases that illustrate how the image quality improves on the L1B and L2 products after the correction is applied. Section 4 will present the lessons learned regarding the PV bands electronic crosstalk and the strategy used to correct it, while Section 5 will conclude with the closing arguments. This work intends to provide future data users and scientists with an insight as to how to improve on the legacy record of over 25 years that the Terra and Aqua MODIS sensors will leave behind after both spacecrafts are decommissioned.
The results shown in this paper are an update and extension of what was presented by Wilson et al. [17] back in 2016. Back then, the results focused on the algorithm development for Terra MODIS bands 27 through 30 only. In this paper, the application of the algorithm to Aqua MODIS bands 27–30 is introduced. In Section 2.3, a new algorithm to remove residual striping from the Earth imagery from Aqua MODIS bands 27–30 is also presented. Additionally, the crosstalk correction algorithm is also applied to the MWIR bands, which was not discussed in ref. [17]. Lastly, this manuscript provides an update of close to 10 years of long-term MODIS data from what was last presented by Wilson et al. in 2016 [17]. This is of particular importance, as both MODIS missions near their end.
2. MODIS PV Electronic Crosstalk
2.1. Characterization, Correction Algorithm, and Application
The electronic crosstalk contamination occurs at the initial stages of the electronic readout from the detectors by affecting the raw analog signal output of the instrument. Thus, the contamination will trickle down to every level—it starts with the derivation of the gain coefficients from the OBC data and the raw Earth view (EV) data, and will have flowing impacts to higher level products that use these data. Generally speaking, the contamination artifacts can show up on the L1B and higher-level products as the following: poor image quality, drifts in the brightness temperature retrievals, pronounced land/water boundary features, and large detector-to-detector differences during retrievals.
Crosstalk contamination can also be seen during Moon observations through the MODIS space view (SV) port—where the dark background of space surrounding the bright lunar image highlights the contamination features. Since the angular size of the Moon is small at the relatively large distance between the spacecraft and the Moon, the image of the Moon on the MODIS FPA does not illuminate all bands and detectors simultaneously, as can be seen in Figure 1a and Figure 2a. Due to the oversampling effect [23], the Moon can be observed over the course of many consecutive scans. The lunar image moves in the track direction by less than the width of a single MODIS 1-km pixel from scan-to-scan.
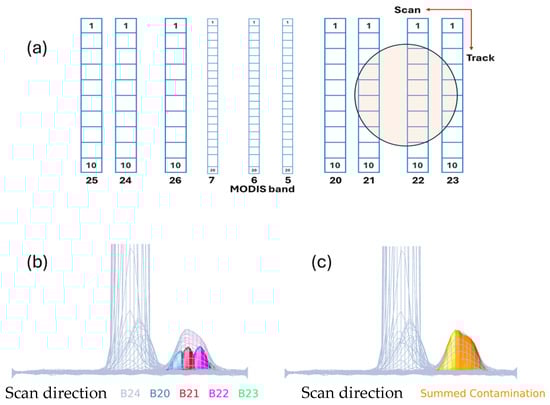
Figure 1.
Example signal from lunar images for the PV MWIR bands. (a) Layout of the PV MWIR bands on the FPA with a circle superimposed to represent the relative size of the lunar image on the FPA. Detectors are labeled in product order (P.O.). (b) Background-subtracted lunar signal for single detector (Aqua MODIS Band 24, Detector 1) limited to low signal levels to highlight contamination (small peak next to large Moon signal). The alignment of the sending band signals is also shown. These are derived from the measured lunar signal of the sending bands. The sending signals are shown after a saturation correction has been applied and are scaled to show alignment. (c) Same image as (b) but with contamination from all sending bands summed and illustrated as one single source. Data is from a lunar observation in June 2025.
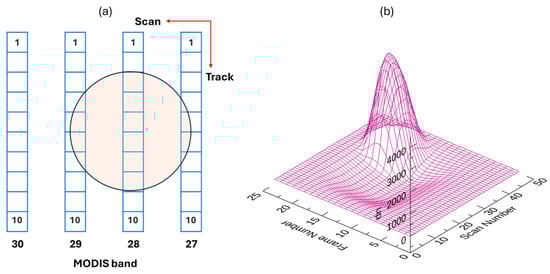
Figure 2.
Example signal from lunar images for the PV LWIR bands. (a) Layout of the PV LWIR bands on the FPA with a circle superimposed to represent the relative size of the lunar image on the FPA. Detectors are labeled in P.O. (b) Background-subtracted lunar signal versus scan and frame numbers for a single detector (Terra MODIS Band 27, Detector 1). Negative signal is due to crosstalk contamination. Data is from a lunar observation in July 2025.
For each MODIS detector within a given band, the lunar signal can be plotted versus scan and frame number (Figure 2b), creating an effective single detector lunar image. At the highest signal levels, the lunar signal saturates during analog-to-digital conversion at a maximum signal of 4095 before background subtraction. For each scan, the background signal level is determined using the average signal of six frames on each side of the main lunar signal (12 total), which begins 15 frames (or 30 for the MWIR bands) away from the center frame for the lunar observation. The center frame is calculated for each band and lunar event based on the known orientation of the instrument after the roll maneuver and the position of the Moon relative to the instrument.
Since the electronic crosstalk occurs at the initial stages of the detector electronics before the analog-to-digital conversion of the signal, this saturation needs to be corrected to have a better representation of the true contaminating signal. To do this, we use the ratio of the unsaturated pixels with the spatially co-registered (aligned in frame number) signals from band 31 (PV LWIR) or band 21 (PV MWIR), which do not saturate when viewing the Moon. We then multiply the band 21 (or 31) signal by this ratio to replace the values of the saturated pixels.
At the lowest signal levels, just around the main lunar signal, contamination of the lunar images can be seen in the form of a negative signal level (dn < 0; meaning the signal measured is below the background level) for the PV LWIR bands or a smaller positive signal next to the main lunar signal for the PV MWIR bands, as seen in Figure 1b,c and Figure 2b, respectively. To determine the source of the contaminating signal, we can use the known frame offsets between each of the PV bands on the same FPA and plot the scaled lunar signal from each band versus the contamination (e.g., Figure 1b). The Moon provides a good source not only for identifying the contaminating signal, but also for deriving the appropriate correction coefficients, since the contamination happens near where the signal is close to the background level. This strategy gives us the capability of making a comparison to the expected “true” signal, which is typically quite difficult when analyzed using EV data.
Similar to previous works [4,5,6,7,13,14,15,16,17,18], the crosstalk contamination signal is assumed to be linearly proportional to the signal from each of the sending detectors as seen in Equation (1), where the corrected digital signal is defined as follows:
where S and F represent the scan and frame numbers, respectively, while the * represents the digital count before the correction is applied (i.e., contaminated data). The summation term represents the contaminated signal, which when subtracted from the measured signal gives the corrected signal, dni. Inside the summation, ci,j is the crosstalk coefficient matrix that scales the signal from the jth PV detector to represent the contamination. ΔFj is the relative frame offset of detector j with respect to detector i on the FPA. Counters i and j range from one to forty (or 1–70; PV MWIR) for the PV LWIR bands to represent detectors one through ten of bands 27–30 (or 20–26) in product order. It is stipulated that ci,j = 0 when i = j, since having a detector that self-induces crosstalk contamination is not something quantifiable as the contamination and main lunar images would align.
In general, a least-squares fit is used to find the values for the elements of ci,j by minimizing the difference between the band 31 (or band 21 for the MWIR bands) reference signal (plus an additional early mission contamination reference signal for any residual minor differences) and measured contamination signal for every receiving detector. In practice, the algorithm is able to find values for each of the elements of ci,j individually. However, there is significant overlap in the sending signal among neighboring detectors within a band. To simplify the approach, a restriction is used for each coefficient value to be the same for each sending detector within a given band—producing what is effectually a band-averaged result; this strategy was used in previous works [4,5,6,7,13,14,15,16,17,18]. There are a few distinct exceptions that consider the anomalous sending signal from detector 10 of bands 27, 28, 29, and 30 to receiving detector 1 of bands 28, 29, 30, and 27, respectively, as well as Aqua bands 22, 23, 25, 26, and 24 to 20, 22, 23, 24, and 25, correspondingly. In these cases, a separate sending signal can be seen in the lunar images for detector 1 of the receiving bands that is precisely aligned with the lunar signal from detector 10 of the sending bands. The coefficient for these sending detectors is found independently of the band-averaged coefficient results. This improves the performance of those contaminated detectors drastically. This contamination effect is likely due to an electronic sampling error when the electronics used to read the detector signals switch between neighboring bands. Lastly, another exception exists for band/detector pairs 22/8, 23/10, and 24/1 in the Terra MWIR bands, for which a correction is derived using ice cloud EV data from sending band 26—since the signal coming from the lunar images is too bright, and over higher brightness temperatures, and the contamination is apparent over lower, colder temperatures. Figure 3 illustrates the effectiveness of the correction coefficients by applying them to the lunar data and comparing them to the original contaminated signal for sample band/detector pairs Aqua MODIS MWIR band 24, detector 1, and Terra MODIS PV LWIR band 27, detector 1—both in product order. In both cases, the contamination is removed from the original contaminated signal, leaving the uncontaminated signal, as intended.
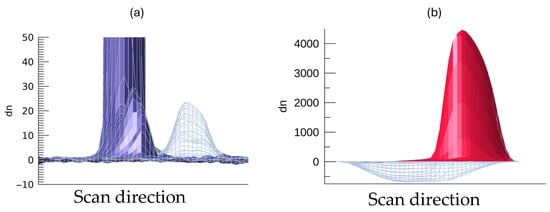
Figure 3.
Example corrections for MODIS lunar data from June and July 2025 for (a) Aqua band 24, detector 1 and (b) Terra band 27, detector 1. Detectors are labeled in product order. Wireframes represent data before correction, while the purple (a) and red (b) data are after the corrections are applied.
The algorithm is simple, robust, and can be used for each lunar observation by the instrument to determine the crosstalk coefficients. In the official L1B implementation, the coefficients are derived from scheduled lunar observations, where the lunar phase angle is restricted to a specified range [16]. However, unscheduled and special observations (Moon appears in SV port without a spacecraft maneuver) can be used as well. Such observations can happen over large phase angles with the caveat that these observations do not always provide a complete lunar image. It should be of note that Earth-view targets are also used to generate the electronic crosstalk correction coefficients for some of the Terra MWIR detectors. These coefficients are already used to correct striping in these detectors in the official Level 1B product. Therefore, yes, it is feasible. MCST has also assessed the possibility of extending this strategy to more MWIR detectors as well as the PV LWIR bands, and the results are promising. Nonetheless, highly bright targets (like the Moon) continue to be the golden standard, since the intention is for the crosstalk correction coefficients to be generalizable for different scene types.
2.2. Differences Between Collections 6.1 and 7
The Collection 6.1 L1B product introduced the electronic crosstalk correction algorithm for Terra MODIS PV LWIR bands 27–30 only [16]. This decision was made after the electronic crosstalk increased significantly for these bands after the February 2016 safe mode event anomaly. At the time, the crosstalk between the Aqua PV LWIR bands was much smaller than Terra’s. Thus, the decision to only implement it on the Terra bands from mission beginning with the C6.1 rollout. Years later, in March 2022, the Aqua spacecraft and its MODIS instrument also entered into an unplanned safe mode state that similarly impacted the PV LWIR bands. Henceforth, MCST decided to also implement the same algorithm in the Aqua MODIS C6.1 L1B product in forward production only (roughly an April 2022 start date) [24]. In the C7 L1B product, this algorithm is implemented for the Terra and Aqua MODIS PV LWIR bands from mission beginning [20,24]. Additionally, in C7, the algorithm is extended to select detectors in the MODIS PV MWIR bands. Table 1 summarizes the MODIS C6.1 and C7 electronic crosstalk application differences for the PV bands.

Table 1.
MODIS electronic crosstalk correction application differences between C6.1 and C7 for the PV bands.
The updates in C7 (when compared to C6.1) have shown significant improvement in the MODIS L1B products not only by reducing the striping in the Earth imagery (e.g., MODIS bands 24, 27, and 30) but also by reducing long-term drifts seen in some MODIS bands (e.g., Aqua band 29 and Terra band 30). A detailed discussion of these improvements is shown in Section 3.2 and Section 3.3.
2.3. Aqua PV LWIR Bands Destriping Algorithm Explanation
In the case of Aqua, MCST found that after the crosstalk correction coefficients derived from the lunar observations are applied to the MODIS data, some residual striping remains in the PV LWIR bands. This is due to the electronic crosstalk contamination having nonlinear effects and a strong Earth scene dependency. Thus, the uncertainty in the derived coefficients can influence the amount of correction. Even after the correction, some striping due to the detector-to-detector differences within a band is still present. Because of this, MCST developed an additional adjustment to lessen this residual striping on the L1B imagery [25]. The strategy involves performing a Fast Fourier Transform (FFT) analysis on one orbit’s worth of EV data (several scene types) after it has been corrected with the Moon-derived coefficients. Afterwards, adjustment factors are generated to fine-tune all 10 receiving detectors for each PV LWIR band in a manner that reduces the residual striping. These adjusted crosstalk correction coefficients are the product of the Moon-derived crosstalk correction coefficients and the adjustment factors generated from the FFT analysis. This methodology is applied in C6.1 since January 2023 and C7 from mission beginning. Figure 4 shows an Aqua MODIS granule from June 2025 for band 27 without the crosstalk correction, with the correction, and with the adjusted correction. It can easily be seen how effectively the correction works, and the extra tuning that comes from adjusting the Moon-derived coefficients.
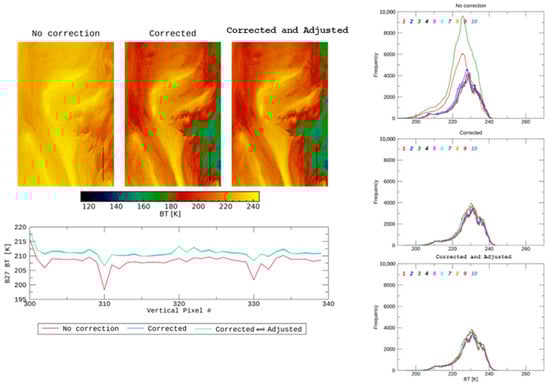
Figure 4.
Performance example for Aqua MODIS granule without the crosstalk correction, with the correction (Moon only), and with the adjusted correction (Moon and FFT) for band 27. The granule is from June 2025, as are the crosstalk correction coefficients that were applied. Vertical black lines in granule images illustrate the location from which the vertical profiles were extracted.
The residual striping being referred to is the remaining misalignment between detectors when we look at the EV data after we apply the crosstalk coefficients derived from the Moon. Thus, we apply an extra adjustment to these coefficients (that are derived from the Moon data only) by assessing the EV data. This is why we call them adjusted crosstalk coefficients. We derive the original coefficients from the Moon data, apply it to the EV data, assess the EV data, and then derive an extra adjustment that we apply back to the Moon-derived coefficients to end up with the adjusted crosstalk coefficients.
When MCST developed the crosstalk coefficients, the strategy was designed for simplicity and ease of application in the L1B product. After careful consideration and evaluation over multiple EV scenes, a decision was made to only use first order coefficients. Since the second order coefficients are much more complex to derive and apply back to the data. That still means that the coefficients are a generalization (as with any scientific theorem) and may sometimes work less efficiently over specific scenes. This is why the non-linear (second order) effects, as well as the scene (very cold versus very warm brightness temperatures) dependency, come into play.
3. Electronic Crosstalk Correction Coefficients
3.1. Time Series and Main Events Discussion
Using the algorithm described in Section 2, crosstalk correction coefficients for each detector and each PV band can be derived using monthly scheduled lunar observations throughout the mission. Figure 5 and Figure 6 illustrate examples of the correction coefficients time series for receiving band 24, detector 1 (in product order) from sending band 26, detector 10 (product order) as well as all the PV LWIR bands (receiving and sending band-averaged) for Terra and Aqua MODIS, respectively. When it comes to the MWIR coefficients, these have decreased gradually in magnitude over the mission and have not seen sharp jumps whenever there has been an instrument anomaly or a changing event. As for the PV LWIR coefficients, these show slow increases in magnitude throughout the mission and drastic sudden increases in the values of the coefficients whenever there have been safe mode events later in the missions. The sudden jumps are tied to instrument changing events such as the safe mode anomalies that happened to both spacecrafts. As for the seasonal variations, these are more difficult to explain, since these coefficients are derived from the Moon. Any seasonal variation will be subtle and will come from how close or far the satellite is from the Moon and Sun at any given time. The Moon’s brightness data, as measured by instruments, exhibits seasonal variations related to the changing Sun–Moon–satellite phase angle over the year. Normally, models like the Robotic Lunar Observatory (ROLO) model predict lunar irradiance (brightness) with high precision by accounting for these geometric variations. In general, the values of the coefficients for each contaminated detector trend towards increasingly negative values for the PV LWIR bands and decrease but remain positive in value for the MWIR bands as the mission’s advance. Moreover, while the detector 10-to-detector 1 coefficients are larger for the Aqua MWIR bands, the opposite can be said of the electronic crosstalk contamination between the Terra PV LWIR bands when compared to those of Aqua, since the coefficients are larger. What is consistent between both MODIS sensors is the fact that band 24 displays the largest electronic crosstalk contamination during daytime, and bands 27 and 30 exhibit the largest electronic crosstalk amongst the PV LWIR bands. The coefficients themselves have been proven to be generalizable because when applied over entire orbits worth of data, which themselves include all possible scene types on Earth, the detectors for the affected band are aligned and in-family; effectively removing the striping. Moreover, at the long-term level, the times series for cold (deep convective clouds, Dome Concordia) and warm (ocean, desert) scenes have been evaluated continuously and extensively. Results show that the long-term drifts seen prior to the crosstalk corrections are greatly reduced post-correction. This has been further confirmed by assessing the agreement of MODIS with other sensors such as IASI, VIIRS, and AIRS. In all instances, MODIS shows better inter-sensor agreement after the crosstalk correction coefficients have been applied.
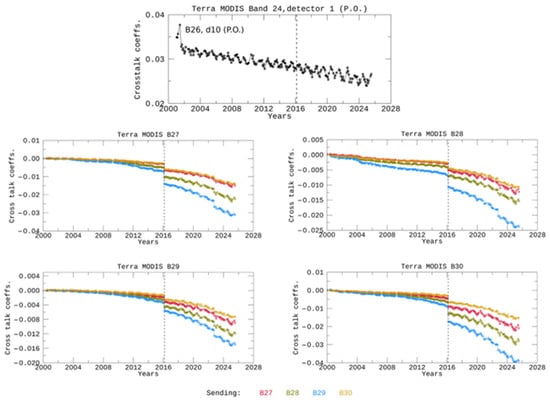
Figure 5.
Examples of the trending coefficient values derived from lunar observations for Terra. The circles represent the coefficients derived from individual lunar observations. Results are receiving and sending band averaged. Vertical line represents February 2016 safe mode event.
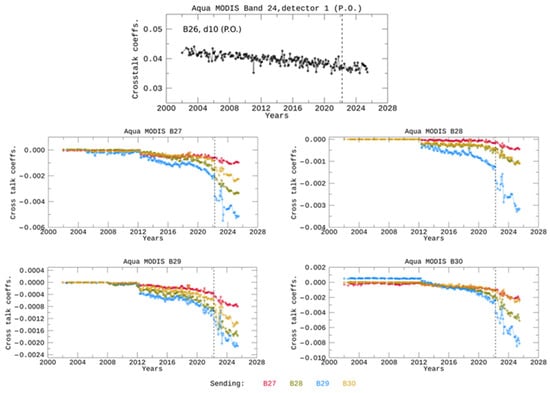
Figure 6.
Examples of the trending coefficient values derived from lunar observations for Aqua. The circles represent the coefficients derived from individual lunar observations. Results are receiving and sending band averaged. PV LWIR coefficients shown are after FFT adjustment. Vertical line represents March 2022 safe mode event.
3.2. L1B Product Assessment
As mentioned previously, electronic crosstalk among the PV bands occurs at the raw signal level, and thus its impact can be seen on every level of the MODIS data. The MODIS L1B data, which provides the EV calibrated radiance, can be significantly impacted by electronic crosstalk on both the derived gain coefficients of the detectors and the raw EV signal, degrading image quality.
Figure 7 and Figure 8 show the crosstalk correction applied to an EV image using Terra band 27 (July 2025) and Aqua band 24 (June 2025) as examples. As discussed in Section 3.1, band 27 is one of the most severely affected by the crosstalk contamination. These artifacts are displayed via significant striping due to detector-to-detector differences in the contamination levels as well as land/water boundary features that should not be present (Figure 7a). The striping and radiometric bias can clearly be seen in Figure 7b by looking at a vertical profile along the track direction, whereas the detector-to-detector differences are easily noticeable by comparing Figure 7c,d, which display the brightness temperature distribution for an entire MODIS L1B granule (which roughly comprises 202–204 scans and 1354 individual frames or approximately 2.7 × 10⁵ brightness temperature retrievals). All crosstalk-induced artifacts are mostly removed after the correction is applied. In the case of the MWIR bands, the main crosstalk-related artifact seen is detector striping, and it is mainly for one single detector in each of these bands. For band 24, the contamination is displayed during daytime, since the signal comes from reflective solar band 26, and it is mostly apparent over cold scenes such as ice clouds. This can be seen in Figure 8 via the EV imagery (Figure 8a), vertical profile (Figure 8b) where the uncorrected data (in red) retrievals display warmer temperatures for detector 1, and by comparing the uncorrected (Figure 8c) and corrected (Figure 8d) MODIS data, where the detector 1 tail at the colder end is brought back in-family.
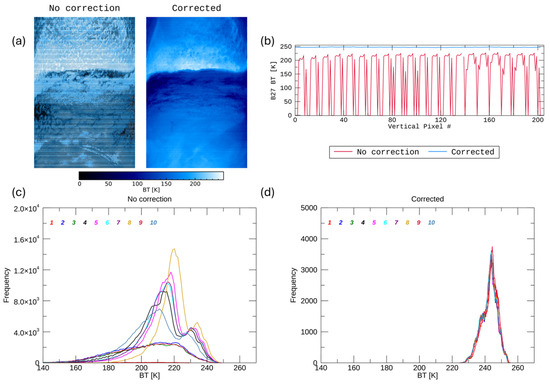
Figure 7.
Example of image correction for L1B data on July 2025 for Terra MODIS band 27. (a) EV imagery before and after correction. (b) Vertical line profile along track direction before and after correction. (c) Uncorrected and (d) corrected brightness temperature distributions for data from one MODIS L1B granule. The vertical profile includes all scans, and therefore all detectors, and it is for frame 624 right in the middle of the granule.
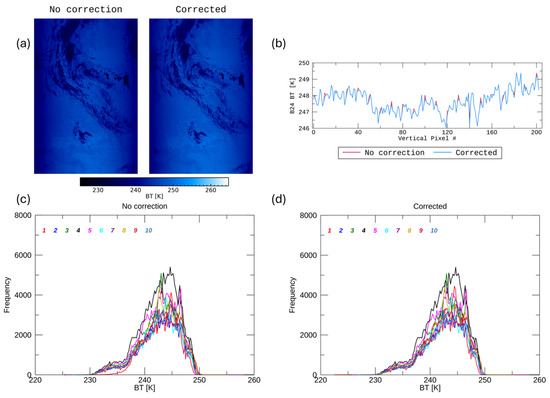
Figure 8.
Example of image correction for L1B data on June 2025 for Aqua MODIS band 24. (a) EV imagery before and after correction. (b) Vertical line profile along track direction before and after correction. (c) Uncorrected and (d) corrected brightness temperature distributions for data from one MODIS L1B granule. The vertical profile includes all scans, and therefore all detectors, and it is for frame 624 right in the middle of the granule.
Vicarious calibration is commonly used to assess post-launch sensor performance. In such calibration, EV targets are used to assess long-term sensor performance. Normally, these targets come from sites that provide reliable, homogeneous data over time. Some of these sites include Dome Concordia in Antarctica (cold) and the ocean (warm). Since the crosstalk performance has been proven to be scene and brightness temperature dependent, both scenes are shown to represent both extremes. Figure 9 shows the brightness temperature trending before and after crosstalk correction for the entire MODIS missions for Terra band 30 over Dome Concordia and Aqua band 29 over the ocean. Both bands were selected because these have demonstrated long-term drifts in the past. The trends shown are referenced to band 31, since this band has been proven to be quite stable across the whole mission for both instruments [26,27]. In both cases, the uncorrected data shows large upward drifts that are greatly reduced after the correction is applied. In general, the crosstalk correction application reduces the brightness temperature drift for all MODIS PV LWIR bands, particularly after the safe-mode events. Overall, the correction to the L1B data improves the image quality and radiometric biases otherwise seen prior to the correction.
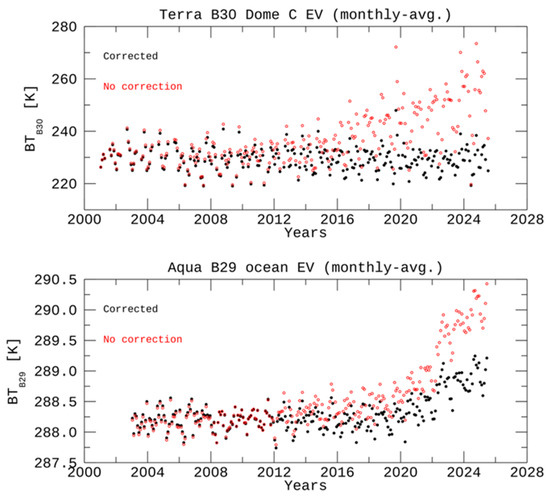
Figure 9.
Brightness temperature trending before and after crosstalk correction for the entire MODIS missions for Terra band 30 (top) over Dome Concordia and Aqua band 29 (bottom) over the ocean. Crosstalk correction greatly reduces long-term brightness temperature drifts for both instruments.
3.2.1. C6.1 Crosstalk Correction Uncertainty Estimation on the MODIS L1B Product
Crosstalk correction impacts the calibrated radiance, , in the L1B product as well as the Uncertainty Index (UI)—which is a measure of the radiance uncertainty at the pixel level [28]. The algorithm for computing the uncertainty in the TEB uses a perturbative approach () by varying all inputs () in the radiance calculation by the value of its associated uncertainty to determine how much the radiance value is altered for each pixel. These terms are then added to estimate the total radiance uncertainty as such:
In general, the individual parameter uncertainties (e.g., a0 and a2 calibration coefficients) are reduced after the crosstalk correction is applied, particularly for the most crosstalk-impacted detectors (e.g., detectors 1, 2, 9, and 10 of Terra band 27, detectors 1, 2, and 3 of Aqua band 27, detector 8 of Terra band 30, and detector 3 of Aqua band 30; all in P.O.). For those detectors, there is significant uncertainty reduction because of the large change in the retrieved radiance after the correction. In such cases, the uncertainty percentages can be drastically lowered (as much as 20%) to a few percent after the safe mode events. For most detectors however, there is marginal change in the UI after the correction.
Collection 6.1 introduced an additional uncertainty penalty for each of the contaminated detectors [16]. The penalty is based on the remaining drift relative to band 31 after correction from the MODIS ocean data long-term series (example seen in Figure 9). It is on the order of 1% at the band average level. The uncertainty penalty for each pixel is defined as
and is added to the total uncertainty in Equation (2). Δdn is the size of the signal correction, dn is the corrected signal after background subtraction, and βi is penalty coefficient of the ith detector. β is found using the MODIS ocean data long-term series in a way that the average penalty assessed within a band matches the remaining band-averaged drift relative to band 31 after correction. The idea is that by making the uncertainty penalty proportional to the size of the corrected signal, Δdn, β can be constant throughout the mission. Thus, as the level of contamination increases, so does the penalty. Overall, the uncertainty penalty introduces an additional uncertainty of 1–2% for most detectors as the missions progress, with some detectors being assessed with a slightly higher penalty for some scenes after the safe-mode events. Early in the mission, the uncertainty penalty is near zero for all detectors in Terra, and exactly zero for all detectors in Aqua, since the crosstalk application started in April 2022 in forward production. Lastly, the uncertainty penalty itself is not used by the users, since it is part of the total uncertainty, which is what is actually given to the users in the L1B product. However, the uncertainty penalty is used, along with the band’s corresponding contaminated and corrected signals, to include the uncertainty associated with the electronic crosstalk correction to the total uncertainty. Afterwards, users can use the total uncertainty at the pixel level to decide whether to use or not use that particular pixel in their analyses.
3.2.2. C7 Crosstalk Correction Uncertainty Estimation on the MODIS L1B Product
C7 introduced a new methodology for the crosstalk correction uncertainty penalty and also extended it to the MWIR detectors [29]. Contrary to the C6.1 algorithm, in which the β value is time-independent and thus there are no crosstalk uncertainty look-up table (LUT) updates, the C7 crosstalk correction uncertainty algorithm is time-dependent. In C7, the β constant effectively becomes Δc, and is updated regularly with every crosstalk LUT update. Δc is calculated as standard deviation of the three-year sliding window residual between the crosstalk correction coefficients trend and its linear fit, and it is receiving- and sending-band-and-detector-dependent. The C7 crosstalk correction uncertainty penalty is defined as
where is the uncorrected dn from all sending detectors and bands and is the corrected dn from any receiving detector and band. Overall, the C7 crosstalk uncertainty penalty values are smaller and better distributed for all PV LWIR bands when compared to those of C6.1, indicating more realistic and accurate crosstalk uncertainty estimates. It also incorporates a crosstalk correction uncertainty estimate for the MWIR detectors that can be as large as 15% for some scenes.
3.3. Impact on Higher-Level Products
Crosstalk contamination trickles down from the earliest stages of MODIS data production all the way to the higher-level data products. Some specific examples include the MODIS L2 cloud (MOD06_L2/MYD06_L2) and cloud mask (MOD35_L2/MYD35_L2) products, since these use data from the PV LWIR bands. As both missions have advanced, crosstalk contamination (which was uncorrected in the L1B and higher products prior to C6.1) has resulted in the detection of false clouds and improper cloud phase retrievals in these products. One way to assess the impact of the crosstalk correction is to compare a set of threshold tests commonly used in the cloud products using both the uncorrected and corrected L1B data. Moreover, a clean band 31 L1B image can be used next to these tests, since this band is free from contamination and can give some indication of where the clouds should be. Alternatively, a true color composite image can also be used to locate the clouds in any given pixel.
The MODIS cloud mask product is used to determine the probability of clear skies for any pixel in a MODIS image. This product uses the L1B calibrated radiance from myriad bands 1–9, 17, 18, 20–22, 26–29, 31–33, and 35. Additionally, several tests were developed to detect different cloud types. Among the many tests, one of them uses the PV LWIR band 29 brightness temperature difference with band 31 to determine the presence of ice clouds over liquid water surfaces. The test relies on the differential absorption between the two channels in the presence of a cloud, which lowers the measured brightness temperature of band 31 with respect to band 29. Essentially, if the brightness temperature difference between bands 29 and 31, B29–B31, is more positive than −0.5 K, then a pixel is registered to have detected ice clouds and vice versa.
Figure 10 and Figure 11 show the results of this threshold test with and without the correction applied for EV scenes from July 2025 and June 2025 for Terra and Aqua, respectively. True color composite and band 31 images are included for comparison. In all monochromatic images, the brightest parts of the image represent the coldest parts of the scene (i.e., ice clouds). Both images illustrate how the results without the crosstalk correction detect much more ice clouds than there actually are when compared to the true color and band 31 images, whereas in the corrected images the amount of false cloud detection is greatly reduced and closely resembles the true color and band 31 images. Other cloud mask tests (e.g., using band 27 over high altitude clouds or by looking at the MODIS cloud phase product, which used bands 28, 29, 31, and 32) yield similar results.
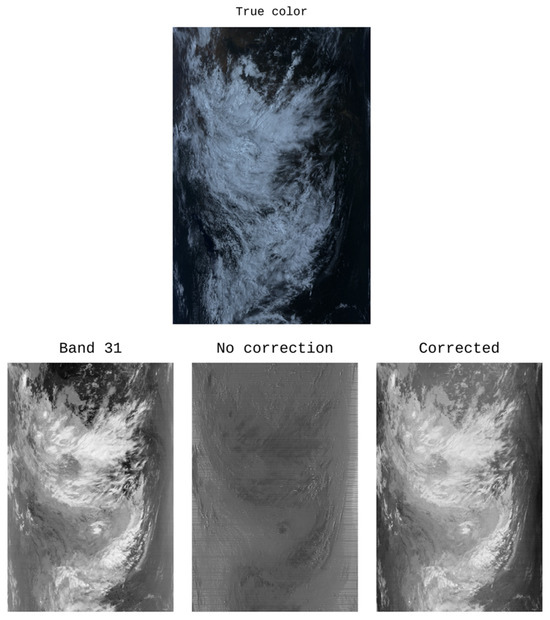
Figure 10.
Terra MODIS true color, band 31, uncorrected cloud mask using band 29 minus band 31, and corrected cloud mask using band 29 minus band 31 imagery from July 2025. Cloud Mask ice cloud test results before crosstalk correction (center) and after crosstalk correction (right). Ice particles are indicated by cold (bright) scenes in all monochromatic imagery. Test falsely detects ice clouds over most of the granule before correction. These are properly detected after correction.
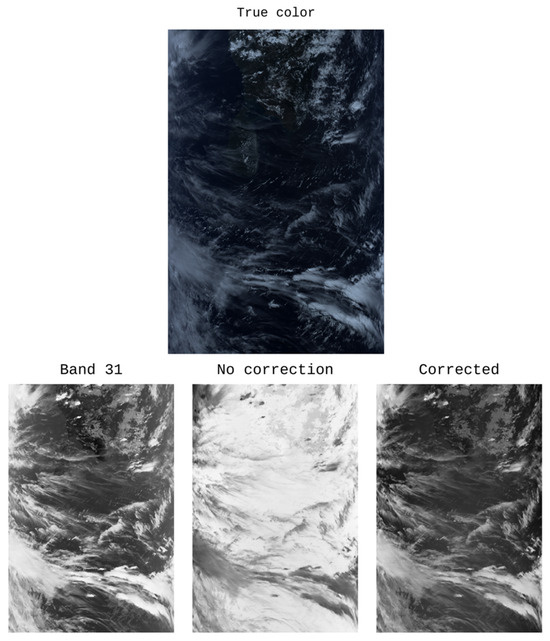
Figure 11.
Aqua MODIS true color, band 31, uncorrected cloud mask using band 29 minus band 31, and corrected cloud mask using band 29 minus band 31 imagery from June 2025. Cloud Mask ice cloud test results before crosstalk correction (center) and after crosstalk correction (right). Ice particles are indicated by cold (bright) scenes in all monochromatic imagery. Test falsely detects ice clouds over most of the granule before correction. These are properly detected after correction.
4. Discussion
Since the electronic crosstalk correction for the MODIS data is derived using a highly bright target (moon) and the peaks of the target image as well as that of the contaminating sending signal are reconstructed using a reference band, there is residual contamination that is not characterized. Additionally, the moon target presents an extreme, since the EV imagery typically seen by the MODIS retrievals does not cover such brightness temperatures. While using the moon has the distinct advantage of easily separating the receiving and contaminated signals, ideally one would characterize the crosstalk using typical EV targets in such a way that the correction coefficients could be scene- and brightness-temperature-dependent. Moreover, the relationship between each contaminating band for a receiving detector remains at nearly the same level over time, even if the absolute magnitude of the coefficients changes throughout the mission. This particular property of the contamination could prove beneficial when deriving the crosstalk coefficients from non-moon sources by imposing a fixed relationship between the sending band coefficients and thus reducing the number of unknown parameters for each contaminated detector to a single coefficient.
Such issues can be attributed to crosstalk nonlinearity. In the MODIS algorithm, its effect is simplified for the sake of application. Otherwise, it would be not only increasingly difficult to derive the coefficients, but to apply them back and produce a corrected L1B product as well. Ultimately, the algorithm does its intended job well enough to allow for the continuation of accurate and reliable MODIS data records for an extra 10 years of mission in Terra and 4 years in Aqua, considering the significant impact both safe mode events had on the missions.
The correction approach can easily be applied to any sensor with similarly aligned channels in any given FPA. In theory, if the spacecraft can look at a bright target (e.g., Moon) through its space or Earth view ports, one could reconstruct the Moon image for any receiving band and detector pair, along with the contamination coming from the sending bands and detectors, find an uncontaminated reference signal from another channel (band 31: PV LWIR or band 21: MWIR, in this case), and compare the measured signal to the reference signal to derive the crosstalk correction coefficients.
The algorithm is simple and robust. It will not need any telemetry to derive the correction coefficients. The user will just need to have knowledge of the location of the Moon within the pertinent Level 1A granule (or granules) and mostly geometric factors related to the Earth–Sun–Moon–satellite distances, lunar phase angle, spacecraft roll angle (if maneuver is executed to see Moon), and oversampling factor to properly establish the Moon coverage at the pixel level.
Validation calibration efforts have been performed over Dome Concordia (cold site) and the Pacific Ocean (warm site) to assess the performance of the PV LWIR bands in C7 (crosstalk corrected). Dome Concordia is compared to the Automatic Weather Station (AWS) on site, while the MODIS-retrieved ocean data is compared to in situ data from a NOAA-owned buoy near the Hawai’i islands. Results over Dome Concordia indicate that the mission-long drift is no larger than −0.7 K for Aqua MODIS bands 27 and 29, and that these are no larger than 0.5 K for band 27 in Terra MODIS. When it comes to band 30, the mission-long performance is exceptional for both MODIS sensors and well within −0.4 K. Results over the Pacific Ocean are less accurate. These show that MODIS band 28 has a downward drift of −1.0 K for both sensors, whereas Aqua MODIS band 27 and Terra MODIS band 29 have −0.7 K and 0.7 K drifts, respectively. Band 30 has a mission-long drift no larger than −0.6 K. For both sites and sensors, MWIR bands 20–23 exhibited drifts no larger than ±0.5 K, while bands 24 and 25 reached up to 1.0 K drifts over the entire mission.
Additionally, the MODIS PV bands have been evaluated via inter-sensor comparisons with the MetOp IASI hyperspectral channels. The study was conducted at different brightness temperature levels (210 K, 230 K, 250 K, and 270 K). Results demonstrated that, even at colder temperatures (i.e., 210 K), the agreement between MODIS and IASI for all the PV bands is within ±0.5 K.
5. Conclusions
The MODIS PV bands have exhibited electronic crosstalk from pre-launch. The crosstalk causes artifacts, such as image striping, ghost land/water boundary features, and radiometric biases. MCST characterized the contamination early in the mission and ultimately developed a robust crosstalk correction algorithm that was implemented during the reprocessing of Terra MODIS C6.1 shortly after the February 2016 safe mode event. Similar correction was later implemented in Aqua MODIS C6.1 in its forward production after the spacecraft and instrument entered into a safe mode state in March 2022. The MODIS C7 reprocessing happened a few years later. The same correction algorithm was used for the PV LWIR bands, while corrections were also introduced to some MWIR detectors.
The algorithm uses lunar observations to effectively characterize and derive correction coefficients for the crosstalk contamination. The correction coefficients are derived for each PV detector (within an FPA) using scheduled lunar observations throughout the MODIS missions. An extra de-striping algorithm is used to adjust the Aqua MODIS PV LWIR bands. The coefficients have increased steadily for the PV LWIR bands, and decreased, albeit at a slower pace, for the MWIR bands. The safe mode events caused significant crosstalk increase in the PV LWIR bands.
When applied to recent MODIS data, the correction coefficients have led to a significant upgrade in the L1B and L2 data via improvements in image quality, reduction in the long-term drifts, and the removal of detector-to-detector differences. This manuscript provides a descriptive record of the electronic crosstalk issue present in the MODIS PV bands as well as the solution used to remove it and will potentially provide future data users and scientists with an insight as to how to improve on the legacy record that the Terra and Aqua MODIS sensors will leave behind after both spacecraft are decommissioned.
Author Contributions
C.L.P.D. was the principal investigator for this work and took the lead role in the data analysis, generating all figures, and organizing and writing the entirety of the manuscript. T.W. contributed to algorithm development. A.W. and T.C. contributed to the overall analysis. T.C. also contributed to algorithm enhancements. X.X. provided support for algorithm development and data analysis at all levels. All authors have read and agreed to the published version of the manuscript.
Funding
This research received no external funding.
Data Availability Statement
The data presented in this study are openly available in LAADS at https://ladsweb.modaps.eosdis.nasa.gov/search/ (accessed on 15 January 2026).
Acknowledgments
The authors would like to thank the dedicated efforts of all former and current members of the MODIS characterization support team that were involved in not only characterizing the crosstalk contamination but developing an algorithm to correct it, and with it improving the Level 1B records and extending the on-orbit stable performance of the MODIS PV LWIR bands. In particular, the authors would like to acknowledge Truman Wilson and Graziela Keller for their contributions regarding algorithm development.
Conflicts of Interest
Authors Carlos L. Perez Diaz, Truman Wilson, Tiejun Chang and Aisheng Wu were employed by the company Science Systems and Applications, Inc. The remaining authors declare that the research was conducted in the absence of any commercial or financial relationships that could be construed as a potential conflict of interest.
References
- Barnes, W.L.; Salomonson, V.V. MODIS: A global image spectroradiometer for the Earth Observing System. Crit. Rev. Opt. Sci. Technol. 1993, CR47, 285–307. [Google Scholar]
- Barnes, W.L.; Salomonson, V.V.; Guenther, B.; Xiong, X. Development, characterization, and performance of the EOS MODIS sensors. In Proceedings of the SPIE—The International Society for Optical Engineering, San Diego, CA, USA, 3–6 August 2003; Volume 5151. pp. 337–345. [Google Scholar]
- Salomonson, V.V.; Barnes, W.L.; Xiong, X.; Kempler, S.; Masuoka, E. An overview of Earth Observing System MODIS instrument and associated data systems performance. In Proceedings of the IEEE International Geoscience and Remote Sensing Symposium, Toronto, ON, Canada, 24–28 June 2002; Volume 2. pp. 1174–1176. [Google Scholar]
- Xiong, X.; Chiang, K.; Wu, A.; Barnes, W.L.; Guenther, B.; Salomonson, V.V. Multiyear on-orbit calibration and performance of Terra MODIS thermal emissive bands. IEEE Trans. Geosci. Remote Sens. 2008, 46, 1790. [Google Scholar] [CrossRef]
- Sun, J.; Xiong, X.; Madhavan, S.; Wenny, B.N. Terra MODIS band 27 electronic crosstalk effect and its removal. IEEE Trans. Geosci. Remote Sens. 2014, 52, 1551–1561. [Google Scholar] [CrossRef]
- Sun, J.; Madhavan, S.; Xiong, X.; Wang, M. Investigation of the electronic crosstalk in Terra MODIS band 28. IEEE Trans. Geosci. Remote Sens. 2015, 8, 5722. [Google Scholar]
- Sun, J.; Madhavan, S.; Xiong, X.; Wang, M. Long-term drift induced by the electronic crosstalk in Terra MODIS band 29. J. Geophys. Res.-Atmos. 2015, 120, 9944–9954. [Google Scholar] [CrossRef]
- Sun, J.; Madhavan, S.; Wang, M. Investigation and mitigation of the crosstalk effect in Terra MODIS band 30. Remote Sens. 2016, 8, 249. [Google Scholar] [CrossRef]
- Wilson, T.; Wu, A.; Geng, X.; Wang, Z.; Xiong, X. Analysis of the electronic crosstalk effect in Terra MODIS long-wave infrared photovoltaic bands using lunar images. In Proceedings of the Image and Signal Processing for Remote Sensing XXII, Edinburgh, UK, 26–29 September 2016. Volume 10004. [Google Scholar]
- Gascon, F.; Thèpaut, O.; Jung, M.; Francesconi, B.; Louis, J.; Lonjou, V.; Lafrance, B.; Massera, S.; Gaudel-Vacaresse, A.; Languille, F.; et al. Copernicus Sentinel-2 Calibration and Products Validation Status. Remote Sens. 2017, 9, 584. [Google Scholar] [CrossRef]
- Szewczyk, Z.A. Recovery and Comparison of Shortwave Radiances Measured by CERES Instruments Operating on TRRM and Terra Satellites. In Proceedings of the Remote Sensing of Clouds and the Atmosphere VII, Crete, Greece, 23–27 September 2002. Volume 4882. [Google Scholar]
- Miller-Ricci, E.; Rowe, J.F.; Sasselov, D.; Matthews, J.M.; Guenther, D.B.; Kuschnig, R.; Moffat, A.F.J.; Rucinski, S.M.; Walker, G.A.H.; Weiss, W.W.; et al. MOST Spacebased Photometry of the Transiting Exoplanet System HD 209458: Transit Timing to Search for Additional Planets. Astrophys. J. 2008, 682, 586–592. [Google Scholar] [CrossRef]
- Sun, J.; Wang, M. Crosstalk Effect in SNPP VIIRS. Remote Sens. 2017, 9, 344. [Google Scholar] [CrossRef]
- Keller, G.R.; Wang, Z.; Wu, A.; Xiong, X. Aqua MODIS Band 24 Crosstalk Striping. IEEE Geosci. Remote Sens. Lett. 2017, 14, 475–479. [Google Scholar] [CrossRef]
- Sun, J.; Wang, M. Electronic Crosstalk in Aqua MODIS Long-Wave Infrared Photovoltaic Bands. Remote Sens. 2016, 8, 806. [Google Scholar] [CrossRef]
- Keller, G.R.; Wilson, T.; Geng, X.; Wu, A.; Wang, Z.; Xiong, X. Aqua MODIS Electronic Crosstalk Survey: Mid-Wave Infrared Bands. IEEE Trans. Geosci. Remote Sens. 2019, 57, 1684–1697. [Google Scholar] [CrossRef]
- Wilson, T.; Wu, A.; Shrestha, A.; Geng, X.; Wang, Z.; Moeller, C.; Frey, R.; Xiong, X. Development and Implementation of an Electronic Crosstalk Correction for Bands 27–30 in Terra MODIS Collection 6. Remote Sens. 2017, 9, 569. [Google Scholar] [CrossRef]
- Wilson, T.; Xiong, X. Electronic crosstalk characterization and correction for MODIS bands 1 and 2 using lunar observations. In Proceedings of the SPIE 11127, Earth Observing Systems XXIV, San Diego, CA, USA, 11–15 August 2019. Volume 111271X. [Google Scholar] [CrossRef]
- Sun, J.; Xiong, X.; Che, N.; Angal, A. Terra MODIS band 2 electronic crosstalk: Cause, impact, and mitigation. In Proceedings of the Sensors, Systems, and Next-Generation Satellites XIV, Toulouse, France, 20–23 September 2010. Volume 78261Y. [Google Scholar]
- Perez Diaz, C.; Lin, H.; Chang, T.; Wu, A.; Xiong, X. An Update to the Calibration Algorithm of the MODIS PV LWIR Bands for Collection 7 to Improve Long-term Records. In Proceedings of the SPIE 13267, Earth Observing Missions and Sensors: Development, Implementation, and Characterization VI, Kaohsiung, Taiwan, 2–6 December 2024. Volume 132670Y. [Google Scholar] [CrossRef]
- Angal, A.; Xiong, X.; Twedt, K.; Chang, T.; Geng, X.; Aldoretta, E.; Perez Diaz, C. Status of the Terra and Aqua MODIS Collection 7 L1B. In Proceedings of the IGARSS 2023—2023 IEEE International Geoscience and Remote Sensing Symposium, Pasadena, CA, USA, 16–21 July 2023; pp. 4466–4469. [Google Scholar] [CrossRef]
- Angal, A.; Xiong, X.; Chang, T.; Twedt, K.; Geng, X.; Wu, A.; Aldoretta, E. Terra and Aqua MODIS collection 7 level 1B algorithm. J. Appl. Remote Sens. 2022, 16, 037502. [Google Scholar] [CrossRef]
- Chang, T.; Shrestha, A.; Diaz, P.; Chen, N.; Wu, A.; Wilson, T.; Li, Y.; Xiong, X. MODIS thermal emissive bands calibration improvements for Collection 7. In Proceedings of the SPIE 11858, Sensors, Systems, and Next-Generation Satellites XXV, Online Only, 13–18 September 2021. Volume 118580R. [Google Scholar]
- Sun, J.; Xiong, X.; Barnes, W.; Guenther, B. MODIS reflective solar bands on-orbit lunar calibration. IEEE Trans. Geosci. Remote Sens. 2007, 45, 2383. [Google Scholar] [CrossRef]
- Perez Diaz, C.; Chang, T.; Lin, H.; Wu, A.; Sarid, G.; Xiong, X. An update on the MODIS thermal emissive bands on-orbit performance. In Proceedings of the SPIE 12685, Earth Observing Systems XXVIII, San Diego, CA, USA, 20–25 August 2023. Volume 126850P. [Google Scholar] [CrossRef]
- Chang, T.; Lin, H.; Perez Diaz, C.; Xiong, X. Aqua MODIS TEB crosstalk correction improvement and image quality enhancement. In Proceedings of the SPIE 12685, Earth Observing Systems XXVIII, San Diego, CA, USA, 20–25 August 2023. Volume 126851E. [Google Scholar] [CrossRef]
- Chang, T.; Xiong, X.; Perez Diaz, C.; Wu, A.; Lin, H. Assessment of Radiometric Calibration Consistency of Thermal Emissive Bands Between Terra and Aqua Moderate-Resolution Imaging Spectroradiometers. Remote Sens. 2025, 17, 182. [Google Scholar] [CrossRef]
- Xiong, X.; Angal, A.; Barnes, W.L.; Chen, H.; Chiang, V.; Geng, X.; Li, Y.; Twedt, K.; Wang, Z.; Wilson, T.; et al. Updates of Moderate Resolution Imaging Spectroradiometer on-orbit calibration uncertainty assessments. J. Appl. Remote Sens. 2018, 12, 034001. [Google Scholar] [CrossRef]
- Chang, T.; Shrestha, A.; Perez Diaz, C.; Wilson, T.; Wu, A.; Xiong, X. MODIS TEB electronic crosstalk correction update and impact on L1B product uncertainty. In Proceedings of the SPIE 12264, Sensors, Systems, and Next-Generation Satellites XXVI, Berlin, Germany, 5–8 September 2022. Volume 122640I. [Google Scholar]


Disclaimer/Publisher’s Note: The statements, opinions and data contained in all publications are solely those of the individual author(s) and contributor(s) and not of MDPI and/or the editor(s). MDPI and/or the editor(s) disclaim responsibility for any injury to people or property resulting from any ideas, methods, instructions or products referred to in the content. |
© 2026 by the authors. Licensee MDPI, Basel, Switzerland. This article is an open access article distributed under the terms and conditions of the Creative Commons Attribution (CC BY) license.