Highlights
What are the main findings?
- A novel two-dimensional CFAR detector is proposed by rigorously integrating dual-observation (HH/VV) channel echoes using Copula theory.
- Statistical modeling and a correlation analysis of sea clutter amplitudes in HH and VV channels are validated under identical observational conditions.
What are the implications of the main findings?
- The proposed method achieves adaptive false alarm control and significantly improves the detection performance over conventional one-dimensional CFAR detectors.
- The derived joint probability density function via Copula theory provides a rigorous mathematical foundation for extending CFAR detection from one-dimensional to two-dimensional statistics.
Abstract
The target detection method based on a constant false alarm rate (CFAR) and feature space is commonly used in remote sensing for detecting maritime targets within sea clutter. However, the performance of traditional CFAR techniques heavily relies on the signal-to-clutter ratio (SCR) in a single observational channel, while feature space methods are overly sensitive to the number of pulse accumulations and rigidly apply outlier classifiers to define detection regions, without theoretical derivation. To address these limitations, this paper proposes a two-dimensional (2D) CFAR target detection method based on echo data from dual-polarization observational channels. First, statistical models of the amplitude distribution for horizontal–horizontal (HH) and vertical–vertical (VV) polarization sea clutter radar echoes are validated under identical observation conditions using measured data, and their correlations are analyzed. Then, the Copula function is introduced as a theoretical foundation to rigorously derive and extend the cell-averaging CFAR detector through strict mathematical formulations, transitioning from single statistics to 2D detection statistics. This leads to the proposed target detection method. Testing with measured data from publicly available datasets demonstrates that the proposed method effectively achieves adaptive false alarm control and significantly improves the detection performance compared to existing single-pulse one-dimensional CFAR detection methods.
1. Introduction
Achieving the fast and effective radar detection of small targets, such as boats and divers, in the presence of sea clutter remains a key focus of aerospace radar research [1,2,3,4,5]. Early automatic detection technologies for maritime targets primarily rely on fixed thresholding [6,7,8,9], where a fixed threshold value is determined based on the known distribution characteristics of background clutter and a preset false alarm probability (Pfa). This method is straightforward and computationally efficient. However, due to the unknown and unstable distribution of sea clutter in real-world scenarios, fixed-threshold detection is prone to high false alarm rates. To maintain a constant false alarm probability during detection, CFAR radar technology, which dynamically adjusts the detection threshold according to the power intensity of background clutter, has quickly become the dominant approach [10,11,12]. Depending on factors such as the computational methods, processing dimensions, and clutter environment, CFAR technology has evolved into various approaches, including mean-level (ML) CFAR [13], order statistics (OS) CFAR [14], generalized ordered statistics (GOS) CFAR [15], and adaptive CFAR [16]. While CFAR detection offers robust real-time capabilities, it often relies heavily on the SCR of a single observational channel, leading to suboptimal performance in complex environments.
To improve the SCR in radar observational channels, multiple pulse groups are often utilized for either incoherent or coherent accumulation. The incoherent approach is simple in computation and easy to implement, whereas the coherent method, by preserving consistent phase information, delivers superior performance. However, irrespective of the accumulation method, the detection performance is heavily influenced by the number of pulses involved, making it difficult to achieve rapid, real-time responses in target detection tasks. Furthermore, after pulse accumulation, the resulting detection statistics often deviate from the preset distribution characteristics assumed by the adaptive detector, thereby impeding performance enhancement.
Detection methods rooted in feature analysis often delineate specific statistical data gleaned from radar returns, whether through intuitive insight or empirical evidence, thereby establishing a discernment threshold that distinguishes between intended targets and oceanic backscatter, effectively surmounting the constraints imposed by the SCR [17,18,19]. Common methods include using single-feature detection statistics and CFAR techniques for target detection [20,21,22,23,24], as well as selecting multiple features empirically to construct a multi-dimensional feature space and training specific classifiers to complete target detection. The advantage of these methods is that they can enhance the SCR while emphasizing distinctive characteristics of targets and clutter. However, feature extraction from radar echo signals also involves accumulating and computing multiple radar echo groups, requiring a substantial amount of feature samples, which is inevitably constrained by the observation duration. On the other hand, feature detection methods often lack rigorous theoretical validation for adaptive threshold derivation. Instead, they tend to rigidly apply pre-existing CFAR-type detection techniques or regional classifiers, raising concerns about their adaptability and theoretical soundness [25,26].
In this context, this paper proposes a 2D-CFAR target detection method in sea clutter, leveraging dual-observation-channel data. The method employs a Copula function to model the dependence structure between radar echo data from two polarization channels, HH and VV, and rigorously derives the adaptive detection theory within the corresponding 2D data space. This approach effectively mitigates the negative impact of the high pulse accumulation requirements and the low SCR associated with a single observational channel. Experimental validation using measured data from the publicly available Sea-Detecting Radar Data-Sharing Program (SDRDSP) dataset [27,28] demonstrates that the proposed method outperforms traditional one-dimensional CFAR methods based on single-observation channels in terms of false alarm suppression and detection performance.
The remainder of this paper is organized as follows. Section 2 provides an overview of the dual-polarization radar dataset utilized in this study, along with an analysis of the amplitude characteristics and correlation of radar echoes in the HH and VV observational channels, which form the foundation for the proposed model. Section 3 introduces Copula theory and presents the theoretical derivation of the 2D-CFAR detector for random variables in the 2D data space. Section 4 evaluates the false alarm control capabilities and target detection performance of the proposed detection method in comparison with existing single-pulse one-dimensional CFAR detection methods using both simulated and measured data. Finally, the conclusions of this study are presented in Section 5.
2. Analysis of Characteristics of Dual-Polarization Observational Channel Echo Data
2.1. Analysis of Amplitude Characteristics
The characteristics of radar echoes of sea clutter under different polarization modes may differ. Specifically, the amplitude distribution characteristics and the correlations between signals in different polarization observational channels have a significant impact on the performance of CFAR detection methods. In this subsection, the amplitude distribution characteristics and the correlations between different observational channels are analyzed using the measured sea clutter data.
First, the magnitude of the single-pulse observation data from the HH and VV polarization observational channels under sea state 2 is fitted to different distribution models, as shown in Figure 1.
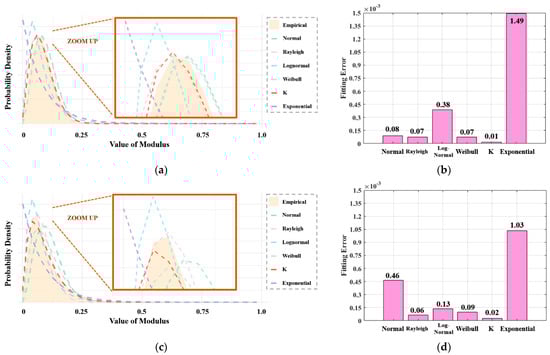
Figure 1.
The magnitude of single-pulse observation data from the HH and VV polarization observational channels under sea state 2: (a) the probability density function (PDF) of the HH observational channel; (b) the mean square error of the HH observational channel; (c) the PDF of the VV observational channel; (d) the mean square error of the VV observational channel.
It is observed that, due to the improved radar resolution, the sea clutter is best fitted by the K distribution for both the HH and VV polarization echo data. Meanwhile, the Rayleigh distribution is still identified as a model with relatively small fitting errors.
Subsequently, under sea state 2 conditions, the single-pulse square-law detection for the HH and VV polarization observational channels is fitted to different distribution models, as shown in Figure 2. Although the magnitude of echo data conforms more closely to the K distribution compared to the Rayleigh distribution, the fitting performance of its square-law detection still tends to favor the exponential distribution. This is because, when low-value data undergo squaring, the probability of low-value regions is further accumulated in the new distribution type. This explains why modern radar technology, even with advancements towards high resolutions, can still utilize CFAR techniques for target detection.
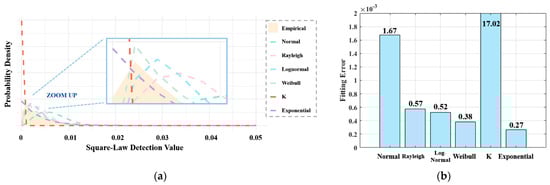
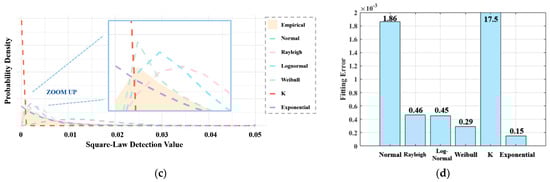
Figure 2.
The square-law detection results of single-pulse observation data from the HH and VV polarization observational channels under sea state 2: (a) the PDF of the HH observational channel; (b) the mean square error of the HH observational channel; (c) the PDF of the VV channel; (d) the mean square error of the VV observational channel.
By analyzing the two figures, a preliminary conclusion can be drawn: the different polarization observational channels have no significant impact on the amplitude distribution characteristics of sea clutter data and do not alter the best-fit distribution model.
Simultaneously, a model fitting test is conducted for the single-pulse square-law detection data of the two polarization types under sea state 5, as shown in Figure 3. It can be observed that, as the sea state intensifies, the probability density range of the amplitude distribution broadens, and the proportion of high-value regions increases. However, the best-fit model remains the exponential distribution, with a further improvement in fitting accuracy. Due to this, in high-sea-state scenarios, the square-law detection of sea clutter still satisfies the assumption of traditional CFAR target detection techniques, namely conformity to the exponential distribution.
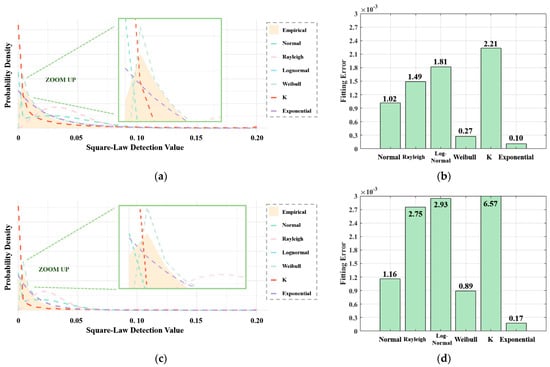
Figure 3.
The square-law detection results of single-pulse observation data from the HH and VV polarization observational channels under sea state 5: (a) the PDF of the HH observational channel; (b) the mean square error of the HH observational channel; (c) the PDF of the VV channel; (d) the mean square error of the VV observational channel.
2.2. Inter-Channel Correlation Analysis of Observations
Next, the correlation between the echo data from the two polarization observational channels is analyzed. Synchronously collected dual-polarization sea clutter measurement data are used to calculate the correlation. During this process, a sliding step size of 500 pulses is preset, and the Pearson correlation coefficient is calculated once every 1000 pulses. The probability distribution of the coefficients is then statistically analyzed, as shown in Figure 4. By treating the echo data from the two observational channels as random variables, it is evident that they exhibit a certain level of correlation. This correlation exhibits a quasi-normal distribution symmetrically centered around the origin. As the sea state intensifies, the variance gradually increases, indicating a higher probability of strong correlation. Additionally, the absolute value of the Pearson correlation coefficient is mostly constrained within 0.25, which aligns with the range requirements for the correlation parameter θ proposed in the detection method described below.
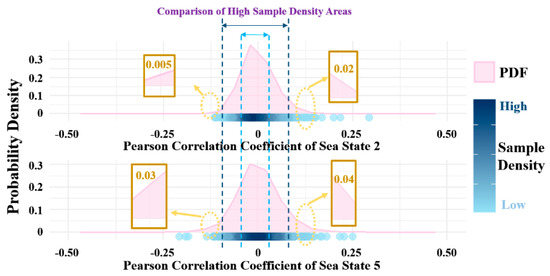
Figure 4.
Comparison of Pearson correlation coefficient PDFs under different sea states.
In CFAR operations, it is common to sum the detection statistics of reference cells (RCs) to estimate the total clutter power level. Therefore, it is necessary to analyze how the summation of multiple identically distributed variables affects the correlation. According to the central limit theorem, when variables following any distribution type are independently and identically summed multiple times, they gradually conform to a normal distribution. As shown in Figure 5, the process of summing statistics at RCs can be roughly interpreted as a reduction in the variance of the PDF of the correlation coefficient. Ultimately, with continued summation, the correlation coefficient approaches 0, resulting in a state wherein the variables become independent.
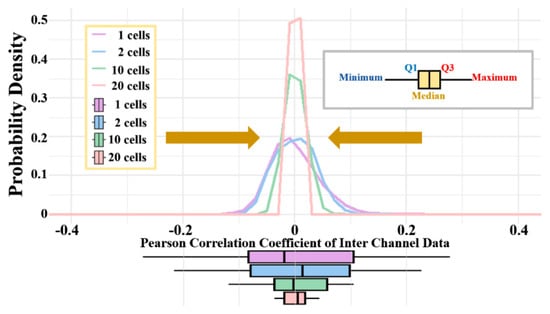
Figure 5.
Trend of correlation changes with the number of summed RCs.
3. A 2D-CFAR Target Detection Method Based on Copula Theory
3.1. Binary Description of Sea Surface Small Target Detection
The radar target detection problem in sea clutter can be formulated as the following binary hypothesis testing problem [29], shown in (1):
Here, N represents the length of the received complex time series, and K is the number of RCs. and are the radar echo time series received at the cell under test (CUT) and the RCs, respectively. and represent the mixed time series of sea clutter and noise at the CUT and RCs. is the target echo signal. The null hypothesis H0 and the alternative hypothesis H1 correspond to the presence of only sea clutter or the presence of both sea clutter and a target at the CUT, respectively.
3.2. Copula Theory
When considering the classical one-dimensional CFAR theory, it is first necessary to explicitly express the PDF of sea clutter. For one-dimensional variables, this can be directly modeled. However, as the dimension extends from one to two or even higher, explicit expressions for the PDF are often unavailable, making it impossible for the false alarm probability to be directly derived. In this section, Copula theory is introduced to establish connections between multiple identical or different random variables, allowing explicit expressions for 2D PDFs to be constructed. Consequently, the subsequent derivation of false alarm probabilities is made possible.
According to Sklar’s theorem [30], let be the joint distribution function of the random vectors X and Y, with marginal distribution functions and , respectively. Then, there exists a Copula , , such that, for any ,
Alternatively, Copula can be interpreted as a joint distribution function where the marginal distributions are uniform, , .
Commonly used Copula functions focus on correlations in different tail dependencies. In this study, the FGM Copula is chosen as the Copula function to connect the data from the two observational channels, as it has a simple form while effectively accounting for both upper and lower tail dependencies. Its expression is given in (3):
Here, represents the correlation parameter.
By taking the partial derivatives of (3) with respect to and , (4) and (5) are obtained:
Here, represents the partial derivative operation.
Further, the Copula density function can be calculated as shown in (6):
The PDFs of the Gumbel, Clayton, and FGM Copula functions [31,32] are calculated and shown in Figure 6. It can be observed that the Gumbel and Clayton Copulas focus on upper tail and lower tail dependencies, respectively, emphasizing high-value and low-value regions, which helps to capture correlations in their respective focus areas. However, they cannot simultaneously account for both upper and lower tail correlations. For the square-law detection of exponentially distributed data, the samples are concentrated in the low-value region while exhibiting a long tail in the high-value region. Therefore, using the FGM Copula to capture correlations in both regions is necessary.
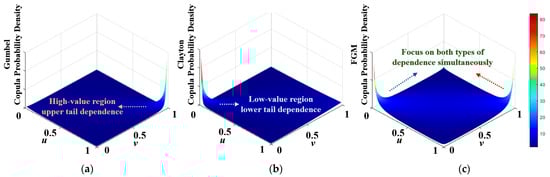
Figure 6.
Comparison of Copula PDFs focusing on different correlations: (a) Gumbel Copula; (b) Clayton Copula; (c) FGM Copula.
Using the Copula density function in (2), the joint PDF of the two random variables can be obtained [30], as shown in (7):
Here, and are abbreviations for and , which represent a single observation of the echo data from the two polarization observational channels. and denote their respective marginal probability density functions.
The measured data from the dual-observation channels are analyzed statistically, generating a 2D empirical PDF. The corresponding joint PDF is then calculated using the FGM Copula, as shown in Figure 7. Through comparison, it is observed that both exhibit the same variation trends and amplitude ranges. The explicit expression of the joint PDF derived using Copula theory is shown to effectively and accurately describe the actual 2D distribution.
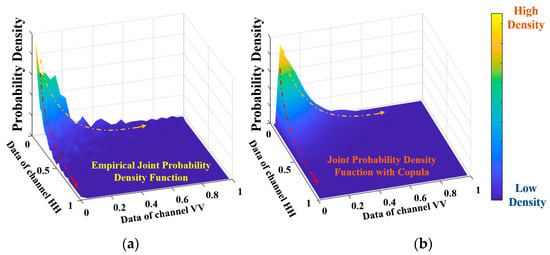
Figure 7.
Comparison of joint PDFs: (a) 2D empirical PDF; (b) explicit joint PDF based on FGM Copula.
3.3. Mathematical Derivation of 2D-CFAR Detection
First, it is necessary to extend adaptive decision detection from one-dimensional variables to 2D variables. For the classical cell average constant false alarm rate (CA-CFAR) detection method, the corresponding decision criterion is given in (8):
Here, is the value of the single-pulse square-law detection at the CUT, which serves as the detection statistic. is the scaling factor, and is the clutter intensity estimate obtained from the RCs. The derivation of the one-dimensional CFAR algorithm involves determining the dynamic value of the scaling factor . For CA-CFAR, the scaling factor is , as shown in Figure 8. Here, and represent the probability of false alarms and the number of one-sided RCs, respectively.
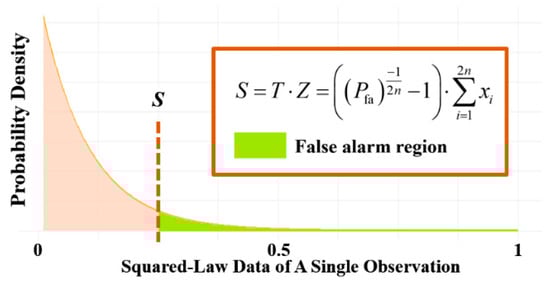
Figure 8.
False alarm region of one-dimensional CFAR.
As the distribution extends from one dimension to two dimensions, the false alarm decision region transitions from a one-dimensional linear proportion to a two-dimensional area proportion. Its form can take various approaches, as shown in Figure 9. For instance, high-value regions can be delineated based on contour lines or by defining high-value regions for two variables separately. This is essentially a trade-off in decision criteria, with neither method having inherent logical superiority. Considering the influence of factors such as the magnitude and correlation between 2D random variables, the latter approach demonstrates better performance. Therefore, in this study, thresholds are set for the random variables of the two observational channels separately, and the intersection of their false alarm regions is used as the decision criterion. The corresponding 2D-CFAR adaptive decision rules are provided in (9) and (10):
Here, and represent the detection statistics of the two polarization channels, and are the scaling factors, and and are the clutter intensity estimates. and denote the alternative hypotheses derived from the scaling factors and intensity estimates of the observational channels, while and represent the null hypotheses. A sample is determined to satisfy the hypothesis only if both and are simultaneously true; otherwise, the sample is classified under the hypothesis.
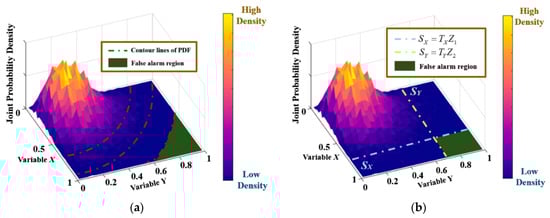
Figure 9.
False alarm region of 2D-CFAR: (a) delineated based on contour lines; (b) delineated by defining high-value regions for two variables separately.
As validated by the measured data in Section 2.1, after square-law detection, each single-pulse observation sample of the clutter follows an exponential distribution. The corresponding PDFs are given in (11) and (12):
Here, and are the scale parameters of the distribution models for the data from the two observational channels.
The focus now shifts to considering the influence of the clutter background. Under the assumption of a uniform clutter background, the samples in the RC are independent and identically distributed (IID). Since and are two random variables, statistical averaging over and is required, allowing the false alarm probability to be expressed, as shown in (13):
The background clutter power level is a maximum likelihood estimate of the clutter power level under the assumption that the RC samples follow an exponential distribution. For ease of computation, the scaling factor is typically included in the nominal factor. and are the estimates of the total clutter power levels for the two observational channels, calculated using the RC samples and , respectively. Their calculations are given in (14):
The exponential distribution is a special case of the Gamma distribution under specific conditions . The PDF of the Gamma distribution is given in (15):
Here, and are two parameters. is the Gamma function. A random variable that follows a Gamma distribution is denoted as . Since the exponential distribution is a special case of the Gamma distribution when , based on the IID assumption and , , it follows that and .
As validated by the measured data in Section 2.2, the correlation between and gradually weakens to independence as they are summed, which can be expressed as in (16):
Equation (17) is simultaneously obtained:
Equation (13) can be further transformed into (18). Furthermore, based on , the above equation is further simplified into (19):
It can be observed that is independent of the distribution parameters and , so its normalization factor does not change with the distributions of and . Therefore, can be assumed, thus simplifying the above equation into (20):
(1) When , is obtained, and, further, . This shares the same structural expression as the one-dimensional classical CA-CFAR, which verifies its correctness.
(2) When , the corresponding -value table can also be solved with (20). In particular, .
Finally, it is necessary to complete the derivation of the relationship between the correlation parameter and the Pearson correlation coefficient to enable the explicit calculation of the normalization factor . By substituting the expression of into the numerator of the Pearson correlation coefficient formula (21), as shown in (22), the expression can be simplified to obtain (23):
Meanwhile, the simplification (24) can also be made. Further, due to the derivation of (25), conclusions (26), and (27) are obtained.
At this stage, the explicit derivation of the nominal factor for 2D-CFAR detection is completed, thereby establishing the design of the 2D-CFAR detector. The methodological process is illustrated in Figure 10.
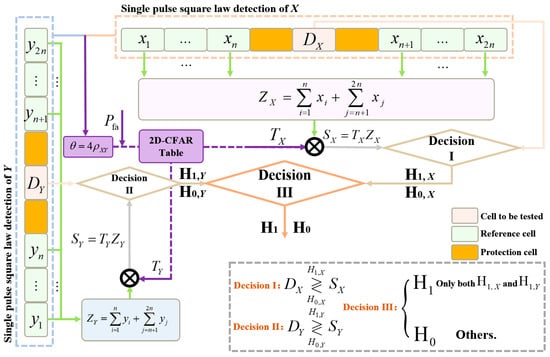
Figure 10.
The 2D-CFAR method with Copula theory.
4. Experimental Results and Performance Comparison
To validate the false alarm control effectiveness and target detection performance of the proposed detection method, this section presents false alarm control tests using simulated data. Furthermore, the proposed method is tested against comparative methods, including single-pulse one-dimensional CFAR and feature-based detectors relying on the relative average amplitude (RAA), using the public dataset introduced in Section 2.
In the simulation tests, the spherically invariant random process (SIRP) [33] is used to generate complex time series of length 106, following the K distribution, for the two observational channels. The simulation of the K distribution model involves configuring the shape parameter and scale parameter of the distribution. These parameters are estimated from measured data and subsequently applied to the simulation model for synthetic data generation. The data from the two observational channels maintain a certain degree of linear correlation and are processed through square-law detection to serve as detection statistics.
In the real-world scenario tests, each dataset from the SDRDSP sea clutter dataset consists of complex time series of length 217, sampled over 950 or 1000 adjacent range cells (depending on the two acquisition modes), corresponding to approximately 65 s of time.
It is worth emphasizing that the tests of the proposed method and comparative methods (except for the RAA detector) are performed on single-pulse echo samples, meaning that single-pulse square-law detection is used without any non-coherent or coherent integration.
4.1. False Alarm Control Experiment
In this subsection, the performance of the proposed method is tested using both simulated and measured sea clutter data. Several classical CFAR target detection methods are established for performance comparison, including CA-CFAR [13], the RAA detector [18], the ordered statistic constant false alarm rate (OS-CFAR) [14], and the adaptive normalized matched filter (ANMF) [16]. To ensure consistent conditions for the comparative experiments and eliminate the influence of the number of observational channels on the detectors, the decision rules of the classical one-dimensional CFAR detection methods are adjusted: if any observational channel data satisfy the alternative hypothesis, the decision is classified as the alternative hypothesis H1; otherwise, it is classified as the null hypothesis H0. All CFAR methods use 32 RCs.
Under the preset conditions of a false alarm probability of 10−4 and simulated sea clutter data, the number of false alarm samples detected by each CFAR method is statistically analyzed and presented in Figure 11. The theoretical value for the number of false alarm samples is 100. It can be observed that, while all CFAR detectors can control the number of false alarm samples to the same order of magnitude as the theoretical value, the proposed 2D-CFAR detector demonstrates superior stability in false alarm control, maintaining the false alarm probability within the desired range. Under the same simulation conditions, all single-pulse-based detectors tend to exhibit higher false alarm rates. In contrast, the RAA detector, which effectively utilizes multi-pulse accumulation as a feature detector, demonstrates superior false alarm suppression performance.
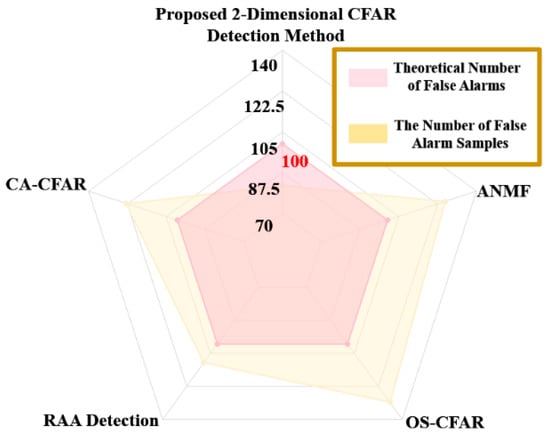
Figure 11.
False alarm comparison with simulated data.
Using measured sea clutter data, the number of false alarm samples for each target detection method is calculated under practical application scenarios. The false alarm probabilities are preset to 10−3 and 10−4, resulting in theoretical false alarm counts of 113 and 13, respectively. Due to space constraints, only the comparison between the proposed method and the traditional one-dimensional CA-CFAR is presented in Figure 12.
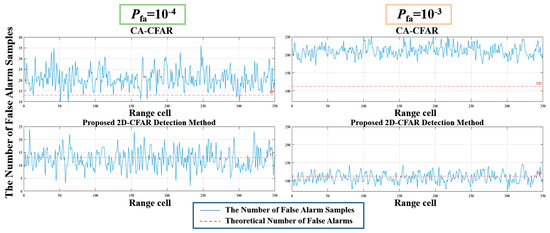
Figure 12.
Comparison of false alarm sample counts obtained from measured data.
Under practical scenarios, due to the heavy tails of the high-value regions, the false alarm counts of various detectors deviate from their theoretical values. When a lower false alarm probability, such as 10−4, is used to calculate the detection threshold, the theoretical false alarm count is very low. Consequently, the measured false alarm samples for each detector are more tightly constrained around the theoretical value. However, the average false alarm count of CA-CFAR across all range cells still exceeds the theoretical value by more than a factor of two, reaching approximately 25. In contrast, the proposed two-dimensional CFAR detector maintains false alarm counts close to the theoretical value.
When the preset Pfa increases to 10−3, the difference becomes more pronounced as the theoretical false alarm count increases in magnitude. The traditional CA-CFAR detector stabilizes at approximately twice the theoretical value, whereas the proposed method continues to control the false alarm count below the theoretical value. The measured false alarm sample counts under two false alarm probability conditions are statistically presented as empirical PDFs in Figure 13.
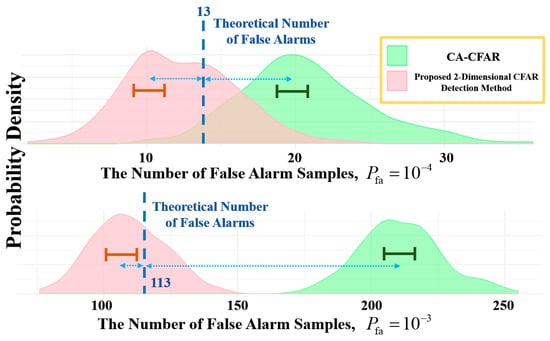
Figure 13.
PDF Comparison of False Alarm Numbers in Measured Data.
Further comparison reveals that the overlapping regions of the PDFs for the two detection methods become more separable as the preset false alarm probability increases. Although the variance of the proposed algorithm’s PDF increases slightly, it remains centered around the theoretical false alarm count. In contrast, the PDF of the CA-CFAR method significantly deviates from the theoretical value. Additionally, the distance between the peak of the PDFs and the theoretical false alarm value further increases for both methods. This comparative analysis highlights the stability and effectiveness of the proposed algorithm in suppressing sea clutter under practical application scenarios.
4.2. Comparison of Target Detection Performance
Compared to other publicly available radar datasets for maritime target detection, the SDRDSP dataset covers multiple sea state conditions and provides more pure sea clutter cells for reference. In this subsection, the performance of the proposed method is tested and analyzed using measured data under different sea state conditions. As described in Section 2.1, the target is located at the 454th range cell. Under sea state 2, the SCRs for the HH and VV receiving channels are 25 dB and 9 dB, respectively, while, under sea state 5, they are 7 dB and −2 dB, respectively.
To visually compare the detection performance of each method, binary detection maps for one set of measured data under sea state 2 and 5 conditions, including sea clutter and targets, are presented in Figure 14. The yellow samples and the red box represent the samples exceeding the threshold and the designated target area, respectively. Note that the RAA detector is not included, as its feature samples are significantly fewer than those of single-pulse detectors, to avoid potential misinterpretation. Additionally, the target detection results for all range cells under four sea state conditions are statistically summarized in Figure 15. Furthermore, with the Pfa preset to four levels, the receiver operating characteristic (ROC) curves for various CFAR detection methods are statistically derived and shown in Figure 16.
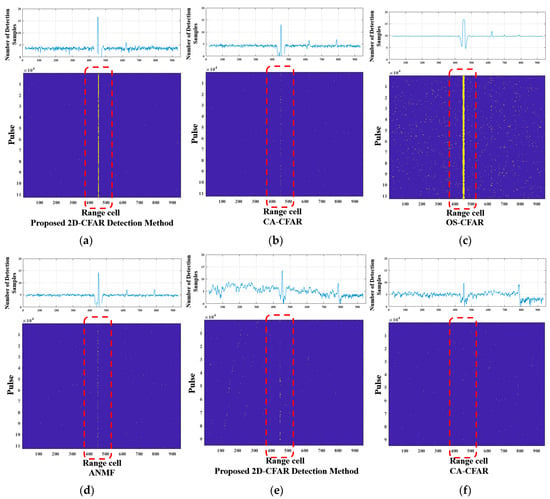
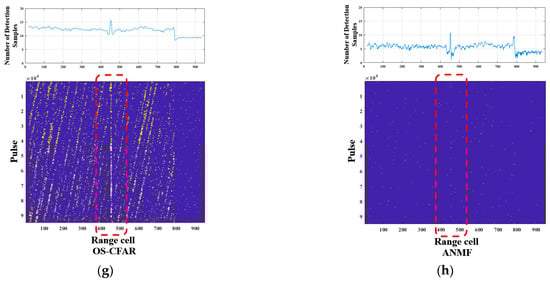
Figure 14.
Binary detection maps: (a) 2D-CFAR detection method in sea state 2; (b) CA-CFAR in sea state 2; (c) OS-CFAR in sea state 2; (d) ANMF in sea state 2; (e) 2D-CFAR detection method in sea state 5; (f) CA-CFAR in sea state 5; (g) OS-CFAR in sea state 5; (h) ANMF in sea state 5.
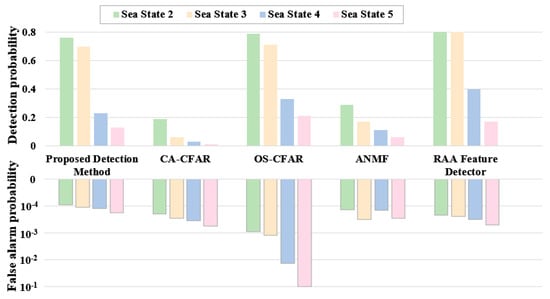
Figure 15.
Comparison of detectors under different sea states.
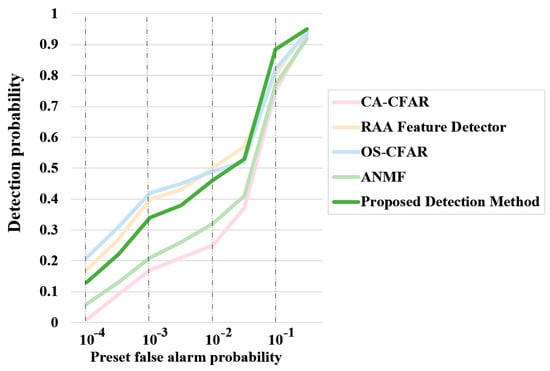
Figure 16.
ROC Curve of Detection Probability versus Preset False Alarm Probability.
To facilitate comparative visualization, Figure 14 also presents the number of detection samples for each distance cell and displays them above the binary detection maps after taking the logarithm. Under sea state 2, the proposed 2D-CFAR detection method exhibits a clearly visible detection streak, enabling relatively stable target detection. The OS-CFAR detector has virtually no missed detections at the target’s range cell. However, due to energy leakage from the target, alternative hypothesis decisions are also made at adjacent range cells, resulting in a broader detection streak. This may be attributed to the fact that the median of square-law detection pulse samples, which follow an exponential distribution, is lower than their mean, leading to a reduced detection threshold. Evidence for this can be observed in the false alarms present in many sea clutter cells, which are more noticeable compared to other detection methods, consistent with its false alarm performance in the simulation tests.
The ANMF detection method demonstrates better detection performance compared to CA-CFAR, but the detection streaks for both are visibly sparser, indicating a performance gap compared to the other two methods.
Under sea state 5, the proposed method’s detection streak shows noticeable interruptions and is accompanied by false alarms. Due to the aforementioned factors, OS-CFAR exhibits relatively continuous detection streaks but suffers from a severe increase in false alarms, rendering its detections unreliable. Under these conditions, the detection streaks of CA-CFAR and ANMF nearly vanish, making target detection impossible.
The statistical results of multiple sets of measured data, shown in Figure 15 under a preset false alarm probability of 10−4, reveal several key observations. The CA-CFAR and ANMF detection methods exhibit significantly lower detection probabilities across all sea states compared to the other three methods, along with relatively high false alarm probabilities. However, their false alarm probabilities remain within the preset magnitude. OS-CFAR demonstrates generally good detection performance, particularly excelling in high-sea-state conditions compared to other methods under similar conditions. However, it suffers from false alarm probabilities that far exceed the preset levels, greatly undermining its practical reliability and making it difficult to apply directly in operational scenarios. The RAA feature detector used in this study achieves better detection performance under the same conditions due to the use of 256 pulses for feature extraction, which facilitates non-coherent accumulation. However, its false alarm control performance is also suboptimal. Additionally, its performance heavily depends on the number of pulses used for feature computation, significantly limiting its real-time detection capabilities. The proposed detection method demonstrates superior performance among single-pulse detectors, achieving lower false alarm probabilities and higher detection probabilities, even under high-sea-state conditions. This indicates its strong potential for stable application in real-world maritime detection scenarios.
Figure 16 shows the ROC curves of the detection probability versus the preset false alarm probability under sea state 5 conditions. When the preset false alarm probability is low, the performance curve of the proposed detection method is significantly higher than that of CA-CFAR but slightly lower than those of RAA-CFAR and OS-CFAR. As the preset false alarm probability increases, the overlap between the curves improves. However, as demonstrated earlier, ROC curves based on preset false alarm probabilities do not accurately reflect real-world performance. To address this, the preset false alarm probabilities are adjusted so that the actual false alarm probabilities match the corresponding values. The resulting ROC curves of the detection probability versus the actual false alarm probability for each detection method are shown in Figure 17. In the actual ROC curves, OS-CFAR produces results far inferior to those of the other detection methods, reflecting the negative impact of reduced thresholds in this amplitude distribution model, which leads to excessive false alarms. The proposed method’s curve remains slightly below that of the RAA feature detector but shows increased overlap, demonstrating its robust detection capabilities.
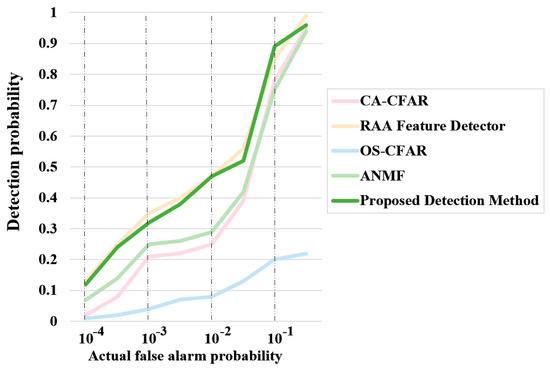
Figure 17.
ROC Curve of Detection Probability versus Actual False Alarm Probability.
5. Conclusions
To address the challenges posed by the real-time requirements of target detection and the influence of the SCR in a single-source observational channel, this paper proposes a dual-observational channel 2D-CFAR target detection method for sea clutter, based on Copula theory. The amplitude distribution characteristics and correlation variations of radar dual-polarization echo data are thoroughly analyzed, and Copula theory is employed to construct an explicit joint PDF for dual-channel data. Building on this, the mathematically rigorous derivation of the 2D-CFAR detection framework with dual detection statistics is presented, leading to the development of a novel target detection method. Comparative analyses, conducted using both simulated data and the publicly available SDRDSP dataset, highlight the superior false alarm control capabilities of the proposed approach relative to other commonly used detection methods. Additionally, target detection experiments on the SDRDSP dataset demonstrate that the proposed method consistently outperforms comparative approaches in terms of detection performance across various sea states and false alarm probability conditions, while also exhibiting exceptional stability.
Author Contributions
Conceptualization, X.J., J.G. and N.L.; methodology, X.J., J.T. and N.L.; software, X.J. and J.L.; validation, X.J.; formal analysis, J.G.; investigation, N.L.; resources, Y.D.; data curation, G.W.; writing—original draft preparation, X.J. and J.T.; writing—review and editing, X.J. and N.L.; visualization, J.T.; supervision, J.G.; project administration, Y.D.; funding acquisition, J.G. All authors have read and agreed to the published version of the manuscript.
Funding
This research was funded by the National Natural Science Foundation of China under Grant 62388102 and Grant 62101583.
Data Availability Statement
More navigation radar datasets can be found on the website of the Journal of Radars, https://radars.ac.cn/web/data/getData?dataType=DatasetofRadarDetectingSea (accessed on 3 July 2024). The data belong to the Naval Aviation University, and the editorial department of the Journal of Radars holds copyright regarding editing and publishing. Readers can use the data for free for teaching, research, etc., but they need to quote or acknowledge them in papers, reports, and other achievements. The data are prohibited from use for commercial purposes. Regarding any commercial needs, please contact the editorial department of the Journal of Radars.
Conflicts of Interest
The authors declare no conflicts of interest.
Abbreviations
The following abbreviations are used in this manuscript:
| ANMF | Adaptive Normalized Matched Filter |
| CA-CFAR | Cell Average Constant False Alarm Rate |
| CUT | Cell Under Test |
| HH | Horizontal–Horizontal |
| IID | Independent and Identically Distributed |
| OS-CFAR | Ordered Statistic Constant False Alarm Rate |
| Probability Density Function | |
| RAA | Relative Average Amplitude |
| RC | Reference Cell |
| ROC | Receiver Operating Characteristic |
| SCR | Signal-to-Clutter Ratio |
| SDRDSP | Sea-Detecting Radar Data-Sharing Program |
| VV | Vertical–Vertical |
References
- Liu, N.; Yang, H.; Wang, G.; Ding, H.; Dong, Y.; Xue, W. A Spectral Mode Reconstruction Method for Floating Target Detection Under Strong Sea Clutter Conditions. Remote Sens. 2025, 17, 3155. [Google Scholar] [CrossRef]
- Xu, S.; Niu, X.; Ru, H.; Chen, X. Classification of Small Targets on Sea Surface Based on Improved Residual Fusion Network and Complex Time–Frequency Spectra. Remote Sens. 2024, 16, 3387. [Google Scholar] [CrossRef]
- Shui, P.-L.; Zhang, L.-X.; Bai, X.-H. Small Target Detection in Sea Clutter by Weighted Biased Soft-Margin SVM Algorithm in Feature Spaces. IEEE Sens. J. 2024, 24, 10419–10433. [Google Scholar] [CrossRef]
- Zhao, J.; Xu, W.; Kneip, L. A Certifiably Globally Optimal Solution to Generalized Essential Matrix Estimation. In Proceedings of the 2020 IEEE/CVF Conference on Computer Vision and Pattern Recognition (CVPR), Seattle, WA, USA, 13–19 June 2020; pp. 12031–12040. [Google Scholar] [CrossRef]
- Guan, B.; Zhao, J. Affine Correspondences between Multi-Camera Systems for Relative Pose Estimation. IEEE Trans. Pattern Anal. Mach. Intell. 2025, 1–18. [Google Scholar] [CrossRef] [PubMed]
- Zhang, C.; Liu, G.; Cao, C.; Sun, J.; Dai, Y.; Zhang, X. SCA-Net: A Network Based on Multi-task Learning for Sea Clutter Amplitude Distribution Prediction of SAR Images. IEEE Geosci. Remote Sens. Lett. 2025, 22, 1–5. [Google Scholar] [CrossRef]
- Guan, Y.; Zhang, X.; Gao, G.; Cao, C.; Li, Z.; Fu, S.; Liu, G. A New Indicator for Assessing Fishing Ecological Pressure Using Multi-source Data: A Case Study of the South China Sea. Ecol. Indic. 2025, 170, 113096. [Google Scholar] [CrossRef]
- Kan, Q.; Xu, J.; Liao, G.; Zhang, Y.; Xu, Y.; Wang, W. Clutter Characteristics Analysis and Range-Dependence Compensation for Space-Air Bistatic Radar. IEEE Trans. Geosci. Remote Sens. 2024, 62, 5101615. [Google Scholar] [CrossRef]
- Xu, S.W.; Wang, Z. Optimum and Near-Optimum Coherent False Alarm Rate Detection of Radar Targets in Compound-Gaussian Clutter with Generalized Inverse Gaussian Texture. IEEE Trans. Aerosp. Electron. 2022, 58, 1692–1706. [Google Scholar] [CrossRef]
- Xiong, G.; Wang, L. Radar Sea Clutter Reconstruction Based on Statistical Singularity Power Spectrum and Instantaneous Singularity Exponents Distribution. IEEE Trans. Geosci. Remote Sens. 2021, 59, 5687–5697. [Google Scholar] [CrossRef]
- Shui, P.L.; Liu, M. Sub-Band Adaptive GLRT-LTD for Weak Moving Targets in Sea Clutter. IEEE Trans. Aerosp. Electron. 2016, 52, 423–437. [Google Scholar] [CrossRef]
- Shi, S.N.; Shui, P.L. Detection of Low-Velocity and Floating Small Targets in Sea Clutter via Income-Reference Particle Filters. Signal Process. 2018, 148, 78–90. [Google Scholar] [CrossRef]
- Jiménez, L.P.J.; García, F.D.A.; Alvarado, M.C.L.; Fraidenraich, G.; Lima, E.R.D. A General CA-CFAR Performance Analysis for Weibull-Distributed Clutter Environments. IEEE Geosci. Remote Sens. Lett. 2022, 19, 4025305. [Google Scholar] [CrossRef]
- Melebari, A.; Mishra, A.K.; Abdul Gaffar, M.Y. Comparison of Square Law, Linear and Bessel Detectors for CA and OS CFAR Algorithms. In Proceedings of the 2015 IEEE Radar Conference, Johannesburg, South Africa, 27–30 October 2015; pp. 383–388. [Google Scholar]
- Sahed, M.; Kenane, E.; Khalfa, A.; Djahli, F. Exact Closed-Form PFA Expressions for CA- and GO-CFAR Detectors in Gamma-Distributed Radar Clutter. IEEE Trans. Aerosp. Electron. 2023, 59, 4674–4679. [Google Scholar] [CrossRef]
- Draskovic, G.; Pascal, F.; Breloy, A.; Tourneret, J.-Y. New Asymptotic Properties for the Robust ANMF. In Proceedings of the 2017 IEEE International Conference on Acoustics, Speech and Signal Processing (ICASSP), New Orleans, LA, USA, 5–9 March 2017; pp. 3429–3433. [Google Scholar]
- Shi, S.N.; Shui, P.L. Sea-Surface Floating Small Target Detection by One-Class Classifier in Time-Frequency Feature Space. IEEE Trans. Geosci. Remote Sens. 2018, 56, 6395–6411. [Google Scholar] [CrossRef]
- Shui, P.L.; Li, D.C. Tri-Feature-Based Detection of Floating Small Targets in Sea Clutter. IEEE Trans. Aerosp. Electron. Syst. 2014, 50, 1416–1430. [Google Scholar] [CrossRef]
- Xie, J.; Xu, X. Phase-Feature-Based Detection of Small Targets in Sea Clutter. IEEE Geosci. Remote Sens. Lett. 2022, 19, 1–5. [Google Scholar] [CrossRef]
- Guo, Z.X.; Shui, P.L.; Bai, X.H. Small Target Detection in Sea Clutter Using All-Dimensional Hurst Exponents of Complex Time Sequence. Digit. Signal Process. 2020, 101, 102707. [Google Scholar] [CrossRef]
- Li, C.; Shui, P.L. Floating Small Target Detection in Sea Clutter via Normalized Doppler Power Spectrum. IET Radar Sonar Navig. 2016, 10, 699–706. [Google Scholar] [CrossRef]
- Qu, Q.; Wang, Z.; Wang, Y.L. A False Alarm Controllable Detection Method Based on CNN for Sea-Surface Small Targets. IEEE Geosci. Remote Sens. Lett. 2022, 19, 1–5. [Google Scholar] [CrossRef]
- Shi, Y.L.; Guo, Y.X. Sea-Surface Small Floating Target Detection via Recurrence Plots and FAC Classification Based on CNN. IEEE Trans. Geosci. Remote Sens. 2022, 60, 1–13. [Google Scholar]
- Shui, P.L.; Guo, Z.X. Feature-Compression-Based Detection of Sea-Surface Small Targets. IEEE Access 2020, 8, 8371–8385. [Google Scholar] [CrossRef]
- Guo, Z.X.; Shui, P.L. Anomaly-Based Sea-Surface Small Target Detection Using K-Nearest-Neighbor Classification. IEEE Trans. Aerosp. Electron. Syst. 2020, 56, 4947–4964. [Google Scholar] [CrossRef]
- Su, N.; Chen, X. Radar Maritime Target Detection via Spatial-Temporal Feature Attention Graph Convolutional Network. IEEE Trans. Geosci. Remote Sens. 2024, 62, 1–15. [Google Scholar] [CrossRef]
- Liu, N.; Dong, Y.; Wang, G. Annual Progress. of the Sea-Detecting X-Band. Radar and Data Acquisition Program. J. Radars 2021, 10, 173–182. [Google Scholar]
- Guan, J.; Liu, N.; Wang, G. Sea-Detecting Radar Experiment and Target Feature Data Acquisition for Dual Polarization Multistate Scattering Dataset of Marine Targets. J. Radars 2023, 12, 456–469. [Google Scholar]
- Wang, J.; Wang, Z.; He, Z. GLRT-Based Polarimetric Detection in Compound-Gaussian Sea Clutter with Inverse-Gaussian Texture. IEEE Geosci. Remote Sens. Lett. 2022, 19, 1–5. [Google Scholar] [CrossRef]
- Mohsenzadeh, M.S.; Hodtani, G.A. FGM Copula Based Analysis of Outage Probability for Wireless Three-User Multiple Access Channel with Correlated Channel Coefficients. In Proceedings of the 2023 31st International Conference on Electrical Engineering (ICEE), Tehran, Iran, 9–11 May 2023; pp. 492–495. [Google Scholar]
- Xu, F.-X.; Dong, Y.-Q. Concordance Measures of a Class of Two-Parameter with Cube Generalized FGM Copulas. In Proceedings of the 2010 Third International Symposium on Information Science and Engineering, Shanghai, China, 24–26 December 2010; pp. 62–65. [Google Scholar] [CrossRef]
- Lv, W.; Sang, L.; Shen, G. Risk Concentration Based on the Tail Distortion Risk Measure under Generalized FGM Copula. In Proceedings of the 2016 International Conference on Identification, Information and Knowledge in the Internet of Things (IIKI), Beijing, China, 20–21 October 2016; pp. 567–572. [Google Scholar] [CrossRef]
- Sun, Y.; Geng, J. Simulation of Coherent Correlated K-distribution Sea Clutter Based on SIRP. Sci. Technol. Eng. 2009, 9, 5144–5147. [Google Scholar]
Disclaimer/Publisher’s Note: The statements, opinions and data contained in all publications are solely those of the individual author(s) and contributor(s) and not of MDPI and/or the editor(s). MDPI and/or the editor(s) disclaim responsibility for any injury to people or property resulting from any ideas, methods, instructions or products referred to in the content. |
© 2025 by the authors. Licensee MDPI, Basel, Switzerland. This article is an open access article distributed under the terms and conditions of the Creative Commons Attribution (CC BY) license (https://creativecommons.org/licenses/by/4.0/).