Article

Enhancing Wildfire Monitoring with SDGSAT-1: A Performance Analysis

1
School of Forestry, Southwest Forestry University, Kunming 650224, China
2
Key Laboratory of Forest Disaster Warning and Control in Yunnan Province, Southwest Forestry University, Kunming 650224, China
3
International Research Center of Big Data for Sustainable Development Goals, Beijing 100094, China
4
Aerospace Information Research Institute, Chinese Academy of Sciences, Beijing 100094, China
5
Key Laboratory of Forest Resources Conservation and Utilization in the Southwest Mountains of China, Ministry of Education, Southwest Forestry University, Kunming 650224, China
6
College of Soil and Water Conservation, Southwest Forestry University, Kunming 650224, China
7
School of Foreign Languages, Southwest Forestry University, Kunming 650224, China
8
Institute of Highland Forest Science, Chinese Academy of Forestry, Kunming 650224, China
9
College of Big Data and Intelligence Engineering, Southwest Forestry University, Kunming 650224, China
*
Author to whom correspondence should be addressed.
These authors contributed equally to this work.
Remote Sens. 2025, 17(19), 3339; https://doi.org/10.3390/rs17193339
Submission received: 20 May 2025 / Revised: 11 August 2025 / Accepted: 23 September 2025 / Published: 30 September 2025

Abstract

Highlights

What are the main findings?
  • Focusing on smoke, fire points and burned area as the research objective, explore the ability of SDGSAT-1 to detect wildfire.
  • SDGSAT-1 is highly effective in extracting burned areas, providing clear fire bounda-ries with a higher precision of 95.46%, while the average accuracy of smoke detection is 81.72%.
What is the implication of the main finding?
  • The accuracy of SDGSAT-1 in correctly identifying fire points using the fixed threshold method is 91.10%.
  • SDGSAT-1 can detect fires as small as 0.0009 km2, which has the capability to identify initial and early small fire.

Abstract

Advancements in remote sensing technology have enabled the acquisition of high spatial and radiometric resolution imagery, offering abundant and reliable data sources for forest fire monitoring. In order to explore the ability of Sustainable Development Science Satellite 1 (SDGSAT-1) in wildfire monitoring, a systematic and comprehensive study was proposed on smoke detection during the wildfire early warning phase, fire point identification during the fire occurrence, and burned area delineation after the wildfire. The smoke detection effect of SDGSAT-1 was analyzed by machine learning and the discriminating potential of SDGSAT-1 burned area was discussed by Mid-Infrared Burn Index (MIRBI) and Normalized Burn Ratio 2 (NBR2). In addition, compared with Sentinel-2, the fixed-threshold method and the two-channel fixed-threshold plus contextual approach are further used to demonstrate the performance of SDGSAT-1 in fire point identification. The results show that the average accuracy of SDGSAT-1 fire burned area recognition is 90.21%, and a clear fire boundary can be obtained. The average smoke detection precision is 81.72%, while the fire point accuracy is 97.40%, and the minimum identified fire area is 0.0009 km2, which implies SDGSAT-1 offers significant advantages in the early detection and identification of small-scale fires, which is significant in fire emergency and disposal. The performance of fire point detection is superior to that of Sentinel-2 and Landsat 8. SDGSAT-1 demonstrates great potential in monitoring the entire process of wildfire occurrence, development, and evolution. With its higher-resolution satellite imagery, it has become an important data source for monitoring in the field of remote sensing.

Graphical Abstract

1. Introduction

Due to the intensification of global climate change and human activities in recent years, wildfires have become increasingly frequent [1], posing significant threats to human life and property [2]. These fires cause forest structure degradation, biodiversity loss, and soil quality deterioration [3]. Wildfires not only have profound impacts on forest ecosystems but also significantly alter atmospheric composition and environmental quality [4] and accelerate global warming [5]. Timely monitoring of wildfires is a key component in effective fire prevention and control, as well as in reducing fire-related impacts [6]. With the advancement of satellite remote sensing technology, which offers the advantage of large-scale, synchronous surface observation, it is now possible to provide real-time information on the spatial distribution, spread dynamics, and intensity of wildfires. This has become a vital tool for timely wildfire monitoring [7] and has significantly enhanced the accuracy of fire warnings and emergency responses [8]. As such, satellite remote sensing remains an essential technology in current and future wildfire monitoring and early-warning systems. Recent advancements in artificial intelligence (AI) and deep learning have significantly improved wildfire detection, especially for small-scale fires that are often missed by traditional sensors. Attention-based CNNs and transformer models have shown high accuracy in identifying subtle fire signals in complex backgrounds [9]. Lightweight architecture has also been proposed for efficient wildfire monitoring using UAV data under limited computational resources [10]. Additionally, VIIRS data have demonstrated better performance in detecting low-intensity fires compared to MODIS, offering valuable insight for complementing newer sensors like SDGSAT-1 [11]. These studies highlight the value of integrating AI approaches and multi-source remote sensing data, which supports the enhanced potential of SDGSAT-1 in wildfire monitoring.
Currently, satellite-based wildfire monitoring primarily relies on high-altitude geostationary or polar-orbiting satellites [12], such as NOAA, MODIS, FY, and Himawari. These satellites have advantages in time dynamics and thermal radiation sensitivity [13]. However, due to their coarse spatial resolution, satellite monitoring data at the kilometer scale is highly effective for detecting large-scale fires [14]. Yet, it is insufficient for the timely detection of small fires or early-stage fires (smoke) that are crucial for improving firefighting efficiency [15]. In the early stages of a fire, small fires exhibit relatively low flame intensity, limited temperature, and smoke levels, making it difficult for traditional temperature sensors and smoke detectors to capture these faint signals in a timely manner [16]. This results in detection delays and the phenomenon of missed detection of small fires. The spatial resolution of coarse-scale image pixels is relatively low, resulting in poor monitoring accuracy for early-stage fires. Low-resolution imagery has certain limitations in detecting small-scale fires in their early stages. Small fire detection is an important component of wildfire monitoring. Therefore, how to accurately and promptly detect small fires has always been the focus and hot topic of wildfire monitoring research [17]. Generally, satellite-based wildfire monitoring relies on three characteristics of the fire process such as smoke [18], fire point [19], and burned area [20]. Smoke research uses the reflectance and brightness temperature values of multiple spectral bands, and adds texture features [21,22] from manual input to automatic extraction of smoke features, using supervised classification methods to distinguish smoke [23,24,25]. The detection of the fire point is started by the threshold method [26,27,28], developed for contextual detection [29,30,31], to the two-channel fixed-threshold plus contextual approach, such as ASTER [32,33], Landsat8. As fire point identification, the thermal infrared band is most commonly used. However, the effectiveness of SDGSAT-1’s 30 m resolution long-wave infrared is worth exploring. The spectral indicators for identifying burned areas include Enhanced Vegetation Index (EVI), Mid-Infrared Burn Index (MIRBI), Normalized Burn Ratio (NBR), Normalized Burn Ratio 2 (NBR2), Normalized Difference Vegetation Index (NDVI), etc., [34,35], in which MIRBI and NBR2 were considered to have better recognition effects [36,37,38]. Similarly to fire point identification, the effectiveness of long-wave infrared recognition of burned areas deserves exploration. Since SDGSAT-1 has high spectral and thermal infrared data, exploring its feasibility for monitoring wildfires is meaningful. With the advancement of modern remote sensing technology, and the development of satellite remote sensing and artificial intelligence, the use of new satellite data with high temporal and spatial resolution, along with thermal sensitivity, has significantly improved the efficiency and accuracy of small fire detection. Exploring the potential of next-generation high-resolution satellite data for monitoring the entire cycle of wildfire events is an area worth further exploration.
SDGSAT-1 is the world’s first scientific satellite dedicated to the United Nations 2030 Agenda for Sustainable Development and the first earth science satellite of the Chinese Academy of Sciences. In response to the global SDGs’ (United Nations Sustainable Development Goals) monitoring, assessment, and scientific research needs, SDGSAT-1 is equipped with three advanced sensors: Multispectral Imager for Inshore (MII), Glimmer Imager for Urbanization (GIU) and Thermal Infrared Spectrometer (TIS) [39,40]. In the context of wildfire detection, each sensor onboard SDGSAT-1 offers distinct advantages. The TIS provides mid- and long-wave infrared data, enabling the detection of thermal anomalies and active fire fronts, particularly during nighttime. The MII captures reflectance in visible and near-infrared bands, which facilitates the extraction of vegetation indices (e.g., NBR2, NDVI) and supports the identification of smoke plumes and burned areas. The GIU delivers nighttime low-light imagery, allowing for the detection of fire-induced light emissions, especially in urban fringe or densely populated zones. The synergy of these three sensors enhances the capability of SDGSAT-1 to detect wildfires from multiple perspectives, including thermal radiation, spectral changes, and visible light emissions.
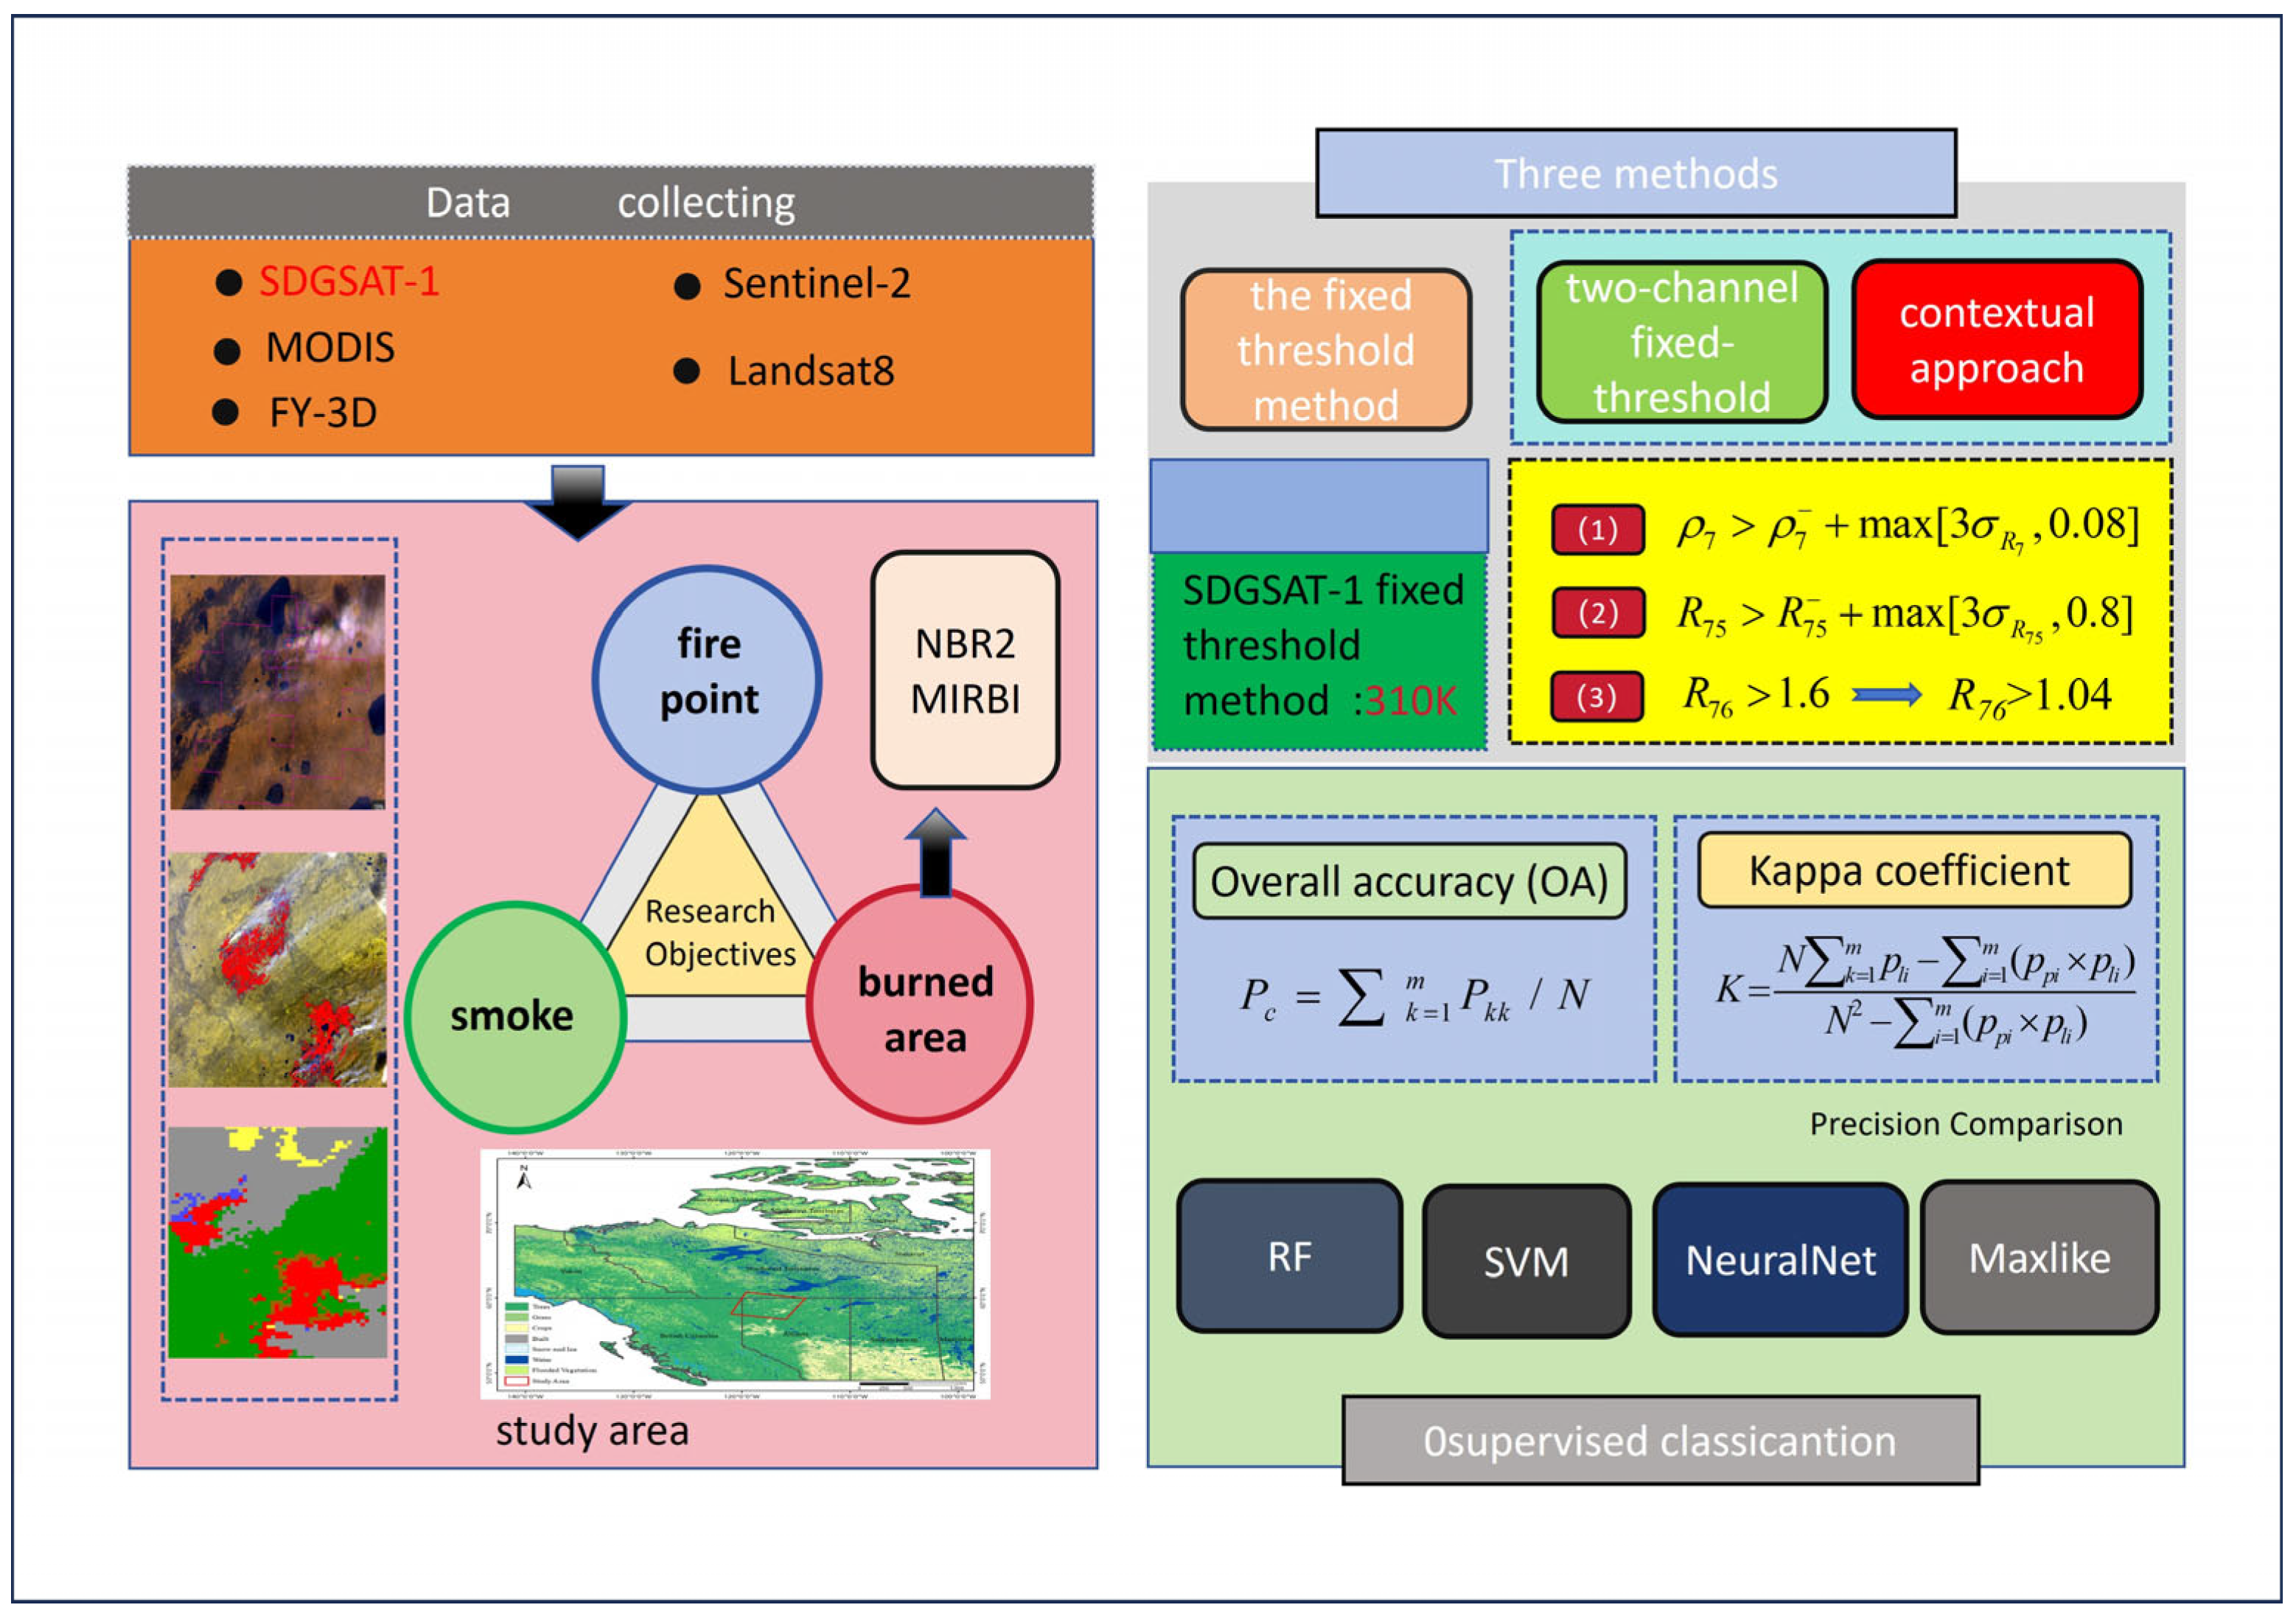
Nowadays, there are many studies on SDGSAT-1 GIU data, such as identifying the type of night lighting source [41,42], precise description of urban public safety and comfort circles [43], improving the zoning of village building scales [44], and conducting earthquake disaster assessments [45]. Research on SDGSAT-1 MII data mainly focuses on assessing changes in vegetation coverage, land degradation, and ecosystem services, as well as real-time monitoring of crop growth, soil moisture, and environmental changes in agricultural areas. Research on SDGSAT-1 TIS data primarily provides surface temperature data, which is suitable for climate change monitoring, water temperature monitoring, and soil moisture monitoring. However, the feasibility of applying SDGSAT-1 to wildfire detection has not yet been systematically evaluated. In order to discover the prospects of the SDGSAT-1 satellite in wildfire monitoring, this study takes smoke, fire point, and burned areas as the research objectives and Canada as the research area. With the rapid development of artificial intelligence, machine learning methods have been increasingly applied in wildfire research [46], achieving notable success in various areas such as fire risk assessment, fire point detection, fire spread modeling, and post-fire impact evaluation. In particular, these techniques have significantly enhanced the accuracy and efficiency of wildfire prediction and management, thereby providing strong support for fire prevention and mitigation decision-making [47]. To evaluate the classification performance of SDGSAT-1 imagery in wildfire monitoring, we selected four widely used supervised classification algorithms: Support Vector Machine (SVM), Random Forest (RF), Neural Network (NN), and Maximum Likelihood Classification (Max Like). SVM is known for its robustness in high-dimensional spaces and its strong performance with limited training samples [48], RF offers excellent generalization ability and is particularly suitable for high-dimensional multispectral data [49], NN is capable of modeling complex non-linear relationships and is effective in classifying mixed land features [50], and Max Like, although a conventional approach, remains a widely used baseline method in remote sensing classification tasks due to its statistical robustness and interpretability, particularly when class distributions follow a Gaussian model [51]. Taking MODIS and FY-3D data as references, the ability of SDGSAT-1 data to detect smoke was explored. Then, the optimal burned area recognition method was selected and compared with MIRBI and NBR2. Sentinel-2, Landsat8, MODIS, and FY-3D data were used as references to explore the ability of SDGSAT-1 data in recognizing burned areas. Finally, taking the burned area of Sentinel-2 data as baseline, the fixed-threshold method and the two-channel fixed-threshold plus contextual approach are applied to reveal the fire point identification ability of SDGSAT-1 data. The research provides an insight into new data sources for effective detection of wildfire characteristics to make a scientific basis for expanding the prospects of SDGSAT-1 in wildfires before the disaster warning, disaster monitoring, and post-disaster assessment.

2. Research Method

2.1. Study Area

The study area (Figure 1) is located at the junction of Alberta, British Columbia, and Northwest Territories in western Canada (56°38′–61°19′N, 113°43′–121°39′W), with a total area of 1.4 × 10⁵ km2. The region belongs to a continental climate as the average temperature of the winter solstice is −15 °C and 24.5 °C at the summer solstice, with the annual mean temperature of 2.5 °C. Moreover, the average precipitation in the winter season is 200~325 mm and 150~275 mm at the summer solstice, with the annual precipitation of 300~600 mm. Due to the hot, dry, and windy conditions in the area, fires are prone to occur. According to incomplete statistics, as of July 2023, there are still more than 900 fires in Canada, of which more than 570 are out of control, with a total fire area of nearly 9.7 × 10⁴ km2. In addition, the temperature in Alberta in 2023 is 10 to 15 °C higher than in previous years. Small-scale fires occur frequently and are difficult to detect.

2.2. Data

SDGSAT-1 was designed by the Chinese Academy of Sciences and launched on 5 November 2021. It carries three loads: TIS is mainly used to detect the spatial distribution of surface thermal radiation, GIU is mainly used for detecting different levels of urban and rural lights at night, and the scientific exploration of urban aerosols at night. MII is mainly used to detect coastal and offshore environments and explore the possibility of identifying smoke, fire point, and burned areas. In this study, we used SDGSAT-1 MII and TIS data; SDGSAT-1 MII spatial resolution is 10 m; and the spatial resolution of SDGSAT-1 TIS is 30 m. The size of a single scene is 300 km × 300 km. Using the SDGSAT-1 user manual (version 1), the DN value is converted to reflectivity and brightness temperature. The data details are shown in Table 1.

2.2.1. Extraction of Smoke and Burned Areas

The technical route of this study is shown in Figure 2, based on the multispectral characteristics of the image, smoke, cloud, cloud shadow, water body, burned area, and vegetation were selected as the regions of interest. RF, SVM, Neural Net, and Max Like were used to extract smoke and burned areas, respectively. The thermal infrared single band of SDGSAT-1 can directly extract the burned area. NBR2 and MIRBI methods were also used to extract the burned area of other satellites, and their recognition accuracy was compared. Training samples were selected based on visual interpretation and uniform spatial distribution to ensure representative coverage of the study area. For each land cover type, no more than 50 sample units were selected, with at least 1000 pixels per class. The samples ensured a separability index greater than 1.9, supporting classification accuracy and reliability.
The SDGSAT-1 radiometric calibration calculation Equation (1) shows:
L = D N × G a i n + B i a s
Equation (1) is derived from the Handbook of SDGSAT-1 Satellite Products. Where L is the radiance at the entrance pupil of the sensor, and DN is the count of the image after relative radiometric calibration. Gain is the gain, Bias is the bias, SDGSAT-1 MII, and SDGSAT-1 TIS specific parameters are shown in Table 2 (Table 2 is derived from the Handbook of SDGSAT-1 Satellite Products) and Table 3.
SDGSAY-1 radiance into reflectance calculation Equation (2) shows:
ρ p = π × L × d 2 E S U N × csc ( θ s )
Equation (2) is derived from the Handbook of SDGSAT-1 Satellite Products. Where ρ p is the reflectivity, L is the sensor entrance pupil radiance, π is the circumference rate, d is the distance between the Sun and the Earth (astronomical unit), the specific parameters are shown in Table 4 (Table 4 is derived from the Handbook of SDGSAT-1 Satellite Products), ESUN is the Mean Solar Exo-atmospheric Irradiance, and θ s is the solar zenith angle.
According to the reflection characteristics of preprocessed SDGSAT-1, Sentinel-2, Landsat8, MODIS and FY-3 D data, smoke, cloud, cloud shadow, water body, burned area and vegetation that can be better visually interpreted are selected. In order to achieve the purpose of supervised classification, a certain number of training samples are selected for each category. The selected training samples cover the whole area evenly and discreetly. Each type of sample has no less than 10,000 pixels, making its separation degree > 1.9. Four methods of RF, SVM, Neural Net, and Max Like are used to obtain the supervised classification results.
MIRBI and NBR2 calculation Equations (3) and (4) shows
M I R B I = 10 × ρ S W I R L 9.8 × ρ S W I R S + 2
N B R 2 = ρ S W I R S ρ S W I R L ρ S W I R S + ρ S W I R L
where ρ S W I R L and ρ S W I R S are short-wave infrared long reflectivity and short-wave infrared short reflectivity.

2.2.2. Identification of Fire Point

Considering the thermal infrared characteristics of the imagery, we applied both a fixed-threshold method and a two-channel thresholding approach with contextual information to extract fire points and evaluate their respective accuracies. The SDGSAT-1 TIS radiance is converted into temperature, and the Planck equation is used to convert the radiance into the effective temperature or brightness temperature of the satellite in orbit. The calculation Equation (5) shows:
T = 10 6 × h c / ( k λ ) l n [ 2 × 10 24 × h c 2 L λ 5 + 1 ]
Equation (5) is derived from the Handbook of SDGSAT-1 Satellite Products. Where T is the brightness temperature, h is the Planck constant, c is the speed of light, k is the Boltzmann constant, λ is the central wavelength, and L is the spectral radiance at the λ wavelength.
The radiation calibration of SDGSAT-1 TIS is carried out (the specific parameters are shown in Table 3), and the DN value of each band of the data is converted into radiance, and the thermal infrared radiance is converted into brightness temperature. The SDGSAT-1 TIS uses a fixed-threshold method, and is set to be higher than 310 K to determine the fire point [52]. All suspected fire points are obtained by combining the three bands, and the final fire point obtained using the fixed-threshold method for SDGSAT-1 is 310 K.
SDGSAT-1 active fire detection is based on the algorithm developed by Landsat8 and ASTER [12]. Both data use the two-channel fixed-threshold plus contextual approach to explore the differential radiation response of SWIR. In this paper, SDGSAT-1 uses LWIR instead of SWIR for the two-channel fixed-threshold plus contextual approach. Landsat8, MODIS, and FY-3D data use SWIR to obtain fire points. Due to varying environmental conditions between day and night, fire detection differs, especially under conditions of large temperature fluctuations and atmospheric interference. This method is specifically applied to daytime data, considering factors such as data acquisition and others, and the equation is shown in Landsat8 as an example.
R 75 > R 75 + m a x [ 3 σ R 75 , 0.8 ]
And
ρ 7 > ρ 7 + m a x [ 3 σ R 7 , 0.08 ]
And
R 76 > 1.6
where ρ i is the reflectivity of channel i, R i j is the ratio of the reflectivity of channel i and channel j, ρ i / ρ j . R i j and σ R i j ( ρ 7 and σ R 7 ) are the mean and standard deviation of the band ratio (channel seven reflectivity), calculated using the effective background pixels of the 61 × 61 window centered on the candidate pixels. R 75 : ratio of reflectance between Band 7 and Band 5, R 75 : the average value of the ratio of reflectance between Band 7 and Band 5, R 76 : ratio of reflectance between Band 7 and Band 6, ρ 7 with respect to the reflectance of Band 7, ρ 7 with respect to the average reflectance of Band 7.
The SDGSAT-1 LWIR is utilized for fire point identification. In the formula, band5, band6, and band7 are the substitution bands 1, 2, and 3 of the SDGSAT-1 TIS. The revised Equation (8) is as follows:
R 76 > 1.04

2.2.3. Precision Comparison

Through visual interpretation, no less than 5000 pixels of each type of sample were selected as validation samples, and the confusion matrix was calculated to obtain the overall accuracy and Kappa coefficient [53,54], the smoke accuracy comparison was carried out, and the method with higher accuracy was selected to compare with MIRBI and NBR2. Training samples were selected based on visual interpretation and uniform spatial distribution to ensure representative coverage of the study area. For each land cover type, no more than 50 sample units were selected, with at least 1000 pixels per class. The samples ensured a separability index greater than 1.9, supporting classification accuracy and reliability.
Overall accuracy (OA): This is obtained by the ratio of the number of correctly classified pixels to the total number of pixels in the study area. The calculation Equation (10) shows:
P c = k = 1 m P k k / N
where P c is the overall classification accuracy, m is the number of classification categories, N is the total number of samples, and P k k is the number of discriminant samples of the K class.
Kappa coefficient (Kappa): an indicator for consistency test, which can also be used to measure the effect of classification. The calculation of the Kappa coefficient is based on the confusion matrix. The closer the result is to 1, the higher the classification accuracy is. The calculation Equation (11) shows:
K = N i = 1 m P l i i = 1 m ( P p i × P l i ) N 2 i = 1 m ( P p i × P l i )
where K is the Kappa coefficient, N is the total number of samples, P p i is the total number of columns in a certain category, and P l i is the total number of rows in a certain category.
Accuracy of SDGSAT-1 smoke and burned areas: compare the recognition accuracy with other satellite data to identify smoke and burned areas. The Sentinel-2 satellite image time is located after all other images, and the best method for recognizing the burned area is selected to recongnize the burned area as the real fire data. Comparing the accuracy of the fire point, it is considered that the fire point falling in the Sentinel-2 fire burned area is the correct identification of the fire point.

3. Results

3.1. Effectiveness of Burned Areas

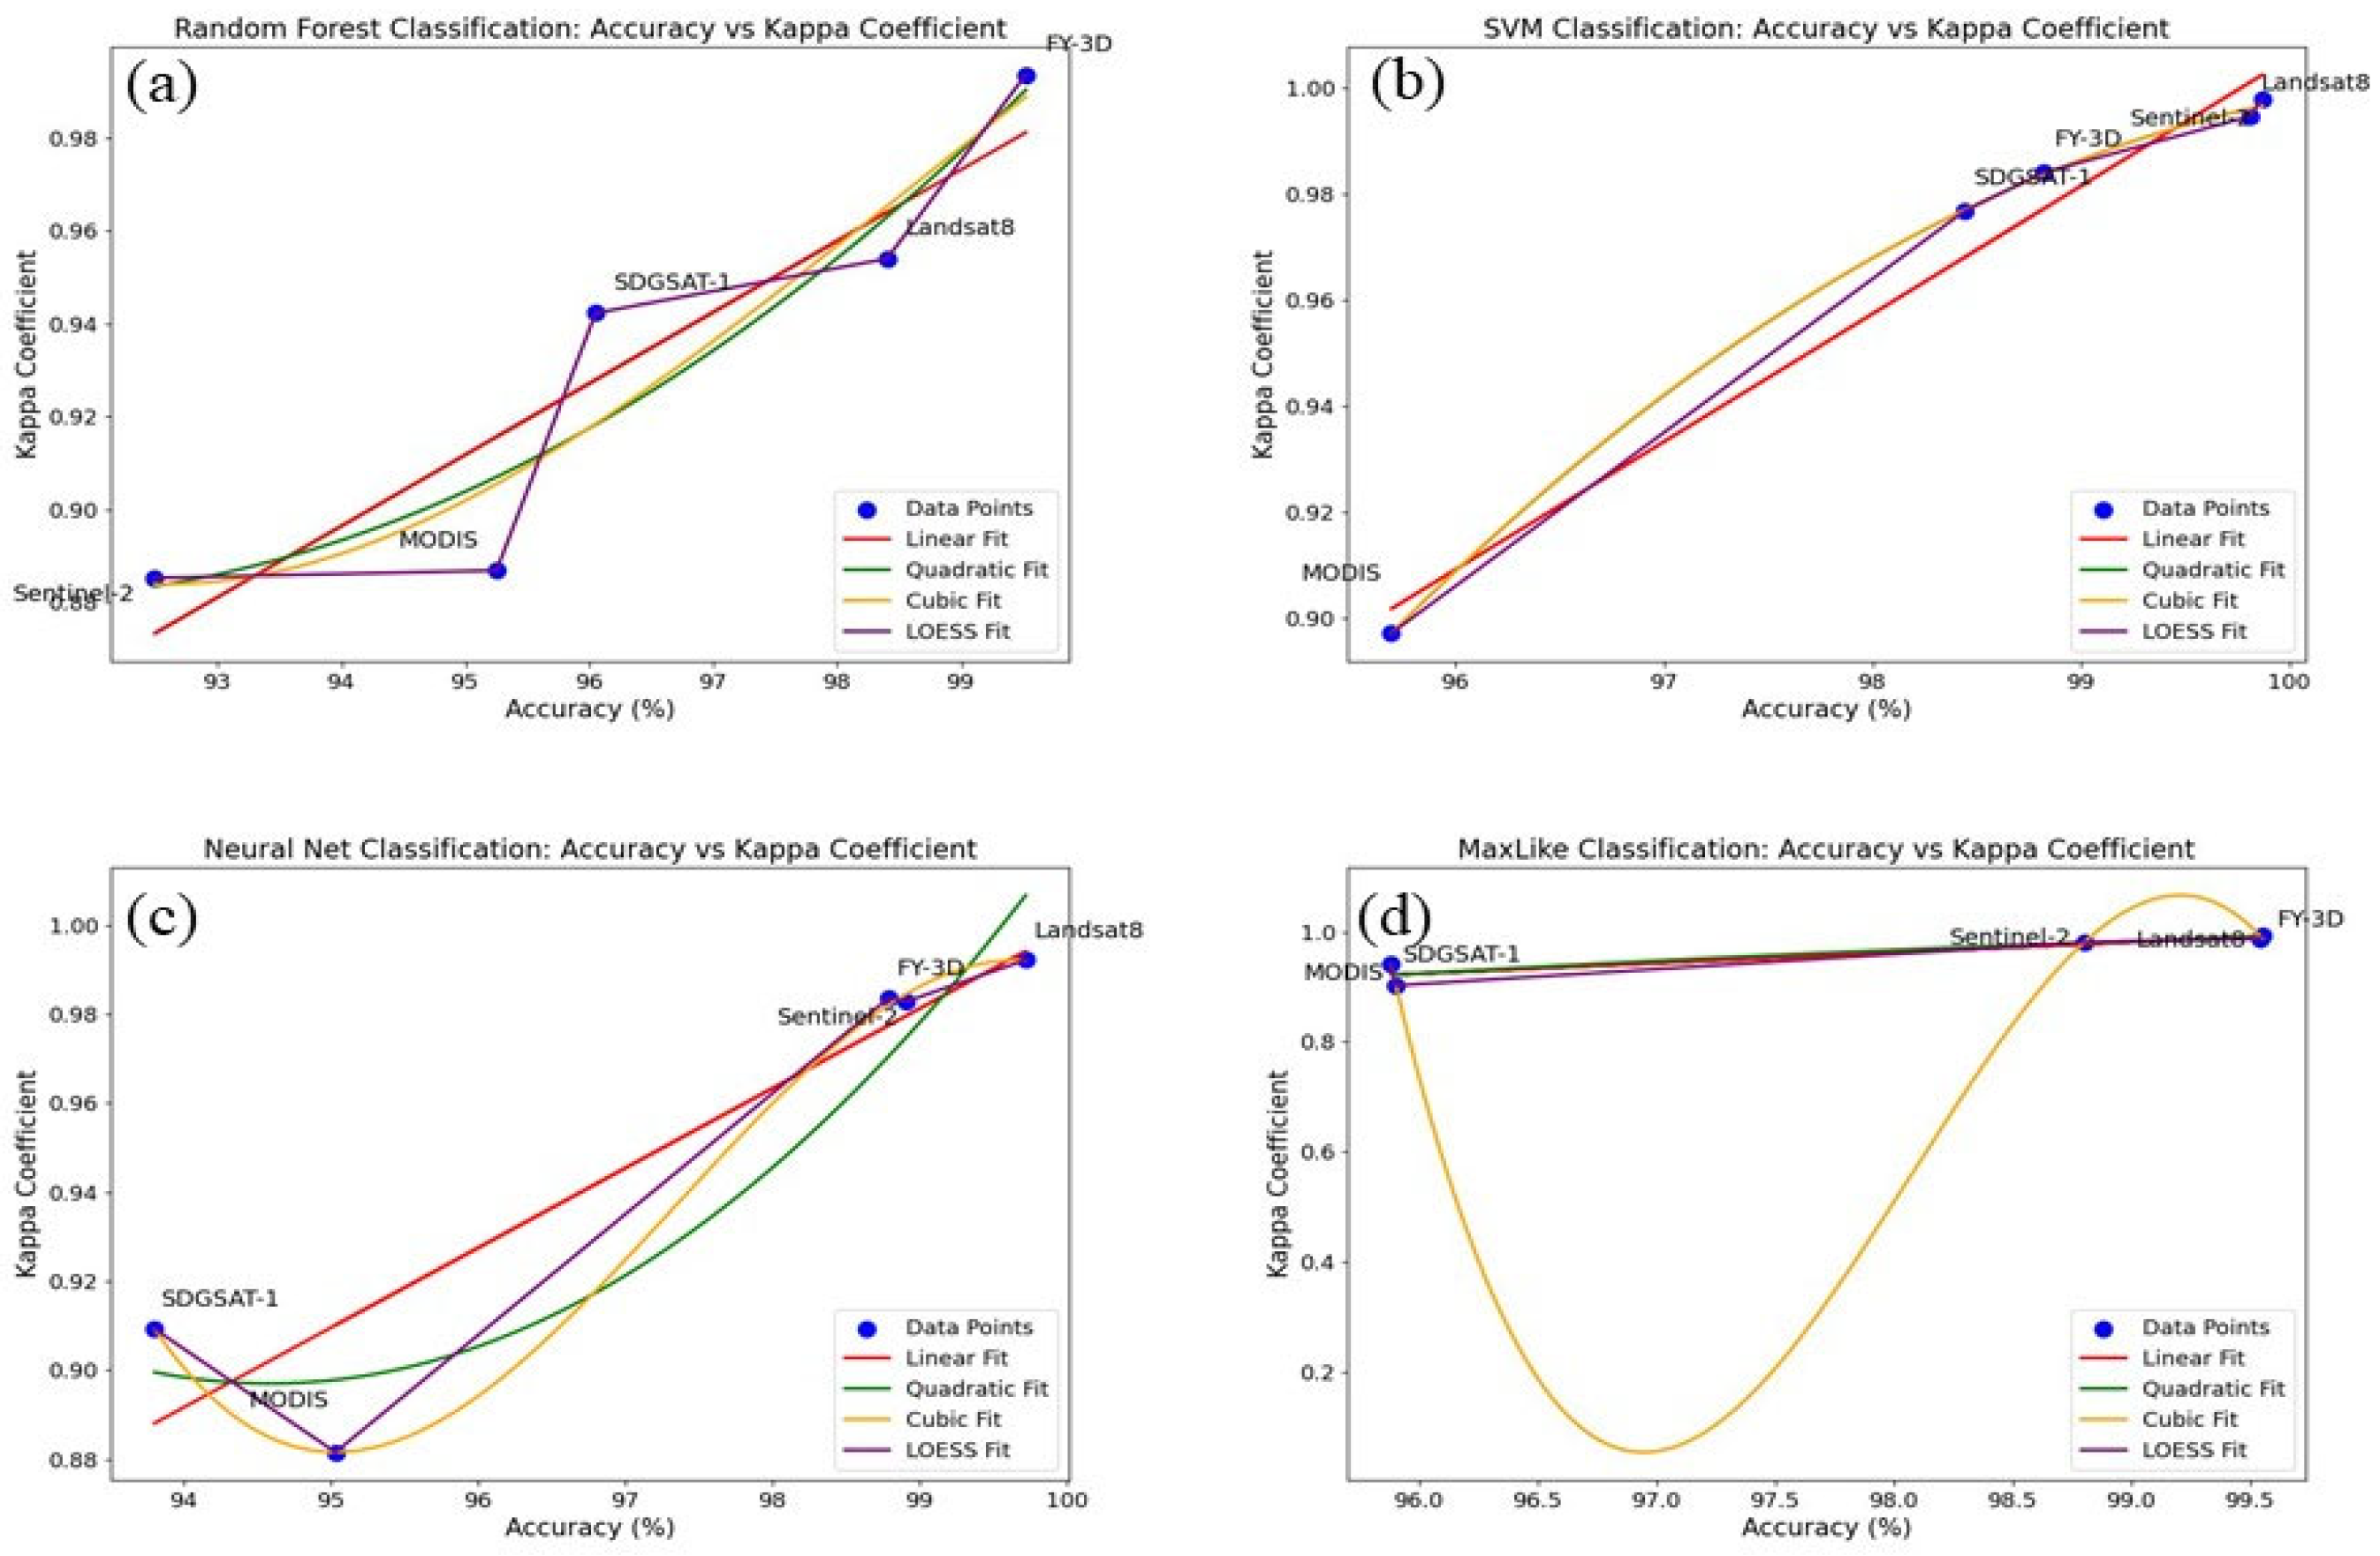
After data preprocessing of SDGSAT-1 MII, Sentinel-2, Landsat8, MODIS, and FY-3D data, four supervised classification methods, RF, SVM, Neural Net, and Max Like, were used to calculate the confusion matrix of the supervised classification results. The results are shown in Figure 3.
The OA of RF of SDGSAT-1 was 96.05%, and the kappa was 0.9423. The OA and kappa of SVM were 98.44% and 0.9768, respectively. OA of Neural Net is 93.80%, kappa is 0.9093; the OA of Max Like is 95.88%, and the kappa is 0.9407, which shows that the seven bands of SDGSAT-1 MII image can be used to extract smoke and burned areas by classification. The results show that the OA of SVM is the highest, but the recognition accuracy of Neural Net to the classified objects is more than 90%, so it can be used to compare the accuracy of smoke and burned areas. SVM is the most accurate of the four methods, and SVM is simple and easy to operate and has high classification accuracy for SDGSAT-1 data to identify smoke and burned areas. (No cloud and water detection has yet to be performed, and no cloud and water data have been accumulated.) Therefore, the accuracy of the burned area obtained by SVM, NBR2, and MIRBI is compared.
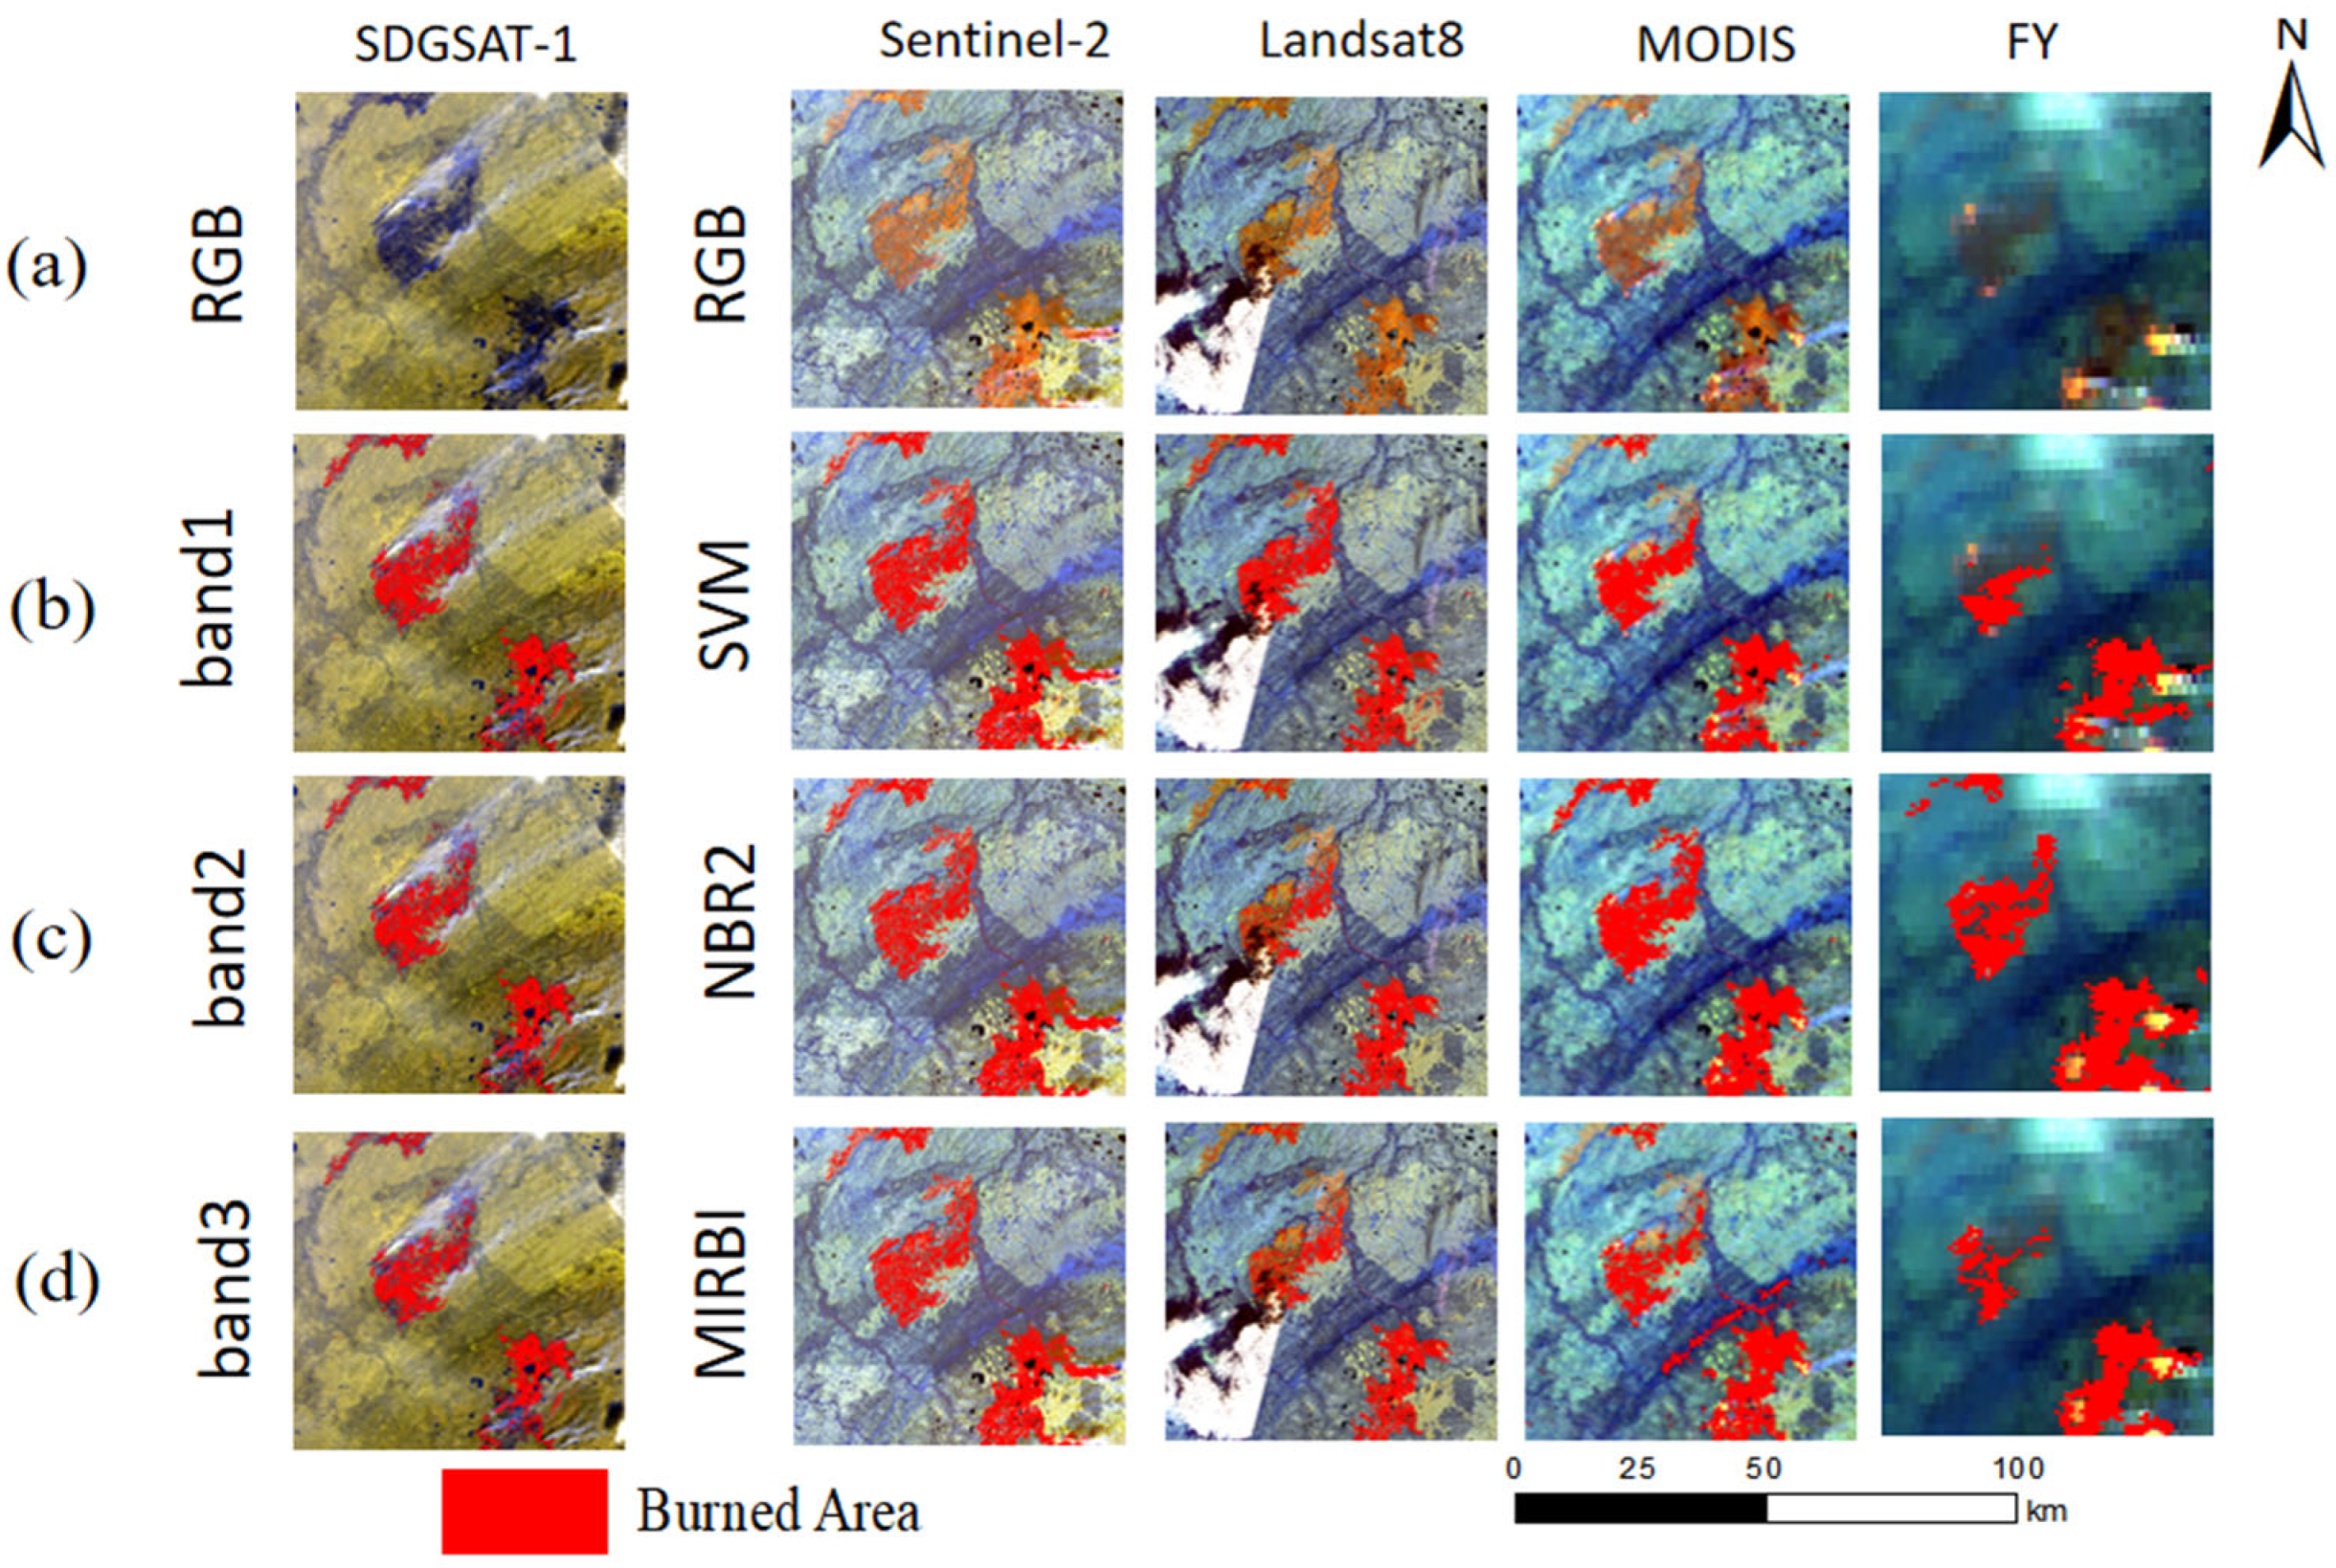
In order to verify the accuracy of SDGSAT-1 data in identifying burned areas, this study directly selects the fire sites that are still burning for identification. However, the image of Landsat 8 is located six days before the SDGSAT-1 image. In order to compare reliability, Landsat 8 is selected as the benchmark for identifying burned areas. Although Sentinel-2, MODIS, and FY-3D are located after the SDGSAT-1 image, Sentinel-2, MODIS, and FY-3D are also selected as the benchmark for identifying burned areas for comparison. The degree of matching between SDGSAT-1 and the reference is extracted to obtain recognition accuracy. Because the thermal infrared band of SDGSAT-1 TIS can directly obtain the burned area, band1, band2, and band3 of SDGSAT-1 TIS can obtain the burned area separately. Through visual inspection, band3 can obtain the burned area. Although the burned area is the smallest, it already contains all the burned areas. Therefore, band3 is used to obtain the burned area as the SDGSAT-1 burned area data, resulting in the removal of water and clouds using SVM results. It can be seen from Table 5 that the closer the spatial resolution of the SDGSAT-1 satellite is, the better the matching accuracy is. The average matching accuracy is Sentinel-2 (99.08%) > Landsat8 (95.69%) > MODIS (91.63%) > FY-3D (82.60%). For the three methods of SVM, NBR2, and MIRBI, on the whole, the average accuracy of NBR2 (95.89%) is significantly higher than that of SVM (90.65%) and MIRBI (90.21%), and the accuracy of NBR2 is better than the other two methods.
Three methods of SVM, NBR2, and MIRBI can extract the burned area mask (Figure 4), which can coincide well with the image. However, compared with band1 and band2, missing the burned area in the blue box in Figure 4, SDGSAT-1 band3 has a weaker ability to identify the burned area in a single small area. In addition to the MIRBI of Sentinel-2 to identify the burned area in the blue box in Figure 4, Landsat 8 and MODIS did not identify it, while FY-3D data only NBR2 identified the top strip of burned area. The sensitivity of MIRBI to identify burned areas is weaker than that of NBR2. Although SVM in SDGSAT-1 identifies burned areas in the blue box of Figure 4, its recognition time cost is dozens of times that of NBR2. Therefore, it is proved that NBR2 is superior to SVM and MIRBI as a whole.

3.2. The Comparison of Smoke Detection

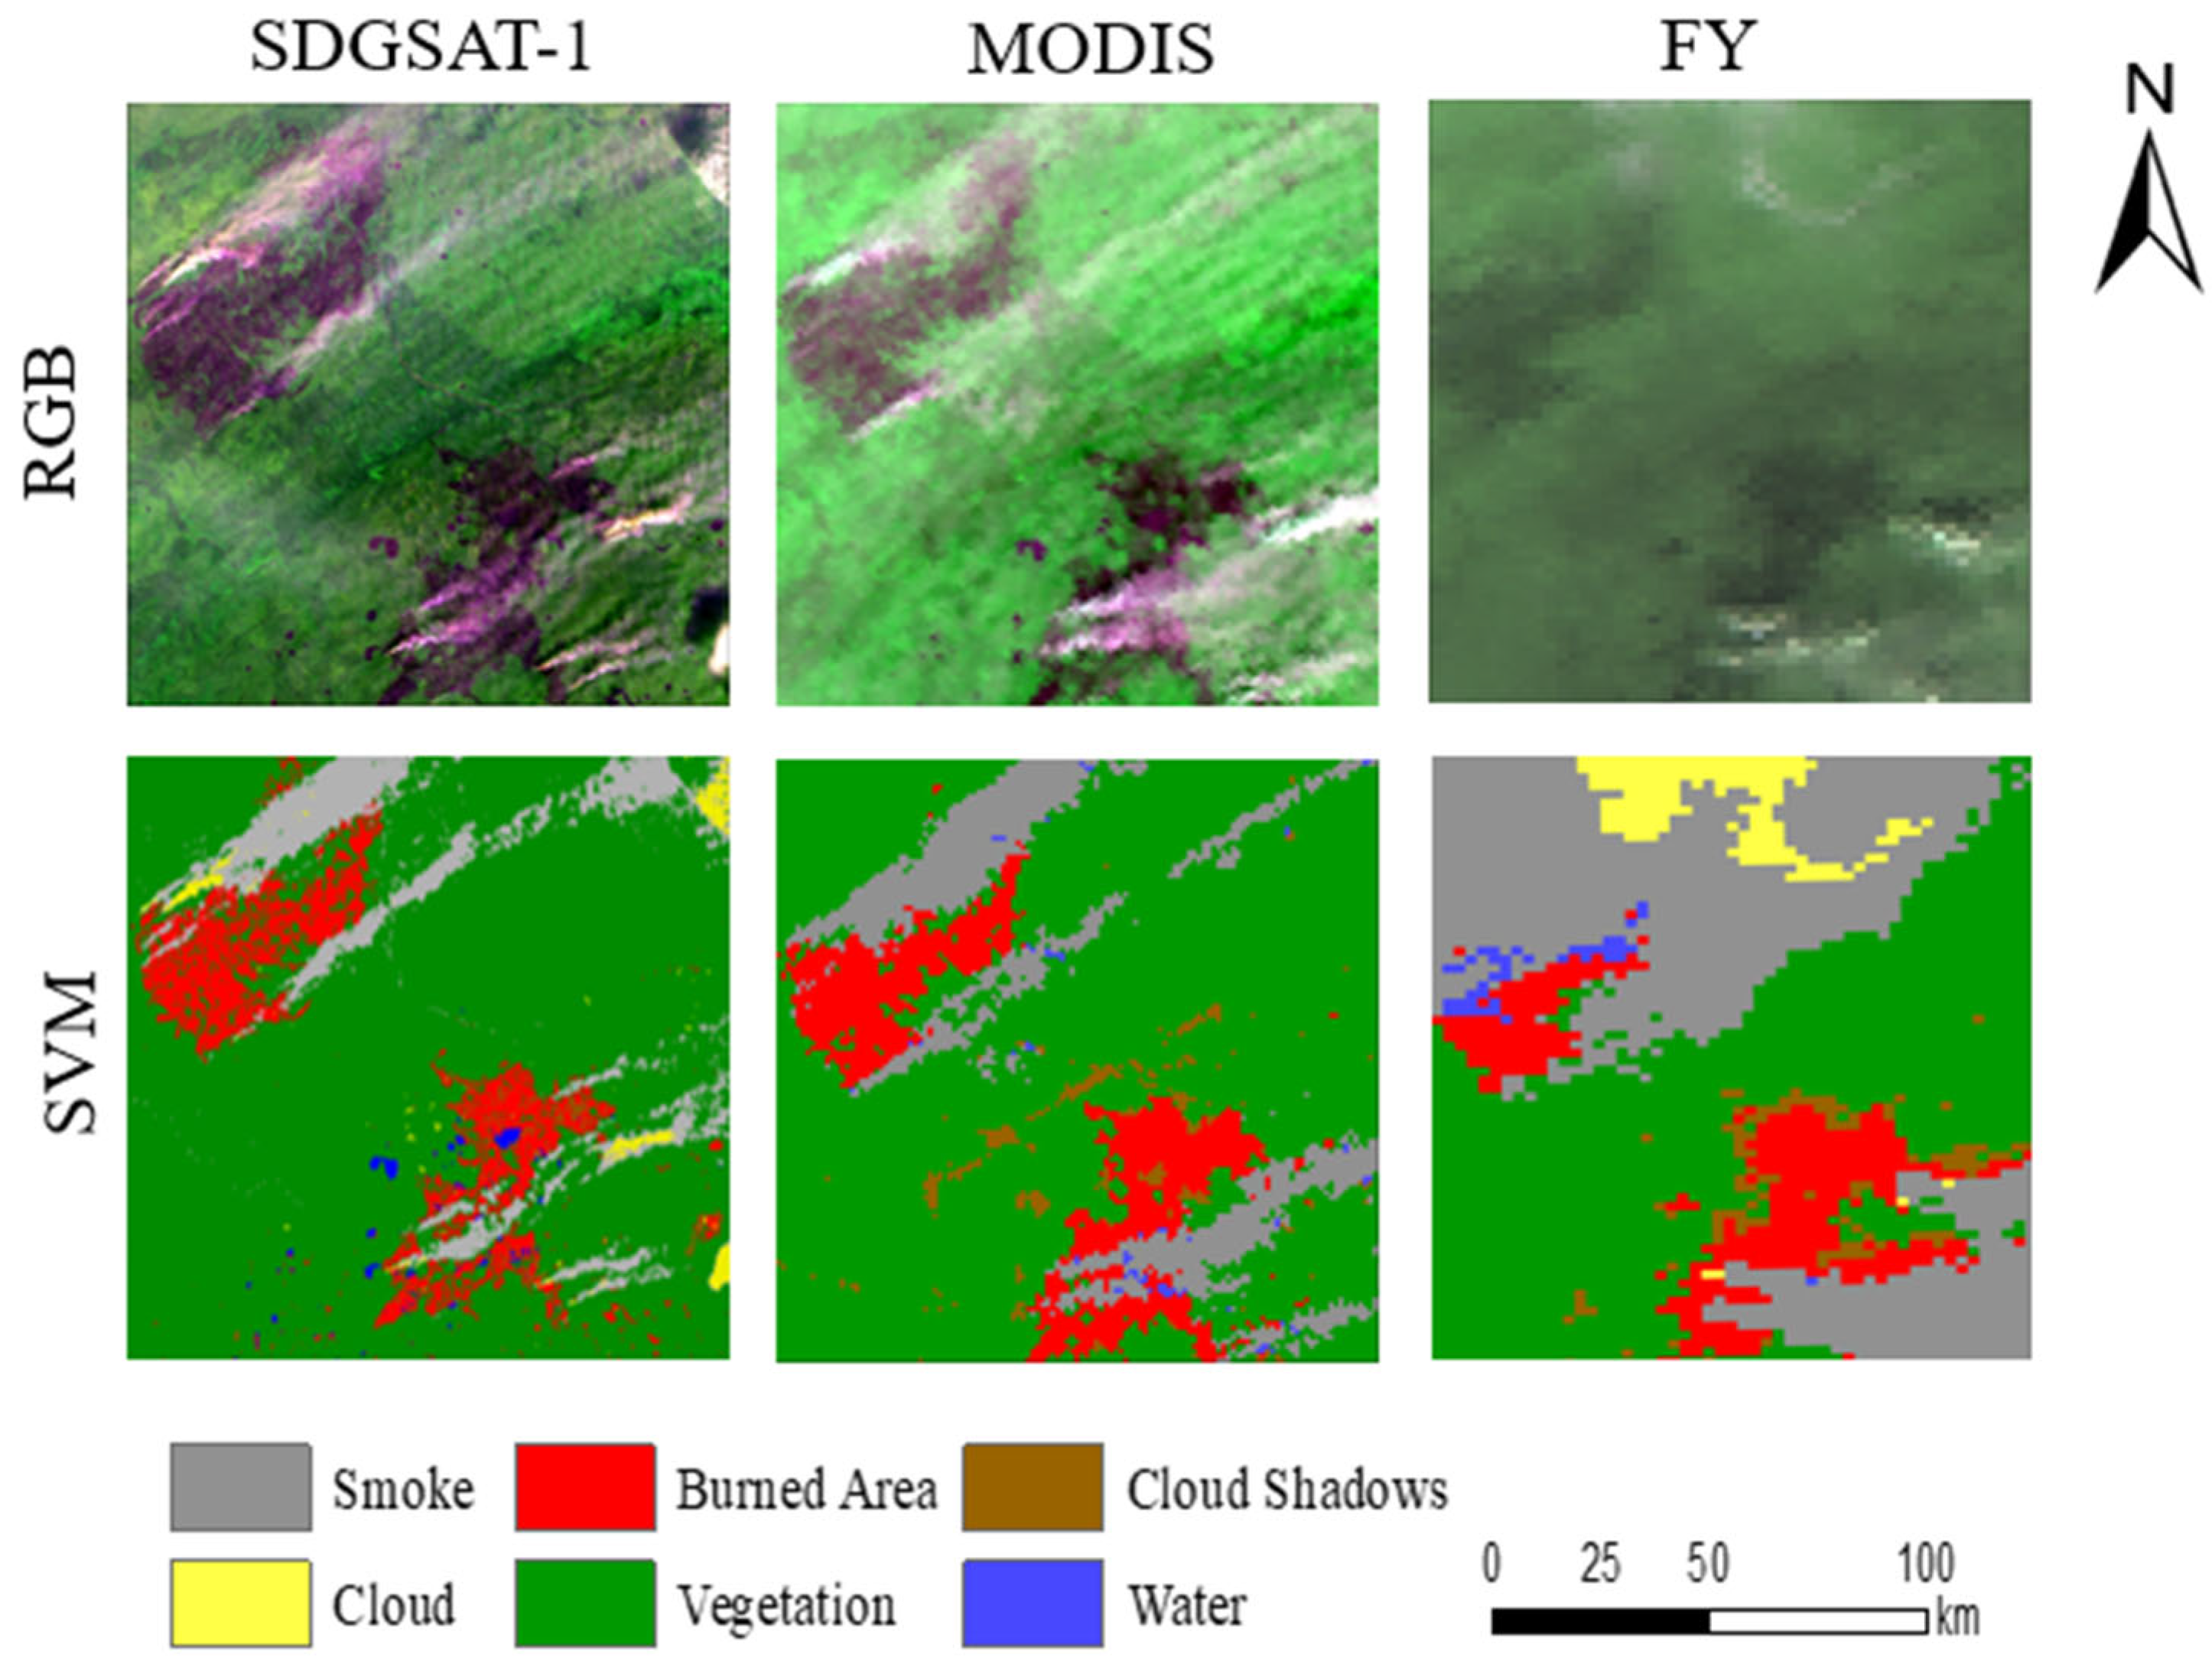
Although four supervised classifications were used, when identifying the smoke and the accuracy was compared, SVM was optimum (Figure 5). Due to the diverse data sources and differences in temporal acquisition, the Landsat8 image is six days earlier than those of SDGSAT-1, while the Sentinel-2 image is one day later than SDGSAT-1, thus, the comparison is not very sensible for smoke detection. MODIS and FY-3D images are acquired after the SDGSAT-1 image. Therefore, MODIS and FY-3D are used as benchmarks for smoke detection to extract the intersecting area between the SDGSAT-1 image and the benchmark. The intersection area is then compared with the SDGSAT-1 area to evaluate the recognition accuracy. The comparison results show that accuracy improves with higher spatial resolution, with MODIS achieving an accuracy of 81.62%, which is higher than FY-3D’s accuracy of 74.01%. SDGSAT-1 shows relatively limited performance in distinguishing thin clouds from smoke, with an average smoke detection accuracy of only 81.72%.
In general, SDGSAT-1 offers high spatial resolution and a wide range of spectral bands. It is capable of accurately extracting burned areas and delineating clear burned boundaries. However, for smoke detection, some misclassifications occur. Validation against other benchmarks shows that the average accuracy for burned area detection is 95.46%. The average accuracy for smoke detection is 81.72%. These results highlight the high applicability of SDGSAT-1, making it a valuable data source for identifying both burned areas and smoke.

3.3. Performance of Fire Points

The SDGSAT-1 fire points are identified using both the fixed-threshold method and the two-channel fixed-threshold plus contextual approach, while MODIS and FY-3D employ the two-channel fixed-threshold plus contextual approach. These fire points are then compared with the fire burned area identified by Sentinel-2 using the NBR2 method, which is considered the most accurate representation of the true burned area due to the timing of the Sentinel-2 satellite image, acquired after other satellites. The accuracy of the SDGSAT-1 fixed-threshold method in correctly identifying fire points is 91.10%. The accuracy of the two-channel fixed-threshold plus contextual approach for identifying fire points is 97.40% for SDGSAT-1, 97.67% for MODIS, and 97.62% for FY-3D. It is evident that while SDGSAT-1 can quickly detect fire points using the fixed-threshold method, it results in a higher number of false fire points. The two-channel fixed-threshold plus contextual approach not only reduces the fire point area (1.5534) to one-tenth of the area identified by the fixed-threshold method (17.5887), but also achieves fire point recognition accuracy comparable to MODIS and FY-3D. As shown in Figure 6, visual inspection reveals that both methods identify fire points at the origin of the smoke. However, the two-channel fixed-threshold plus contextual approach more accurately identifies fire points, especially those that are located within the fire points identified by the fixed-threshold method. The two-channel fixed-threshold plus contextual approach provides a more precise delineation of the location of each fire point. This demonstrates the potential of the two-channel fixed-threshold plus contextual approach for accurate fire point identification.

4. Discussion

This study demonstrates that SDGSAT-1 data effectively detects smoke, fire points, and burned areas through various classification and threshold methods, making it a promising data source for wildfire monitoring. The proposed approaches can be integrated into existing management frameworks to improve situational awareness and decision-making, especially in data-scarce or remote areas. SDGSAT-1 correctly identified fire points with 91.10% accuracy using a fixed-threshold method, and its performance improved with a two-channel threshold plus contextual techniques. Burned area detection reached 95.46% accuracy, while smoke detection achieved 81.72%. The latter may be influenced by temporal mismatches between sensors, as smoke plumes are highly dynamic. Despite selecting scenes with minimal time gaps, some discrepancies remained, potentially causing area over- or underestimation. Future work could mitigate this by using satellites with near-simultaneous overpasses, integrating high-temporal-resolution geostationary data (e.g., Himawari-8, GOES-16), or applying spatiotemporal fusion and motion estimation models to improve cross-sensor reliability.
In SDGSAT-1 classification, distinguishing water bodies from burned areas and thin smoke from clouds remains challenging; for effective smoke early warning, detecting smaller and thinner smoke is preferable. Additionally, deep learning models such as Convolutional Neural Networks (CNNs) and Visual Deformers could further validate the smoke detection capability [55]. The accuracy of fire point detection can be improved, and distinguishing thin smoke from clouds can be enhanced. This study examined long-wave infrared for burned area detection. While unsuitable for short-wave infrared indices (e.g., NBR2, MIRBI), its single band effectively identified burned areas. Compared with other satellites’ short-wave infrared data, SDGSAT-1 showed strong potential, capturing scattered, undamaged areas in greater detail. However, the burned area detection accuracy was not fully validated, as comparing the detected burned area with higher-precision data or field survey results after the fire was completely extinguished would provide more convincing evidence [56]. For burned area matching, multi-source satellites were only aligned to a unified coordinate system without geometric registration. Geometric deviations and intersecting angles between MODIS images may inflate accuracy when overlaps are counted as matches.
SDGSAT-1’s low-orbit characteristics limit data acquisition time, making temporal and spatial synchronization essential. Future work could adopt multi-satellite coordination to combine strengths for higher resolution, wider coverage, and improved wildfire monitoring. Deploying more low-orbit satellites in a constellation would further enhance precision, efficiency, and enable all-weather, real-time global observation. SDGSAT-1 GIU panchromatic (10 m) and color low-light (40 m) data pioneer a color low-light detection mode. Compared to mid-wave infrared, the low-light channel is more sensitive to fire points. Although this study did not focus on its use, the full-color low-light channel has high potential, and the satellite supports all-weather fire point detection.
MODIS is primarily used for wildfire detection and monitoring, especially for real-time tracking of fire hotspots globally, but it is mainly used for identifying large fires [57]. The minimum detectable area by MODIS is 50 m2, but its detection resolution is still relatively coarse [58]. SDGSAT-1 combines high spatial resolution, thermal sensitivity, and global coverage, enabling precise detection of small fires and accurate extraction of fire points and burned areas. Advances in remote sensing, such as VIIRS’s finer resolution and higher radiometric sensitivity compared to MODIS, have further improved small and low-temperature fire detection [59]. Launched in 2021, SDGSAT-1 offers up to 30 m resolution and long-wave infrared imaging, enabling effective burned area detection and post-fire change tracking. Its multi-sensor capability supports detailed fire evolution analysis and pre- and post-fire landscape monitoring. Sentinel-2, with a 10–20 m resolution and a five-day revisit cycle, is widely used for burned area mapping, vegetation loss estimation, and post-disaster ecological evaluation [44]. Upcoming missions like TRISHNA (CNES/ISRO, 2025) will deliver high-resolution thermal infrared data with frequent revisits for better monitoring of land surface temperature and fire dynamics. Planned constellations such as FireSat aim for near-real-time global fire coverage, enhancing operational wildfire early warning and response. Landsat 8, equipped with the Thermal Infrared Sensor (TIRS), provides high-resolution imagery that can precisely monitor the location and timing of fire events [18]. Landsat 8 data is suitable for long-term monitoring of large-scale fires, particularly excelling in post-fire ecological recovery and burned area analysis [35]. Landsat 8’s multi-temporal imagery allows for a detailed analysis of environmental changes before and after a fire [60], with its time-series data being especially valuable for evaluating ecological shifts.
Supervised classification, spectral indices, and fixed-threshold methods are widely used in wildfire detection but face limitations such as dependence on high-quality samples, spectral confusion, seasonal and atmospheric sensitivity, and low adaptability. Robustness could be improved through multi-temporal data, deep learning, adaptive thresholds, and field validation. SDGSAT-1 achieves high accuracy in burned area and fire point detection, with particularly strong burned area performance, though challenges remain in distinguishing smoke from water bodies. Future advances in deep learning and multi-satellite coordination could further enhance detection accuracy, timeliness, and global monitoring capacity.

5. Conclusions

In this study, the fixed-threshold method and the two-channel fixed-threshold plus contextual approach are used to extract fire points. The fixed-threshold method is based on experience, and there are some misjudgments of fire points. The thermal infrared band is introduced into the two-channel fixed-threshold plus contextual approach, which reduces the number of false fire points and makes the fire point discrimination finer. The minimum recognition fire area is 0.0009 km2. SDGSAT-1 can be used as an effective supplement to the data of Landsat and Sentinel-2. The SDGSAT-1 burned area identification has obtained a clear boundary, which provides a basis for disaster assessment and post-disaster repair. However, it is feasible to judge the position of the fire point and the trend of the fire field according to the direction of smoke dispersion after the fire. The minimum area for fire point identification can reach 0.0009 km2, and the shielding effect of thin smoke on fire point identification is small. SDGSAT-1 has excellent potential for identifying small fires and minimal fires.
The SDGSAT-1 satellite data obtained through research can be realized before disaster warning, disaster monitoring, and post-disaster assessment of forest fires and provide new data sources for multi-source remote sensing images for forest fire monitoring. SVM has the highest accuracy of supervised classification for smoke matching, and NBR2 has the best performance in the identification of burned areas. The two-channel fixed-threshold plus contextual approach with the introduction of thermal infrared band fire points is more accurate than the fixed-threshold method, which proves that SDGSAT-1 can be used to monitor fire occurrence.

Author Contributions

J.Y., X.Z. and G.Z.: Conceptualization, methodology, software, investigation and writing—original draft preparation. W.Y., M.W., L.K., S.Y., W.W., W.K., Q.W. and Z.H.: validation, visualization, writing—review and editing. B.X.: supervision, project administration and funding. All authors have read and agreed to the published version of the manuscript.

Funding

This study was supported by Yunnan Provincial Science and Technology Plan Project (202503AP140004, 202505AO120055, 202301BD070001-245, 202501AT070244), National Natural Foundation Committee (Grant No. 32360392), National Forestry Science and Technology Promotion Project of China (Grant No. 2023133128), Yunnan Provincial Department of Education (Grant No. 05000/523003), Key Research and Development Project of Guangxi (Grant No. GuikeAB24010046), Yunnan Xingdian Talent Industry Innovation Project (Grant No. YFGRC202419), Yunnan Provincial Department of Education Postgraduate Tutor Team Project (503250109), Yunnan Provincial International Science and Technology Envoy Certification (202503AK140031).

Data Availability Statement

The raw data supporting the conclusions of this article will be made available by the authors on request.

Acknowledgments

We would like to acknowledge all the people who contributed to this paper. The research findings are a component of the SDGSAT-1 Open Science Program, which is conducted by the International Research Center of Big Data for Sustainable Development Goals (CBAS). The data utilized in this study is sourced from SDGSAT-1 and provided by CBAS.

Conflicts of Interest

The authors declare no conflicts of interest.

References

  1. Senande-Rivera, M.; Insua-Costa, D.; Miguez-Macho, G. Spatial and temporal expansion of global wildland fire activity in response to climate change. Nat. Commun. 2022, 13, 1208. [Google Scholar] [CrossRef]
  2. Pandey, P.; Huidobro, G.; Lopes, L.F.; Ganteaume, A.; Ascoli, D.; Colaco, C.; Xanthopoulos, G.; Giannaros, T.M.; Gazzard, R.; Boustras, G.; et al. A global outlook on increasing wildfire risk: Current policy situation and future pathways. Trees For. People 2023, 14, 100431. [Google Scholar] [CrossRef]
  3. Harrison, M.E.; Deere, N.J.; Imron, M.A.; Nasir, D.; Adul; Asti, H.A.; Soler, J.A.; Boyd, N.C.; Cheyne, S.M.; Collins, S.A.; et al. Impacts of fire and prospects for recovery in a tropical peat forest ecosystem. Proc. Natl. Acad. Sci. USA 2024, 121, e2307216121. [Google Scholar] [CrossRef]
  4. Menezes, I.C.; Lopes, D.; Fernandes, A.P.; Borrego, C.; Viegas, D.X.; Miranda, A.I. Atmospheric dynamics and fire-induced phenomena: Insights from a comprehensive analysis of the Sertã wildfire event. Atmos. Res. 2024, 310, 107649. [Google Scholar] [CrossRef]
  5. Shi, G.; Yan, H.; Zhang, W.; Dodson, J.; Heijnis, H.; Burrows, M. Rapid warming has resulted in more wildfires in northeastern Australia. Sci. Total Environ. 2021, 771, 144888. [Google Scholar] [CrossRef] [PubMed]
  6. Katagis, T.; Gitas, I.Z. Assessing the accuracy of MODIS MCD64A1 C6 and FireCCI51 burned area products in Mediterranean ecosystems. Remote Sens. 2022, 14, 602. [Google Scholar] [CrossRef]
  7. Katagis, T.; Gitas, I.Z. Accuracy estimation of two global burned area products at national scale. IOP Conf. Ser. Earth Environ. Sci. 2021, 932, 012001. [Google Scholar] [CrossRef]
  8. Peng, Y.; Su, H.; Sun, M.; Li, M. Reconstructing historical forest fire risk in the non-satellite era using the improved forest fire danger index and long short-term memory deep learning-a case study in Sichuan Province, southwestern China. For. Ecosyst. 2024, 11, 100170. [Google Scholar] [CrossRef]
  9. Niknejad, M.; Bernardino, A. Attention on classification for fire segmentation. In Proceedings of the 2021 20th IEEE International Conference on Machine Learning and Applications (ICMLA), Pasadena, CA, USA, 13–16 December 2021; IEEE: Piscataway, NJ, USA, 2022; pp. 616–621. [Google Scholar]
  10. Aral, R.A.; Zalluhoglu, C.; Akcapinar Sezer, E. Lightweight and attention-based CNN architecture for wildfire detection using UAV vision data. Int. J. Remote Sens. 2023, 44, 5768–5787. [Google Scholar] [CrossRef]
  11. Fu, Y.; Li, R.; Wang, X.; Bergeron, Y.; Valeria, O.; Chavardès, R.D.; Wang, Y.; Hu, J. Fire detection and fire radiative power in forests and low-biomass lands in Northeast Asia: MODIS versus VIIRS Fire Products. Remote Sens. 2020, 12, 2870. [Google Scholar] [CrossRef]
  12. Ghali, R.; Akhloufi, M.A. Deep learning approaches for wildland fires using satellite remote sensing data: Detection, mapping, and prediction. Fire 2023, 6, 192. [Google Scholar] [CrossRef]
  13. Shi, E.; Zhang, R.; Zeng, X.; Xin, Y.; Ju, E.; Ling, Z. Spectroscopy of Magnesium Sulfate Double Salts and Their Implications for Mars Exploration. Remote Sens. 2024, 16, 1592. [Google Scholar] [CrossRef]
  14. Wooster, M.J.; Roberts, G.J.; Giglio, L.; Roy, D.P.; Freeborn, P.H.; Boschetti, L.; Justice, C.; Ichoku, C.; Schroeder, W.; Davies, D.; et al. Satellite remote sensing of active fires: History and current status, applications and future requirements. Remote Sens. Environ. 2021, 267, 112694. [Google Scholar] [CrossRef]
  15. Xu, H.; Zhang, G.; Chu, R.; Zhang, J.; Yang, Z.; Wu, X.; Xiao, H. Detecting forest fire omission error based on data fusion at subpixel scale. Int. J. Appl. Earth Obs. 2024, 128, 103737. [Google Scholar] [CrossRef]
  16. Lv, L.-Y.; Cao, C.-F.; Qu, Y.-X.; Zhang, G.-D.; Zhao, L.; Cao, K.; Song, P.; Tang, L.-C. Smart fire-warning materials and sensors: Design principle, performances, and applications. Mat. Sci. Eng. R Rep. 2022, 150, 100690. [Google Scholar] [CrossRef]
  17. Yang, W.; Wu, M.; Kong, L.; Yin, X.; Wang, Y.; Zhang, C.; Wang, L.; Shu, Q.; Ye, J.; Li, S.; et al. A spatial weight sampling method integrating the spatiotemporal pattern enhances the understanding of the occurrence mechanism of wildfires in the southwestern mountains of China. For. Ecol. Manag. 2025, 585, 122619. [Google Scholar] [CrossRef]
  18. Ismanto, H.; Marfai, M.A. Classification tree analysis (Gini-Index) smoke detection using Himawari_8 satellite data over Sumatera-Borneo maritime continent Sout East Asia. IOP Conf. Ser. Earth Environ. Sci. 2019, 256, 012043. [Google Scholar] [CrossRef]
  19. Schroeder, W.; Oliva, P.; Giglio, L.; Quayle, B.; Lorenz, E.; Morelli, F. Active fire detection using Landsat-8/OLI data. Remote Sens. Environ. 2016, 185, 210–220. [Google Scholar] [CrossRef]
  20. Kganyago, M.; Shikwambana, L. Assessment of the characteristics of recent major wildfires in the USA, Australia and Brazil in 2018–2019 using multi-source satellite products. Remote Sens. 2020, 12, 1803. [Google Scholar] [CrossRef]
  21. Asakuma, K.; Kuze, H.; Takeuchi, N.; Yahagi, T. Detection of biomass burning smoke in satellite images using texture analysis. Atmos. Environ. 2002, 36, 1531–1542. [Google Scholar] [CrossRef]
  22. Christopher, S.A.; Kliche, D.V.; Chou, J.; Welch, R.M. First estimates of the radiative forcing of aerosols generated from biomass burning using satellite data. J. Geophys. Res-Atmos. 1996, 101, 21265–21273. [Google Scholar] [CrossRef]
  23. Li, X.; Wang, J.; Song, W.; Ma, J.; Telesca, L.; Zhang, Y. Automatic smoke detection in modis satellite data based on k-means clustering and fisher linear discrimination. Photogramm. Eng. Rem. Sens. 2014, 80, 971–982. [Google Scholar] [CrossRef]
  24. Zikiou, N.; Rushmeier, H.; Capel, M.I.; Kandakji, T.; Rios, N.; Lahdir, M. Remote Sensing and Machine Learning for Accurate Fire Severity Mapping in Northern Algeria. Remote Sens. 2024, 16, 1517. [Google Scholar] [CrossRef]
  25. Zhao, L.; Liu, J.; Peters, S.; Li, J.; Mueller, N.; Oliver, S. Learning class-specific spectral patterns to improve deep learning-based scene-level fire smoke detection from multi-spectral satellite imagery. Remote Sens. Appl. 2024, 34, 101152. [Google Scholar] [CrossRef]
  26. Cuomo, V.; Lasaponara, R.; Tramutoli, V. Evaluation of a new satellite-based method for forest fire detection. Int. J. Remote Sens. 2001, 22, 1799–1826. [Google Scholar] [CrossRef]
  27. Engel, C.B.; Jones, S.D.; Reinke, K. A seasonal-window ensemble-based thresholding technique used to detect active fires in geostationary remotely sensed data. IEEE Trans. Geosci. Remote 2020, 59, 4947–4956. [Google Scholar] [CrossRef]
  28. Hua, L.; Shao, G. The progress of operational forest fire monitoring with infrared remote sensing. J. For. Res. 2017, 28, 215–229. [Google Scholar] [CrossRef]
  29. Duane, A.; Moghli, A.; Coll, L.; Vega, C. On the evidence of contextually large fires in Europe based on return period functions. Appl. Geogr. 2025, 176, 103539. [Google Scholar] [CrossRef]
  30. Giglio, L.; Descloitres, J.; Justice, C.O.; Kaufman, Y.J. An enhanced contextual fire detection algorithm for MODIS. Remote Sens. Environ. 2003, 87, 273–282. [Google Scholar] [CrossRef]
  31. Roberts, G.; Wooster, M.J. Development of a multi-temporal Kalman filter approach to geostationary active fire detection & fire radiative power (FRP) estimation. Remote Sens. Environ. 2014, 152, 392–412. [Google Scholar]
  32. Giglio, L.; Csiszar, I.; Restás, Á.; Morisette, J.T.; Schroeder, W.; Morton, D.; Justice, C.O. Active fire detection and characterization with the advanced spaceborne thermal emission and reflection radiometer (ASTER). Remote Sens. Environ. 2008, 112, 3055–3063. [Google Scholar] [CrossRef]
  33. Schroeder, W.; Prins, E.; Giglio, L.; Csiszar, I.; Schmidt, C.; Morisette, J.; Morton, D. Validation of GOES and MODIS active fire detection products using ASTER and ETM+ data. Remote Sens. Environ. 2008, 112, 2711–2726. [Google Scholar] [CrossRef]
  34. Bastarrika, A.; Alvarado, M.; Artano, K.; Martinez, M.P.; Mesanza, A.; Torre, L.; Ramo, R.; Chuvieco, E. BAMS: A tool for supervised burned area mapping using Landsat data. Remote Sens. 2014, 6, 12360–12380. [Google Scholar] [CrossRef]
  35. Stroppiana, D.; Azar, R.; Calò, F.; Pepe, A.; Imperatore, P.; Boschetti, M.; Silva, J.M.N.; Brivio, P.A.; Lanari, R. Integration of optical and SAR data for burned area mapping in Mediterranean Regions. Remote Sens. 2015, 7, 1320–1345. [Google Scholar] [CrossRef]
  36. Chuvieco, E.; Roteta, E.; Sali, M.; Stroppiana, D.; Boettcher, M.; Kirches, G.; Storm, T.; Khairoun, A.; Pettinari, M.L.; Franquesa, M.; et al. Building a small fire database for Sub-Saharan Africa from Sentinel-2 high-resolution images. Sci. Total Environ. 2022, 845, 157139. [Google Scholar] [CrossRef]
  37. Pérez, C.C.; Olthoff, A.E.; Hernández-Trejo, H.; Rullán-Silva, C.D. Evaluating the best spectral indices for burned areas in the tropical Pantanos de Centla Biosphere Reserve, Southeastern Mexico. Remote Sens. Appl. 2022, 25, 100664. [Google Scholar] [CrossRef]
  38. Roteta, E.; Bastarrika, A.; Padilla, M.; Storm, T.; Chuvieco, E. Development of a Sentinel-2 burned area algorithm: Generation of a small fire database for sub-Saharan Africa. Remote Sens. Environ. 2019, 222, 1–17. [Google Scholar] [CrossRef]
  39. Guo, H.; Chen, F.; Sun, Z.; Liu, J.; Liang, D. Big Earth Data: A practice of sustainability science to achieve the Sustainable Development Goals. Sci. Bull. 2021, 66, 1050–1053. [Google Scholar] [CrossRef] [PubMed]
  40. Guo, H.; Dou, C.; Chen, H.; Liu, J.; Fu, B.; Li, X.; Zou, Z.; Liang, D. SDGSAT-1, the world’s first scientific satellite for sustainable development goals. Sci. Bull. 2023, 68, 34–38. [Google Scholar] [CrossRef] [PubMed]
  41. Jia, M.; Zeng, H.; Chen, Z.; Wang, Z.; Ren, C.; Mao, D.; Zhao, C.; Zhang, R.; Wang, Y. Nighttime light in China’s coastal zone: The type classification approach using SDGSAT-1 Glimmer Imager. Remote Sens. Environ. 2024, 305, 114104. [Google Scholar] [CrossRef]
  42. Yin, Z.; Chen, F.; Dou, C.; Wu, M.; Niu, Z.; Wang, L.; Xu, S. Identification of illumination source types using nighttime light images from SDGSAT-1. Int. J. Digit. Earth 2024, 17, 2297013. [Google Scholar] [CrossRef]
  43. Lin, Z.; Jiao, W.; Liu, H.; Long, T.; Liu, Y.; Wei, S.; He, G.; Portnov, B.A.; Trop, T.; Liu, M.; et al. Modelling the public perception of urban public space lighting based on SDGSAT-1 glimmer imagery: A case study in Beijing, China. Sustain. Cities Soc. 2023, 88, 104272. [Google Scholar] [CrossRef]
  44. Li, C.; Chen, F.; Wang, N.; Yu, B.; Wang, L. SDGSAT-1 nighttime light data improve village-scale built-up delineation. Remote Sens. Environ. 2023, 297, 113764. [Google Scholar] [CrossRef]
  45. Zhao, Z.; Qiu, S.; Chen, F.; Chen, Y.; Qian, Y.; Cui, H.; Zhang, Y.; Khoramshahi, E.; Qiu, Y. Vessel detection with SDGSAT-1 nighttime light images. Remote Sens. 2023, 15, 4354. [Google Scholar] [CrossRef]
  46. Bot, K.; Borges, J.G. A systematic review of applications of machine learning techniques for wildfire management decision support. Inventions 2022, 7, 15. [Google Scholar] [CrossRef]
  47. Jain, P.; Coogan, S.C.; Subramanian, S.G.; Crowley, M.; Taylor, S.; Flannigan, M.D. A review of machine learning applications in wildfire science and management. Environ Rev. 2020, 28, 478–505. [Google Scholar] [CrossRef]
  48. Mountrakis, G.; Im, J.; Ogole, C. Support vector machines in remote sensing: A review. ISPRS J. Photogramm. Remote Sens. 2011, 66, 247–259. [Google Scholar] [CrossRef]
  49. Belgiu, M.; Drăguţ, L. Random forest in remote sensing: A review of applications and future directions. ISPRS J. Photogramm. Remote Sens. 2016, 114, 24–31. [Google Scholar] [CrossRef]
  50. Pal, M.; Mather, P.M. An assessment of the effectiveness of decision tree methods for land cover classification. Remote Sens. Environ. 2003, 86, 554–565. [Google Scholar] [CrossRef]
  51. Garcia-Pedrero, A.; Gonzalo-Martin, C.; Lillo-Saavedra, M. A machine learning approach for agricultural parcel delineation through agglomerative segmentation. Int. J. Remote Sens. 2017, 38, 1809–1819. [Google Scholar] [CrossRef]
  52. Giglio, L.; Schroeder, W.; Justice, C.O. The collection 6 MODIS active fire detection algorithm and fire products. Remote Sens. Environ. 2016, 178, 31–41. [Google Scholar] [CrossRef] [PubMed]
  53. Dixon, D.J.; Callow, J.N.; Duncan, J.M.A.; Setterfield, S.A.; Pauli, N. Regional-scale fire severity mapping of Eucalyptus forests with the Landsat archive. Remote Sens. Environ. 2022, 270, 112863. [Google Scholar] [CrossRef]
  54. Gibson, R.; Danaher, T.; Hehir, W.; Collins, L. A remote sensing approach to mapping fire severity in south-eastern Australia using sentinel 2 and random forest. Remote Sens. Environ. 2020, 240, 111702. [Google Scholar] [CrossRef]
  55. Jing, Z.; Li, S.; Hu, X.; Tang, F. Sub-pixel accuracy evaluation of FY-3D MERSI-2 geolocation based on OLI reference imagery. Int. J. Remote Sens. 2021, 42, 7215–7238. [Google Scholar] [CrossRef]
  56. Llorens, R.; Sobrino, J.A.; Fernández, C.; Fernández-Alonso, J.M.; Vega, J.A. A methodology to estimate forest fires burned areas and burn severity degrees using Sentinel-2 data. Application to the October 2017 fires in the Iberian Peninsula. Int. J. Appl. Earth Obs. 2021, 95, 102243. [Google Scholar] [CrossRef]
  57. Hantson, S.; Padilla, M.; Corti, D.; Chuvieco, E. Strengths and weaknesses of MODIS hotspots to characterize global fire occurrence. Remote Sens. Environ. 2013, 131, 152–159. [Google Scholar] [CrossRef]
  58. Zeng, L.; Wardlow, B.D.; Hu, S.; Zhang, X.; Zhou, G.; Peng, G.; Xiang, D.; Wang, R.; Meng, R.; Wu, W. A novel strategy to reconstruct NDVI time-series with high temporal resolution from MODIS multi-temporal composite products. Remote Sens. 2021, 13, 1397. [Google Scholar] [CrossRef]
  59. Román, M.O.; Justice, C.; Paynter, I.; Boucher, P.B.; Devadiga, S.; Endsley, A.; Erb, A.; Friedl, M.; Gao, H.; Giglio, L.; et al. Continuity between NASA MODIS Collection 6.1 and VIIRS Collection 2 land products. Remote Sens. Environ. 2024, 302, 113963. [Google Scholar] [CrossRef]
  60. Roy, D.P.; Huang, H.; Boschetti, L.; Giglio, L.; Yan, L.; Zhang, H.H.; Li, Z. Landsat-8 and Sentinel-2 burned area mapping-A combined sensor multi-temporal change detection approach. Remote Sens. Environ. 2019, 231, 111254. [Google Scholar] [CrossRef]
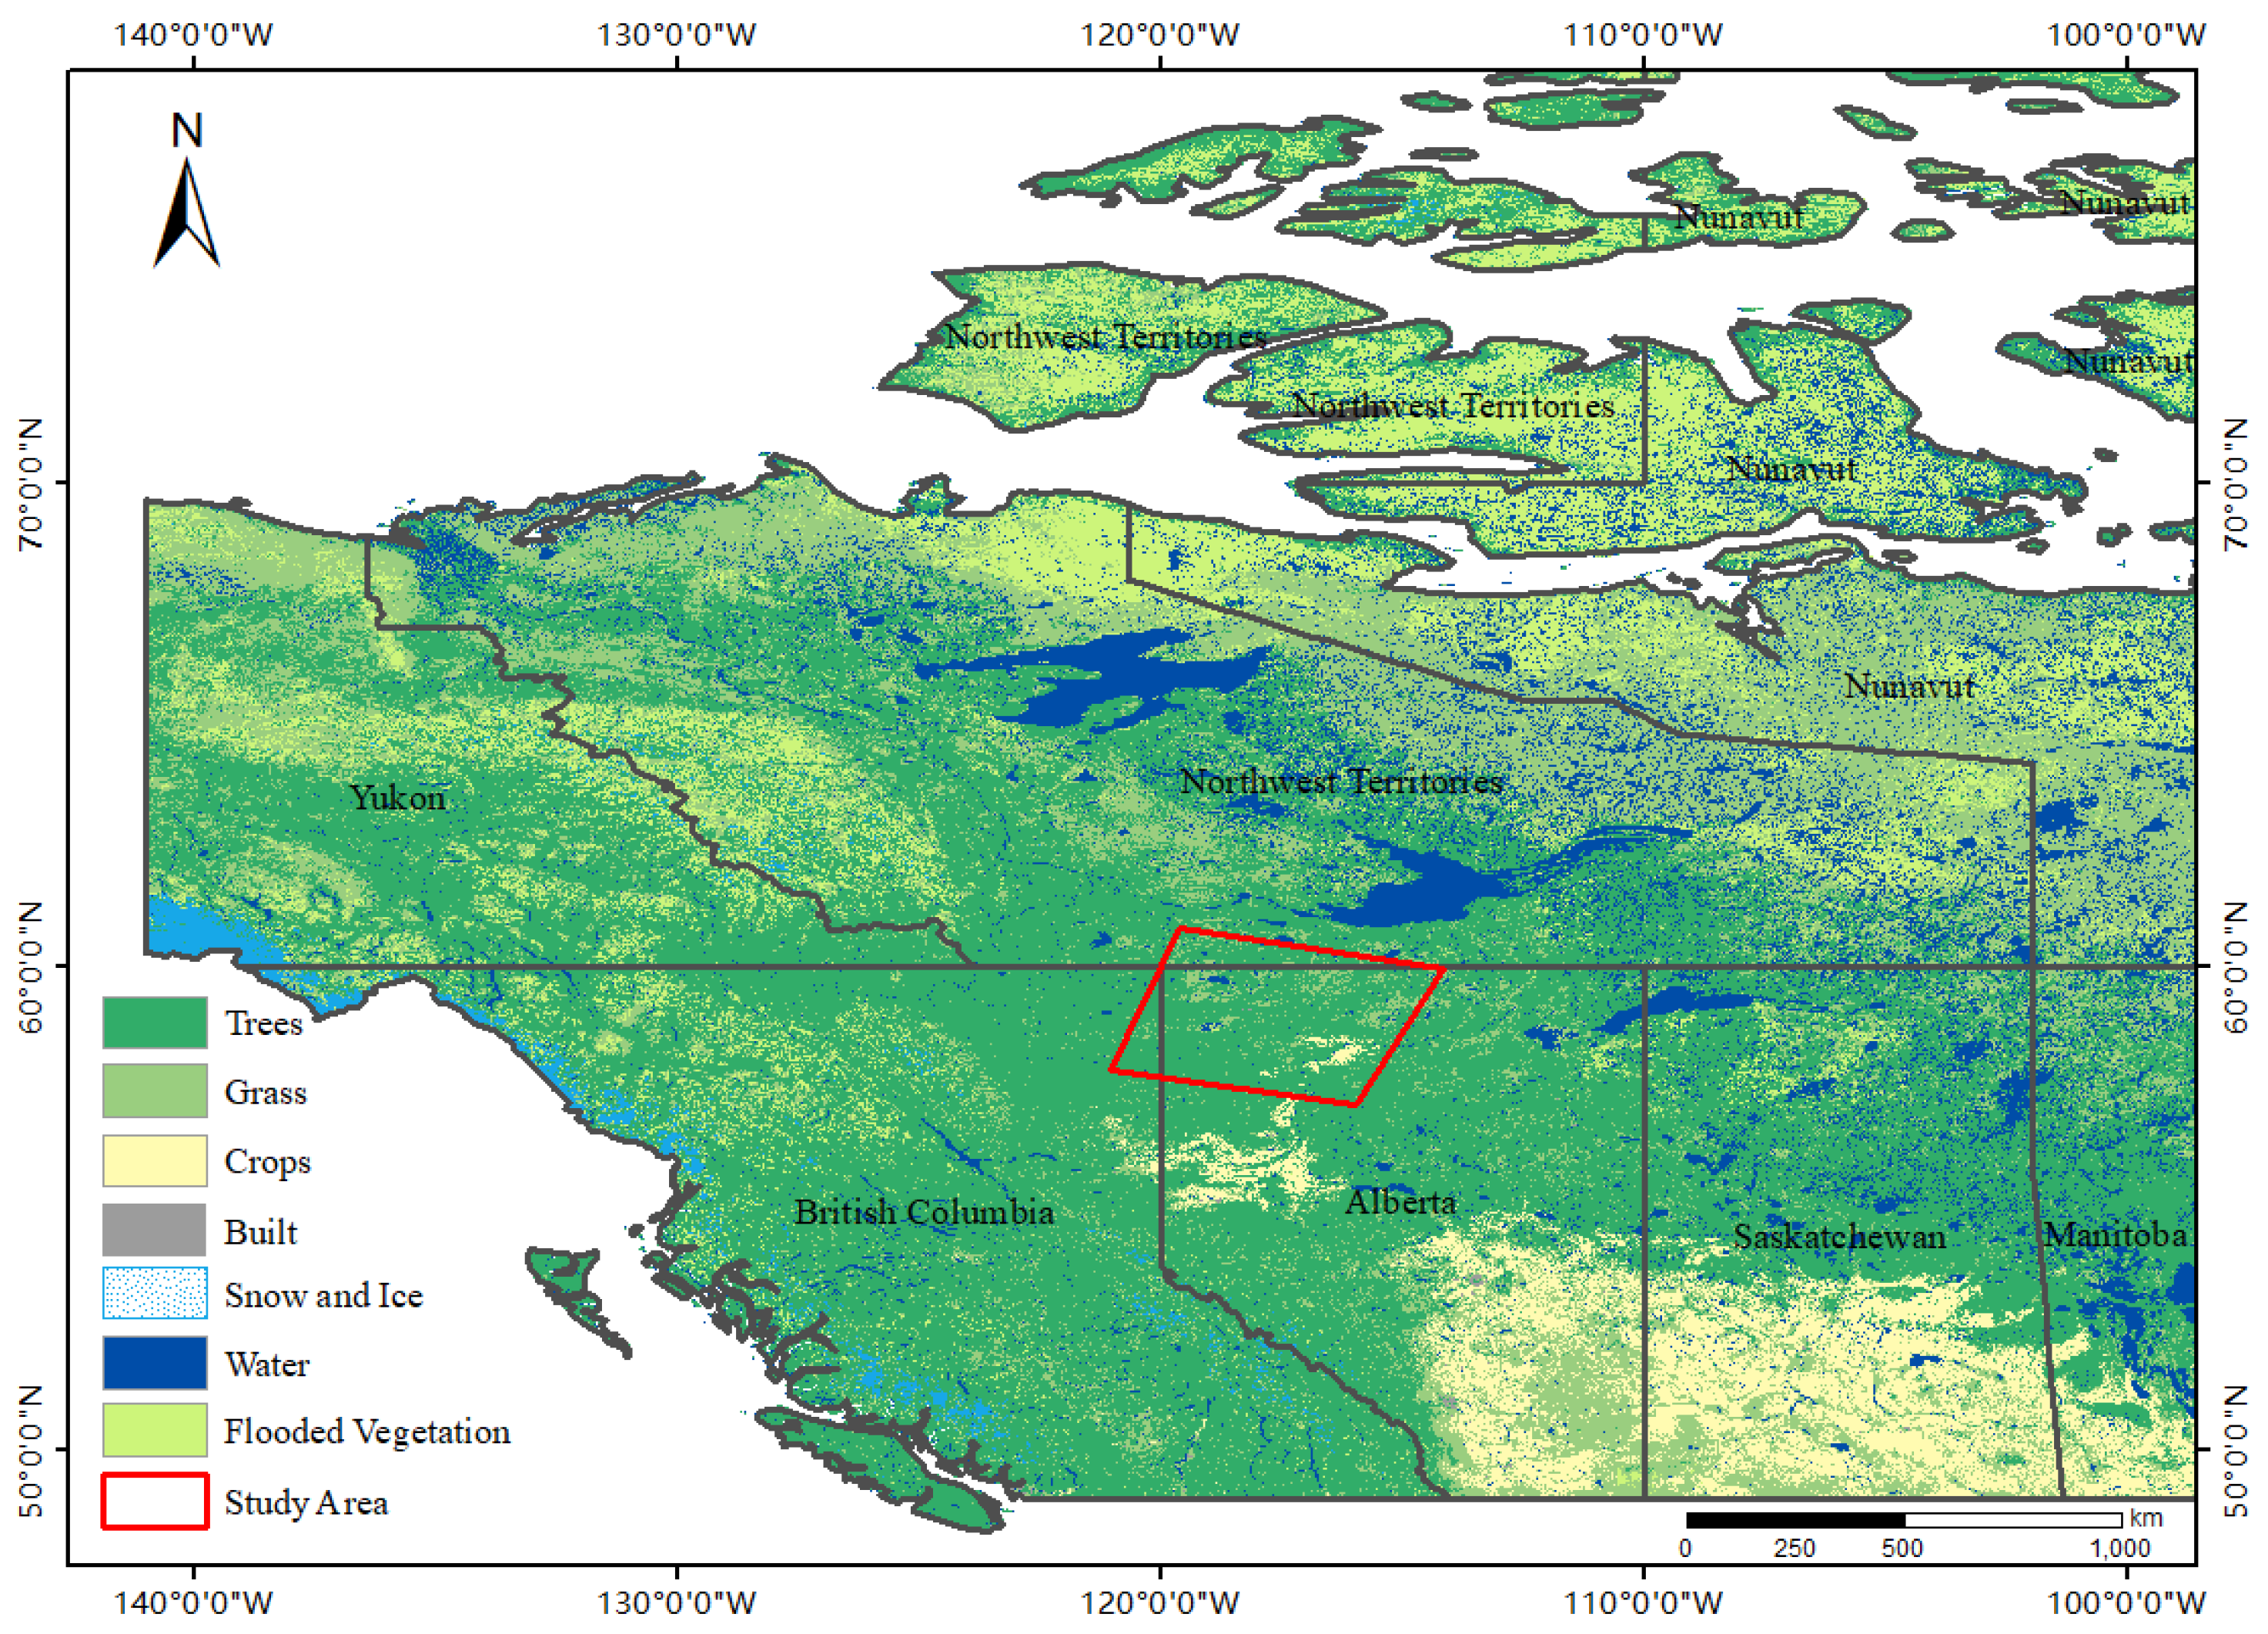
Figure 1. Location of study area.
Remotesensing 17 03339 g001
Figure 2. Flowchart.
Remotesensing 17 03339 g002
Figure 3. Classification results. (a) Randon Forest Classification: Accuracy vs. Kappa Coefficient (b) SVM Classification: Accuracy vs. Kappa Coefficient (c) Neural Net Classification: Accuracy vs. Kappa Coefficient (d) Maxlike: Accuracy vs. Kappa Coefficient.
Remotesensing 17 03339 g003
Figure 4. Comparison map of burned area. (a) RGB image (b) SVM can extract the burned area mask (c) NBR2 can extract the burned area mask (d) MIRBI can extract the burned area mask.
Remotesensing 17 03339 g004
Figure 5. Comparison map of smoke.
Remotesensing 17 03339 g005
Figure 6. Fire point analysis.
Remotesensing 17 03339 g006
Table 1. Description of satellite data.
DataSpatial
Resolution
Data SourcesAcquisition Data (UTC)
SDGSAT-110 mInternational Research Center of Big Data for Sustainable Development Goals
http://www.sdgsat.ac.cn
27 August 2023
Sentinel-220 mCopernicus Data Space
https://dataspace.copernicus.eu/
28 August 2023
Landsat830 mU.S. Geological Survey
https://earthexplorer.usgs.gov/
21 August 2023
MODIS500 mNational Aeronautics and Space Administration’s
https://ladsweb.modaps.eosdis.nasa.gov
27 August 2023
FY-3D1000 mFENGYUN Satellite Data Center
https://satellite.nsmc.org.cn/
27 August 2023
Table 2. SDGSAT-1 MII radiometric calibration coefficient.
BandGainBias
B10.0515601330
B20.0362413530
B30.0233168350
B40.0158496660
B50.0160963810
B60.0197190390
B70.0138114580
Table 3. SDGSAT-1 TIS radiometric calibration coefficient.
BandGainBias
B10.0039470.167126
B20.0039460.124522
B30.0053290.222530
Table 4. Sun–Earth distance (astronomical unit).
Julian DayDistanceJulian DayDistance
10.98321961.0165
150.98362131.0149
320.98532271.0128
460.98782421.0092
600.99092581.0057
740.99452741.0011
910.99932880.9972
1061.00333050.9925
1211.00763190.9892
1351.01093350.9860
1521.01403490.9843
1661.01583650.9833
1821.0167--
Note: The Julian day is the serial number of the date in the year. For example, the Julian day on January 1 is 1, the Julian day on December 31 is 365, and the leap year is 366.
Table 5. Accuracy of burned area.
AccuracySDGSAT/
Sentinel-2 (%)
SDGSAT/
Landsat8 (%)
SDGSAT/
MODIS (%)
SDGSAT/
FY-3D (%)
SVM99.5896.9588.7577.31
NBR299.3995.1896.7692.23
MIRBI98.2694.9589.3778.25
Disclaimer/Publisher’s Note: The statements, opinions and data contained in all publications are solely those of the individual author(s) and contributor(s) and not of MDPI and/or the editor(s). MDPI and/or the editor(s) disclaim responsibility for any injury to people or property resulting from any ideas, methods, instructions or products referred to in the content.