Abstract
Precise spatial localization of broadleaf species is crucial for efficient forest management and ecological studies. This study presents an advanced approach for segmenting and classifying broadleaf tree species, including Japanese oak (Quercus crispula), in mixed forests using multi-spectral imagery captured by unmanned aerial vehicles (UAVs) and deep learning. High-resolution UAV images, including RGB and NIR bands, were collected from two study sites in Hokkaido, Japan: Sub-compartment 97g in the eastern region and Sub-compartment 68E in the central region. A Mask Region-based Convolutional Neural Network (Mask R-CNN) framework was employed to recognize and classify single tree crowns based on annotated training data. The workflow incorporated UAV-derived imagery and crown annotations, supporting reliable model development and evaluation. Results showed that combining multi-spectral bands (RGB and NIR) with canopy height model (CHM) data significantly improved classification performance at both study sites. In Sub-compartment 97g, the RGB + NIR + CHM achieved a precision of 0.76, recall of 0.74, and F1-score of 0.75, compared to 0.73, 0.74, and 0.73 using RGB alone; 0.68, 0.70, and 0.66 with RGB + NIR; and 0.63, 0.67, and 0.63 with RGB + CHM. Similarly, at Sub-compartment 68E, the RGB + NIR + CHM attained a precision of 0.81, recall of 0.78, and F1-score of 0.80, outperforming RGB alone (0.79, 0.79, 0.78), RGB + NIR (0.75, 0.74, 0.72), and RGB + CHM (0.76, 0.75, 0.74). These consistent improvements across diverse forest conditions highlight the effectiveness of integrating spectral (RGB and NIR) and structural (CHM) data. These findings underscore the value of integrating UAV multi-spectral imagery with deep learning techniques for reliable, large-scale identification of tree species and forest monitoring.
1. Introduction
Mixed forests, composed of both broadleaf and conifer species, play a vital role in ecosystem functioning, biodiversity conservation [] and carbon sequestration []. Accurately identifying and mapping individual tree species within such forests is essential for sustainable forest management, timber resource assessment, and ecological research [,]. While previous studies have effectively focused on conifer species identification due to their relatively uniform crown structures and spectral characteristics, significant challenges remain in detecting and classifying broadleaf species [,,,]. However, broadleaf species exhibit significant height variation within their crown structure, often featuring multiple smaller peaks within a single crown, which complicates individual tree detection [,].
Traditional field-based surveys are often inefficient for large-scale forest monitoring because they are labor-intensive, time-consuming, and limited in spatial coverage—particularly in dense or remote forest areas [,]. Additionally, these surveys may involve a degree of subjectivity [], as they often rely on visual interpretation and expert judgment, which can lead to inconsistencies in species identification. In contrast, remote sensing techniques, such as aerial photography and other high-resolution remote sensing imagery, provide greater spatial consistency and broader coverage [,], although their high costs and logistical complexity may limit their widespread application [,]. Recently, unmanned aerial vehicles (UAVs) equipped with various sensors have emerged as valuable tools for forest management and monitoring, offering flexible, high-resolution data at lower cost [,,,].
UAVs with multi-spectral sensors offer a cost-effective and high-resolution alternative to conventional forest monitoring techniques [,]. Unlike satellite imagery, UAVs provide flexible data acquisition with finer spatial detail, allowing for the better differentiation of tree species according to their spectral reflectance properties. Multi-spectral data, capturing wavelengths beyond the visible spectrum [], e.g., Near-Infrared (NIR), enhances the ability to distinguish between species with similar visual characteristics [].
Recent developments in deep learning have resulted in notable improvements in classifying tree species using remote sensing data. Convolutional Neural Networks (CNNs) and instance segmentation models [,,,,,], particularly Mask Region-based Convolutional Neural Network (Mask R-CNN) have shown great potential in automatically detecting and identifying individual tree species [,,]. Mask R-CNN is especially applicable due to its ability to integrate both spatial structure and spectral patterns from high-resolution UAV imagery. This is particularly valuable in mixed conifer-broadleaf forests, where morphological and spectral characteristics vary significantly among tree species. By training on multiple inputs such as RGB, NIR, CHM [,], Mask R-CNN can learn species-specific crown features, including shape, texture, and reflectance behavior across different wavelengths. Although many studies have applied the Mask R-CNN model using RGB imagery for tree species identification [,,,,], few have thoroughly addressed critical challenges such as inter-species spectral similarity and varying illumination conditions—both of which significantly affect model generalization and classification accuracy in structurally and compositionally complex forest environments. For example, a recent study [] that used single NIR and RGB information separately for conifer species classification found that the overall accuracy was not very different between the two bands when using the Mask R-CNN model.
The novelty of this research lies in utilizing multi-spectral data derived from UAV sensors, either alone or in combination with CHMs, to improve the classification accuracy and enhance the generalization of tree species classification models, particularly in mixed conifer–broadleaf forests. This study aims to develop a practical and robust approach for the spatial localization and classification of broadleaf species in mixed forests utilizing UAV-based multi-spectral data and the Mask R-CNN framework. Specifically, it focuses on (1) improving species-level classification accuracy using Mask R-CNN model, (2) evaluating the effectiveness of multi-spectral bands in distinguishing broadleaf species, and (3) assessing the generalization of the model’s effectiveness in various forest conditions.
To achieve objectives, the Mask R-CNN model was trained using the combination of UAV-derived RGB orthophotos, NIR imagery, and CHM data and compared with RGB alone, RGB + CHM, or RGB + NIR combinations. For broadleaf species classification, we focused on distinguishing between Japanese oak and other broadleaf species. Japanese oak was selected as a target species because of its ecological significance and economic value in northern Japan []—particularly its widespread use in high-quality applications such as whisky barrel production []. To assess the Mask R-CNN model’s ability to generalize across different sites and seasons, we applied it to a dataset collected during a different season from a separate mixed forest with similar characteristics, demonstrating the model’s potential transferability. The outcomes of this research will contribute to the development of more efficient and automated forest monitoring systems, supporting both ecological research and sustainable forest management practices.
2. Materials and Methods
2.1. Study Site
The study area is a company-owned forest managed by Sumitomo Forestry Co., Ltd., located in Mombetsu City, eastern Hokkaido, Japan (44°07′–32′N, 142°54′–29′E) (Figure 1a). It covers a total area of 15,606 hectares and lies in a hilly coastal region, extending from 40 to 400 m in elevation above sea level. The climatic conditions are characterized by a subarctic humid climate (Köppen classification Df). The region experiences an annual average temperature of 6.1 °C and receives approximately 836 mm of rainfall per year. The forest is primarily composed of natural secondary growth, which regenerated after a major fire around 1900. Management efforts focus on maintaining these natural forests, particularly stands of Abies sachalinensis (Sakhalin fir), Betula spp. (birch species), and Quercus crispula (Japanese oak). Additionally, artificial forests in the area include Larix kaempferi (Japanese larch) and A. sachalinensis, where thinning and small-scale clear-cutting operations are commonly practiced (Sumitomo Forestry Co., Ltd., Tokyo, Japan, available online: https://www.rinya.maff.go.jp/j/press/kaigai/pdf/sumitomo.pdf, accessed on 3 April 2025). This study was conducted in Sub-compartment 97g (hereafter referred to as Sub-compartment 97g) of the Mombetsu forest (Figure 1b), a mixed natural forest stand comprising both coniferous (i.e., A. sachalinensis) and broadleaf species such as Q. crispula, Betula platyphylla (Japanese white birch), Betula ermanii (Erman’s birch), Betula maximowicziana (monarch birch), Acer pictum (yellow-paint maple), Kalopanax septemlobus (castor aralia), and so on. The study specifically focused on areas within Sub-compartment 97g (approximately 0.75 hectares), where broadleaf species are predominant. According to field surveys conducted in 2024 by Sumitomo Forestry Co., Ltd., the tree density in Sub-compartment 97g varied from approximately 2625 to 3650 trees per hectare, considering trees with a DBH of 3 cm or more —depending on the selective cutting rate—with an average DBH (diameter at breast height) between 7.1 and 10.0 cm. The elevation within this Sub-compartment 97g lies between 279 and 302 m.
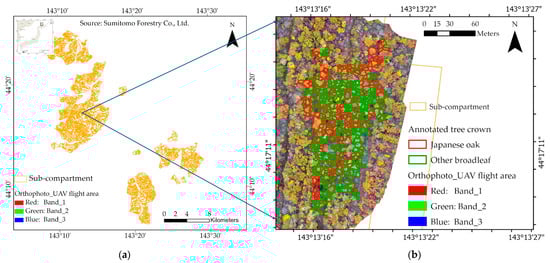
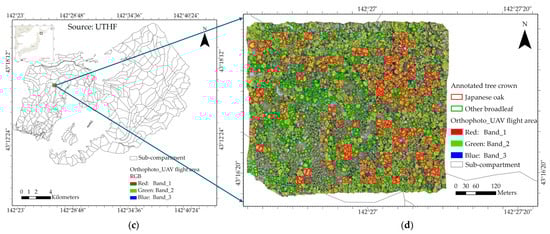
Figure 1.
(a) Location map of Mombetsu forest in eastern part of Hokkaido, Japan; (b) the UAV flight area in Sub-compartment 97g of Mombetsu forest; (c) location map of the University of Tokyo Hokkaido Forest, Japan; and (d) the UAV flight area in Sub-compartment 68E.
To assess the generalizability of our proposed method, we conducted an additional study at the University of Tokyo Hokkaido Forest (UTHF), found in the interior of Hokkaido Island, northern Japan (43°10′–20′N, 142°18′–40′E). Specifically, the study was carried out at Sub-compartment 68E of the UTHF (hereafter referred to as Sub-compartment 68E). The Sub-compartment 68E spans 31 hectares and is home to a dense population of Japanese oak (Figure 1c,d). The area lies between 425 and 500 m in elevation above sea level []. Along with Q. crispula, other notable tree species in the area feature a variety of broadleaf species, including Fraxinus mandshurica (Manchurian Ash), K. septemlobus, B. maximowicziana, Tilia japonica (Japanese linden), and conifer species such as A. sachalinensis, Picea jezoensis (Yezo spruce). Based on the UTHF 2022 inventory, the stand supports approximately 562 trees/hectare (DBH ≥ 5 cm), with a standard deviation of 73 stems/hectare.
This substantial variation in tree density between the two study sites results in contrasting canopy structures: the denser stand in Sub-compartment 97g features closely spaced crowns with more canopy overlap, whereas Sub-compartment 68E has more widely spaced trees with less canopy closure. These structural differences are expected to influence remote sensing observations and potentially affect model performance in tree species identification.
2.2. Data Collection
2.2.1. Field Data
A field survey was conducted on 23 and 24 October 2024 in Sub-compartment 97g, to record the locations of individual trees for use as ground truth data in training the Mask R-CNN model. As depicted in Figure 2a, tree positions were measured on the ground with a global navigation satellite system (GNSS) receiver with real-time kinematic (RTK) and dual-frequency capabilities (DG-PRO1RWS, Biz-Station Corp., Matsumoto City, Japan). Altogether, 55 tees from Japanese oak, 101 trees of other typical broadleaf species, and 7 conifer trees were recorded. Meanwhile, the ground truth data for Sub-compartment 68E, we referred to our previous publication []. The field survey in this study area, undertaken in February 2023, used the same RTK GNSS of Sub-compartment 97g to record the positions of 67 Japanese oak, 72 other tree species and 116 conifer species.
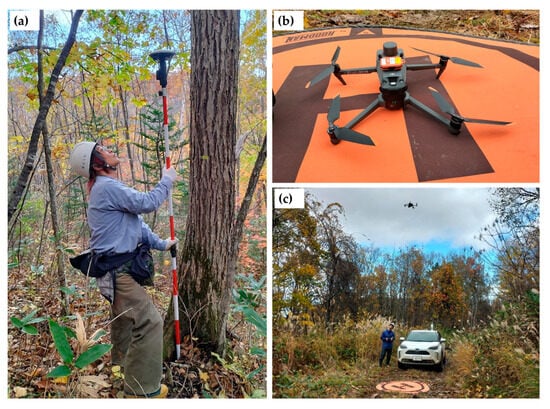
Figure 2.
(a) Recording the positions of trees using RTK GNSS; (b) DJI Mavic 3M and (c) DJI Mavic 3M flight operation.
2.2.2. Collection of UAV Imagery
To capture the distinct color changes in broadleaf species in the autumn, UAV imagery was collected on 24 October 2024, in Sub-compartment 97g. In contrast, UAV images from Sub-Compartment 68E were taken on 30 May 2024, before the leaves changed color. The spring season was specifically chosen because the spectral characteristics of the leaves differ from those in autumn, providing a distinct contrast for evaluating model performance. Both sets of UAV images were acquired through the use of a DJI Mavic 3 Multispectral (Mavic 3M) drone (Figure 2b,c). The Mavic 3M is a compact UAV designed for high-precision agricultural and environmental monitoring. It features an integrated imaging system that combines a 20-megapixel RGB camera with four 5-megapixel multi-spectral cameras, enabling the simultaneous capture of high-resolution visual and spectral data. The multi-spectral component includes narrowband sensors centered on key wavelengths critical for vegetation analysis: green (560 ± 16 nm), red (650 ± 20 nm), red edge (730 ± 20 nm), and near-infrared (860 ± 26 nm) spectral bands. A spectral light sensor positioned on the UAV’s upper surface captures incident solar energy, allowing for radiometric correction and consistent reflectance measurements under varying flight conditions. The RGB camera, built into the same imaging module, is equipped with a 4/3 CMOS sensor and is capable of producing high-resolution orthophotos. The UAV also supports RTK navigation, providing centimeter-precision geolocation when connected to an RTK base station or network. Other key specifications include a maximum flight time of up to 43 min, a takeoff weight of approximately 951 g, compatibility with GPS, Galileo, and BeiDou satellite systems, microSD storage capacity of up to 512 GB, and image resolutions of 1280 × 1024 pixels for multi-spectral and 5280 × 3956 pixels for RGB imagery (DJI agriculture, available online: https://ag.dji.com/jp, accessed on 3 April 2025). The UAV was operated at an altitude of 80 m in both Sub-compartment 97g and Sub-compartment 68E. We conducted UAV flights to cover the entire Sub-compartment 97g (Figure 1b). Based on the size and shape of the study area, in Sub-compartment 97g, the overlap settings were 90% forward and 80% side. In contrast, in Sub-compartment 68E, which is larger in size, the overlap settings were 86% forward and 90% side to ensure detailed information on tree species while effectively covering the entire area. The total flight duration was approximately 10 min in Sub-compartment 97g and 1.5 h in Sub-compartment 68E, respectively.
2.3. UAV Image Preprocessing
The processing of UAV imagery was carried out with DJI Terra (version 4.4.6), a PC-based photogrammetric software developed by SZ DJI Technology Co., Ltd., headquartered in Shenzhen, China. DJI Terra makes the use of Structure from Motion (SfM) and Multi-View Stereo (MVS) techniques to reconstruct three-dimensional models by processing overlapping aerial images captured by UAVs. By detecting and matching key features across multiple images, the software estimates camera poses and generates both sparse and dense point clouds. These outputs form the basis for creating high-resolution orthomosaics, elevation models of the surface and ground (Digital Surface Models [DSMs] and Digital Terrain Models [DTMs]), and textured 3D models. DJI Terra also supports real-time 2D mapping and 3D modeling, enabling rapid data processing for applications such as surveying, construction, and environmental monitoring. Additionally, it offers advanced features such as 2D reconstruction using RGB imagery, Light Detection and Ranging (LiDAR) point cloud processing, and in-depth inspection workflows. The integration of high-precision GNSS/RTK data further enhances the spatial accuracy of the generated products, which is essential for geospatial analyses requiring high positional fidelity (Source: DJI Terra Operation Guide, available online: DJI Terra Operation Guide, available online: https://dl.djicdn.com/downloads/dji-terra/20241008/DJI%20Terra%20Operation%20Guide%20v4.2.pdf, accessed on 12 March 2025).
In this study, the processing workflow included: (1) importing UAV images collected using the DJI Mavic 3M; (2) aligning photos through SfM; (3) performing aerotriangulation to georeference the images; (4) generating a sparse point cloud; (5) constructing a dense point cloud using MVS; (6) building 3D mesh and textured models; (7) performing 2D reconstruction to generate RGB orthomosaics, a normalized NIR image, and a DSM. All of these generated images possessed a ground sampling distance of 0.0194 m per pixel for the Sub-compartment 97g dataset and 0.02 m per pixel for the Sub-compartment 68E dataset. This streamlined workflow provided an efficient and accurate foundation for subsequent analysis.
Furthermore, to calculate the canopy height model (CHM), we used LiDAR-derived DTMs from two sources. For Sub-compartment 97g, we utilized the LiDAR_DTM provided by Sumitomo Forestry Co., Ltd., which was obtained on 24 October 2024, utilizing a DJI Matrice 300 RTK platform paired with the Zenmuse L1 LiDAR system. For Sub-compartment 68E, we used the LiDAR_DTM from the UTHF, created in 2018 from data acquired with a helicopter-mounted Optech Airborne Laser Terrain Mapper (ALTM) Orion M300 sensor (Teledyne Technologies, Thousand Oaks, CA, USA). Since UAVs equipped with non-LiDAR sensors lacked sufficient ground-surface accuracy as a result of limited ground visibility beneath dense canopy cover [], the DTM derived from the Mavic 3M was not used in this study. Then CHMs were computed in QGIS Desktop 3.28.1 by subtracting the LiDAR-derived DTMs from the UAV-derived DSMs on a per-pixel basis. The resulting CHM values ranged from 1 to 32 m in Sub-compartment 97g, while in sub-compartment 68E, values ranged from 1 to 38 m. The spatial resolution of the CHMs were 0.0194 m for Sub-compartment 97g and 0.02 m for Sub-compartment 68E, which are consistent with their corresponding orthophotos and NIR images.
2.4. Data Analysis
An overview of the study’s workflow is presented in Figure 3.
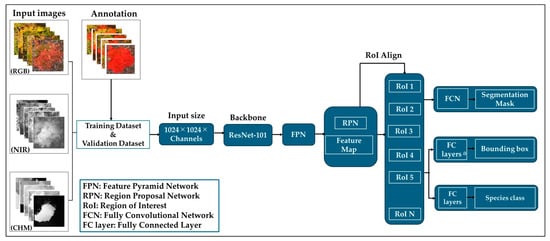
Figure 3.
Overview workflow of broadleaf species identification and localization using Mask R-CNN model.
2.4.1. Mask Region-Based Convolutional Neural Network (Mask R-CNN)
Mask R-CNN is a sophisticated computer vision model that possesses the capacity to not only detect and classify objects in an image, but also to delineate their precise shapes at the pixel level. This capability is referred to as instance segmentation. This approach surpasses conventional object detection methods, which typically provide only bounding boxes and class labels, by offering a more detailed understanding of each object in the scene. A salient feature of instance segmentation is its capacity to discern individual objects, even when they belong to the same category or exhibit similar visual characteristics, by assigning a unique, pixel-accurate mask to each object. The Mask R-CNN model, as proposed by He et al. (2017) [], extends the Faster R-CNN framework by adding a third branch specifically for segmentation, alongside the classification and bounding box regression branches. It employs a convolutional backbone—a multi-layer neural network, typically a Residual Network (ResNet) [] combined with a Feature Pyramid Network (FPN)—for extracting key features from the original images at different scales. A Region Proposal Network (RPN) identifies candidate object regions, and region of interest (RoI) Align ensures that these regions are precisely aligned with the feature maps []. The classification and bounding box regression branches utilize fully connected (FC) layers to process the fixed-size feature maps from each RoI, producing object class probabilities and refined bounding box positions. Meanwhile, the segmentation branch, implemented as a fully convolutional network (FCN), generates a binary mask for each detected object. The Mask R-CNN model has demonstrated impressive results on benchmarks, including the Common Objects in Context (COCO) dataset and has been extensively adopted in various fields that require precise object localization, including medical imaging, autonomous driving, and environmental monitoring [,,]. In the context of forestry, for instance, it can be applied to locate and segment individual tree crowns from UAV imagery, enabling tasks such as tree species detection and identification [,,,,].
2.4.2. Preparation for Training Datasets
In QGIS Desktop 3.28.1, polygons representing each tree crown were manually created by referencing the orthophotos of the study sites and the recorded tree positions in the field surveys. The polygons were drawn using field data along with visual interpretation of high-resolution UAV imagery. The tree crowns were classified into two categories: class 1 for Japanese oak and class 2 for other broadleaf species (which includes all broadleaf species except Japanese oak). Japanese oak was classified separately due to its dominance in the study area and its relevance to forest management practices (as described in Section 2.1), in addition to its broader ecological and economic significance discussed in the Introduction. The other broadleaf species were grouped together due to their lower individual representation in the study area, making a combined class more appropriate for accurate classification and meaningful interpretation. The tree crown polygons were then exported in GeoJSON format and converted to VGG JSON (Visual Geometry Group JSON) format for training the Mask R-CNN model. The total number of trees in each class is summarized in Table 1 for both study sites.

Table 1.
Summary of the number of trees for Japanese oak and other broadleaf species in both study sites for training and validation of the Mask R-CNN model.
Additionally, we extracted individual tree crown images from both datasets to use as input images. In QGIS Desktop 3.28.1, each crown was delineated using the manually created polygons described above, where each polygon corresponded to a single tree. Using the “Clip raster by mask layer” tool, we clipped the original images based on each polygon. The resulting images were exported as individual files with consistent naming between the image and its corresponding polygon-based label. All spatial data were projected to EPSG:2454, and the process was repeated for both datasets to ensure consistency. For Sub-compartment 97g, we extracted 495 images for each of the orthophotos, NIR, and CHM bands. By referring to the previous literature [,,,] and findings in our preliminary analysis of Sub-compartment 97g, we increased the number of annotated trees from 495 (in Sub-compartment 97g) to 664 (in Sub-compartment 68E) by delineating additional tree crowns for both Japanese oak and other broadleaf species (Table 1). Using these manually annotated polygons, we extracted one image patch per crown from each band, as performed in Sub-compartment 97g, resulting in 664 image samples per band.
2.4.3. Training Mask R-CNN Model for Broadleaf Species Identification
For this study, the input images and delineated tree crown polygons, annotated in VGG JSON format, were used to train the Mask R-CNN model. For the Sub-compartment 97g dataset, 75% (374 trees: 172 for Japanese oak and 202 for other broadleaf species) of the trees were used for training and 25% (121 trees: 40 for Japanese oak and 81 for other broadleaf species) for validation. In contrast, the data from Sub-compartment 68E were partitioned into a training set comprising 80% (464 trees: 239 for Japanese oak and 225 for other broadleaf species) and a validation set comprising 20% (200 trees: 100 for Japanese oak and 100 for other broadleaf species). These split ratios were chosen based on the highest mAP (mean Average Precision) values achieved by the Mask R-CNN model in preliminary test analyses. In these tests, we compared several train/validation split ratios (e.g., 60:40, 70:30, and 80:20) and evaluated model performance on a fixed validation set using the mAP metric.
For model configuration, the Mask R-CNN model was set to classify tree species into two categories: Japanese oak, and other broadleaf species. Regarding input channels, the standard Mask R-CNN model, originally designed for RGB images with three channels, was modified to accept four- or five-channel inputs, incorporating additional channels such as NIR and CHM data (Figure 3). These additional channels were integrated using an early fusion approach, where NIR and CHM were stacked alongside the RGB channels as input. Precomputed mean pixel values were used for image normalization, and training was performed using a batch size of 1 on a CPU-based setup, with image dimensions of 1024 × 1024 pixels. The detection threshold was set to a minimum confidence level of 0.5.
To leverage prior knowledge and accelerate training, we implemented transfer learning by using a ResNet-101 backbone pretrained on the COCO dataset within the Mask R-CNN framework. Since the COCO dataset consists of only RGB images, the pretrained model accepts three input channels. To accommodate our five-channel input (RGB, NIR, and CHM), we partially loaded the pretrained weights—excluding the initial convolution layer (conv1) and task-specific heads. The conv1 layer was manually modified to accept five input channels: RGB weights (channels 1–3) were retained from the COCO model, while the NIR and CHM channels (channels 4 and 5) were initialized with small random values from a normal distribution. This approach allowed the model to retain useful low-level features from natural RGB imagery while adapting to domain-specific spectral and structural inputs relevant to forest analysis. By combining pretrained RGB representations with additional UAV-derived data, the model demonstrated improved generalization across varying conditions and data modalities. This transfer learning setup enhanced model robustness and classification accuracy without requiring training from scratch, thereby supporting effective tree species classification in diverse forest environments.
To boost the model’s generalization capability, we implemented a series of data augmentation methods using the imgaug library. The augmentation pipeline included vertical flipping, random rotations (90°, 180°, 270°), brightness scaling, Gaussian blurring, additive Gaussian noise, and affine transformations [,,,]. These augmentations simulate variations in lighting, scale, orientation, and image quality commonly observed in UAV-captured forest imagery. This strategy aimed to make the model more robust to diverse real-world conditions, thereby improving its performance on actual datasets [,,,].
The model was trained using the default learning rate specified in the Mask R-CNN configuration file for 50 epochs. The training initially focused on the “network heads”, which refer to the top layers of the Mask R-CNN architecture responsible for object classification, bounding box refinement, and mask generation []. This approach is particularly effective when fine-tuning the model for a new task—such as tree species identification in forestry—because it allows the network to adapt its high-level feature interpretation without altering the lower-level feature extractors, which are typically pre-trained on a large dataset like COCO. The training process incorporated custom callbacks for model checkpointing and evaluation metrics tracking. Model weights were saved at each epoch using a customized path, and evaluation metrics were computed on the validation dataset after each epoch. The models were implemented in Python (version 3.7) using TensorFlow (version 2.2.0), along with supporting libraries such as NumPy and OpenCV.
All training experiments were performed on a Dell Precision 5860 Tower workstation powered by an Intel Xeon W5-2545 CPU (12 cores, 24 threads, 3.5 GHz base frequency, up to 4.7 GHz) and 64 GB of RAM (2 × 32 GB). Although the workstation included an NVIDIA RTX 2000 Ada GPU (16 GB), GPU acceleration was not utilized due to compatibility constraints: the installed CUDA version could not be downgraded to match the requirements of the TensorFlow version used in this study.
2.4.4. Evaluation Metrics
To evaluate the effectiveness of the Mask R-CNN model in tree species identification, standard performance metrics, standard evaluation metrics—mean Average Precision (mAP), precision, recall, and F1-score—were determined using the validation dataset. The mAP was calculated at an Intersection-over-Union (IoU) threshold of 0.5, offering an overall measure of detection and segmentation accuracy by considering both the overlap quality between predicted and ground-truth masks and the detection rate across all species classes. Precision quantified the fraction of correctly predicted instances out of all detected instances. It was calculated using weighted averaging to account for class imbalances, where each class’s score is weighted by the number of true ground-truth instances for that class. Recall was similarly measured using a weighted average to assess how effectively the model identified true instances across all classes, with the weights proportional to the frequency of ground-truth instances. The F1-score, the harmonic mean of precision and recall, also employed weighted averaging to balance the contributions of both metrics. This approach provided a balanced evaluation of the model’s performance, particularly useful for handling class imbalances commonly encountered in forestry datasets, where some species may be underrepresented [,].
The following formulas were used to compute these evaluation metrics:
where
mAP = (1/N) × (AP1 + AP2 + … + AP_N)
N = The number of classes,
i = index for each class,
wi = weight for class i (typically the proportion of ground-truth instances for class i),
TPi = True Positives for class i,
FPi = False Positives for class i,
FNi = False Negatives for class i,
precisioni = TPi/(TPi + FPi), precision for class i,
recalli = TPi/(TPi + FNi), recall for class i.
In addition to these metrics, confusion matrices were visualized to illustrate the number of detected trees for each species class, enabling a clearer interpretation of species-specific prediction accuracy and misclassification trends. These metrics were computed separately for each species class (e.g., Japanese oak and other broadleaf species) and then averaged to assess the model’s overall performance in broadleaf species identification.
3. Results
This section presents the performance of the Mask R-CNN model in classifying Japanese oak and other broadleaf species using UAV imagery collected from two study sites: Sub-compartment 97g of the Mombetsu forest and Sub-compartment 68E of the University of Tokyo Hokkaido Forest. We evaluated different input channel combinations and assessed model accuracy using evaluation metrics—mAP, precision, recall, and F1-score—as described in Section 2.4.4. Unless otherwise noted, all reported metrics were calculated using the validation dataset.
3.1. Mask R-CNN Accuracy Using UAV Imagery of Sub-compartment 97g
Table 2 presents the classification performance of Mask R-CNN models trained on four different input combinations: RGB, RGB + NIR, RGB + CHM, and RGB + NIR + CHM. Out of these, the RGB + NIR + CHM attained the highest scores (mAP: 0.78, precision: 0.76, F1-score: 0.75).
Table 2.
mAP, precision, recall and F1-scores of Mask R-CNN using UAV images of Sub-compartment 97g (the accuracy scores with the highest values are highlighted in bold).
In contrast, the RGB + CHM yielded the lowest performance (mAP: 0.72, precision: 0.63, recall: 0.67 and F1-score: 0.63). The RGB-only and RGB + NIR models showed intermediate results, with mAP values of 0.76 and 0.74, respectively.
According to the confusion matrices in Figure 4, out of 121 validation trees (41 Japanese oak and 80 other broadleaf), the RGB + NIR + CHM correctly identified 27 Japanese oaks (65.9%) and 59 other broadleaf trees (73.8%)—outperforming the other combinations. For comparison, RGB: 19 Japanese oaks (46.3%), 60 other broadleaf (75.0%), RGB + NIR: 11 Japanese oaks (26.8%), 70 other broadleaf (87.5%), and RGB + CHM: 5 Japanese oaks (12.2%), 39 other broadleaf (48.8%).
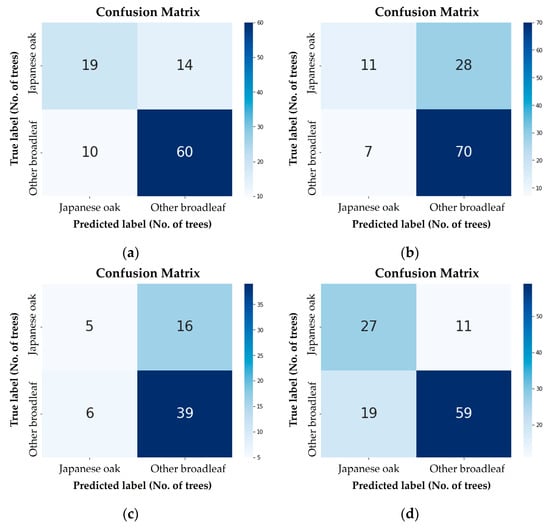
Figure 4.
Confusion matrices for broadleaf species identification in Sub-compartment 97g, using the Mask R-CNN model trained on UAV datasets: (a) RGB only; (b) RGB + NIR; (c) RGB + CHM; and (d) RGB + NIR + CHM.
The combination of RGB and NIR detected the highest number of other broadleaf trees, although it was less effective in detecting Japanese oak as seen in Figure 4b. Figure 5 provides visual examples of the model’s predictions across different input types.
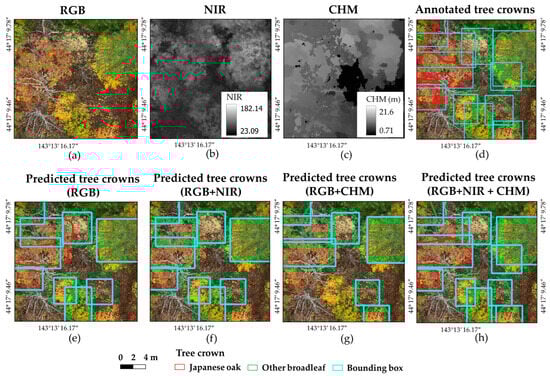
Figure 5.
Visualization of predicted broadleaf species identification results in Sub-compartment 97g, by the Mask R-CNN model with UAV data. (a) Input RGB image; (b) input NIR image; (c) input CHM image; (d) annotated polygons and bounding boxes overlaid on the RGB image; (e) predicted tree crowns using RGB; (f) predicted tree crowns using RGB + NIR; (g) predicted tree crowns using RGB + CHM; and (h) predicted tree crowns using RGB + NIR + CHM.
3.2. Mask R-CNN Accuracy Using UAV Imagery of Sub-compartment 68E
Building on the Sub-compartment 97g findings, Table 3 shows the performance of Mask R-CNN models applied to Sub-compartment 68E datasets using the same four input combinations. Again, the RGB + NIR + CHM delivered the best results, achieving the highest mAP (0.82), precision (0.81), and F1-score (0.80).
Table 3.
mAP, precision, recall and F1-scores of Mask R-CNN using UAV images of Sub-compartment 68E (the accuracy scores with the highest values are highlighted in bold).
The RGB-only model also performed strongly (mAP: 0.80, precision: 0.79, recall: 0.79, and F1-score: 0.79). When comparing individual additions to RGB, the RGB + CHM (mAP: 0.78, precision: 0.76, recall: 0.75, and F1-score: 0.74) outperformed RGB + NIR (mAP: 0.76, precision: 0.75, recall: 0.74, and F1-score: 0.72.
Figure 6 presents the confusion matrix for this experiment, highlighting the number of correctly classified trees using each input combination. Among the 200 trees in the validation set (comprising 100 Japanese oaks and 100 other broadleaf species), the model using RGB, NIR, and CHM data demonstrated the best performance, accurately classifying 79 Japanese oaks (79.0%) and 81 other broadleaf trees (81.0%). In contrast, the RGB-only model correctly identified 66 Japanese oaks (66.0%) and 72 broadleaf trees (72.0%); the RGB + NIR model recognized 69 Japanese oaks (68.0%) and 20 broadleaf trees (20.0%); and the RGB + CHM detected just 68 Japanese oaks (68.0%) and 47 broadleaf trees (47.0%). Figure 7 shows examples of the model’s predictions on different input datasets.
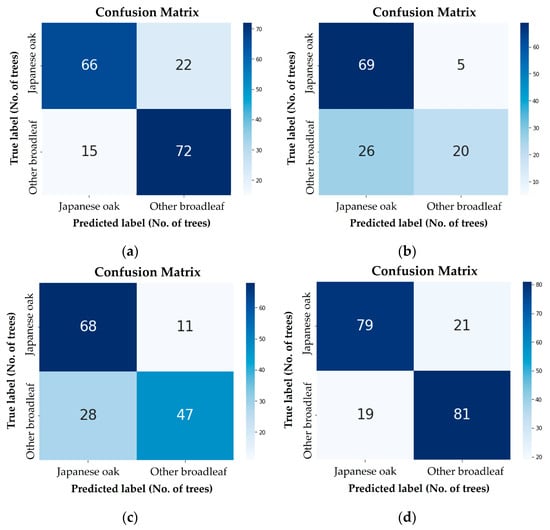
Figure 6.
Confusion matrices for broadleaf species identification in Sub-compartment 68E, using the Mask R-CNN model trained on UAV datasets: (a) RGB only; (b) RGB + NIR; (c) RGB + CHM; and (d) RGB + NIR + CHM.
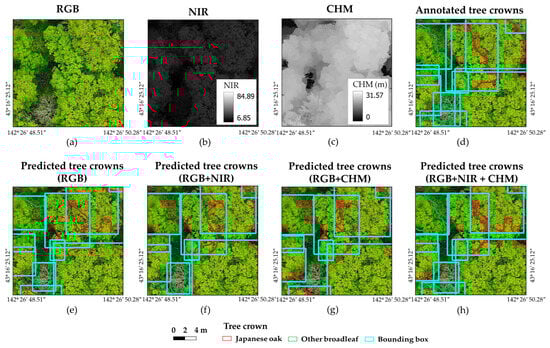
Figure 7.
Visualization of predicted broadleaf species identification results in Sub-compartment 68E, by the Mask R-CNN model with UAV data. (a) Input RGB image; (b) input NIR image; (c) input CHM image; (d) annotated polygons and bounding boxes overlaid on the RGB image; (e) predicted tree crowns using RGB; (f) predicted tree crowns using RGB + NIR; (g) predicted tree crowns using RGB + CHM; and (h) predicted tree crowns using RGB + NIR + CHM.
4. Discussion
4.1. Broadleaf Species Identification Using Mask R-CNN Model in Mixed Forests
This study emphasizes the potential of integrating high-resolution multi-spectral UAV imagery with Mask R-CNN model to improve species-level mapping in mixed forests. Across both test sites—the Sub-compartment 97g of Mombetsu forest and Sub-compartment 68E of the University of Tokyo Hokkaido Forest (UTHF)—the Mask R-CNN model obtained the highest mAP values: 0.78 in the former study site and 0.82 in the case of the latter when utilizing a combination of RGB, NIR, and CHM data.
A minimum mAP of 0.5 is generally considered a threshold for usability in scientific applications related to tree crown delineation []. In this present study, the strong mAP scores obtained at both sites demonstrate the potential of instance segmentation for broadleaf species mapping in structurally diverse forest environments. Mask R-CNN’s performance to identify individual crowns and assign species labels offers a major improvement over traditional pixel-based or object-based methods []. The present study, using multi-spectral imagery and Mask R-CNN (Table 2 and Table 3), achieved higher performance in terms of mAP, precision, recall, and F1-score compared to the overall accuracy (OA) values reported by Moe et al. (2020) [], which were 0.63 and 0.73 for different sub-compartments located in the UTHF. Moe et al. classified five tree species in uneven-aged mixed forests using UAV imagery and an object-based random forest (RF) model.
In particular, the Mask R-CNN model aids in overcoming the challenges associated with overlapping tree crowns and intermingled species—common conditions in complex mixed forests. In a previous study [], we used a ResU-Net model on UAV imagery from Sub-compartment 68E to detect Japanese oak crowns. However, the model struggled in dense vegetation, often predicting multiple crowns as a single group rather than as separate instances. In the present study, this issue of misclassification due to crown overlap was mitigated to some extent, particularly by integrating multi-spectral data with CHM information (Figure 7h).
The resulting high accuracies are especially valuable for ecological monitoring, as they enable more precise estimates of species distribution and above-ground biomass []. Nonetheless, challenges such as crown overlaps and spectral similarity between species can still affect detection accuracy. For instance, in Sub-compartment 97g, some Japanese oaks were not detected due to their similar color to other broadleaf species. Likewise, birch trees without leaves were often missed. In Sub-Compartment 68E, the model occasionally misclassified Japanese oak as other broadleaf species, including Japanese linden and castor aralia.
Although weighted averaging of precision, recall, and F1-scores was applied in this study to address class imbalance, these metrics can still produce high overall values even when certain species are significantly under-detected. For example, in the RGB + CHM dataset for Sub-compartment 97g, the model achieved moderate scores (precision: 0.63, recall: 0.67, F1-score: 0.63), yet it correctly detected only 5 out of 40 Japanese oak trees (Figure 4c). Similarly, in Sub-compartment 68E, the RGB + NIR model detected just 20 out of 100 other broadleaf trees (Figure 6b), despite reporting relatively high precision (0.76), recall (0.75), and F1-score (0.74). These cases emphasize the importance of interpreting these metrics alongside actual detection counts, particularly in ecologically diverse forests where under-detection of minority species can easily be masked by high aggregate scores.
While the performance improvements from incorporating multi-spectral and CHM data may appear modest in terms of aggregate metrics compared to the original RGB input, these additional data sources were critical for improving the detection of spectrally similar or underrepresented species—particularly under challenging conditions such as crown overlap and leaf-off phenology. For example, in Sub-compartment 97g, the number of correctly detected Japanese oak trees was notably higher with the RGB + NIR + CHM dataset than with RGB alone, even though detection rates for other broadleaf species remained similar. Similarly, in Sub-compartment 68E, the RGB + NIR + CHM detected 13 more Japanese oak crowns and 9 more other broadleaf trees than the RGB-only model. These gains, although not always fully captured by mAP or F1-scores, are essential for downstream ecological applications such as species-specific biomass estimation and biodiversity monitoring. Given the increasing accessibility of multi-spectral sensors and open-source CHM generation tools, the added complexity is both feasible and justifiable.
4.2. Effectiveness of Multi-Spectral Bands for Broadleaf Species Identification
In Sub-compartment 97g, the integrated RGB, NIR, and CHM delivered the highest overall performance, with a mAP of 0.78, and accurately identified the largest number of trees in both species categories (Figure 4). While the combination of RGB and CHM yielded the lowest mAP (0.63), the addition of NIR led to a clear improvement, highlighting the synergistic benefits of combining multiple data types. This indicates that integrating both spectral and structural information provides complementary cues that enhance species discrimination—especially for distinguishing Japanese oak and other broadleaf species. The results from Sub-compartment 68E further emphasize the value of multimodal inputs. The model using the combined RGB, NIR and CHM data again delivered the highest scores (mAP: 0.82).
Notably, the RGB-only model also performed well, achieving a mAP value of 0.76 in Sub-compartment 97g and 0.80 in Sub-compartment 68E—nearly matching the full-input model. These results suggest that, despite seasonal differences in foliage between the two sites, RGB imagery alone can still yield high classification accuracy in forests with relatively uniform canopy structure and species exhibiting visually distinguishable traits. This may be due to the high spatial resolution of the imagery, which enables the capture of fine-scale texture and crown shape features, as well as the presence of identifiable species-specific traits (e.g., leaf shape and crown texture), even under varying seasonal conditions. These factors together underscore the potential of RGB-based approaches as simpler and more cost-effective alternatives in certain contexts.
In both test sites, our models outperformed the results reported by Yoshii et al. (2022) [], who used only RGB imagery and Mask R-CNN model for species identification in a mixed forest in Hokkaido, Japan. Their approach achieved a precision of 0.73, a recall of 0.72 and F1-score of 0.72. Even our RGB-only model yielded higher scores than those reported by Yoshii et al., likely due to the higher spatial resolution and image quality of our UAV-based RGB imagery compared to the aerial imagery used in their study. Additionally, their dataset included both broadleaf and conifer species, with some classes having relatively few sample trees, which may have contributed to lower classification accuracy due to class imbalance. Moreover, our best-performing model using RGB, NIR, and CHM data achieved a precision of 0.76, recall of 0.74, and F1-score of 0.75 in Sub-compartment 97g, and 0.81, 0.78, and 0.80, respectively, in Sub-compartment 68E. These results highlight the effectiveness of incorporating additional data sources for improving classification accuracy in complex forest environments.
Some previous studies have also applied multi-spectral bands for tree species classification. For example, Xu et al. (2020) [] utilized spectral, texture, and structural metrics combined with an RF classifier, achieving an overall accuracy (OA) of 66.34% and a Kappa accuracy of 58.53% for species classification, including Oriental white oak (Quercus aliena), in a mixed subtropical natural forest in southwest China. Similarly, a study [] using spectral and CHM information with an object-based RF classifier in a mixed-species forest reported an OA of 0.77. Compared to these studies, our model using RGB, NIR, and CHM data achieved higher performance with Mask R-CNN, obtaining mAP values of 0.78 and 0.82 at the two test sites. These results demonstrate that combining multi-spectral and structural information with instance segmentation techniques can significantly improve species classification accuracy in complex mixed forests, compared to using multi-spectral imagery with traditional object-based classification methods.
Interestingly, the relative importance of NIR and CHM varied between the two sites. In Sub-compartment 97g, adding NIR to RGB data improved overall classification performance more than adding CHM. Conversely, in Sub-compartment 68E, the RGB + CHM outperformed the RGB + NIR combination. This suggests that CHM-derived height information may be particularly useful in forests where species exhibit distinct differences in canopy structure.
However, further analysis revealed a consistent trend: across both sites and seasons, the RGB-only models outperformed the RGB + NIR models. As shown in Table 2 and Table 3, even when accounting for phenological differences—such as leaf senescence in Sub-compartment 97g and full canopy foliage in Sub-compartment 68E—the RGB + NIR combination did not lead to improved accuracy. In Sub-compartment 97g, some birch trees had already shed their leaves, and Japanese oak trees exhibited varying degrees of color change, potentially reducing the spectral consistency of the NIR signal. Yet even in Sub-compartment 68E, where all species were fully leafed and green, the inclusion of NIR still led to lower accuracy compared to RGB alone.
These findings imply that the addition of the NIR band may have introduced spectral redundancy or noise rather than contributing complementary information. Possible causes include overlapping NIR reflectance signatures among species under dense canopy cover or slight misalignment and calibration discrepancies between the RGB and NIR imagery.
Conversely, incorporating structural information from the CHM improved classification performance, particularly when used in conjunction with both RGB and NIR data. The RGB + NIR + CHM achieved the highest accuracy at both study sites, highlighting the added value of integrating 3D structural features with spectral data. These results indicate that CHM is most effective when complementing both RGB and NIR inputs.
However, the effectiveness of CHM depends on how it is integrated with other inputs. In comparison, the RGB + CHM combination resulted in lower accuracy than RGB alone at both sites (Table 2 and Table 3). This outcome may be associated with the limited vertical structural differentiation within broadleaf canopies, which reduces the discriminatory power of CHM data when used without additional spectral information like NIR. Additionally, potential sources of error, such as slight misalignment between the RGB and CHM layers, may have introduced noise that offset the benefits of incorporating CHM alone.
These findings highlight the challenge of accurately detecting Japanese oak and other deciduous broadleaf species in mixed forests, emphasizing the need for tailored remote sensing workflows. Spectral similarities among species, particularly in areas where Japanese oak overlaps with other broadleaf species, underline the importance of considering site-specific structural attributes and the timing of data acquisition. Both seasonal and spatial factors must be carefully considered when selecting spectral band combinations for effective species classification.
4.3. Generalization of the Mask R-CNN Model
This study demonstrates that the Mask R-CNN model generalizes well across different forest environments when using combined RGB, NIR, and CHM inputs. This multi-modal approach consistently delivered the highest classification accuracy at both test sites. However, the results also show that simpler input combinations—particularly RGB-only—can still yield competitive performance depending on site-specific characteristics. This adaptability is valuable for practical UAV-based forest monitoring, especially in scenarios where acquiring NIR imagery or generating CHM data may be limited by cost, equipment, or environmental constraints.
Notably, the evaluation metrics were higher for Sub-Compartment 68E compared to Sub-compartment 97g, suggesting that the dataset from Sub-Compartment 68E was more effective for model training and evaluation. This may be attributed to both the larger dataset size and the timing of UAV image acquisition. In Sub-Compartment 68E, imagery was captured before the onset of leaf color change, providing more consistent spectral characteristics that likely aided species differentiation. In contrast, images from Sub-compartment 97g were collected after leaf color change, when overlapping colors among broadleaf species may have introduced confusion. Additionally, some trees were leafless, further complicating accurate classification. These differences in data volume and seasonal conditions likely influenced the model’s performance, highlighting the importance of both dataset quality and phenological timing in deep learning-based forest species classification.
While our results demonstrate robust generalization across two different forest environments, applying this Mask R-CNN approach to large-scale forest monitoring presents additional challenges. UAV-based data collection over extensive forest areas requires substantial flight time, logistical coordination, and significant data storage and processing capacity. Although the model’s adaptability to different input data types (RGB, NIR, CHM) offers flexibility, scaling up will require efficient workflows to manage large data volumes and may benefit from integration with satellite or airborne imagery for broader coverage. Nonetheless, ongoing advancements in UAV technology and data processing methods may help overcome these challenges, enabling broader applications in the future.
5. Conclusions
This study highlights the potential of deep learning methods, particularly Mask R-CNN, in advancing UAV-based broadleaf species localization in mixed forests. By leveraging high-resolution multi-spectral imagery and CHM data, we achieved accurate spatial localization and classification of broadleaf tree species, including Japanese oak. The integration of RGB, NIR, and CHM consistently led to the highest classification accuracy, underscoring the benefit of combining spectral and structural inputs.
Importantly, the model also demonstrated flexibility across different sites, suggesting that input selection can be tailored to local conditions. These findings affirm the potential of UAV-based multi-spectral and structural data fusion for precise, scalable, and automated forest monitoring, contributing to improved ecological assessment and sustainable forest management practices.
To further evaluate and enhance the model’s generalization capabilities, future research could incorporate hyperspectral imagery, multi-seasonal data, or expand the training dataset to cover broader geographic regions. While we employed a simple data fusion approach in this study, exploring more advanced integration techniques—such as late fusion or attention-based models—may further improve performance and represent a promising direction for future work. Applying the model to more diverse and taxonomically complex species groups could also enhance its ecological applicability. These steps would support the development of more scalable and transferable tools for forest monitoring and biodiversity assessment.
Author Contributions
N.M.H. led conceptualization, methodology, formal analysis, and drafted the original manuscript. K.F. and Y.I. collected field data and processing of UAV imagery. T.O. contributed to investigation, supervision, project administration, funding acquisition, writing, and editing. S.N.S., M.F., Y.U., and R.K. were involved in the field investigation as well as the review and editing process. S.K. also participated in the review and editing. All authors have read and agreed to the published version of the manuscript.
Funding
This research was conducted under the research project entitled “The CO2 Fixation Effect of Forests,” a collaboration between Sumitomo Forestry Co., Ltd. and the University of Tokyo.
Data Availability Statement
Due to the sensitive nature of the study sites and related forest management concerns, the UAV datasets used in this research are not available to the public. However, they may be shared with interested parties upon request to the corresponding author, provided a valid justification is submitted to ensure the data is used responsibly and ethically.
Acknowledgments
We would like to express our gratitude to the students from the University of Tokyo, Li Yunfan and Memory Sidira, for their valuable assistance during our field survey. We are also grateful to the technical staff of the University of Tokyo Hokkaido Forest (UTHF) and Mutsuki Hirama and Akio Oshima for acquiring the UAV imagery of Sub-compartment 68E. The LiDAR-derived DTM for Sub-compartment 68E was generated using data supported by the Juro Kawachi Donation Fund through a collaborative grant between the UTHF and Oji Forest Products Co., Ltd., as well as JSPS KAKENHI Grant Number 16H04946. Moreover, the English version of this manuscript was edited with the assistance of ChatGPT (OpenAI, San Francisco, CA, USA).
Conflicts of Interest
Manato Fushimi, Yamato Unno, Ryota Konda, and Satoshi Kita are employees of Sumitomo Forestry Co., Ltd. All authors contributed to the same research project, and there are no commercial or financial relationships that could be construed as a potential conflict of interest.
References
- Kaplan, G. Broad-Leaved and Coniferous Forest Classification in Google Earth Engine Using Sentinel Imagery. Environ. Sci. Proc. 2021, 3, 64. [Google Scholar] [CrossRef]
- Xu, W.; Zhang, B.; Xu, Q.; Gao, D.; Zuo, H.; Ren, R.; Diao, K.; Chen, Z. Enhanced Carbon Storage in Mixed Coniferous and Broadleaf Forest Compared to Pure Forest in the North Subtropical–Warm Temperate Transition Zone of China. Forests 2024, 15, 1520. [Google Scholar] [CrossRef]
- Chen, Q.; Gao, T.; Zhu, J.; Wu, F.; Li, X.; Lu, D.; Yu, F. Individual Tree Segmentation and Tree Height Estimation Using Leaf-Off and Leaf-On UAV-LiDAR Data in Dense Deciduous Forests. Remote Sens. 2022, 14, 2787. [Google Scholar] [CrossRef]
- Chen, X.; Jiang, K.; Zhu, Y.; Wang, X.; Yun, T. Individual Tree Crown Segmentation Directly from Uav-Borne Lidar Data Using the Pointnet of Deep Learning. Forests 2021, 12, 131. [Google Scholar] [CrossRef]
- Beloiu, M.; Heinzmann, L.; Rehush, N.; Gessler, A.; Griess, V.C. Individual Tree-Crown Detection and Species Identification in Heterogeneous Forests Using Aerial RGB Imagery and Deep Learning. Remote Sens. 2023, 15, 1463. [Google Scholar] [CrossRef]
- Natesan, S.; Armenakis, C.; Vepakomma, U. Individual Tree Species Identification Using Dense Convolutional Network (Densenet) on Multitemporal RGB Images from UAV. J. Unmanned Veh. Syst. 2020, 8, 310–333. [Google Scholar] [CrossRef]
- Mäyrä, J.; Keski-Saari, S.; Kivinen, S.; Tanhuanpää, T.; Hurskainen, P.; Kullberg, P.; Poikolainen, L.; Viinikka, A.; Tuominen, S.; Kumpula, T.; et al. Tree Species Classification from Airborne Hyperspectral and LiDAR Data Using 3D Convolutional Neural Networks. Remote Sens. Environ. 2021, 256, 112322. [Google Scholar] [CrossRef]
- Maschler, J.; Atzberger, C.; Immitzer, M. Individual Tree Crown Segmentation and Classification of 13 Tree Species Using Airborne Hyperspectral Data. Remote Sens. 2018, 10, 1218. [Google Scholar] [CrossRef]
- Koch, B.; Heyder, U.; Weinacker, H. Detection of Individual Tree Crowns in Airborne Lidar Data. Photogramm. Eng. Remote Sens. 2006, 72, 357–363. [Google Scholar] [CrossRef]
- Miraki, M.; Sohrabi, H.; Fatehi, P.; Kneubuehler, M. Individual Tree Crown Delineation from High-Resolution UAV Images in Broadleaf Forest. Ecol. Inform. 2021, 61, 101207. [Google Scholar] [CrossRef]
- Liu, B.; Hao, Y.; Huang, H.; Chen, S.; Li, Z.; Chen, E.; Tian, X.; Ren, M. TSCMDL: Multimodal Deep Learning Framework for Classifying Tree Species Using Fusion of 2-D and 3-D Features. IEEE Trans. Geosci. Remote Sens. 2023, 61, 4402711. [Google Scholar] [CrossRef]
- Chen, C.; Jing, L.; Li, H.; Tang, Y. A New Individual Tree Species Classification Method Based on the Resu-Net Model. Forests 2021, 12, 1202. [Google Scholar] [CrossRef]
- Huang, Y.; Wen, X.; Gao, Y.; Zhang, Y.; Lin, G. Tree Species Classification in UAV Remote Sensing Images Based on Super-Resolution Reconstruction and Deep Learning. Remote Sens. 2023, 15, 2942. [Google Scholar] [CrossRef]
- Wessel, M.; Brandmeier, M.; Tiede, D. Evaluation of Different Machine Learning Algorithms for Scalable Classification of Tree Types and Tree Species Based on Sentinel-2 Data. Remote Sens. 2018, 10, 1419. [Google Scholar] [CrossRef]
- Korznikov, K.A.; Kislov, D.E.; Altman, J.; Doležal, J.; Vozmishcheva, A.S.; Krestov, P.V. Using U-Net-like Deep Convolutional Neural Networks for Precise Tree Recognition in Very High Resolution Rgb (Red, Green, Blue) Satellite Images. Forests 2021, 12, 66. [Google Scholar] [CrossRef]
- Kotivuori, E.; Kukkonen, M.; Mehtätalo, L.; Maltamo, M.; Korhonen, L. Forest Inventories for Small Areas Using Drone Imagery without In-Situ Field Measurements. Remote Sens. Environ. 2020, 237, 111404. [Google Scholar] [CrossRef]
- Goodbody, T.R.H.; Coops, N.C.; Marshall, P.L.; Tompalski, P.; Crawford, P. Unmanned Aerial Systems for Precision Forest Inventory Purposes: A Review and Case Study. For. Chron. 2017, 93, 71–81. [Google Scholar] [CrossRef]
- Hamzah, R.; Noor, M.F. Drone Aerial Image Identification of Tropical Forest Tree Species Using the Mask R-CNN. Int. J. Innov. Comput. 2022, 12, 31–36. [Google Scholar] [CrossRef]
- Dainelli, R.; Toscano, P.; Filippo, S.; Gennaro, D.; Matese, A. Recent Advances in Unmanned Aerial Vehicles Forest Remote Sensing—A Systematic Review. Part II: Research Applications. Forests 2021, 12, 397. [Google Scholar] [CrossRef]
- Gallardo-Salazar, J.L.; Pompa-García, M. Detecting Individual Tree Attributes and Multispectral Indices Using Unmanned Aerial Vehicles: Applications in a Pine Clonal Orchard. Remote Sens. 2020, 12, 4144. [Google Scholar] [CrossRef]
- Safonova, A.; Hamad, Y.; Dmitriev, E.; Georgiev, G.; Trenkin, V.; Georgieva, M.; Dimitrov, S.; Iliev, M. Individual Tree Crown Delineation for the Species Classification and Assessment of Vital Status of Forest Stands from UAV Images. Drones 2021, 5, 77. [Google Scholar] [CrossRef]
- Vivar-Vivar, E.D.; Pompa-García, M.; Martínez-Rivas, J.A.; Mora-Tembre, L.A. UAV-Based Characterization of Tree-Attributes and Multispectral Indices in an Uneven-Aged Mixed Conifer-Broadleaf Forest. Remote Sens. 2022, 14, 2775. [Google Scholar] [CrossRef]
- Dash, J.P.; Watt, M.S.; Paul, T.S.H.; Morgenroth, J.; Pearse, G.D. Early Detection of Invasive Exotic Trees Using UAV and Manned Aircraft Multispectral and LiDAR Data. Remote Sens. 2019, 11, 1812. [Google Scholar] [CrossRef]
- Chen, X.; Shen, X.; Cao, L. Tree Species Classification in Subtropical Natural Forests Using High-Resolution UAV RGB and SuperView-1 Multispectral Imageries Based on Deep Learning Network Approaches: A Case Study within the Baima Snow Mountain National Nature Reserve, China. Remote Sens. 2023, 15, 2697. [Google Scholar] [CrossRef]
- Schiefer, F.; Kattenborn, T.; Frick, A.; Frey, J.; Schall, P.; Koch, B.; Schmidtlein, S. Mapping Forest Tree Species in High Resolution UAV-Based RGB-Imagery by Means of Convolutional Neural Networks. ISPRS J. Photogramm. Remote Sens. 2020, 170, 205–215. [Google Scholar] [CrossRef]
- Franklin, H.; Veras, P.; Pinheiro, M.; Paula, A.; Corte, D.; Roberto, C. Fusing Multi-Season UAS Images with Convolutional Neural Networks to Map Tree Species in Amazonian Forests. Ecol. Inform. 2022, 71, 101815. [Google Scholar] [CrossRef]
- Yoshii, T.; Lin, C.; Tatsuhara, S.; Suzuki, S.; Hiroshima, T. Tree Species Mapping of a Hemiboreal Mixed Forest Using Mask R-CNN. In Proceedings of the IGARSS 2022—2022 IEEE International Geoscience and Remote Sensing Symposium, Kuala Lumpur, Malaysia, 17–22 July 2022; pp. 6228–6231. [Google Scholar] [CrossRef]
- Yu, K.; Hao, Z.; Post, C.J.; Mikhailova, E.A.; Lin, L.; Zhao, G.; Tian, S.; Liu, J. Comparison of Classical Methods and Mask R-CNN for Automatic Tree Detection and Mapping Using UAV Imagery. Remote Sens. 2022, 14, 295. [Google Scholar] [CrossRef]
- Chadwick, A.J.; Coops, N.C.; Bater, C.W.; Martens, L.A.; White, B. Species Classification of Automatically Delineated Regenerating Conifer Crowns Using RGB and Near-Infrared UAV Imagery. IEEE Geosci. Remote Sens. Lett. 2022, 19, 2502205. [Google Scholar] [CrossRef]
- Lucena, F.; Breunig, F.M.; Kux, H. The Combined Use of UAV-Based RGB and DEM Images for the Detection and Delineation of Orange Tree Crowns with Mask R-CNN: An Approach of Labeling and Unified Framework. Futur. Internet 2022, 14, 275. [Google Scholar] [CrossRef]
- Zhang, C.; Zhou, J.; Wang, H.; Tan, T.; Cui, M.; Huang, Z.; Pei, W.; Zhang, L. Multi-Species Individual Tree Segmentation and Identification Based on Improved Mask R-CNN and UAV Imagery in Mixed Forests. Remote Sens. 2022, 14, 874. [Google Scholar] [CrossRef]
- Yang, M.; Mou, Y.; Liu, S.; Meng, Y.; Liu, Z.; Li, P.; Xiang, W.; Zhou, X.; Peng, C. Detecting and Mapping Tree Crowns Based on Convolutional Neural Network and Google Earth Images. Int. J. Appl. Earth Obs. Geoinf. 2022, 108, 102764. [Google Scholar] [CrossRef]
- Moe, K.T.; Owari, T. Sustainability of High-Value Timber Species in Mixed Conifer—Broadleaf Forest Managed under Selection System in Northern Japan. Forests 2020, 11, 484. [Google Scholar] [CrossRef]
- Teo, H.F.; Hiura, T.; Pauley, M.; Hill, A.E.; Zhuang, S. Assessing the Feasibility of Using Small Pieces of Mizunara Oak as Inner Staves within Ex-Bourbon Casks for Whisky Maturation: An Opportunity for Sustainable Bioresource Management? J. Am. Soc. Brew. Chem. 2025, 83, 137–147. [Google Scholar] [CrossRef]
- Htun, N.M.; Owari, T.; Tsuyuki, S.; Hiroshima, T. Mapping the Distribution of High-Value Broadleaf Tree Crowns through Unmanned Aerial Vehicle Image Analysis Using Deep Learning. Algorithms 2024, 17, 84. [Google Scholar] [CrossRef]
- Jayathunga, S.; Owari, T.; Tsuyuki, S. The Use of Fixed–Wing UAV Photogrammetry with LiDAR DTM to Estimate Merchantable Volume and Carbon Stock in Living Biomass over a Mixed Conifer—Broadleaf Forest. Int. J. Appl. Earth Obs. Geoinf. 2018, 73, 767–777. [Google Scholar] [CrossRef]
- He, K.; Zhang, X.; Ren, S.; Sun, J. Deep Residual Learning for Image Recognition. In Proceedings of the 2016 IEEE Conference on Computer Vision and Pattern Recognition (CVPR), Las Vegas, NV, USA, 27–30 June 2016; Volume 2016-Decem, pp. 770–778. [Google Scholar] [CrossRef]
- Ren, S.; He, K.; Girshick, R.; Sun, J. Faster R-CNN: Towards Real-Time Object Detection with Region Proposal Networks. IEEE Trans. Pattern Anal. Mach. Intell. 2017, 39, 1137–1149. [Google Scholar] [CrossRef]
- Freitas, P.; Vieira, G.; Canário, J.; Vincent, W.F.; Pina, P.; Mora, C. A Trained Mask R-CNN Model over PlanetScope Imagery for Very-High Resolution Surface Water Mapping in Boreal Forest-Tundra. Remote Sens. Environ. 2024, 304, 114047. [Google Scholar] [CrossRef]
- Padma, T.; Kumari, C.U.; Yamini, D.; Pravallika, K.; Bhargavi, K.; Nithya, M. Image Segmentation Using Mask R-CNN for Tumor Detection from Medical Images. In Proceedings of the International Conference on Electronics and Renewable Systems, ICEARS 2022, Tuticorin, India, 16–18 March 2022; Institute of Electrical and Electronics Engineers Inc., GRIET: Hyderabad, India, 2022; pp. 1015–1021. [Google Scholar]
- Abdrakhmanov, R.; Elemesova, M.; Zhussipbek, B.; Bainazarova, I.; Turymbetov, T.; Mendibayev, Z.; South, M.A.; University, K.; Yassawi, K.A. Mask R-CNN Approach to Real-Time Lane Detection for Autonomous Vehicles. Int. J. Adv. Comput. Sci. Appl. 2023, 14, 549–556. [Google Scholar] [CrossRef]
- Alburshaid, E.A.; Mangoud, M.A. Palm Trees Detection Using the Integration between GIS and Deep Learning. In Proceedings of the 2021 International Symposium on Networks, Computers and Communications (ISNCC), Dubai, United Arab Emirates, 31 October–2 November 2021. [Google Scholar] [CrossRef]
- Sivanandam, P.; Lucieer, A. Tree Detection and Species Classification in a Mixed Species Forest Using Unoccupied Aircraft System (UAS) RGB and Multispectral Imagery. Remote Sens. 2022, 14, 4963. [Google Scholar] [CrossRef]
- Yang, J.; Mendili, L.E.I.; Khayer, Y.; Mcardle, S.; Beni, L.H. Instance Segmentation of Lidar Data with Vision Transformer Model in Support Inundation Mapping Under Forest Canopy Environment. In Proceedings of the The International Archives of the Photogrammetry, Remote Sensing and Spatial Information Sciences, Cairo, Egypt, 2–7 September 2023; Volume XLVIII-1/W, pp. 2–7. [Google Scholar]
- Chadwick, A.J.; Goodbody, T.R.H.; Coops, N.C.; Hervieux, A.; Bater, C.W.; Martens, L.A.; White, B.; Röeser, D. Automatic Delineation and Height Measurement of Regenerating Conifer Crowns under Leaf-off Conditions Using Uav Imagery. Remote Sens. 2020, 12, 4104. [Google Scholar] [CrossRef]
- Safonova, A.; Tabik, S.; Alcaraz-Segura, D.; Rubtsov, A.; Maglinets, Y.; Herrera, F. Detection of Fir Trees (Abies Sibirica) Damaged by the Bark Beetle in Unmanned Aerial Vehicle Images with Deep Learning. Remote Sens. 2019, 11, 643. [Google Scholar] [CrossRef]
- Nguyen, H.T.; Caceres, M.L.L.; Moritake, K.; Kentsch, S.; Shu, H.; Diez, Y. Individual Sick Fir Tree (Abies Mariesii) Identification in Insect Infested Forests by Means of UAV Images and Deep Learning. Remote Sens. 2021, 13, 260. [Google Scholar] [CrossRef]
- Sothe, C.; La Rosa, L.E.C.; De Almeida, C.M.; Gonsamo, A.; Schimalski, M.B.; Castro, J.D.B.; Feitosa, R.Q.; Dalponte, M.; Lima, C.L.; Liesenberg, V.; et al. Evaluating a Convolutional Neural Network for Feature Extraction and Tree Species Classification Using Uav-Hyperspectral Images. ISPRS Ann. Photogramm. Remote Sens. Spat. Inf. Sci. 2020, 5, 193–199. [Google Scholar] [CrossRef]
- Dutta, D.; Chen, G.; Chen, C.; Gagné, S.A.; Li, C.; Rogers, C.; Matthews, C. Detecting Plant Invasion in Urban Parks with Aerial Image Time Series and Residual Neural Network. Remote Sens. 2020, 12, 3493. [Google Scholar] [CrossRef]
- Shumeng, H.; Gaodi, X.; Houqun, Y. A Semantic Segmentation Method for Remote Sensing Images Based on Multiple Contextual Feature Extraction. Concurr. Comput. Pract. Exp. 2022, 10, e7483. [Google Scholar] [CrossRef]
- Guo, X.; Liu, Q.; Sharma, R.P.; Chen, Q.; Ye, Q.; Tang, S.; Fu, L. Tree Recognition on the Plantation Using Uav Images with Ultrahigh Spatial Resolution in a Complex Environment. Remote Sens. 2021, 13, 4122. [Google Scholar] [CrossRef]
- Weinstein, B.G.; Marconi, S.; Aubry-Kientz, M.; Vincent, G.; Senyondo, H.; White, E.P. DeepForest: A Python Package for RGB Deep Learning Tree Crown Delineation. Methods Ecol. Evol. 2020, 11, 1743–1751. [Google Scholar] [CrossRef]
- Moe, K.T.; Owari, T.; Furuya, N.; Hiroshima, T.; Morimoto, J. Application of Uav Photogrammetry with Lidar Data to Facilitate the Estimation of Tree Locations and Dbh Values for High-Value Timber Species in Northern Japanese Mixed-Wood Forests. Remote Sens. 2020, 12, 2865. [Google Scholar] [CrossRef]
- Xu, Z.; Shen, X.; Cao, L.; Coops, N.C.; Goodbody, T.R.H.; Zhong, T.; Zhao, W.; Sun, Q.; Ba, S.; Zhang, Z.; et al. Tree Species Classification Using UAS-Based Digital Aerial Photogrammetry Point Clouds and Multispectral Imageries in Subtropical Natural Forests. Int. J. Appl. Earth Obs. Geoinf. 2020, 92, 102173. [Google Scholar] [CrossRef]
Disclaimer/Publisher’s Note: The statements, opinions and data contained in all publications are solely those of the individual author(s) and contributor(s) and not of MDPI and/or the editor(s). MDPI and/or the editor(s) disclaim responsibility for any injury to people or property resulting from any ideas, methods, instructions or products referred to in the content. |
© 2025 by the authors. Licensee MDPI, Basel, Switzerland. This article is an open access article distributed under the terms and conditions of the Creative Commons Attribution (CC BY) license (https://creativecommons.org/licenses/by/4.0/).