Abstract
Among the coronal mass ejections (CMEs) and solar proton events (SPEs) frequently observed by near-Earth spacecraft, the SPE that occurred on 28 October 2021 stands out as a remarkable research event. This is due to the infrequency of reported ground-level enhancements it induced. The CSES (China seismo-electromagnetic satellite) is equipped with high-energy particle detectors, namely, HEPP and HEPD, capable of measuring protons within an energy range of 2 MeV to 143 MeV. These detectors provide valuable opportunities for studying solar activity. By utilizing the Monte Carlo method to simulate the pile-up effect and accounting for the detector’s dead time, with the assistance of real-time incident counting rates, we successfully corrected the spectra in the 10–50 MeV range. The energy spectrum is important for understanding solar proton events. We used the data from the HEPP (high-energy particle package) and HEPD (high-energy particle detector) to obtain the total event-integrated spectrum, which possessed good continuity. Additionally, we compared the observations from the CSES with those from the NOAA satellite and achieved reasonable agreement. We also searched for ground-based responses to this solar activity in China and discovered Forbush decreases detected by the Yang Ba Jing Muon Telescope experiment. In conclusion, the HEPP and HEPD can effectively combine to study solar activity and obtain a smooth and consistent energy spectrum of protons across a very wide energy range.
1. Introduction
The Earth is constantly bombarded by various particles, among which protons play a crucial role. Solar proton events (SPEs) are characterized by a rapid increase in the flux of energetic protons, primarily driven by intense solar flares and fast halo coronal mass ejections (CMEs) [1,2]. Very recently, it has been shown that solar energetic particle flux time series exhibit persistence during SPEs. The annual occurrence of SPEs correlates with sunspot numbers [3]. SPEs can be broadly classified into gradual and impulsive events. Impulsive events, which cover a narrower range of solar longitude compared to gradual events, typically last for a few hours and involve electrons carrying energies of 1–100 keV. Typically, gradual SPEs endure for several days and are abundant in protons. It is a commonly held belief that the particles within gradual ones are accelerated by CME shocks [4]. These charged particles are often accelerated by flares and CMEs [5] and may be reaccelerated stochastically by enhanced Alfvénic turbulence downstream of shock waves [6,7]. During SPEs, many energetic particles can penetrate the atmosphere, posing a threat to satellite health, disrupting communication, and depleting the ozone layer [8]. Furthermore, some particles enter the ionosphere along magnetic field lines in high-latitude regions, causing polar cap absorption, which increases the electron density in the ionosphere and significantly interferes with navigation and communication.
To assess the energy of a solar energetic particle (SEP) event, it is crucial to study the evolution of the proton energy spectrum, especially at the event’s onset. A notable SEP event occurred on 28 October 2021, and its energy spectrum was well-structured using data from multiple satellites, including the CSES (China seismo-electromagnetic satellite)/HEPD, ACE/ULEIS, SOHO/EPHIN, and SOHO/ERNE, along with ground-level effects emphasized by data from South Pole Neutron Monitors and Rome Neutron Monitors [9]. In this study, we analyze proton observation data from the high-energy particle package (HEPP-H and HEPP-L) and high-energy particle detector (HEPD), both onboard the same CSES, to construct the wide energy spectrum distribution of this SEP event and perform cross-validation.
The Kappa distribution stands as an exceptionally valuable mathematical tool for generating the power law distributions observed in space plasmas. In contrast to the Maxwellian distribution, it demonstrates significantly higher energies in the tail region, with particle velocities decaying in a power law manner. The Kappa distribution constitutes the most comprehensive formula for depicting the velocity or energy distribution of particles in steady states [10]. However, more research is needed to understand its physical processes. In this paper, we adopted the Monte Carlo method to correct the data and achieved satisfactory results. Generally speaking, the Monte Carlo method as the statistical simulation method is a numerical computation method that shares the common feature of utilizing random sampling. It is typically applied to address issues in physics and mathematics and is the most efficient approach for numerically integrating functions in multiple dimensions [11].
This paper begins by introducing the detector parameters of the HEPP and HEPD on the CSES. We then correct the proton energy spectrum measured by the HEPP-H and calculate the total event-integrated spectrum by summing the SEP intensities measured in each energy bin during the entire event spanning from 28 October to 4 November. Next, we fit the proton spectrum using three functions, Weibull, Ellison-Ramaty, and Band, to highlight the event’s characteristics. We also investigate measurements from GOES to gain a comprehensive understanding of the SPE features. These energy spectra will play a vital role in explaining the underlying physical processes of SPE generation and propagation from the Sun to Earth.
2. Observations
2.1. Introduction of HEPP and HEPD Onboard CSES
The CSES, launched on 2 February 2018, represents China’s pioneering endeavor in developing and deploying a space-based platform for a seismic stereoscopic observation system and the nation’s first geophysical field detection satellite [12]. Over the past five years, it has been orbiting at an altitude of 507 km, delivering invaluable data for both military applications and geophysical field model construction. Additionally, it plays a pivotal role in magnetospheric and ionospheric detection. The CSES has a high inclination orbit, rendering it highly sensitive to both Earth’s magnetosphere and galactic cosmic rays [13]. Compared to other satellites, the CSES offers many observational advantages, including a broader energy range, higher energy resolution, and superior particle identification efficiency. Notably, as a sun-synchronous orbit satellite, the CSES can observe a wider L-shell region (spanning 1–10) for all solar proton events, like the geosynchronous-orbit satellite of GOES. The spacecraft is equipped with three detectors for measuring high-energy particles: HEPP-L, HEPP-H, and HEPD.
The HEPP-H comprises three core components: two-layer double-sided silicon strip detectors (capturing particle position information), calorimeters (measuring particle energy), and anticoincidence detectors (eliminating interfering particles) [14]. The silicon strip detector system’s two layers determine the incident direction of particles, though the detectable range of pitch angles is constrained by the satellite’s installation configuration. Installed on the CSES’s backside (within the Y-Z plane, where the Y-plane faces the Sun and the Z-plane points in the opposite direction of Earth), the HEPP-H’s detectors face Earth. Utilizing these three components, particle species can be identified based on differing δE/E values (δE is the energy accumulated in the two-layer silicon strip detector, and E is the total energy of the incident particle measured by the calorimeter). Protons primarily interact with matter through strong interactions, while electrons primarily interact electromagnetically, yielding distinct δE/E values that facilitate accurate particle identification [15].
The HEPP-L measures proton fluxes within a 2–20 MeV energy range, divided into 256 energy channels with excellent energy resolution. The detectors achieve an identification efficiency of at least 92% for protons by comparing δE/E values using the two-layer silicon strip detector and calorimeter. The HEPP-L detectors are mounted on the satellite’s backside (within the Y-Z plane).
The HEPD provides energy and incident direction data for electrons and protons. One basic scientific objective of the HEPD is the study of space weather events, like CMEs, SPEs, and low-energy cosmic rays. The instrument encompasses a tracker, trigger system, calorimeter, and a five-plane scintillator veto system (four lateral and one bottom). These subdetectors ensure accurate detection of electrons and protons within 3–100 MeV and 30–300 MeV energy ranges [16,17]. The HEPD is positioned on the satellite’s side, approximately facing the Sun.
Table 1 summarizes the main parameters for measuring electrons and protons using the HEPP-L, HEPP-H, and HEPD.

Table 1.
The parameters of HEPP-L, HEPP-H, and HEPD.
2.2. SPE of 28 October 2021
On 28 October 2021, a total of 13 significant solar events, specifically solar flares, occurred, with the most potent one striking at 15:17 UT within the lower coronal layers [18]. This intense flare may have been linked to the eruption of two solar filaments [19]. Additionally, two CMEs were observed on the same day, the most powerful of which, with a radial velocity of approximately 1260 km/s, was detected at 15:48 UT by LASCO C2 [9,20], originating from NOAA active region 12,887 [21]. Notably, a type III radio emission, typically associated with SPEs [22], was recorded at 15:28 UT [23]. This SPE, accompanied by the first ground-level enhancement (GLE) observed in Solar Cycle 25 [24], was triggered by an X1.0 flare and its associated halo CME [25].
Figure 1 presents the space weather indices, revealing no significant disturbances in the Kp and Dst indices, solar wind dynamic pressure (Pd), magnetic field component (Bz), and solar wind velocity during the SPE in October 2021. During this event, sunspot numbers surged between 28 and 31 October, providing a partial indication of solar activity intensity. A flare occurred on November 1, coinciding with the peak in sunspot numbers. Following the SPE, a series of magnetic storms commenced on 2 November and persisted for approximately 16 h, preceded by an increase in solar wind velocity. Geomagnetic storms, primarily induced by solar wind, also occurred during 3–4 November.
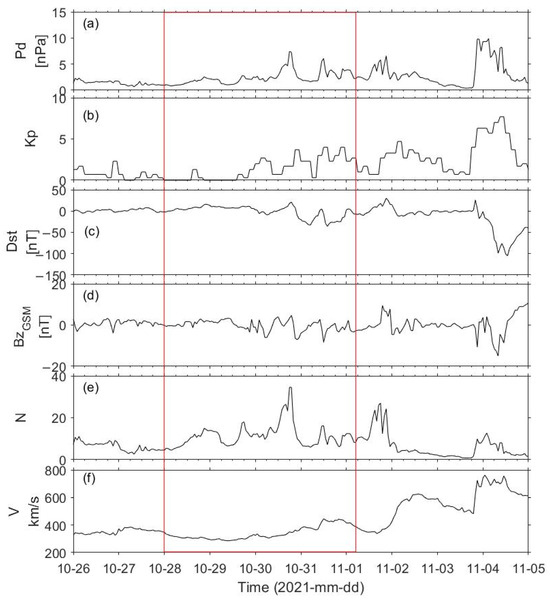
Figure 1.
Space weather index from 26 October to 5 November 2021. (a) The solar wind dynamic pressure Pd (nPa). (b) Geomagnetic index Kp. (c) The equatorial ring current index Dst (nT). (d) The magnetic field component Bz (nT). (e) The sunspot number. (f) The velocity of solar wind (km/s).
Figure 2, Figure 3 and Figure 4 depict the evolution of proton fluxes measured by the HEPP-L, HEPD, and HEPP-H across various energy ranges. On 28 October, proton fluxes surged dramatically across a broad energy spectrum. The maximum flux of 2–6 MeV protons detected by the HEPP-L reached 5315.9 cm−2s−1sr−1, while the maximum flux of 58–87 MeV protons detected by the HEPD peaked at 6.75 cm−2s−1sr−1, and the maximum flux of 40–55 MeV protons detected by the HEPP-H reached 1.25 cm−2s−1sr−1. On 28 October, the proton fluxes detected by the HEPD increased by approximately three orders of magnitude compared to the pre-event levels, while those detected by the HEPP-H increased by about two orders of magnitude. As shown in Figure 2, proton fluxes also increased on 3 November, potentially linked to a magnetic storm, as evident in Figure 1, with a Dst value of approximately 100 nT.
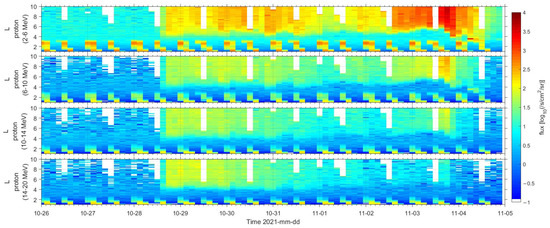
Figure 2.
The evolution of proton fluxes observed by HEPP-L onboard CSES from 26 October to 5 November. The panels are the evolution of proton fluxes from HEPP-L for 2–6 MeV, 6–10 MeV, 10–14 MeV, and 14–20 MeV.
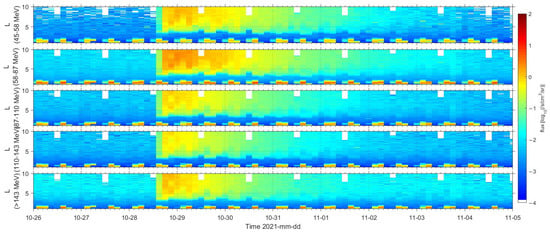
Figure 3.
The evolution of proton fluxes observed by HEPD onboard CSES from 26 October to 5 November. The panels are the evolution of proton fluxes from HEPD for 45–58 MeV, 58–87 MeV, 87–110 MeV, 110–143 MeV, and above 143 MeV.
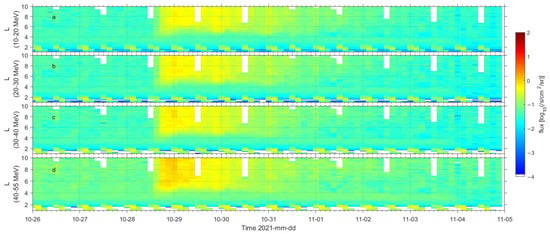
Figure 4.
The evolution of proton fluxes observed by HEPP-H onboard CSES from 26 October to 5 November. The (a–d) panels are the evolution of proton fluxes from HEPP-H for 10–20 MeV, 20–30 MeV, 30–40 MeV, and 40–55 MeV.
Additionally, to cross-validate the data from the HEPP-H, HEPD, and GOES-16 satellite, the data of NOAA-18 were adopted in this paper. The proton energy coverage of NOAA is 39 keV–100 MeV and can cover the same energy range as the others. Figure 5 compares the proton fluxes (L = 6) of 50 MeV detected by the HEPP-H, HEPD, and NOAA, revealing consistency between them during the event. The slight difference between them is the result of the following reason: The NOAA (POES) satellites possess the capability to observe proton fluxes within the same energy range as the HEPP-H. Upon conducting comparative analyses, it was uncovered that the proton event levels recorded by NOAA satellites are slightly lower in comparison to those observed by the CSES. This discrepancy can be attributed to two primary factors. Firstly, the satellites occupy different orbital altitudes, with NOAA situated at 800 km and the CSES positioned at 507 km. Secondly, the high-energy particle detectors on NOAA satellites exhibit a narrower pitch angle coverage than those deployed on the CSES. Specifically, NOAA’s detectors possess two mutually perpendicular detection directions. Conversely, the particle detectors of the CSES boast an angular range exceeding 90 degrees. These factors contribute to the observed difference in particle flux levels detected by the two satellites. However, it is noteworthy that the divergence in flux levels is relatively insignificant, and both satellites exhibit consistent trends in flux levels, thereby validating the high reliability of the CSES’s particle detection capabilities. Therefore, the data from the CSES, having been validated, can align with the data observed by other satellites, serving as a valuable supplement for research across broader energy ranges. As space weather has gained increasing significance, the data effectively captures SPE characteristics and provides reliable and significant information that contributes to the research of SPEs.
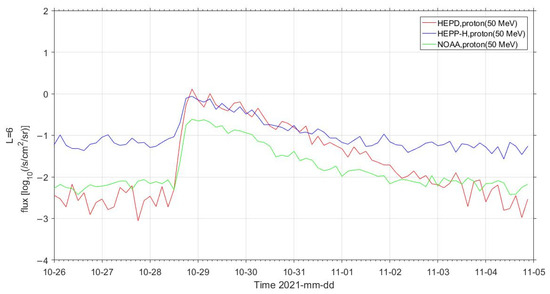
Figure 5.
The evolution of proton flux (L = 6, 50 MeV) energy observed by HEPP-H, HEPD, and NOAA from 26 October to 5 November.
2.3. Energy Spectrum Fitting
To structure a comprehensive energy spectrum, the total event-integrated spectrum spanning from 28 October to 1 November was derived using proton data detected by the HEPP-L (2–20 MeV, blue dots), HEPP-H (10–55 MeV, red dots), and HEPD (58–143 MeV, green dots). This methodology was first employed by Bruno et al. [26]. Subsequently, we employed the functional forms of Weibull (depicted by green lines), Band (represented by red lines), and Ellison–Ramaty (illustrated by blue lines) to fit the corrected spectra of SPEs. The respective functional expressions are as follows:
For additional insights into the parameters of the Weibull equation, refer to Pallocchia et al. [27]. Details on the Band function can be found in Band [28], while information on the Ellison–Ramaty function is available in Ellison and Ramaty [29] and Reames [30].
2.4. Energy Spectrum Corrections
The total event-integrated spectrum is depicted in Figure 6a. Notably, we observed significant deviations in the HEPP-H spectra within the 10–55 MeV range compared to the HEPP-L and HEPD data. Upon thorough analysis, we attributed the energy spectrum deviation of the HEPP-H primarily to the pile-up effect in the lower energy region, detector dead time, and false triggering due to excessively high counting rates. In this subsection, we concisely introduce the correction method for energy spectra.
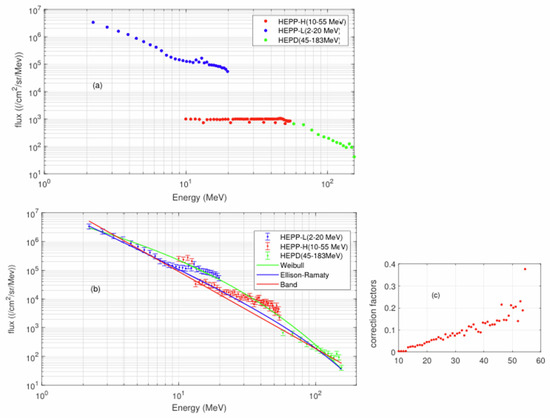
Figure 6.
The data are detected by HEPP-L (blue dots), HEPP-H (red dots), and HEPD (green dots) and fitted by Weibull (green line), Ellison–Ramaty (blue line), and Band (red line). (a) The original total event-integrated spectrum from 28 October to 1 November. (b) The corrected total event-integrated spectrum. (c) The correction factors for different energies.
The HEPP-H data acquisition system necessitates reading multiple signals from silicon strip detectors, with a dead time of 240 microseconds (μs) per triggering event, resulting in an average collection of 4100 events per second. When the brightest of all time (BOAT) occurs, the high incidence rate leads to signal loss within the detector’s dead time. Consequently, the measured energy spectrum of HEPP-H must be reconstructed by incorporating a data acquisition logic model into the energy response matrix. We utilized the Monte Carlo simulation method to obtain correction factors and ultimately reconstruct the incident energy spectrum. The HEPP-H’s plastic scintillator (PS) detector provides real-time incident counting rates but lacks energy spectrum data. The PS detector’s dead time is only 5 μs. Through dead time correction, the PS detector measured an incident count rate of approximately 10,000, corresponding to an average interval time of 10 μs.
Initially, the average interval time measured by the PS detector was utilized in simulating the energy spectrum correction factor. Monte Carlo sampling based on an exponential distribution was employed to determine the arrival time of events. Subsequently, the Weibull spectral model [9] was used to sample energy and obtain the incident energy spectra of particles. These incident energies were converted into deposition energies using the HEPP-H’s energy response matrix. By inputting the deposition energy and particle incident time into the HEPP-H data acquisition system model, the final data acquisition spectrum could be derived according to the acquisition logic. For each energy bin, the energy spectrum correction factor was calculated by dividing the data acquisition spectrum of each bin by the incident energy spectrum. During HEPP-H data processing, these simulated correction factors were applied to correct the data and reconstruct the incident energy spectrum. The correction factors for different energies are illustrated in Figure 6c, while the corrected energy spectrum is shown in Figure 6b. Given the substantial number of statistical data points, the statistical error bars are negligible. For brevity, we estimate the systematic uncertainties to be approximately 20% of the observed values. To observe the quality of the fitting results, we obtained the relative deviation figure for the models. As Figure 7 shows, Weibull fits well in the lower energy range, while Band fits well in the range of higher energy. Unlike the findings of Martucci [9], the Weibull function provides a less satisfactory fit to the high-energy spectrum, whereas the Ellison–Ramaty function offers a slightly better fit to the overall spectrum. The Ellison–Ramaty function, rooted in the diffusive shock acceleration (DSA) power law, performs particularly well when the shock has finite size and acceleration time [7]. This suggests that the particles in this SPE may have been accelerated for a limited duration by a shock that is not particularly intense.
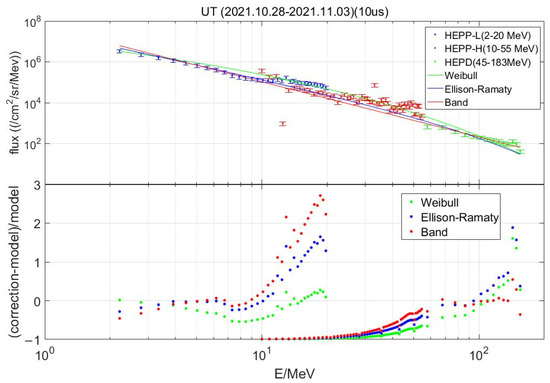
Figure 7.
The upper panel is the fit to corrected total event-integrated spectrum, and the below panel is the relative deviation for different fit functions.
Figure 8 presents the corrected energy spectra, fitting results, and correction factors corresponding to different average interval times of 8, 9, 11, and 12 μs used in simulations, arranged from the top to the bottom panels.
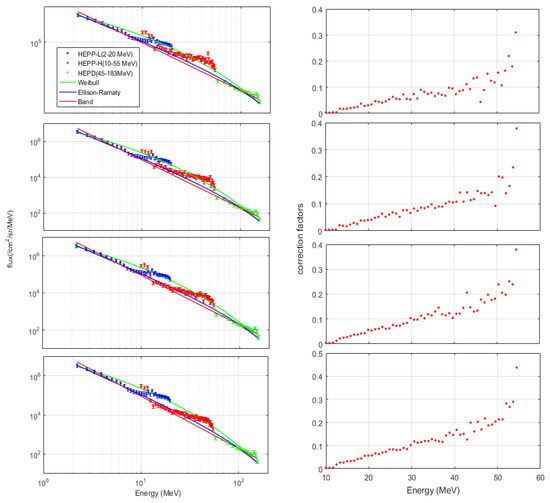
Figure 8.
The corrected total event-integrated spectrum by correct factors from 28 October to 1 November. The data are detected by HEPP-L (blue dots), HEPP-H (red dots), and HEPD (green dots) and fitted by Weibull (green line), Ellison–Ramaty (blue line), and Band (red line). Panels from top to bottom correspond to different average interval times of 8, 9, 11 and 12 μs from top panels to bottom panels used in simulations.
3. Discussion
The ground-level enhancements (GLEs), detectable by neutron monitors, typically coincide with solar proton events. The flux recorded by the Yang Ba Jing Muon Telescope (data sourced from http://ybjnm.ihep.ac.cn/mu/, accessed on 1 December 2023) is depicted in Figure 9. The figure reveals three distinct decreases, accompanied by an overall upward trend. In contrast, Martucci et al. observed an increase without any decreases in flux variations [9], which may be attributed to the geographical location of the neutron monitors. Upon analysis, these decreases are identified as Forbush decreases (FDs), occurring during magnetic storms and induced by solar activity. Many FDs associated with intense geomagnetic storms are linked to CMEs and coronal holes [31], interplanetary shocks, magnetic clouds, and geomagnetic storms. FDs can reach their lowest values within approximately 24 h, with the recovery phase spanning several days. On 28 October, a CME coincided with the first decrease, strongly suggesting that this decrease was an FD. Between November 3rd and 4th, several geomagnetic storms and two decreases occurred. Given the correlation between FDs and geomagnetic storms, these two decreases were also classified as FDs. This finding aligns with the results reported by Veselinovic et al. [32]. Therefore, all three decreases shown in Figure 9 are confirmed as FDs.
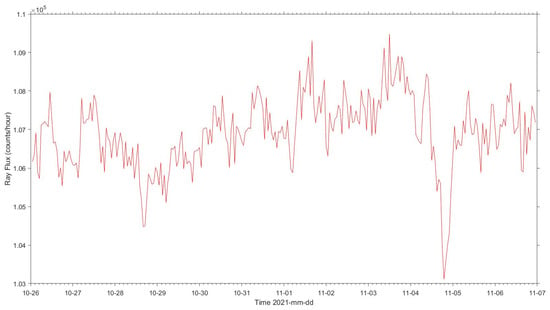
Figure 9.
The fluxes variation detected by Yang Ba Jing Muon Telescope from 26 October to 7 November.
Additionally, we obtained the evolution of proton fluxes detected by GOES, as illustrated in Figure 10. It shows that all energy ranges of proton fluxes experienced a sudden increase on 28th October, similar to the trends observed in the HEPD and HEPP. During the SPE, proton fluxes increased by approximately two orders of magnitude, mirroring the changes seen in the HEPD and HEPP, and by 2nd November, the fluxes had returned to normal levels.
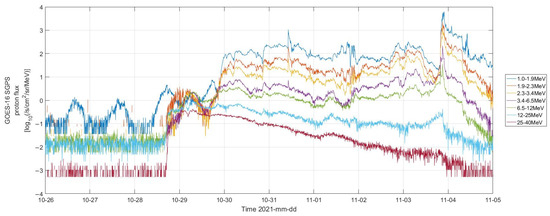
Figure 10.
The evolution of proton fluxes of GOES from 26 October to 4 November.
Through the above analysis, we can conclude that the data from the three payloads of the CSES are relatively reliable. During the solar event on 28th October 2021, Martucci et al. [9] compared the proton data from the ACE, SOHO, and HEPD and found that they were largely consistent with other satellites in orbit. Therefore, the data from these three detectors are trustworthy, and the three payloads of the CSES can play a crucial role in detecting space weather events and providing accurate data for research.
4. Conclusions
In this paper, we have introduced the SPE observed on 28 October 2021 and noted the sudden surge in proton data detected by different payloads. The HEPP-H data align approximately with the measurements from the HEPD and NOAA. The deviation in the total event-integrated spectrum of the HEPP-H is primarily attributed to pile-up effects in the lower energy region, dead time of the detector, and some fake triggering caused by excessively high counting rates. To address this, we corrected the proton energy spectra recorded by the HEPP-H and derived the total event-integrated spectrum by calculating the SEP intensities across each energy bin throughout the entire event, spanning from 28 October (00:00 UT) to 1 November (23:59 UT). This correction method for energy spectra is novel and was implemented for the first time. To facilitate broader adoption, we plan to publish a subsequent paper detailing the simulation process.
Many studies have compared the payloads of the CSES with those of other satellites [4,9]. These comparisons highlight the superior data quality of the CSES. Additionally, we obtained the total event-integrated spectrum, which captures the characteristics of the SPEs. This spectrum was fitted using Weibull, Band, and Ellison–Ramaty functions to emphasize its features. The Weibull function fits the lower energy spectrum well, which may suggest that the low-energy particle population is directly accelerated from the surrounding coronal material by a turbulent shock. The Ellison–Ramaty function provides a slightly better fit to the overall spectrum, suggesting that most particles in this SPE may have been accelerated within a limited time by a shock with finite size. GLEs are another crucial indicator of SPEs, so we utilized data from the Yang Ba Jing Muon Telescope to illustrate GLEs during this SPE. Throughout the event, there were three FDs. Lastly, it is crucial to emphasize that, thanks to its payloads, the data from the CSES represent a valuable addition to research on space weather events, potentially aiding in the understanding of solar proton propagation and acceleration mechanisms during SPEs.
Author Contributions
Conceptualization, Z.Z.; methodology, X.L.; software, D.Z., Z.D. and L.W.; validation, F.Z. and S.L.; formal analysis, F.Z.; investigation, F.Z.; resources, X.L., Z.A. and J.Z.; data curation, F.Z.; writing—original draft preparation, F.Z.; writing—review and editing, F.Z. and Z.Z.; visualization, F.Z.; supervision, Z.Z.; project administration, Z.Z. and X.L.; funding acquisition, Z.Z. All authors have read and agreed to the published version of the manuscript.
Funding
This research was funded by the National Natural Science Foundation of China grants (NNSFC) (42474222, 41904149, and 12173038) and the National Key Research and Development Program (SQ2023YFE0100796).
Data Availability Statement
The CSES data can be downloaded from the Internet (https://www.leos.ac.cn/, accessed on 1 October 2023) based on the Data Service terms where scientists can access the data download service by registering online and filling out the application form following the data policy. The Yang Ba Jing Muon Telescope data are sourced from http://ybjnm.ihep.ac.cn/mu/, accessed on 1 December 2023. The data of NOAA can be found in https://www.ncei.noaa.gov/data/poes-metop-space-environment-monitor/access/l1b/v01r00/2023/noaa19/, accessed on 1 January 2024.
Acknowledgments
We express our sincere gratitude to all the physicists devoted to the CSES project.
Conflicts of Interest
The authors declare no conflicts of interest.
Abbreviations
The following abbreviations are used in this manuscript:
| CMEs | coronal mass ejections |
| SPEs | solar proton events |
| CSES | China seismo-electromagnetic satellite |
| HEPP | high-energy particle package of the CSES |
| HEPP-H | high-energy particle detector of the HEPP |
| HEPP-L | low-energy particle detector of the HEPP |
| HEPD | high-energy particle detector of the CSES |
| SEP | solar energetic particle |
| GLE | ground-level enhancement |
| DSSD | double-sided silicon strip detector |
| BOAT | brightest of all time |
| PS | plastic scintillator |
| DSA | diffusive shock acceleration |
| FDs | Forbush decreases |
References
- Bland, E.C.; Heino, E.; Kosch, M.J.; Partamies, N. SuperDARN radar-Derived HF radio attenuation during the September 2017 solar proton events. Space Weather 2018, 16, 1455–1469. [Google Scholar] [CrossRef]
- Reames, D.V. Particle acceleration at the Sun and in the heliosphere. Space Sci. Rev. 1999, 90, 413–491. [Google Scholar] [CrossRef]
- Birch, M.J.; Bromage, B.J.I. Sunspot numbers and proton events in solar cycles 19 to 24. J. Atmos. Sol.-Terr. Phys. 2022, 236, 105891. [Google Scholar] [CrossRef]
- Wang, L.; Zhang, Z.; Shen, X.; Li, X.; Liang, X.; Zhima, Z.; Chu, W.; Guo, F.; Zhou, N.; Chen, H.; et al. Effects of solar proton events associated with X-ray flares on near-Earth electron and proton fluxes based on ZH-1 satellite observations. Front. Earth Sci. 2022, 10, 895561. [Google Scholar] [CrossRef]
- Kallenrode, M.B.; Cliver, E.W.; Wibberenz, G. Composition and azimuthal spread of solar energetic particles from impulsive and gradual flares. Astrophys. J. 1992, 391, 370–379. [Google Scholar] [CrossRef]
- Kocharov, L.; Vainio, R.; Pomoell, J.; Valtonen, E.; Klassen, A.; Young, C.A. Non-standard energy spectra of shock-accelerated solar particles. Astrophys. J. 2012, 753, 87. [Google Scholar] [CrossRef]
- Chiappetta, F.; Laurenza, M.; Lepreti, F.; Consolini, G. Proton energy spectra of energetic storm particle events and relation with shock parameters and turbulence. Astrophys. J. 2021, 915, 8. [Google Scholar] [CrossRef]
- Xiong, S.; Li, J.; Wei, G.; Lu, J.; Tian, Y.; Zhang, X.; Fu, S.; Sun, M.; Li, Z.; Zhang, H.; et al. The northern and southern hemispheric asymmetries of mesospheric ozone at high latitudes during the January 2012 solar proton events. Space Weather 2023, 21, e2023SW003435. [Google Scholar] [CrossRef]
- Martucci, M.; Laurenza, M.; Benella, S.; Berrilli, F.; Del Moro, D.; Giovannelli, L.; Parmentier, A.; Piersanti, M.; Piersanti, G.; Bartocci, S.; et al. The First Ground-Level Enhancement of Solar Cycle 25 as Seen by the High-Energy Particle Detector (HEPD-01) on Board the CSES-01 Satellite. Space Weather 2023, 21, e2022SW003191. [Google Scholar] [CrossRef]
- Livadiotis, G. Kappa distributions: Statistical physics and thermodynamics of space and astrophysical plasmas. Universe 2018, 4, 144. [Google Scholar] [CrossRef]
- Olchawa, R. Quantum Monte Carlo simulations of interacting electrons. J. Phys. Conf. Ser. 2006, 30, 45. [Google Scholar] [CrossRef]
- Shen, X.; Zhang, X.; Yuan, S.; Wang, L.; Cao, J.; Huang, J.; Zhu, X.; Piergiorgio, P.; Dai, J. The state-of-the-art of the China Seismo-Electromagnetic Satellite mission. Sci. China Technol. Sci. 2018, 61, 634–642. [Google Scholar] [CrossRef]
- Scotti, V.; Osteria, G.; Limadou-CSES Collaboration. The electronics of the HEPD of the CSES experiment. Nucl. Part. Phys. Proc. 2017, 291, 118–121. [Google Scholar] [CrossRef][Green Version]
- Li, X.Q.; Xu, Y.B.; An, Z.H.; Liang, X.H.; Wang, P.; Zhao, X.Y.; Wang, H.Y.; Lu, H.; Ma, Y.Q.; Shen, X.H.; et al. The high-energy particle package onboard CSES. Radiat. Detect. Technol. Methods 2019, 3, 22. [Google Scholar] [CrossRef]
- Zhang, Z.; Li, X.; Wang, L.; Zhima, Z.; Shen, X.; Yuan, S.; An, Z.; Xu, Y.; Liang, X.; Zhang, D.; et al. Evaluation of the proton contamination to MeV electrons by solar proton events based on CSES observations. J. Geophys. Res. Space Phys. 2022, 127, e2022JA030550. [Google Scholar] [CrossRef]
- Scotti, V.; Osteria, G.; CSES-Limadou Collaboration. The HEPD detector on board CSES satellite: In-flight performance. Nucl. Part. Phys. Proc. 2019, 306, 92–97. [Google Scholar] [CrossRef]
- Palma, F.; Martucci, M.; Neubuser, C.; Sotgiu, A.; Ubertini, P.; Bazzano, A.; Rodi, J.C.; Ammendola, R.; Badoni, D.; Bartocci, S.; et al. Gamma-Ray Burst Observations by the High-Energy Particle Detector on board the China Seismo-Electromagnetic Satellite between 2019 and 2021. Astrophys. J. 2023, 960, 21. [Google Scholar] [CrossRef]
- Habarulema, J.B.; Tshisaphungo, M.; Katamzi-Joseph, Z.T.; Matamba, T.M.; Nndanganeni, R. Ionospheric Response to the M-and X-Class Solar Flares of 28 October 2021 Over the African Sector. Space Weather 2022, 20, e2022SW003104. [Google Scholar] [CrossRef]
- Fang, Y.; Zhang, J.; Bi, Y.; Song, Z. Dynamics of Threads Wrapping a Filament’s Leg Prior to the Eruption on 2021 October 28. Astrophys. J. 2023, 955, 87. [Google Scholar] [CrossRef]
- Li, X.; Wang, Y.; Guo, J.; Lyu, S. Solar energetic particles produced during two fast coronal mass ejections. Astrophys. J. Lett. 2022, 928, L6. [Google Scholar] [CrossRef]
- Chikunova, G.; Podladchikova, T.; Dissauer, K.; Veronig, A.M.; Dumbovic, M.; Temmer, M.; Dickson, E.C. Three-dimensional relation between coronal dimming, filament eruption, and CME-A case study of the 28 October 2021 X1. 0 event. Astron. Astrophys. 2023, 678, A166. [Google Scholar] [CrossRef]
- Winter, L.M.; Ledbetter, K. Type II and type III radio bursts and their correlation with solar energetic proton events. Astrophys. J. 2015, 809, 105. [Google Scholar] [CrossRef]
- Papaioannou, A.; Kouloumvakos, A.; Mishev, A.; Vainio, R.; Usoskin, I.; Herbst, K.; Rouillard, A.P.; Anastasiadis, A.; Gieseler, J.; Wimmer-Schweingruber, R.; et al. The first ground-level enhancement of solar cycle 25 on 28 October 2021. Astron. Astrophys. 2022, 660, L5. [Google Scholar] [CrossRef]
- Mishev, A.L.; Kocharov, L.G.; Koldobskiy, S.A.; Larsen, N.; Riihonen, E.; Vainio, R.; Usoskin, I.G. High-resolution spectral and anisotropy characteristics of solar protons during the GLE N◦ 73 on 28 October 2021 derived with neutron-monitor data analysis. Sol. Phys. 2022, 297, 88. [Google Scholar] [CrossRef]
- Chertok, I.M. On some features of the solar proton event on 2021 October 28-GLE73. Mon. Not. R. Astron. Soc. 2022, 517, 2709–2713. [Google Scholar] [CrossRef]
- Bruno, A.; Christian, E.R.; de Nolfo, G.A.; Richardson, I.G.; Ryan, J.M. Spectral Analysis of the September 2017 Solar Energetic Particle Events Based on Multi-Spacecraft Data. Space Weather 2019, 17, 419–437. [Google Scholar] [CrossRef]
- Pallocchia, G.; Laurenza, M.; Consolini, G. On Weibull’s Spectrum of Nonrelativistic Energetic Particles at IP Shocks: Observations and Theoretical Interpretation. Astrophys. J. 2017, 837, 158. [Google Scholar] [CrossRef]
- Band, D.; Matteson, J.; Ford, L.; Schaefer, B.; Palmer, D.; Teegarden, B.; Cline, T.; Briggs, M.; Paciesas, W.; Pendleton, G.; et al. BATSE observations of gamma-ray burst spectra. I-Spectral diversity. Astrophys. J. 1993, 413, 281–292. [Google Scholar] [CrossRef]
- Ellison, D.C.; Ramaty, R. Shock acceleration of electrons and ions in solar flares. Astrophys. J. 1985, 298, 400–408. [Google Scholar] [CrossRef]
- Reames, D.V. Particle energy spectra at traveling interplanetary shock waves. Astrophys. J. 2012, 757, 93. [Google Scholar] [CrossRef]
- Melkumyan, A.A.; Belov, A.V.; Abunina, M.A.; Abunin, A.A.; Eroshenko, E.A.; Yanke, V.G.; Oleneva, V.A. Comparison between statistical properties of Forbush decreases caused by solar wind disturbances from coronal mass ejections and coronal holes. Adv. Space Res. 2019, 63, 1100–1109. [Google Scholar] [CrossRef]
- Veselinovic, N.B.; Savic, M.B.; Maletic, D.M.; Dragic, A.L.; Banjanac, R.M.; Jokovic, D.R.; Knežević, D.; Travar, M.; Udovicic, V.I. Analyzing solar activity with Belgrade muon station: Case study of 2021 November 4th Forbush decrease. Contrib. Astron. Obs. Skaln. Pleso 2023, 53, 148–155. [Google Scholar] [CrossRef]
Disclaimer/Publisher’s Note: The statements, opinions and data contained in all publications are solely those of the individual author(s) and contributor(s) and not of MDPI and/or the editor(s). MDPI and/or the editor(s) disclaim responsibility for any injury to people or property resulting from any ideas, methods, instructions or products referred to in the content. |
© 2024 by the authors. Licensee MDPI, Basel, Switzerland. This article is an open access article distributed under the terms and conditions of the Creative Commons Attribution (CC BY) license (https://creativecommons.org/licenses/by/4.0/).