Abstract
Multichannel radars generally need to utilize a certain amount of training samples to estimate the covariance matrix of clutter for target detection. Due to factors such as severe terrain fluctuations and complex electromagnetic environments, the training samples usually have different statistical characteristics from the data to be detected. One of the most common scenarios is that all data have the same clutter covariance matrix structure, while different data have different power mismatches, called power heterogeneous characteristics. For detection problems in the power heterogeneous clutter environments, we propose detectors based on alternate estimation, using the generalized likelihood ratio test (GLRT) criterion, Rao criterion, Wald criterion, Gradient criterion, and Durbin criterion. Monte Carlo simulation experiments and real data indicate that the detector based on the Rao criterion has the highest probability of detection (PD). Furthermore, when signal mismatch occurs, the detector based on the GLRT criterion has the best selectivity, while the detector based on the Durbin criterion has the most robust detection performance.
1. Introduction
A radar system is an electronic device that employs electromagnetic waves for target detection, which is extensively used in various aspects of life, such as military early warning, wireless communication, navigation, meteorology, and so on. One of the principal roles of radar is to detect targets [1,2,3,4]. Traditional radar target detection can be categorized into two steps: the first step is the filtering process, which involves suppressing clutter to enhance the signal-to-clutter ratio (SCR); the second step is to process the filtered data with a constant false alarm rate (CFAR). This method is complex and costly. In the past few years, adaptive detection has gradually come into people’s sight. Its core idea is to jointly use the data to be detected and training samples to construct an adaptive detector, which integrates filtering and CFAR processing [5]. Compared with the step-by-step detection method, adaptive detection technology not only simplifies the process but also improves detection performance.
It is important to mention that the clutter covariance matrix is typically unknown and requires estimation using training samples [6]. The traditional assumption model holds that the training samples and the data to be detected have the same statistical characteristics, following a complex Gaussian distribution [7], but this assumption often does not hold in complex electromagnetic environments. Due to factors such as clutter fluctuations in real scenarios, environments often show non-homogeneous characteristics, especially non-Gaussian environments. However, training samples should have some similarities to the data to be detected [8]; otherwise, they cannot provide useful information. In 1999, Kraut et al. put forward the generalized likelihood ratio test (GLRT) detector in a partially homogeneous environment, known as the adaptive coherence estimator [9]. In a partially homogeneous environment, the training samples share the same covariance matrix, but an unknown power mismatch exists between the training samples and the data to be detected. In a complicated and changeable real environment, this assumption is also too idealistic.
As the resolution of radar enhances, the quantity of scatterers within each resolution cell diminishes, leading to different levels of local roughness of clutter within different range resolution cells and causing larger amplitude fluctuations. In such cases, clutters exhibit non-Gaussian characteristics [10,11,12]. The distribution of amplitudes for non-Gaussian clutter exhibits a heavier tail, rendering the Gaussian model insufficient in accurately describing such clutter. The compound-Gaussian model [13,14,15] is an extensively accepted model for modeling non-Gaussian clutter, which can be characterized as the product of mutually independent slow-changing texture components and fast-changing speckle components, where the former is a non-negative random variable and the latter is a complex Gaussian random vector. Non-Gaussian clutter can be expressed as various compound-Gaussian models, depending on the specific texture component models. When the texture component follows a gamma distribution, the compound-Gaussian clutter is K distribution clutter. It can describe non-homogeneous clutter well at high resolution and small grazing angles. When the texture component follows an inverse gamma distribution, compound-Gaussian clutter is Pareto distribution clutter. It is more suitable for describing clutter with heavy tails. When the texture component follows an inverse Gaussian distribution, compound-Gaussian clutter is CG-IG distribution clutter. It has a better fitting capability for high-resolution sea clutter. Among them, the most common clutter is K distribution clutter [16,17,18]. However, not all types of real clutter can be modeled as a compound-Gaussian model. Additionally, some models that fit real clutter well do not conform to the compound-Gaussian model, such as Weibull distribution [19] and Log-Normal distribution [20]. Under the compound-Gaussian model, it is often necessary to assign a certain prior statistical distribution to the texture component [21], but real clutter environments may not necessarily correspond to the given distribution. In this case, the detector, designed according to the predetermined statistical distribution of the texture component, is bound to result in performance loss.
To solve the aforementioned problem, it is assumed in [22] that there also exists unknown power mismatches between the training samples, and the amount of mismatches are unknown non-random and non-negative quantities. This model is an important complement to the compound-Gaussian model, which can also be transformed from the compound-Gaussian model. Based on the GLRT criterion, together with the alternate estimation algorithm, Coluccia et al. proposed an adaptive detector in [22], which has the CFAR property and offers better detection performance compared with the well-known adaptive normalized matched filter (ANMF).
It is important to highlight that the detection problem for only rank-one point targets is considered in [22], and the detector design is solely based on the GLRT criterion. However, in practice, the signal might be categorized as a subspace signal, which is an extension of rank-one signals and refers to the signal located in the known subspace with unknown coordinates. Meanwhile, for target detection problems in real scenarios, there is often no optimal detector due to the presence of too many unknown parameters. In addition to the GLRT criterion, other useful detector design criteria also include the Rao criterion, Wald criterion, Gradient criterion, and Durbin criterion, among others. Therefore, in this paper, we extend the signal model in [22], extending the rank-one model to the subspace signal model, and design detectors based on the GLRT criterion, Rao criterion, Wald criterion, Gradient criterion, and Durbin criterion.
In addition, signal mismatch was not considered in [22]. In practical applications, factors such as array element errors, multipath effects, and rapid maneuvers of targets often lead to signal mismatch [23,24,25], meaning that the actual steering vector of the target does not match the value assumed by the radar system. There is a type of detector whose detection performance sharply degrades with signal mismatch increases, known as mismatch-sensitive detectors, which are usually applied in fields such as target tracking [26]. Conversely, another type of detector can still detect targets with a high probability when signal mismatch occurs, known as robust detectors, which are usually applied in fields such as searching models [27]. Therefore, in the performance evaluation, we also consider the performance of proposed detectors when signal mismatch occurs.
In summary, this paper investigates the detection problem for subspace signals in a power heterogeneous clutter environment. Utilizing the GLRT criterion, Rao criterion, Wald criterion, Gradient criterion, and Durbin criterion, in conjunction with the iterative concept of alternating estimation, we propose a variety of detectors, named the alternating estimation GLRT (AE-GLRT) detector, alternating estimation Rao (AE-Rao) detector, alternating estimation Wald (AE-Wald) detector, alternating estimation Gradient (AE-Gradient) detector, and alternating estimation Durbin (AE-Durbin) detector, respectively. Monte Carlo simulation experiments and IPIX radar data both demonstrate that the AE-Rao detector has the highest probability of detection (PD) in the absence of signal mismatch. When signal mismatch occurs, the AE-GLRT exhibits the best selectivity, while the AE-Durbin offers the most robust performance.
Notation: Vectors are represented by bold lowercase letters, whereas matrices are represented by bold uppercase letters. The symbols , , , , , , , and express transpose, conjugate, conjugate transpose, inverse, generalized inverse, partial derivative, the real part of a parameter, and the matrix determinant, respectively. denotes the estimation of , indicates statistical expectation, and represents the dimensional complex field.
2. Problem Formulation
According to the compound-Gaussian model, vector represents the clutter in the cell under test (CUT), which can be denoted as
where represents the slowly changing texture component, which is generally a non-negative random variable and represents the rapidly changing speckle component, following a circular symmetric complex Gaussian distribution with conditional covariance matrix , where represents the unknown clutter covariance matrix. The training samples can be expressed as , whose conditional covariance matrix is .
Assume that the radar system possesses N channels. If a signal exists, it can be expressed as vector . For subspace signals, assuming is located in the subspace , it can be represented as . Therefore, in the power heterogeneous clutter environment, the detection problem can be represented by the following binary hypothesis test
where is the data to be detected, represents the training samples, is a known column-full-rank signal matrix, denotes an unknown signal coordinate vector, represents the unknown clutter covariance matrix, and are unknown parameters that denote the different power mismatch amounts between each training sample and the data to be detected.
As mentioned above, the detection model in (2) can be transformed from the compound-Gaussian model. Specifically, dividing all the clutter data by yields the clutter in the CUT as with conditional covariance matrix , where the value of can be estimated by [24]. Meanwhile, the training samples can be rewritten as . According to the definition of above, we set , so the training samples can be written as with conditional covariance matrix being . In addition, this paper regards as definite unknown parameters, which can increase the applicability of this model; that is, it is not limited to a particular compound-Gaussian clutter with a predetermined texture distribution.
3. Detector Design
The joint probability density functions (PDFs) of the data to be detected and the training samples under hypotheses and can be expressed as
and
respectively, where denotes the matrix of training samples and represents the column vector of power mismatches between the training samples and the data to be detected. The following subsections will design detectors according to the GLRT criterion, Rao criterion, Wald criterion, Gradient criterion, and Durbin criterion.
3.1. AE-GLRT Detector
The GLRT design criterion can be formulated as [28]
where denotes the detection threshold set based on the predesigned PFA. Under hypothesis , taking the partial derivative of (3) with respect to to be zero, we can obtain the maximum likelihood estimation (MLE) of for a given as
Utilizing the same method, we can derive the MLE of under hypothesis as
Substituting (6) and (7) into (3) and (4), respectively, we can obtain
and
Directly solving for the MLE of and does not yield a closed-form solution. Therefore, we use the alternate estimation algorithm to address this problem. For ease of expression, we specify the following symbols: and represent the initial value and final estimation of under hypothesis , respectively. denotes the final estimation of under hypothesis ; and represent the initial value and final estimation of under hypothesis , respectively.
The estimation process is as follows: First, we let the initial value of under hypothesis be [22], and can be obtained by (A4); then, we obtain based on (A8). The process is repeated in a loop until the maximum number of iterations is reached. In this paper, we set it to 15, whose validity will be shown in the fourth section. Algorithm 1 details the steps of the alternate estimation iterative algorithm.
| Algorithm 1 The algorithm of alternate estimation. |
| Input: , and Output: , and
|
3.2. AE-Rao Detector
The Rao design criterion can be expressed as [29]
where is the value at of the block of the inverse of the fisher information matrix (FIM) . It is known by the matrix partitioning lemma
For the complex parameter , its FIM is defined as
which can be divided into
with
being a dimensional parameter vector. denotes the relevant paramater and represents the irrelevant parameter. indicates the MLE of parameter under hypothesis with and . indicates the MLE of parameter under hypothesis with and . According to (3), the partial derivatives of with respect to and are
and
respectively. According to the definition of (14), substituting (16) and (17) into (13) results in
can be written as
We can derive the following two equations according to (17)
and
Substituting (18), (19), (20), and (21) into (12) results in
Substituting (16), (17) and (22) into (11) yields the AE-Rao for the given as
Substituting the final alternate estimation of into (7) results in the MLE of under hypothesis as
where the value of can be obtained by (A9) and (A10). For convenience, we define . Substituting (24) into (23) and ignoring the constant terms results in the AE-Rao as
3.3. AE-Wald Detector
The Wald design criterion can be expressed as [29]
Nulling the derivative of (3) with respect to yields the MLE of for the given as
Plugging (22) and (27) into (26) results in the AE-Wald for the given as
Substituting the final alternate estimations of and into (6) results in the MLE of under hypothesis as
where the values of and can be obtained by iterating (A4) and (A8) to the . For convenience, we define . Substituting (29) into (28) and ignoring the constant terms lead to the AE-Wald as
3.4. AE-Gradient Detector
The Gradient design criterion can be written as [30]
Substituting (16) and (27) into (31) results in the AE-Gradient for the given as
The MLE of under hypotheses and are (29) and (24), respectively. Substituting (30) and (24) into (32), simplifying with the definition of and , and ignoring the constant terms yield the AE-Gradient as
3.5. AE-Durbin Detector
4. Performance Evaluation
We evaluate the proposed detectors with simulated and measured data in this section. To measure the relative variation of the clutter covariance matrix across consecutive iterations, we define the relative variation function
where represents the Frobenius norm of a matrix and denotes the estimation of after t iterations.
Figure 1 illustrates the relative change in the estimation of the covariance matrix over successive iterations under hypotheses and . Obviously, as the number of iterations increases, the degree of relative change in gradually decreases. When the number of iterations exceeds 15, the degree of relative change gradually slows down. Considering the time complexity of the algorithm, the number of iterations for the power mismatches and the coordinate vector is set to be 15.
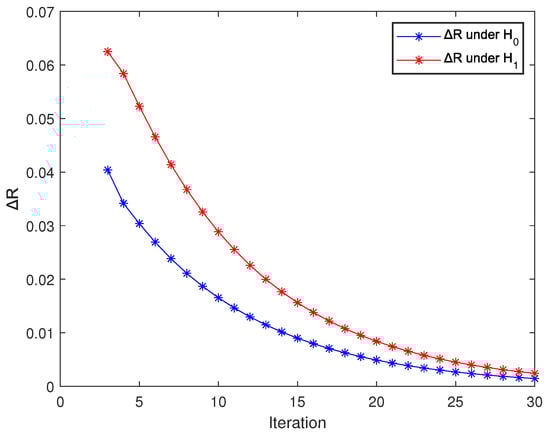
Figure 1.
The relative variation in the estimation of the covariance matrix across successive iterations.
4.1. Simulation Experiment
First, we set the number of system channels to 8, the number of training samples to 16, the dimension of signal subspace to 3, and the expected PFA to . A total of Monte Carlo simulations are run to derive the detection threshold, and independent repeated tests are used to calculate the PD.
In the simulation experiment, the speckle component follows a zero-mean complex Gaussian random process, and its covariance matrix is [31]
where denotes the one-lag correlation coefficient, set to 0.95.
In this paper, the SCR is defined as [32]
In the experiment, we set , where and are randomly generated, but fixed after generation. is the set regulatory factors to meet the given SCR as
In addition, the detection performance when the signal mismatch occurs is also discussed in this paper. For subspace signals, signal mismatch refers to the fact that the actual signal is not entirely located in the assumed subspace . For the purpose of quantifying the degree of signal mismatch, we employ the generalized cosine square [33]
We consider K distribution clutter, whose texture component follows a gamma distribution with the PDF as [18]
where v is the shape parameter, representing the degree of the clutter trailing, and u is the scale parameter, representing the size of clutter power. Note that the smaller the shape parameter, the heavier the clutter trailing degree and the stronger the non-Gaussian characteristics. In the experiment, we set v to 1. Under the condition of a given texture component , the condition PDF of the clutter amplitude is
From the full probability formula, the PDF of the clutter amplitude is
Substituting (42) and (43) into (44) results in
where represents the modified Bessel function of the second kind and v-th order. The cumulative distribution function (CDF) of the K distribution can be obtained by integrating (45) as
In Figure 2, we use simulated data to compare the variation in PDs of the proposed detectors with respect to SCR; we can find that AE-GLRT, AE-Rao, AE-Wald, and AE-Gradient have similar PDs, but the performance of AE-Rao is slightly better than the other three proposed detectors. Specifically, when the , AE-Rao can detect almost exactly for the given PFA. However, the PD of AE-Durbin is relatively low, when the SCR = 27 dB, PD is close to 0.91; when the SCR = 35 dB, PD is close to 1.
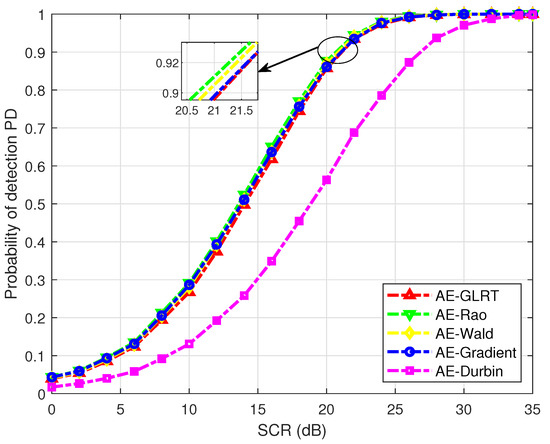
Figure 2.
Probability of detection (PD) versus signal-to-clutter ratio (SCR) without signal mismatch with simulated data.
Figure 3 depicts the variation in PDs when signal mismatch occurs at SCR = 35 dB. Signal mismatch refers to the case that the actual signal is not entirely located within the nominal signal subspace spanned by the columns of . A quantity to measure the amount of signal mismatch is given in (41). Note that the case indicates that the actual signal completely lies in the signal subspace assumed by the radar system. In contrast, means that the actual signal is orthogonal to the signal subspace assumed by the radar system. We use Figure 3 to measure the robustness or selectivity of the proposed detectors to mismatched signals. The robustness of a detector refers to the ability of the detector to detect targets with a high probability when signal mismatch occurs. The selectivity of a detector refers to the ability to decrease the PD of a detector when signal mismatch occurs. Figure 3 indicates that AE-Rao and AE-GLRT have better selectivity, while AE-Durbin is the most robust.
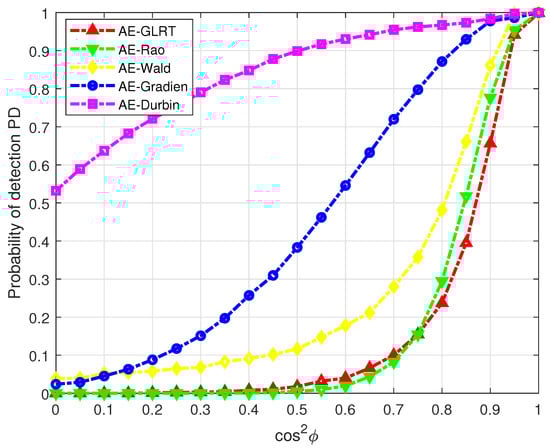
Figure 3.
PD versus with signal mismatch with simulated data. .
Figure 4 demonstrates the PDs at different SNRs with v as a parameter. It is evident that as the shape parameter v decreases, indicating stronger non-Gaussian characteristics of the clutter, there is an enhancement in the PDs of all detectors. Moreover, as indicated in Figure 4a,b, the PD of AE-Rao remains the highest.
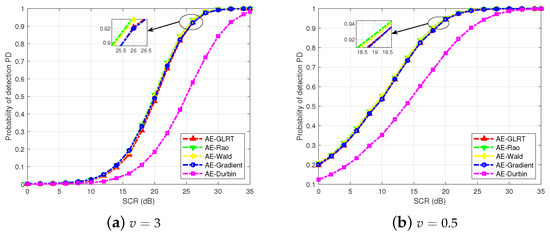
Figure 4.
PD versus SCR without signal mismatch with simulated data for different v.
4.2. Real Data Experiment
We utilize a set of sea clutter measured data with a range resolution of 60 m from the IPIX database in 1998, named “19980204_223753_ANTSTEP.mat”, including 60,000 pulses and 28 range cells. We selected the 13th range cell as the CUT, divided the data within it into 200 equally spaced segments, and used the histogram density estimation method to plot the empirical PDF and CDF curves of the real data. To verify the rationality of the selected measured data, we used the fractional moment estimation method (MoFM) [34,35,36] for the real data to calculate the parameters of three common compound-Gaussian distributions, namely, the shape parameters and scale parameters of K distribution, Pareto and CG−IG distributions, and plotted the amplitude PDF and CDF curves of the three compound-Gaussian distributions. Specifically, to reduce the error caused by abnormal samples, for K-distributed clutter, we use the first moment and the half-order moment of the clutter samples for parameter estimation, which are denoted by and , with the expressions as follows
where (47) serves as an implicit function of v. It is worth mentioning that the gamma function is defined as . So we can eliminate u, unfold, and simplify (47), learning that v has a unique solution. Next, we use the lookup table method or employ the function in MATLAB to find the solution. As shown in Figure 5 and Figure 6, the K distribution provides a better fit to the real data.
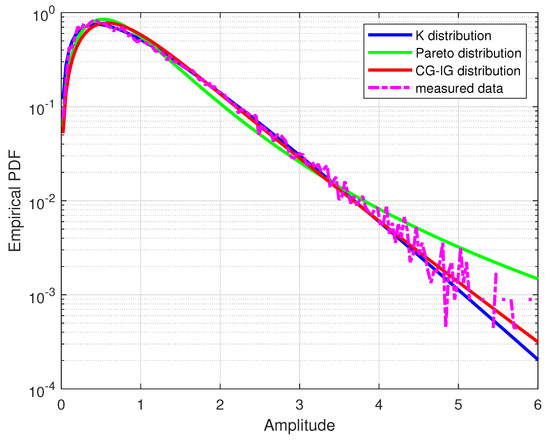
Figure 5.
Compound-Gaussian distribution PDF fitting to empirical PDF of real data.
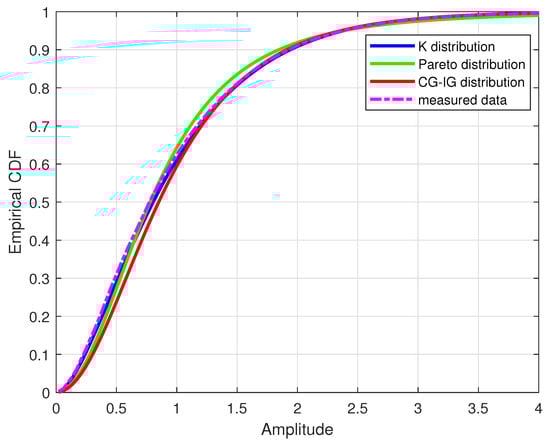
Figure 6.
Compound-Gaussian distribution CDF fitting to empirical CDF of real data.
To further measure the fitting degree of the three compound-Gaussian distributions mentioned above to the real data, Kolmogorov-Smirnov (KS) distance is commonly used as a metric. In addition, we plot the fitting results of the clutter amplitude distribution of real data in Figure 7. Here, the vertical axis represents the domain, which is equivalent to the meaning of the PFA [37]. As the PFA we set is , we narrow the scope of the KS test to around , and the corresponding expression of the KS distance can be written as
where represents the empirical CDF obtained from the real data and represents the fitting CDF obtained through parameter estimation based on the selected distribution model. Table 1 indicates that the KS distance for the K distribution fit is 0.0011 for the PFA we set. As we know, a smaller KS distance indicates a better fit between the empirical CDF of clutter amplitude and the selected clutter model. So, we can draw a conclusion that the K distribution still offers a good fit. It is worth noting that using real data with good fitting results from the K distribution for experiments aims to correspond better with simulation experiments. In this paper, the power mismatch of the training samples obtained through iterative estimation does not need to consider the specific distribution of clutter.
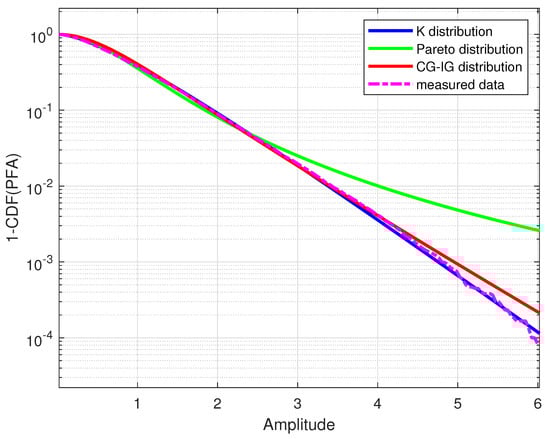
Figure 7.
Compound-Gaussian distribution modeling results of real data.

Table 1.
Kolmogorov-Smirnov (KS) distances for each distribution fit.
We set due to the limited availability of pulses in the real data, and selected the and range cells near the CUT as training samples. The other parameters are consistent with the simulation experiment.
In Figure 8, we graph the PDs of the proposed detectors across various SCRs in the absence of signal mismatch. The observation reveals that the results from the real data are basically consistent with the simulation experiment. The detection performances of AE-GLRT, AE-Rao, AE-Wald, and AE-Gradient are comparable and significantly better than AE-Durbin. Specifically, AE-Rao still has the highest PD, and the performances of AE-Wald and AE-Gradient slightly surpass that of AE-GLRT.
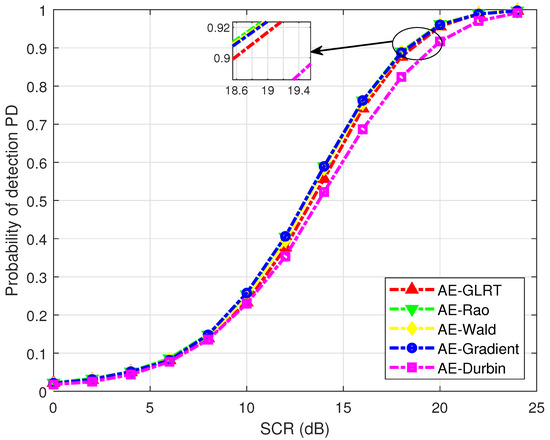
Figure 8.
PD versus SCR without signal mismatch with IPIX radar data.
In Figure 9, utilizing the measured data from the IPIX radar, we compare and analyze the variation in the PDs of the proposed detectors in relation to the degree of signal mismatch. It can be observed that the result of the measured data is also basically consistent with the simulation experiment, indicating that AE-Durbin has the strongest robustness; when the signal mismatch angle is approximately 53 degrees, AE-Durbin can still detect the target with a PD of 0.9, while both AE-GLRT and AE-Rao have good selectivity, but AE-GLRT has stronger selectivity, indicating a better ability to suppress mismatched signals.
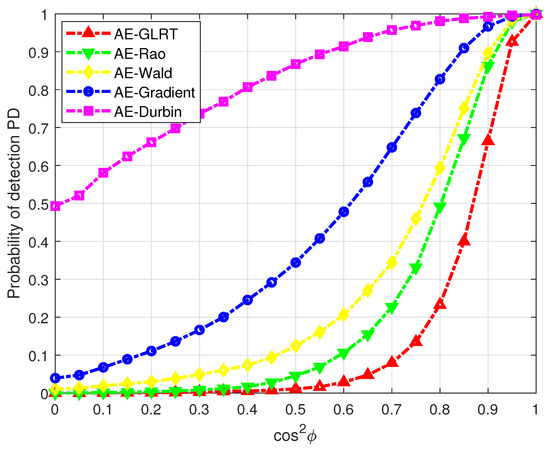
Figure 9.
PD versus with signal mismatch with IPIX radar data. .
Meanwhile, we also conduct experiments with “19980204_224024_ANTSTEP.mat” real data, which is well fitted by the Pareto distribution, and the results are basically consistent with the above. We can reasonably infer that the detectors proposed in this paper have a certain universality in power heterogeneous clutter environments.
5. Conclusions
In this article, we investigated the adaptive detection problem of subspace signals within power heterogeneous clutter environments. Based on the GLRT, Rao, Wald, Gradient, and Durbin criteria, we used an alternate estimation iterative algorithm to design five adaptive detectors: AE-GLRT, AE-Rao, AE-Wald, AE-Gradient, and AE-Durbin. The simulation experiments and measured data illustrated that AE-Rao had a relatively higher PD when there was no signal mismatch. However, in the case of signal mismatch, AE-GLRT had the best selectivity, whereas AE-Durbin had the most robust detection performance.
Author Contributions
Conceptualization, H.C.; methodology, D.X.; software, H.L.; validation, B.L.; formal analysis, H.C.; investigation, W.L.; writing—original draft preparation, D.X.; writing—review and editing, W.L.; visualization, H.L.; supervision, W.L. All authors have read and agreed to the published version of the manuscript.
Funding
This work was supported in part by the National Natural Science Foundation of China under grant 62071482.
Data Availability Statement
The data utilized in this study are available from the first or corresponding authors upon a reasonable request.
Acknowledgments
The authors would like to express appreciation for the valuable comments of the associate editors and anonymous reviewers.
Conflicts of Interest
The authors declare no conflicts of interest.
Appendix A
In order to find the final value of the alternate estimation of under hypothesis , we set
where and the superscript t indicates the t-th estimation of the matrix .
By the matrix determinant lemma, for matrices , and of compatible dimensions, it holds that
so (A1) can be simplified to
Calculating the partial derivative of (A3) with respect to and setting it to zero result in
where the superscript indicates the -th estimation of . Next, solve for . From (8), we define
where
The above simplification used (A2). Upon analyzing (A5), it can be seen that when , ; when , . Therefore, a certain value within exists that minimizes . Taking the partial derivative of (A5) with respect to results in
We can further obtain that
where . To date, we can give an initial value of and loop from (A4) and (A8) to the termination condition, and we can obtain the final estimation of and under hypothesis .
Obviously, we can set under hypothesis . Then, we also need to calculate the estimations of under hypothesis , which is similar to the derivation under hypothesis , so we directly give the following expressions
and
References
- Zhang, C.; Xu, Y.; Chen, W.; Chen, B.; Gao, C.; Liu, H. IfCMD: A Novel Method for Radar Target Detection under Complex Clutter Backgrounds. Remote Sens. 2024, 16, 2199. [Google Scholar] [CrossRef]
- Xue, J.; Fan, Z.; Xu, S.; Liu, J. Persymmetric Adaptive Radar Target Detection in CG-LN Sea Clutter Using Complex Parameter Suboptimum Tests. IEEE Trans. Geosci. Remote Sens. 2023, 61, 5111211. [Google Scholar] [CrossRef]
- Liu, W.; Han, H.; Liu, J.; Li, H.; Li, K.; Wang, Y.L. Multichannel radar adaptive signal detection in interference and structure nonhomogeneity. Sci. China Inf. Sci. 2017, 60, 112302. [Google Scholar] [CrossRef]
- Xue, J.; Yan, J.; Pan, M.; Xu, S. Knowledge-aided adaptive Gradient test for radar targets in correlated compound Gaussian sea clutter with lognormal texture. IEEE Geosci. Remote Sens. Lett. 2023, 20, 3509105. [Google Scholar] [CrossRef]
- Liu, W.; Liu, J.; Hao, C.; Gao, Y.; Wang, Y.L. Multichannel adaptive signal detection: Basic theory and literature review. Sci. China Inf. Sci. 2022, 65, 121301. [Google Scholar] [CrossRef]
- Kelly, E.J. An Adaptive Detection Algorithm. IEEE Trans. Aerosp. Electron. Syst. 1986, 22, 115–127. [Google Scholar] [CrossRef]
- Shuai, X.; Kong, L.; Yang, J. Adaptive detection for distributed targets in Gaussian noise with Rao and Wald tests. Sci. China Inf. Sci. 2012, 55, 1290–1300. [Google Scholar] [CrossRef]
- Liu, W.; Zhang, Z.; Liu, J.; Shang, Z.; Wang, Y.L. Detection of a rank-one signal with limited training data. Signal Process. 2021, 186, 108120. [Google Scholar] [CrossRef]
- Kraut, S.; Scharf, L.L. The CFAR adaptive subspace detector is a scale-invariant GLRT. IEEE Trans. Signal Process. 1999, 47, 2538–2541. [Google Scholar] [CrossRef]
- Xu, S.; Shi, X.; Xue, J.; Shui, P. Adaptive subspace detection of range-spread target in compound Gaussian clutter with inverse Gaussian texture. Digit. Signal Process. 2018, 81, 79–89. [Google Scholar] [CrossRef]
- Xue, J.; Xu, S.; Shui, P. Near-optimum coherent CFAR detection of radar targets in compound-Gaussian clutter with inverse Gaussian texture. Signal Process. 2020, 166, 107236. [Google Scholar] [CrossRef]
- Xue, J.; Xu, S.; Shui, P. Knowledge-based adaptive detection of radar targets in generalized Pareto clutter. Signal Process. 2018, 143, 106–111. [Google Scholar] [CrossRef]
- Balleri, A.; Nehorai, A.; Wang, J. Maximum likelihood estimation for compound-Gaussian clutter with inverse gamma texture. IEEE Trans. Aerosp. Electron. Syst. 2007, 43, 775–779. [Google Scholar] [CrossRef]
- Ollila, E.; Tyler, D.E.; Koivunen, V.; Poor, H.V. Compound–Gaussian clutter modeling with an inverse Gaussian texture distribution. IEEE Signal Process. Lett. 2012, 19, 876–879. [Google Scholar] [CrossRef]
- Shang, X.; Song, H. Radar detection based on compound-Gaussian model with inverse gamma texture. IET Radar Sonar Navig. 2011, 5, 315–321. [Google Scholar] [CrossRef]
- Jiang, Q.; Wu, Y.; Liu, W.; Zheng, D.; Jian, T.; Gong, P. Subspace-based distributed target detection in compound-Gaussian clutter. Digit. Signal Process. 2023, 140, 104141. [Google Scholar] [CrossRef]
- Dong, Y. Optimal coherent radar detection in a K-distributed clutter environment. IET Radar Sonar Navig. 2012, 6, 283–292. [Google Scholar] [CrossRef]
- Shui, P.l.; Liu, M.; Xu, S.w. Shape-parameter-dependent coherent radar target detection in K-distributed clutter. IEEE Trans. Aerosp. Electron. Syst. 2016, 52, 451–465. [Google Scholar] [CrossRef]
- Chen, Z.; Chen, A.; Liu, W.; Ma, X. CFAR Detection in Nonhomogeneous Weibull Sea Clutter for Skywave OTHR. IEEE Geosci. Remote Sens. Lett. 2023, 20, 3508005. [Google Scholar] [CrossRef]
- Trunk, G.; George, S. Detection of targets in non-Gaussian sea clutter. IEEE Trans. Aerosp. Electron. Syst. 1970, 5, 620–628. [Google Scholar] [CrossRef]
- Xu, S.W.; Xue, J.; Shui, P.L. Adaptive detection of range-spread targets in compound Gaussian clutter with the square root of inverse Gaussian texture. Digit. Signal Process. 2016, 56, 132–139. [Google Scholar] [CrossRef]
- Coluccia, A.; Orlando, D.; Ricci, G. A GLRT-like CFAR detector for heterogeneous environments. Signal Process. 2022, 194, 108401. [Google Scholar] [CrossRef]
- Liu, W.; Liu, J.; Huang, L.; Yang, Z.; Yang, H.; Wang, Y.L. Distributed target detectors with capabilities of mismatched subspace signal rejection. IEEE Trans. Aerosp. Electron. Syst. 2017, 53, 888–900. [Google Scholar] [CrossRef]
- Tang, P.; Wang, Y.L.; Liu, W.; Du, Q.; Wu, C.; Chen, W. A tunable detector for distributed target detection in the situation of signal mismatch. IEEE Signal Process. Lett. 2019, 27, 151–155. [Google Scholar] [CrossRef]
- Liu, W.; Liu, J.; Gao, Y.; Wang, G.; Wang, Y.L. Multichannel signal detection in interference and noise when signal mismatch happens. Signal Process. 2020, 166, 107268. [Google Scholar] [CrossRef]
- Coluccia, A.; Ricci, G. A tunable W-ABORT-like detector with improved detection vs. rejection capabilities trade-off. IEEE Signal Process. Lett. 2014, 22, 713–717. [Google Scholar] [CrossRef]
- Conte, E.; De Maio, A.; Ricci, G. GLRT-based adaptive detection algorithms for range-spread targets. IEEE Trans. Signal Process. 2001, 49, 1336–1348. [Google Scholar] [CrossRef]
- Liu, B.; Chen, B.; Michels, J.H. A GLRT for multichannel radar detection in the presence of both compound Gaussian clutter and additive white Gaussian noise. Digit. Signal Process. 2005, 15, 437–454. [Google Scholar] [CrossRef]
- Sun, M.; Liu, W.; Liu, J.; Hao, C. Rao and wald tests for target detection in coherent interference. IEEE Trans. Aerosp. Electron. Syst. 2021, 58, 1906–1921. [Google Scholar] [CrossRef]
- Besson, O. Adaptive detection of Gaussian rank-one signals using adaptively whitened data and Rao, gradient and Durbin tests. IEEE Signal Processing Letters 2023, 30, 399–402. [Google Scholar] [CrossRef]
- Gini, F.; Greco, M. Covariance matrix estimation for CFAR detection in correlated heavy tailed clutter. Signal Process. 2002, 82, 1847–1859. [Google Scholar] [CrossRef]
- Liu, W.; Wang, Y.L.; Liu, J.; Huang, L.; Hao, C. Performance analysis of adaptive detectors for point targets in subspace interference and Gaussian noise. IEEE Trans. Aerosp. Electron. Syst. 2017, 54, 429–441. [Google Scholar] [CrossRef]
- Yufeng, C.; Yongliang, W.; Weijian, L.; Qinglei, D.; Xichuan, Z.; Xuhui, L. A tunable adaptive detector for distributed targets when signal mismatch occurs. J. Syst. Eng. Electron. 2023, 34, 873–878. [Google Scholar]
- Xue, J.; Xu, S. Parameters estimation based on moments and Nelder-Mead algorithm for compound-Gaussian clutter with inverse Gaussian texture. In Proceedings of the 2016 IEEE International Conference on Signal Processing, Communications and Computing (ICSPCC), Hong Kong, China, 5–8 August 2016; pp. 1–5. [Google Scholar]
- Iskander, D.R.; Zoubir, A.M. Estimation of the parameters of the K-distribution using higher order and fractional moments [radar clutter]. IEEE Trans. Aerosp. Electron. Syst. 1999, 35, 1453–1457. [Google Scholar] [CrossRef]
- Gini, F.; Greco, M. Texture modelling, estimation and validation using measured sea clutter data. IEE Proc.-Radar Sonar Navig. 2002, 149, 115–124. [Google Scholar] [CrossRef]
- Chan, H. Radar sea-clutter at low grazing angles. IEE Proc. F (Radar Signal Process.) 1990, 137, 102–112. [Google Scholar] [CrossRef]
Disclaimer/Publisher’s Note: The statements, opinions and data contained in all publications are solely those of the individual author(s) and contributor(s) and not of MDPI and/or the editor(s). MDPI and/or the editor(s) disclaim responsibility for any injury to people or property resulting from any ideas, methods, instructions or products referred to in the content. |
© 2024 by the authors. Licensee MDPI, Basel, Switzerland. This article is an open access article distributed under the terms and conditions of the Creative Commons Attribution (CC BY) license (https://creativecommons.org/licenses/by/4.0/).