Abstract
This study utilizes multi-sensor satellite images and machine learning methodology to analyze urban impervious surfaces, with a particular focus on Nanchang, Jiangxi Province, China. The results indicate that combining multiple optical satellite images (Landsat-8, CBERS-04) with a Synthetic Aperture Radar (SAR) image (Sentinel-1) enhances detection accuracy. The overall accuracy (OA) and kappa coefficients increased from 84.3% to 88.3% and from 89.21% to 92.55%, respectively, compared to the exclusive use of the Landsat-8 image. Notably, the Random Forest algorithm, with its unique dual-random sampling technique for fusing multi-sensor satellite data, outperforms other machine learning methods like Artificial Neural Networks (ANNs), Support Vector Machines (SVMs), Classification and Regression Trees (CARTs), Maximum Likelihood Classification (Max-Likelihood), and Minimum Distance Classification (Min-Distance) in impervious surface extraction efficiency. With additional satellite images from 2015, 2017, and 2020, the impervious surface changes are tracked in the Nanchang metropolitan region. From 2015 to 2021, they record a notable increase in impervious surfaces, signaling a quickened urban expansion. This study observes several impervious surface growth patterns, such as a tendency to concentrate near rivers, and larger areas in the east of Nanchang. While the expansion was mainly southward from 2015 to 2021, by 2021, the growth began spreading northward around the Gan River basin.
Keywords:
impervious surface; Landsat-8; Sentinel-1; CBERS-04; random forest; fusion; dual-polarized SAR 1. Introduction
The accelerated pace of global urbanization in recent decades has noticeably increased the presence of impervious surfaces, giving rise to a multitude of environmental concerns. These include the urban heat island effect, subsidence, flooding, and the degradation of water quality [1,2]. Alterations to impervious surfaces serve as a clear illustration of urbanization’s distribution and scale [3]. As a result, the meticulous, accurate, and prompt gathering of data regarding these surfaces is vital for the effective monitoring of urban growth, and for analyzing the quality of the urban environment and its ecology.
Despite the availability of sub-meter resolution satellite imagery, medium-resolution data (across approximately 10s of meters) are broadly employed due to their extensive historical records and cost-effectiveness [4]. For comprehensive studies on urban impervious surface detection, medium-resolution remote sensing images such as the Landsat dataset [5,6] and the Moderate Resolution Imaging Spectroradiometer (MODIS) [7,8] serve as significant data sources. These images provide vast spatial coverage and frequent data collection. However, their relatively low resolution leads to numerous mixed pixels, undermining the accuracy of impervious surface detection, especially in densely populated cities and areas with intricate land cover. For example, these mixed pixels frequently cause an overestimation of urban impervious layers.
The analysis and extraction of impervious surfaces can be conducted at varying scales of sub-pixels, image elements, and features using methods such as object-oriented classification [9] and linear spectral mixture analysis (LSMA) [10,11]. In most studies focused on impervious surface detection, multispectral data from a single satellite sensor have been utilized, such as those from the Operational Land Imager (OLI) onboard the Landsat or the Terra Advanced Spaceborne Thermal Emission and Reflection Radiometer (ASTER). However, the dependence on spectral observations from a single sensor might not accurately encapsulate the diverse spectral information of the ground surface, resulting in potential errors in impervious surface classifications. To boost the accuracy of urban impervious surface extraction, analysts have begun to incorporate multiple sources of surface features in their satellite image analyses. These include night-light data [12], Light Detection and Ranging (LiDAR) data [13], and Synthetic Aperture Radar (SAR) data [14]. Notably, SAR can observe ground surfaces across varying wavelengths and polarizations, demonstrating high sensitivity to the structure of the target surface and thus providing rich spatial characteristics of urban impervious surfaces [15]. Consequently, the fusion of optical and SAR images has been utilized for detecting urban impervious surfaces [14].
Remote sensing image fusion methods can be broadly categorized into three primary categories: pixel-level, feature-level, and decision-level [16,17]. Of these, feature-level fusion is particularly compatible with Synthetic Aperture Radar (SAR) data, as it is less influenced by scattering noise and does not necessitate the weighting of each component [18]. Commonly employed SAR features encompass backscatter coefficients, SAR texture features, and polarization features. Among these, polarization features are notably critical as they preserve sensitivity to a wide range of land covers and physical properties [19,20,21,22,23,24,25]. By considering these features, a more comprehensive and nuanced understanding of land surfaces, particularly impervious ones, can be achieved, further enhancing the accuracy of urban environment analyses and related decision-making processes.
In recent years, the use of advanced machine learning techniques has significantly improved the detection of impervious surfaces from satellite imagery [26,27]. Techniques such as Classification and Regression Trees (CARTs) [28,29,30], the Random Forest (RF) method [31,32], Artificial Neural Networks (ANNs) [33,34,35,36], and Support Vector Machines (SVMs) [37,38,39,40] are examples of these methodologies. For instance [41], Lodato et al. (2023) employed RF classification on Landsat imagery and, through remote sensing techniques and innovative cloud services, documented the transformation of the northern coastal region of Rome, an important rural area, into new residential and commercial services [42]. Moreover, Dong et al. (2021) probed the spatial and temporal variations of impervious surfaces within Beijing’s sixth-ring highway using Landsat imagery data from 1997 to 2017, employing the RF method. The results showed a 16.23% improvement in classification accuracy for highly reflective impervious surfaces, signifying the effectiveness of machine learning techniques in enhancing the precision of impervious surface detection [43]. Traditional algorithms have been widely employed in previous research and are effective for handling classification data. However, when confronted with the rich diversity of spectral information, traditional algorithms may not fully leverage the classification advantages offered by such rich spectral information. Therefore, this paper compares various classification algorithms and identifies a more suitable approach. The classification based on the Random Forest (RF) method is a form of ensemble learning belonging to the ‘bagging’ category, which has unique advantages for handling high-dimensional data. When combined with the fusion of multispectral and SAR data, it yields significantly improved results in impervious surface extraction.
The amalgamation of multi-satellite data and the application of machine learning techniques have both been proven to enhance the accuracy of impervious surface extraction. Yet, there have been limited attempts to merge these methods in order to optimize impervious surface estimation via satellite observations. As such, the objective of this study is to meld machine learning technology with the fusion of data from multiple satellites in order to elevate the techniques of impervious surface extraction. The incorporation of Synthetic Aperture Radar (SAR) imagery has been validated as a beneficial component in the detection of urban impervious surfaces [14]. Although this methodology has notably enhanced the extraction results of such surfaces, the existent literature still lacks comparative analyses utilizing multiple optical datasets, particularly considering impervious surfaces’ pronounced reflectance in the thermal infrared band. Building on this foundation, our study leverages the fusion of multiple distinct sets of optical data with SAR data. This combination enriches the spectral characteristics of the optical imagery, amplifying the accuracy of impervious surface extraction.
Our chosen research site is the Nanchang metropolitan area, an area marked by its swift economic expansion in recent years. The main aim of this research is to assess the classification accuracy of diverse combinations of satellite data, with the goal of enhancing their detection of changes in impervious surfaces. By exploring the capabilities and performance of sets of data from different satellites, this study intends to identify the optimal combinations or strategies for more accurate, efficient, and reliable monitoring of impervious surface dynamics. In many previous studies on urban impervious surfaces, multispectral data and SAR data have been fused together to extract urban targets, achieving improved classification results. However, previous research has mainly focused on the fusion of single optical data and SAR data, such as the fusion of Sentinel-2 MSI data with Sentinel-1 SAR data for impervious surface extraction [44,45], and the fusion of Landsat data with Sentinel-1 SAR data for impervious surface extraction [46]. Few studies have used multispectral data. Based on the foundation of previous research, this paper introduces an additional type of multispectral data, employing two types of multispectral data and SAR data optimization methods, to explore the extraction of impervious surfaces in the city of Nanchang. Against the backdrop of rapid urbanization, fully leveraging the advantages of existing multi-source remote sensing data to improve the extraction of urban impervious surfaces becomes particularly important for urban development.
The remainder of this paper is organized as follows: Section 2 presents the study area, outlines the datasets used, and describes the process of data preprocessing. In Section 3, we explore the methodologies employed for data fusion, classification, and validation. Section 4 highlights the detection of impervious surfaces and the corresponding accuracy assessments. In Section 5, we provide analyses and discussions on the observed changes in impervious surfaces and the effectiveness of machine learning methods. Lastly, Section 6 concludes the study and encapsulates its key findings.
2. Study Area and Dataset
2.1. Study Area
This study is centered on the Nanchang metropolitan area, which is the capital city of Jiangxi Province, China. Located in the northern part of the province (28°10′N–29°11′N; 115°27′E–116°35′E) and within the middle reach of the Yangtze River, this area spans 7402 km2, making up 4.43% of the total area of Jiangxi Province (Figure 1). The location of the city of Nanchang within Jiangxi Province and the boundary of Nanchang are shown in Figure 1a,c, respectively. Figure 1c–e display the remote sensing images of Nanchang from CBERS-04, Landsat-8, and Sentinel-1, respectively.
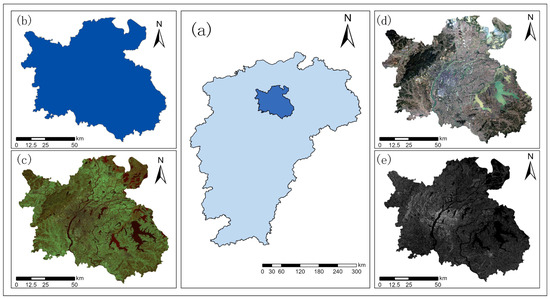
Figure 1.
An overview of the study area in various geographic contexts. This figure illustrates the location of Nanchang within Jiangxi Province (a); the location of Jiangxi Province within China (b); and remote sensing images of Nanchang as captured with the CBERS-04 satellite (c), Landsat-8 satellite (d), and Sentinel-1 satellite (e).
Nanchang holds a critical position in the Yangtze River Economic Belt and serves as a nodal city in the “One Belt, One Road” initiative. Furthermore, it forms a key transportation corridor that links China’s southeastern coastal area with its central region. Additionally, it is situated within the ecological protection zone of Poyang Lake, thereby making its urban development and ecological conservation a delicate balance to maintain.
From 1995 to 2015, the growth pattern of impervious surfaces in the city of Nanchang transitioned from a “point + line” configuration to a more expansive “point + surface” layout. The main catalysts for this growth were road construction and urban planning initiatives. During this period, the rate of impervious surface coverage escalated to levels of concern [47]. Over recent decades, Nanchang’s urban area has undergone substantial expansion, driven by rapid economic development. New urban zones, including the towns of Honggutan, Yaohu, and Jiulonghu, have been established since 2000. These developments have led to a population surge of 24.93% in these areas, resulting in a continuous expansion of urban impervious surfaces. Looking forward, an urban construction program centered around a general layout of one river and its two banks is set to be implemented in the Nanchang metropolitan area. This development will further increase the prevalence of impervious surfaces, potentially leading to significant alterations in the area’s impervious surface patterns. Therefore, this area provides an important case study for examining the effects of rapid urban development on impervious surface coverage.
2.2. Sets of Data
This study employs multi-sensor satellite images sourced from the Landsat-8, CBERS-04, and Sentinel-1 satellites. Optical satellite images are procured from the Landsat-8 and CBERS-04 sensors, while a Synthetic Aperture Radar (SAR) image is derived from the Sentinel-1 SAR dataset. The Landsat-8 satellite is furnished with a push-and-sweep sensor that operates in-flight along the orbital direction without a scan line corrector. It leverages the Operational Land Imager (OLI) and Thermal Infrared Sensor (TIRS) payloads, which possess unique bands that set them apart from other remote sensing images. On the other hand, the CBERS-04 is equipped with specialized multiplexer (MUX) and infrared sensor (IRS) payloads. The band details of these two optical sensors are presented in Table 1. In addition to the TIRS band, the Landsat-8 includes band nine, which has a spectral range near the absorption valley of clay minerals. This allows it to highlight soil characteristics, aiding in the differentiation of soil and impervious surface information [48]. The IRS sensor on the CBERS-04 complements the Landsat-8, further enhancing the advantages of multispectral data in impervious surface extraction.

Table 1.
Landsat-8 and CBERS-04 parameters.
Meanwhile, the Sentinel-1 SAR operates in the C-band and supports dual-polarization (VV + VH) modes. Unlike optical images, SAR images can carry both phase and polarization information, a key trait that widens their range of applications.
In this research, we employ satellite images captured by the Landsat-8 and CBERS-04 during November and December 2021, alongside a Sentinel-1 SAR image obtained on 30 November 2021. The brief interval (within two months) between these selected images helps to ensure consistency in ground target features among them. Landsat-8 images were sourced from the official website of the United States Geological Survey (USGS) (https://earthexplorer.usgs.gov/, accessed on 2 November 2022). Two images meeting the quality standards for time and cloud cover were selected, cropped, and stitched together to form a single image encapsulating the entire Nanchang study area. Images from the CBERS-04 were procured from the data service platform of the China Center for Resource Satellite Applications (CASC) (https://data.cresda.cn/, accessed on 22 November 2022). These images were also stitched together to yield a single image covering the complete study area. The specific parameters of the image data are outlined in Table 2. SAR data were acquired from the Sentinel Science Data Center (https://scihub.copernicus.eu/, accessed on 2 November 2022). For this study, Sentinel-1 satellite L1-level SLC data featuring VV and VH polarization and an Interferometric Wide-Swath (IW) imaging mode were selected. The IW imaging mode comprises IW1, IW2, and IW3 sub-bands, and the classification image is generated by merging and cropping these sub-bands. Afterward, we applied band superposition, stitching, cropping, and mosaicking techniques to these images to obtain comprehensive satellite scenes of the study area.
Table 2.
Parameters of the used satellite images.
3. Methodology
3.1. Image Processing
Data preprocessing includes geometric correction, radiometric correction, atmospheric correction, and image registration for remote sensing imagery. Geometric correction is primarily used to rectify distortions and deformations in the image acquisition process, ensuring that it has accurate geographical location information. Radiometric correction is mainly employed to eliminate distortions in radiance values and spectral reflectance in the image [49]. Atmospheric correction is used to remove the impact of the atmosphere on the spectral reflectance values of various land features. Landsat-8 remote sensing images are recorded as grayscale values of features, or digital number values (DN), which need to be converted into well-defined absolute radiometric brightness values using the following formula:
where represents the image radiance value, refers to the gain coefficient of the image sensor, and denotes the offset coefficient of the image sensor. After this conversion, atmospheric correction is applied to the satellite images. In this study, the FLAASH (Fast Line-of-Sight Atmospheric Analysis of Spectral Hypercubes) method [50,51] is used to perform atmospheric correction.
For the SAR image, radiometric calibration is implemented to convert the image pixel values into backscatter coefficients using [52],
where is the digital number value of SAR image pixel i, denotes the pixel scaling, is the absolute calibration factor, and represents the radar backscatter coefficient at pixel .
Subsequently, all image data are resampled onto a uniform grid with a 30 m spatial resolution using the Nearest Neighbor method to enable effective fusion of disparate satellite image data. The SAR images are geocoded utilizing a Digital Elevation Model (DEM) that aligns with the coordinate system of the satellite images, specifically the WGS 1984 coordinate system in the UTM 50N projection. For the alignment of optical remote sensing data with SAR data, the Landsat image is chosen as the reference image during the co-registration due to the superior visual clarity of this optical image. A semi-automatic co-registration method is utilized, involving a manual selection of control points. Ultimately, all co-registrations are finalized with a Root Mean Square Error (RMSE) calculation that represents the cumulative differences from established control points during our georeferencing process, which was found to be less than one pixel. These errors meet the accuracy requirements stipulated for this study. The workflow of this study is shown in Figure 2.
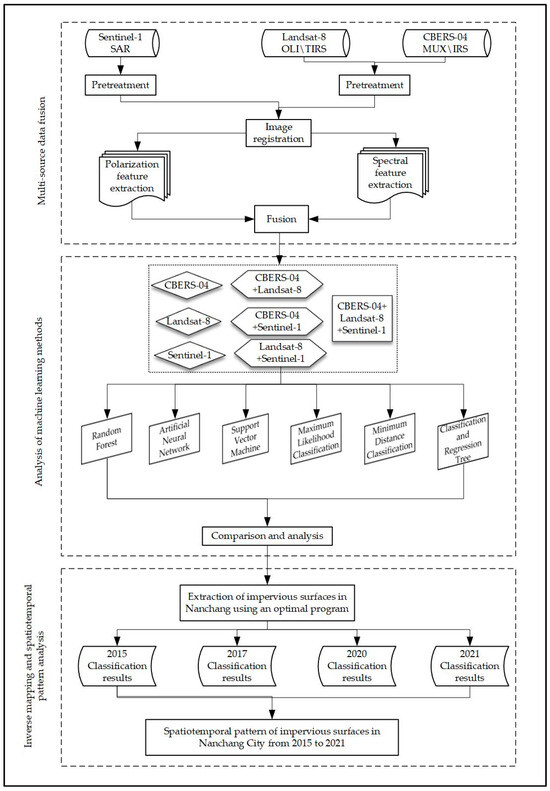
Figure 2.
The workflow of this study.
3.2. Feature Extraction and Fusion
In this study, optical and SAR data features were used for pixel-level, feature-level, and decision-level fusion. The emphasis was not on feature selection and extraction techniques. Therefore, during the feature extraction process, we selected spectral features from optical images and polarization features from SAR data for the fusion of various satellite images. The feature-level fusion extraction scheme is graphically illustrated in Figure 3. Fusion refers to the extraction of raw information from each sensor, followed by the integration of this information. During information extraction, each piece of information extracted from image data corresponds to a separate layer. The data that need to be fused are combined as layers through layer stacking. It is important to note that stacking layers together is not a fusion method but rather a way of organizing the data into a composite dataset. Subsequently, different classifiers are applied as fusion methods for these data, with each fusion level typically following definitions from classical data fusion methods [53,54]. The fusion process is embedded within the classification process of different machine learning methods, each of which combines optical and SAR data in distinct ways.
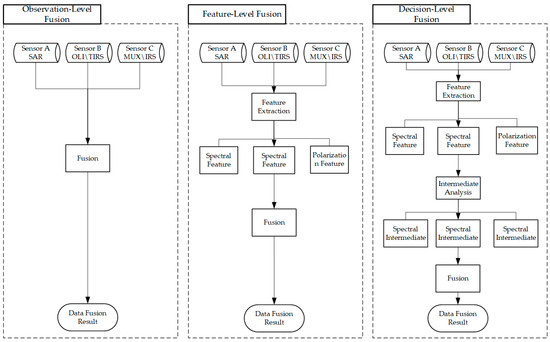
Figure 3.
Scheme of the feature-level fusion of different sensors.
3.3. Machine Learning Methodology
In this study, we use Random Forest (RF), Neural Network Classification (ANN), Support Vector Machine (SVM), Classification and Regression Tree (CART), Maximum Likelihood Classification (Max-Likelihood), and Minimum Distance Classification (Min-Distance) machine learning methods to extract impervious surfaces from multi-satellite images, with the goal of enhancing the accuracy of impervious surface detection. Given the complex urban surface composition and resolution constraints of remote sensing images, this study, based on the original classification principle and combined with the actual surface cover feature categories in Nanchang, classifies each feature type in Nanchang into one of three categories: pervious surface, impervious surface, and body of water. The pervious surfaces primarily include parks, green belts, vegetation-covered hills, and urban construction sites; the impervious surfaces mainly comprise hardened roads, parking lots, and buildings; and the bodies of water include rivers, lakes, and some small artificial water surfaces.
As an ensemble machine learning method, Random Forest uses a series of diverse regression trees to improve information extraction accuracy, without the need to reduce dimensionality, in high-dimensional feature data. It offers strong resistance to noise components and helps avoid overfitting [55,56,57,58,59]. Inspired by the structure of the human brain, ANNs consist of interconnected nodes or “neurons” that process input data, including an input layer, two hidden layers, and an output layer. The input layer is composed of neurons representing features extracted from satellite images. These features are fed forward through the network, and each layer of the hidden layers applies a weighted sum to its inputs. The result is then passed through an activation function, and the output is forwarded to the next layer. Ultimately, the output layer produces classification results, indicating the probability that each pixel belongs to the impervious surface category. These networks can adapt to the data they are fed by adjusting their weights and biases through a process called backpropagation. They are the backbone of deep learning and are highly suited for complex tasks like image recognition, natural language processing, and more [60]. SVMs operate by finding a hyperplane that best divides a dataset into classes. They are particularly suited for the classification of complex but small- or medium-sized datasets. The “support vectors” are the data points that lie closest to the decision surface (or hyperplane). SVMs can also handle non-linear data through the use of the kernel trick [61]. CART is a decision tree learning technique that produces either classification or regression trees, depending on whether the dependent variable is categorical or numerical, respectively. Decision trees split the data into subsets based on the value of the input features. This results in a tree-like model of decisions [62]. Maximum Likelihood Classification (Max-Likelihood) is a method used to estimate the parameters of a statistical model. By choosing the parameter values that maximize the likelihood function, Max-Likelihood finds the parameter values that make the observed data most probable under the assumed model [63]. This is a simple classification algorithm where an unknown sample is classified based on the minimum distance (often Euclidean) to known samples from different classes. It is similar in concept to the Nearest Neighbor classifier, but generally uses mean vectors of the classes for distance computation [64].
Table 3 reveals the results from these different machine learning methods. It reveals that the Minimum Distance Classification (Min-Distance) method yielded the lowest accuracy, falling short of the requirements for reliable impervious surface extraction. The Max-Likelihood method secured overall classification accuracy values of 0.70 and 0.74, alongside kappa coefficients of 85.5% and 82.7%, respectively, when applied to single remote sensing datasets for impervious surface extraction. Employing the fusion of two remote sensing images resulted in overall classification accuracies of 0.75, 0.80, and 0.80, paired with kappa coefficients of 85.7%, 88.9%, and 88.7%, respectively. However, when leveraging the fusion of three remote sensing images for impervious surface extraction, the overall classification accuracy was slightly improved to 0.81, with a kappa coefficient of 89.3%. Although the fusion of the three remote sensing images did enhance extraction accuracy, the overall accuracy remained less than ideal. The ANN method, while yielding high accuracy when applied to a standalone Landsat-8 remote sensing dataset for impervious surface extraction, failed to deliver satisfactory results when applied to the fusion of the three remote sensing images. This outcome implies that the ANN method may not be suited for extracting impervious surfaces using multi-source remote sensing data within the context of this study. Among the machine learning methods explored, namely RF, SVM, and CART, RF emerged as the top performer, achieving the optimal classification accuracy for impervious surface extraction. As such, RF is suggested as the most effective method for extracting impervious surfaces using multi-source remote sensing data. The RF method presents unique advantages in managing high-dimensional data. Given the high dimensionality and redundancy of remote sensing data, traditional machine learning classification methods often grapple with processing such data effectively. In contrast, RF can adeptly handle high-dimensional data via feature selection and feature importance evaluation, thereby boosting the classification accuracy. In addition, RF can extract multiple features, exhibit robustness, and contend with missing values, outliers, and imbalanced data when dealing with remote sensing data. These capabilities enhance the robustness and stability of its classification. The application of the Random Forest (RF) machine learning method, combined with Landsat-8, CBERS-04, and Sentinel-1A remote sensing data, can notably enhance the accuracy of urban impervious surface extraction.
Table 3.
Classification accuracies for four different years.
4. Impervious Surfaces and Accuracy Assessment
4.1. Impervious Surfaces Extraction
In this study, we used three types of satellite images, as well as their combinations, to extract impervious surfaces in the study area. We considered a total of seven satellite image combination scenarios:
- (1)
- Sentinel-1 SAR data only (S1);
- (2)
- CBERS-04 image only (S2);
- (3)
- Landsat-8 image only (S3);
- (4)
- CBERS-04 image and Landsat-8 image combination (S4);
- (5)
- CBERS-04 image and Sentinel-1 SAR combination (S5);
- (6)
- Landsat-8 image and Sentinel-1 SAR combination (S6);
- (7)
- CBERS-04 image, Landsat-8 image, and Sentinel-1 SAR combination (S7).
These scenarios were designed to compare the performance of each satellite image type, both individually and in various combinations. The results from these different scenarios help identify the most effective combination of satellite images for impervious surface extraction, which contributes to more accurate and reliable results.
The impervious surface mapping results for the Nanchang metropolitan area are depicted in Figure 4. It can be observed that the impervious surfaces in Nanchang are multifaceted and concentrated along both sides of the Ganjiang River, with a primary expansion axis directed westward. For the classification using only SAR data (Scenario 1), the results show a noticeable underestimation, with some vegetation being incorrectly classified as impervious surfaces in the process of distinguishing between vegetation and impervious surfaces.
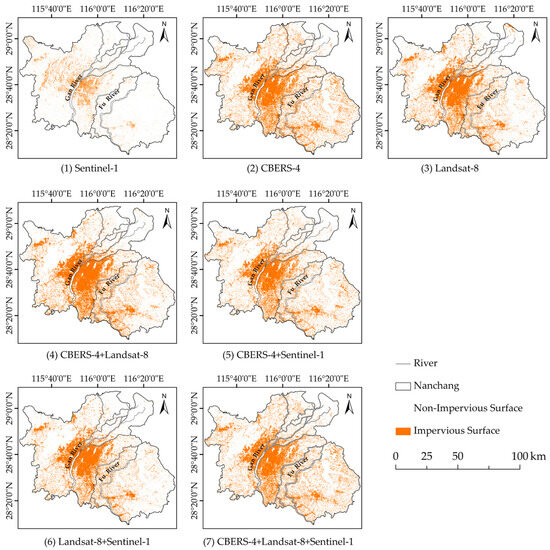
Figure 4.
Classification results of seven satellite image combination scenarios.
When using a single optical dataset for classification (Scenarios 2–3), the resulting “salt-and-pepper” effect is quite pronounced, with many isolated pixels and discontinuous patches distributed unevenly across the classified images. The spectral characteristics of certain types of features, such as bare ground and brightly reflective impervious surfaces, can be similar. This can lead to situations where the same object displays varying spectral signatures, or different objects exhibit identical spectral characteristics. This creates challenges for accurate classification and can lead to misinterpretation of the surface features. The integration of information from Sentinel-1 images with multiple optical imagery brings about more distinct and well-defined contours and boundaries of adjacent features in the classified images (such as in Scenario 7). This process virtually eliminates discontinuous patches and isolated image elements, thereby achieving a significant enhancement in both classification accuracy and overall image quality.
4.2. Accuracy Assessments
The accuracy of impervious surface extraction in this study is gauged using contemporaneous high-resolution images from Google Earth. We selected samples of water bodies, pervious surfaces, and impervious surfaces for this purpose. Of these samples, 65% are randomly chosen as training samples, while the remaining 35% are used as verification samples to test the classification outcomes and measure accuracy. However, given the potential impact of human factors on visual interpretation, the reliability of these verification results is further validated using a confusion matrix and pre-existing knowledge [65]
To validate the impervious surface extraction, we employ a suite of accuracy evaluation metrics, including overall accuracy (OA), kappa coefficient, user’s accuracy (UA), and producer’s accuracy (PA). These metrics are derived from the confusion matrix, which is computed using verification samples, as per the methodology suggested by Jensen and Lulla (1987) [49].
Among them, the kappa coefficient and overall accuracy (OA) are indicators representing the overall classification performance. Producer’s accuracy (PA) and user’s accuracy (UA) are metrics used to assess the consistency between the predicted and true values for each category. A higher value indicates a higher classification accuracy. The formulas for calculating these metrics are as follows:
In the above equations: represents the number of correctly classified samples, denotes the number of true samples in class , represents the number of samples predicted in class , is the total number of samples, and represents the total number of classes.
These metrics facilitate an assessment of machine learning classification performance and pinpoint areas that warrant improvements. Moreover, pre-existing knowledge about the city of Nanchang is utilized to verify the classification results for urban and suburban areas. This incorporation of prior knowledge allows for the cross-validation of the classification outcomes against known data concerning this area, thereby validating the accuracy of the extracted impervious surfaces.
We obtained the respective impervious surface (IS) and non-impervious surface (Non-IS) mapping results for various satellite data combinations and proceeded with a comparative analysis. Metrics such as overall accuracy (OA), mapping accuracy, user accuracy, and kappa coefficient were calculated and are depicted in Table 4. For single image scenarios (S1–S3), the results indicate that optical images identify urban impervious surfaces with greater accuracy than SAR images, as can be seen in Table 4. When two types of satellite images are fused (S4–S6), the accuracy levels for these scenarios surpass those of the single image scenarios (S1–S3), as demonstrated in Table 4. The highest accuracy is achieved in Scenario 7 (S7), where a synthesis of CBERS-04 and Landsat-8 optical images, supplemented with Sentinel SAR data, is deployed.
Table 4.
Classification accuracies of seven satellite image combination scenarios.
In order to more effectively evaluate the detection accuracy of impervious surfaces and identify key elements influencing this accuracy, we compared the extraction outcomes of impervious surfaces derived from different satellite images. Table 5 presents the confusion matrices for the three types of satellite data. As per these confusion indices, the results derived from Landsat-8 surpass those from the CBERS-04 images, owing to the availability of a broader spectrum of information. Regarding the three land cover types, all three satellite images are effective in identifying water bodies. However, due to variables such as building shadows and complex ground materials, there are increased misclassifications between the impervious and pervious surfaces. This analysis emphasizes the importance of selecting appropriate satellite data sources and highlights the potential benefits of integrating multiple satellite data sources to bolster their overall accuracy and minimize misclassification errors.
Table 5.
Confusion matrices for the different satellite images.
Figure 5 displays the overall accuracy (OA) and kappa coefficient for the classification results of the seven data combination scenarios, offering a comparison of classification accuracy when utilizing single and multi-source remote sensing data. The integration of multi-source remote sensing data significantly improves the classification accuracy of impervious surfaces, with the overall accuracy increasing from 75.5% to 88.3% (Table 4). The combination of three remote sensing data types (CBERS-04, Landsat-8, and Sentinel-1 SAR) achieves the highest classification accuracy, emphasizing the importance of integrating various remote sensing data to improve results. The fusion of multi-source remote sensing data with a wider range of features and higher spatial resolution could have the potential to yield even better classification outcomes.
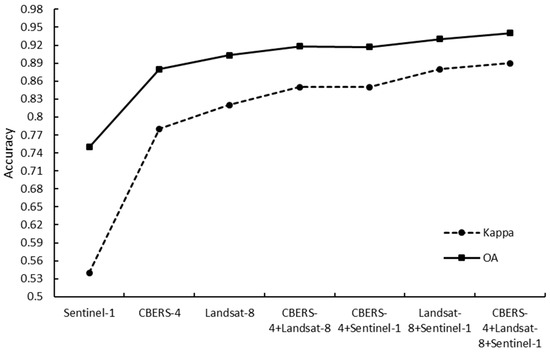
Figure 5.
Comparison of classification accuracy between using single and multi-source remote sensing data.
5. Analyses and Discussions
5.1. Comparisons of Impervious Surfaces between Different Fusion Scenarios
This study reveals that impervious surface extraction varies markedly across different satellite data scenarios. To delve deeper into these variations, we further contrasted the impervious surfaces derived from various data fusion scenarios. For classification purposes, pixels were assigned a value of 1 for impervious surfaces and 0 for non-impervious surfaces. Using the impervious surface mapping results from a combination of the data from CBERS-04, Landsat-8, and Sentinel-1 SAR (S7) as a benchmark, a comparison was conducted by subtracting the S7 results from the other five data scenarios (S2–S6). This operation yielded three possible values for these classification image pixels: −1, 0, and 1. When a pixel in the S7 image represents an impervious surface (with a value of 1) and the corresponding pixel in Sn (n = 2, …, 6) represents a non-impervious surface (with a value of 0), the result of Sn − S7 equals −1. In this case, Sn potentially underestimates the impervious surface in comparison to S7. When both S7 and Sn show the same impervious or non-impervious surfaces, Sn − S7 equals 0, indicating a consistency between S7 and Sn for that pixel. Similarly, when Sn − S7 equals 1, Sn overestimates the impervious surface. Table 6 displays the areas corresponding to these three values (1, 0, −1) for Sn − S7, demonstrating the underestimation and overestimation results of impervious surfaces from Sn relative to S7.
Table 6.
Underestimated and overestimated impervious surfaces of S1–S7 relative to S7.
Figure 6 illustrates the distribution of overestimated impervious surface pixels for various data scenarios in relation to S7. When it comes to impervious surface mapping, the CBERS-04 image (S2) shows a more pronounced overestimation, whereas the fusion of the Landsat-8 image and Sentinel-1 SAR data (S6) features the least number of overestimated pixels. In Figure 6a, pixels with a value of 1 are primarily situated outside the central urban area, notably along riverbanks, lakes, and urban perimeters. Figure 6b,c demonstrate that incorporating Landsat data, with its additional spectral bands, bolsters vegetation extraction and enhances classification accuracy, thereby reducing the overestimation of impervious surfaces. This improvement is especially noticeable on the western side of the Gan River and the northern region of the Fu River area. Figure 6d unveils the results of the fusion of CBERS-04 and SAR data; however, the enhancement in impervious surface mapping with the integration of CBERS-04 optical data and SAR data is not substantial. As depicted in Figure 6c,d and Table 6, the overestimated area of impervious surfaces when SAR data is combined with CBERS-04 does not show significant improvement compared to the S2 case (where only CBERS-04 data was used). Conversely, with the inclusion of SAR data with the Landsat-8 images, the overestimated area of impervious surfaces is noticeably diminished (Figure 6e, Table 6).
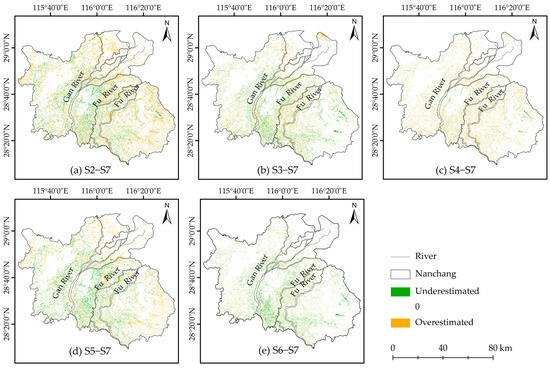
Figure 6.
Overestimated and underestimated impervious surfaces for the different data fusion scenarios.
Figure 6 presents the areas that underestimated impervious surfaces, represented by a value of −1, for various data scenarios in comparison to S7. When solely utilizing the CBERS-04 image for classification (S2), impervious surfaces in the central urban area with building shadows are prone to misclassification as non-impervious surfaces (Figure 6a). However, the S3 scenario (using Landsat-8 data) generates the largest underestimated area of 701.77 km2 (Figure 6b, Table 6). Table 6 demonstrates that using CBERS-04 data alone (S2) may result in the highest underestimation of impervious surfaces. Interestingly, the fusion of CBERS-04 and Landsat-8 data subsequently reduces areas of underestimation (Figure 6c, Table 6), indicating that data fusion may serve to balance both the underestimated and overestimated areas. While the integration of SAR data alongside either CBERS-04 or Landsat-8 images can decrease the areas of underestimated impervious surfaces compared to S2 and S3, as depicted in Figure 6d,e and Table 6, the fusion of CBERS-04 and Landsat-8 images (S4) may yield better outcomes than scenarios S5 and S6. This suggests that optimizing the fusion of multiple optical images can yield improved results.
5.2. Changes in Impervious Surfaces
Building on the multi-sensor image fusion scenario (S9), this study selected additional Landsat-8, CBERS-04, and Sentinel-1 images from the years 2015, 2017, and 2020. In total, twelve images (including those from 2021) were compiled to detect changes in the impervious surface area within the Nanchang metropolitan region. The dates and times for the acquisition of these images are provided in Table 7. The kappa coefficients, overall accuracy (OA), and impervious surface areas derived from the satellite images for the years 2015, 2017, and 2020 are presented in Table 8, along with the corresponding data for 2021. From 2015 to 2021, the area covered by impervious surfaces exhibited a significant increase, expanding from 1183.40 km2 in 2015 to a striking 1703.70 km2 in 2021. The impervious surface area in the city of Nanchang expanded by 27.68 km2 from 2015 to 2017, with an average yearly increase rate of 1.17%; by 374.05 km from 2017 to 2020, with an average yearly increase rate of 10.30%; and by 118.57 km2 from 2020 to 2021, with a yearly rate of 7.48%, indicating that urban expansion in Nanchang has been accelerating in recent years since 2017.
Table 7.
Dates and times of the satellite images acquired in 2015, 2017, and 2020.
Table 8.
Impervious surface accuracy in 2015, 2017, 2020, and 2021 and the changes in impervious surfaces.
The same methodology outlined in Section 5.1 was employed to trace the evolution of impervious surfaces from 2015 to 2021. In this process, a value of 1 is assigned to an impervious surface pixel, and a value of 0 is assigned to a non-impervious surface pixel. The evolution is calculated by subtracting the 2015 pixel value from those of 2017, 2020, and 2021. A result of 1 signifies a shift from a non-impervious to an impervious surface, while a value of −1 indicates the reverse. A result of 0 implies no change in surface type.
Upon examining Figure 7, several consistent patterns in impervious surface growth are revealed:
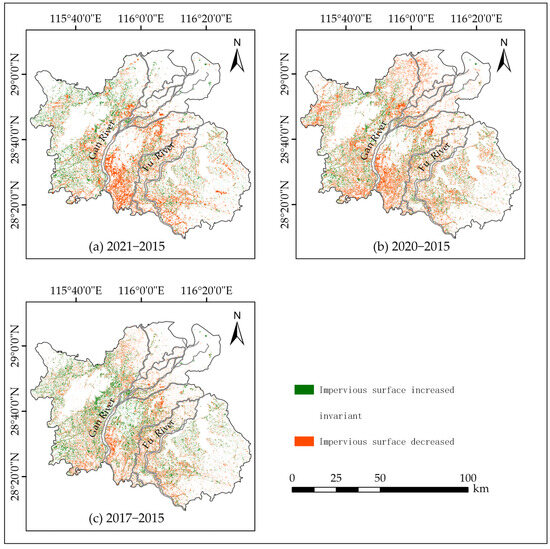
Figure 7.
Impervious surface changes in 2021 (a), 2020 (b), and 2017 (c), relative to 2015.
- The area of impervious surfaces in Nanchang exhibited a diminishing trend moving from the city center to the outskirts.
- Urban impervious surfaces primarily congregated near riverine regions.
- Proximity to the city center intensified the changes in impervious surfaces.
- The eastern part of Nanchang, characterized by its relatively flat terrain and well-established river systems, displayed larger impervious surface areas than the western region along the Gan River.
Figure 7 shows a decrease in impervious surfaces, primarily observed from 2015 to 2017 on the west side of the Gan River in the outskirts of the metropolitan area, but these reductions were significantly smaller than the corresponding increases. From 2015 to 2021, the expansion of impervious surfaces advanced toward the southern region of the city, with isolated patches of impervious areas observed in other regions, leading to substantial changes in the central city land area’s cover types. By 2020, when compared to 2015, the expanded impervious surface area had spread from the city center’s southern region along the Gan River to its southern, eastern, and northern regions. An increase in impervious surfaces was also detected in the Fu River basin. By 2021, as illustrated in Figure 7a, the continuous increase in impervious surface area in the city of Nanchang began to spread toward the northern region, dispersed around the Gan River basin. From the extraction results, we also observed a decrease in urban impervious surface area in certain regions. Several factors contribute to this phenomenon. Firstly, Nanchang is prone to flooding disasters [66], and the images used for this study were captured during the flood-prone seasons, leading to some buildings and roads being submerged by water and resulting in a certain degree of classification error. Secondly, Nanchang has been highly committed to the construction of sponge cities. In 2016, Nanchang became a provincial-level pilot city for sponge city development, and by the end of 2021, the area meeting sponge city standards had reached 96.48 km2 [67]. In summary, the impervious surface area in Nanchang showed an overall increasing trend from 2015 to 2021.
6. Conclusions
This study uses multi-sensor satellite images to detect changes in urban impervious surfaces, using the metropolitan area of Nanchang as an example. Three types of satellite images were selected in this study, including Landsat-8 and CBERS-04 optical images and Sentinel-1 SAR data, which constitute seven satellite image combination scenarios. The Random Forest machine learning methodology was applied to these data scenarios to extract the impervious surfaces of the study area.
For comparisons between Landsat-8 or CBERS-04 optical satellite images and the Sentinel-1 SAR image, it is suggested that optical satellite images with abundant spectral characteristics can obtain a higher detection accuracy than radar images of Sentinel-1. Secondly, multi-sensor satellite images may integrate more ground spectral information and perform better in impervious surface detection than single satellite images of the Landsat-8, CBERS-04, or Sentinel-1 satellites. The best result was achieved with the combination of all three types of satellite multi-sensor images (Landsat-8, CBERS-04, and Sentinel-1), improving the kappa coefficient from 89.21% to 92.55% and the overall classification accuracy from 84.3% to 88.3% compared to using the Landsat-8 image alone. Furthermore, the Random Forest algorithm’s employment of a unique dual-random sampling approach, involving both random feature selection and random sample selection, utilized for merging the multi-sensor satellite data, proved more effective for impervious surface extraction when compared to other machine learning techniques, such as the Artificial Neural Network (ANN), Support Vector Machine (SVM), Classification and Regression Tree (CART), Maximum Likelihood Classification (Max-Likelihood), and Minimum Distance Classification (Min-Distance) methods.
This study incorporates additional satellite images from 2015, 2017, and 2020 to examine changes in the impervious surface area within the Nanchang metropolitan region. Between 2015 and 2021, a significant increase in impervious surfaces from 1183.40 km2 to 1703.70 km2 was recorded, indicating accelerated urban expansion. Our research identified several patterns within the impervious surfaces’ distribution and growth, such as a higher concentration near rivers, and more substantial areas in Nanchang’s eastern part. From 2015 to 2021, the expansion of impervious surfaces happened mainly toward the city’s southern region, but by 2021, the expansion started spreading toward the northern region, around the Gan River basin.
Author Contributions
Conceptualization, Y.W. and J.P.; methodology, Y.W. and J.P.; software, Y.W.; validation, Y.W.; formal analysis, Y.W. and J.P.; investigation, Y.W. and J.P.; resources, J.P.; data curation, Y.W.; writing—original draft preparation, Y.W.; writing—review and editing, J.P.; visualization, Y.W. and J.P.; supervision, J.P.; project administration, J.P.; funding acquisition, J.P. All authors have read and agreed to the published version of the manuscript.
Funding
This research was funded by the National R&D Program of China, grant number 2021YFB3900400.
Data Availability Statement
Data is contained within the article.
Conflicts of Interest
The authors declare no conflict of interest.
References
- Meyer, J.L.; Paul, M.J.; Taulbee, W.K. Stream Ecosystem Function in Urbanizing Landscapes. J. N. Am. Benthol. Soc. 2005, 24, 602–612. [Google Scholar] [CrossRef]
- Brabec, E.; Schulte, S.; Richards, P.L. Impervious Surfaces and Water Quality: A Review of Current Literature and Its Implications for Watershed Planning. J. Plan Lit. 2002, 16, 499–514. [Google Scholar] [CrossRef]
- Xian, G.; Homer, C. Updating the 2001 National Land Cover Database Impervious Surface Products to 2006 Using Landsat Imagery Change Detection Methods. Remote Sens. Environ. 2010, 114, 1676–1686. [Google Scholar] [CrossRef]
- Sharma, J.; Prasad, R.; Mishra, V.N.; Yadav, V.P.; Bala, R. Land use and land cover classification of multispectral Landsat-8 satellite imagery using discrete wavelet transform. ISPRS-Int. Arch. Photogramm. Remote Sens. Spat. Inf. Sci. 2018, XLII-5, 703–706. [Google Scholar] [CrossRef]
- Rodriguez-Galiano, V.F.; Ghimire, B.; Rogan, J.; Chica-Olmo, M.; Rigol-Sanchez, J.P. An Assessment of the Effectiveness of a Random Forest Classifier for Land-Cover Classification. ISPRS-J. Photogramm. Remote Sens. 2012, 67, 93–104. [Google Scholar] [CrossRef]
- Zhang, L.; Weng, Q. Annual Dynamics of Impervious Surface in the Pearl River Delta, China, from 1988 to 2013, Using Time Series Landsat Imagery. ISPRS-J. Photogramm. Remote Sens. 2016, 113, 86–96. [Google Scholar] [CrossRef]
- Deng, C.; Wu, C. The Use of Single-Date MODIS Imagery for Estimating Large-Scale Urban Impervious Surface Fraction with Spectral Mixture Analysis and Machine Learning Techniques. ISPRS-J. Photogramm. Remote Sens. 2013, 86, 100–110. [Google Scholar] [CrossRef]
- Pok, S.; Matsushita, B.; Fukushima, T. An Easily Implemented Method to Estimate Impervious Surface Area on a Large Scale from MODIS Time-Series and Improved DMSP-OLS Nighttime Light Data. ISPRS-J. Photogramm. Remote Sens. 2017, 133, 104–115. [Google Scholar] [CrossRef]
- Nagel, P.; Yuan, F. High-Resolution Land Cover and Impervious Surface Classifications in the Twin Cities Metropolitan Area with NAIP Imagery. Photogramm. Eng. Remote Sens. 2016, 82, 63–71. [Google Scholar] [CrossRef]
- Lu, D.; Weng, Q. Use of Impervious Surface in Urban Land-Use Classification. Remote Sens. Environ. 2006, 102, 146–160. [Google Scholar] [CrossRef]
- Wu, C.; Murray, A.T. Estimating Impervious Surface Distribution by Spectral Mixture Analysis. Remote Sens. Environ. 2003, 84, 493–505. [Google Scholar] [CrossRef]
- Chen, X.; Jia, X.; Pickering, M. A Nighttime Lights Adjusted Impervious Surface Index (NAISI) with Integration of Landsat Imagery and Nighttime Lights Data from International Space Station. Int. J. Appl. Earth Obs. Geoinf. 2019, 83, 101889. [Google Scholar] [CrossRef]
- Lin, Y.; Zhang, H.; Li, G.; Wang, T.; Wan, L.; Lin, H. Improving Impervious Surface Extraction with Shadow-Based Sparse Representation From Optical, SAR, and LiDAR Data. IEEE J. Sel. Top. Appl. Earth Obs. Remote Sens. 2019, 12, 2417–2428. [Google Scholar] [CrossRef]
- Zhang, Y.; Zhang, H.; Lin, H. Improving the Impervious Surface Estimation with Combined Use of Optical and SAR Remote Sensing Images. Remote Sens. Environ. 2014, 141, 155–167. [Google Scholar] [CrossRef]
- Henderson, F.; Xia, Z.-G. SAR Applications in Human Settlement Detection, Population Estimation and Urban Land Use Pattern Analysis: A Status Report. IEEE Trans. Geosci. Remote Sens. 1997, 35, 79–85. [Google Scholar] [CrossRef]
- Leinenkugel, P.; Esch, T.; Kuenzer, C. Settlement Detection and Impervious Surface Estimation in the Mekong Delta Using Optical and SAR Remote Sensing Data. Remote Sens. Environ. 2011, 115, 3007–3019. [Google Scholar] [CrossRef]
- Zhang, H.; Xu, R. Exploring the Optimal Integration Levels between SAR and Optical Data for Better Urban Land Cover Mapping in the Pearl River Delta. Int. J. Appl. Earth Obs. Geoinf. 2018, 64, 87–95. [Google Scholar] [CrossRef]
- Calabresi, G. The use of ERS data for flood monitoring: An overall assessment. In Proceedings of the 2nd ERS Applications Workshop, London, UK, 6–8 December 1995. [Google Scholar]
- Dell’Acqua, F.; Gamba, P. Texture-Based Characterization of Urban Environments on Satellite SAR Images. IEEE Trans. Geosci. Remote Sens. 2003, 41, 153–159. [Google Scholar] [CrossRef]
- Erasmi, S.; Twele, A. Regional Land Cover Mapping in the Humid Tropics Using Combined Optical and SAR Satellite Data—A Case Study from Central Sulawesi, Indonesia. Int. J. Remote Sens. 2009, 30, 2465–2478. [Google Scholar] [CrossRef]
- Ghassemian, H. A Review of Remote Sensing Image Fusion Methods. Inf. Fusion 2016, 32, 75–89. [Google Scholar] [CrossRef]
- Joshi, N.; Baumann, M.; Ehammer, A.; Fensholt, R.; Grogan, K.; Hostert, P.; Jepsen, M.; Kuemmerle, T.; Meyfroidt, P.; Mitchard, E.; et al. A Review of the Application of Optical and Radar Remote Sensing Data Fusion to Land Use Mapping and Monitoring. Remote Sens. 2016, 8, 70. [Google Scholar] [CrossRef]
- Lisini, G.; Tison, C.; Tupin, F.; Gamba, P. Feature Fusion to Improve Road Network Extraction in High-Resolution SAR Images. IEEE Geosci. Remote Sens. Lett. 2006, 3, 217–221. [Google Scholar] [CrossRef]
- Salentinig, A.; Gamba, P. Combining SAR-Based and Multispectral-Based Extractions to Map Urban Areas at Multiple Spatial Resolutions. IEEE Geosci. Remote Sens. Mag. 2015, 3, 100–112. [Google Scholar] [CrossRef]
- Marceau, D.J.; Howarth, P.J.; Dubois, J.M.; Gratton, D.J. Evaluation of the Grey-Level Co-Occurrence Matrix Method for Land-Cover Classification Using Spot Imagery. IEEE Trans. Geosci. Remote Sens. 1990, 28, 513–519. [Google Scholar] [CrossRef]
- Vaddiraju, S.C.; Reshma, T.; Savitha, C. Determination of Impervious Area of Saroor Nagar Watershed of Telangana Using Spectral Indices, MLC, and Machine Learning (SVM) Techniques. Environ. Monit. Assess. 2022, 194, 258. [Google Scholar] [CrossRef] [PubMed]
- Sobieraj, J.; Fernández, M.; Metelski, D. A Comparison of Different Machine Learning Algorithms in the Classification of Impervious Surfaces: Case Study of the Housing Estate Fort Bema in Warsaw (Poland). Buildings. 2022, 12, 2115. [Google Scholar] [CrossRef]
- Wang, J.; Wu, Z.; Wu, C.; Cao, Z.; Fan, W.; Tarolli, P. Improving Impervious Surface Estimation: An Integrated Method of Classification and Regression Trees (CART) and Linear Spectral Mixture Analysis (LSMA) Based on Error Analysis. Gisci. Remote Sens. 2018, 55, 583–603. [Google Scholar] [CrossRef]
- Blazer, V.S.; Gordon, S.; Jones, D.K.; Iwanowicz, L.R.; Walsh, H.L.; Sperry, A.J.; Smalling, K.L. Retrospective Analysis of Estrogenic Endocrine Disruption and Land-Use Influences in the Chesapeake Bay Watershed. Chemosphere 2021, 266, 129009. [Google Scholar] [CrossRef]
- Wang, Y.; Huang, Q.; Zhao, A.; Lv, H.; Zhuang, S. Semantic Network-Based Impervious Surface Extraction Method for Rural-Urban Fringe from High Spatial Resolution Remote Sensing Images. IEEE J. Sel. Top. Appl. Earth Obs. Remote Sens. 2021, 14, 4980–4998. [Google Scholar] [CrossRef]
- Zheng, Z.; Yang, B.; Liu, S.; Xia, J.; Zhang, X. Extraction of Impervious Surface with Landsat Based on Machine Learning in Chengdu Urban, China. Remote Sens. Appl. 2023, 30, 100974. [Google Scholar] [CrossRef]
- Liu, Z.; Yang, J.; Huang, X. Landsat-Derived Impervious Surface Area Expansion in the Arctic from 1985 to 2021. Sci. Total Environ. 2023, 905, 166966. [Google Scholar] [CrossRef] [PubMed]
- Trinder, J.; Liu, Q. Assessing Environmental Impacts of Urban Growth Using Remote Sensing. Geo-Spat. Inf. Sci. 2020, 23, 20–39. [Google Scholar] [CrossRef]
- Li, W.; Ni, L.; Li, Z.-L.; Duan, S.-B.; Wu, H. Evaluation of Machine Learning Algorithms in Spatial Downscaling of MODIS Land Surface Temperature. IEEE J. Sel. Top. Appl. Earth Obs. Remote Sens. 2019, 12, 2299–2307. [Google Scholar] [CrossRef]
- Mahyoub, S.; Rhinane, H.; Mansour, M.; Fadil, A.; Okaishi, W.A. Impervious Surface Prediction in Marrakech City Using Artificial Neural Network. Int. J. Adv. Comput. Sci. Appl. 2022, 13, 185–189. [Google Scholar] [CrossRef]
- Zhang, M.; Zhang, C.; Kafy, A.-A.; Tan, S. Simulating the Relationship between Land Use/Cover Change and Urban Thermal Environment Using Machine Learning Algorithms in Wuhan City, China. Land 2021, 11, 14. [Google Scholar] [CrossRef]
- Das, P.C.; Zannat, E.U. Assessing the Impacts of Land Use–Land Cover Changes on Direct Surface Runoff: A Remote Sensing Approach in Khulna City. Water Sci. Technol. 2022, 85, 3122–3144. [Google Scholar] [CrossRef] [PubMed]
- Yu, W.; Shi, J.; Fang, Y.; Xiang, A.; Li, X.; Hu, C.; Ma, M. Exploration of Urbanization Characteristics and Their Effect on the Urban Thermal Environment in Chengdu, China. Build Environ. 2022, 219, 109150. [Google Scholar] [CrossRef]
- Brown, C.; Boyd, D.S.; Kara, S. Landscape Analysis of Cobalt Mining Activities from 2009 to 2021 Using Very High Resolution Satellite Data (Democratic Republic of the Congo). Sustainability 2022, 14, 9545. [Google Scholar] [CrossRef]
- Zou, Y.; Shen, J.; Chen, Y.; Zhang, B. Monitoring Urban Expansion (2000–2020) in Yangtze River Delta Using Time-Series Nighttime Light Data and MODIS NDVI. Sustainability 2023, 15, 9764. [Google Scholar] [CrossRef]
- Langenkamp, J.-P.; Rienow, A. Exploring the Use of Orthophotos in Google Earth Engine for Very High-Resolution Mapping of Impervious Surfaces: A Data Fusion Approach in Wuppertal, Germany. Remote Sens. 2023, 15, 1818. [Google Scholar] [CrossRef]
- Lodato, F.; Colonna, N.; Pennazza, G.; Praticò, S.; Santonico, M.; Vollero, L.; Pollino, M. Analysis of the Spatiotemporal Urban Expansion of the Rome Coastline through GEE and RF Algorithm, Using Landsat Imagery. ISPRS Int. J. Geo-Inf. 2023, 12, 141. [Google Scholar] [CrossRef]
- Dong, X.; Meng, Z.; Wang, Y.; Zhang, Y.; Sun, H.; Wang, Q. Monitoring Spatiotemporal Changes of Impervious Surfaces in Beijing City Using Random Forest Algorithm and Textural Features. Remote Sens. 2021, 13, 153. [Google Scholar] [CrossRef]
- Wu, W.; Guo, S.; Shao, Z.; Li, D. CroFuseNet: A Semantic Segmentation Network for Urban Impervious Surface Extraction Based on Cross Fusion of Optical and SAR Images. IEEE J. Sel. Top. Appl. Earth Obs. Remote. Sens. 2023, 16, 2573–2588. [Google Scholar] [CrossRef]
- Sun, G.; Cheng, J.; Zhang, A.; Jia, X.; Yao, Y.; Jiao, Z. Hierarchical Fusion of Optical and Dual-Polarized SAR on Impervious Surface Mapping at City Scale. ISPRS J. Photogramm. Remote. Sens. 2022, 184, 264–278. [Google Scholar] [CrossRef]
- Tang, H.; Lu, S.; Ali Baig, M.H.; Li, M.; Fang, C.; Wang, Y. Large-Scale Surface Water Mapping Based on Landsat and Sentinel-1 Images. Water 2022, 14, 1454. [Google Scholar] [CrossRef]
- Li, Z.; Wei, Z.Q.; Liu, Y.J.; Chen, Z. Reach on Chinese Central City Impervious Surface Area Growth Pattern in Recent 20 Years: Take Nanchang as a Case. Sci. Geogr. Sin. 2015, 35, 1444–1451. [Google Scholar]
- Xu, H.Q.; Tang, F. Analysis of new characteristics of the first Landsat 8 image and their eco-environmental significance. Acta Ecol. Sin. 2013, 33, 3249–3257. [Google Scholar]
- Holtz, T.S.U. Introductory Digital Image Processing: A Remote Sensing Perspective, Third Edition. Environ. Eng. Geosci. 2007, 13, 89–90. [Google Scholar] [CrossRef]
- Moses, W.J.; Gitelson, A.A.; Perk, R.L.; Gurlin, D.; Rundquist, D.C.; Leavitt, B.C.; Barrow, T.M.; Brakhage, P. Estimation of Chlorophyll-a Concentration in Turbid Productive Waters Using Airborne Hyperspectral Data. Water Res. 2012, 46, 993–1004. [Google Scholar] [CrossRef]
- Yuan, X.Y.; Tian, Q.J. The advances in the study of atmospheric correction for optical remote sensing. Remote Sens. Environ. 2005, 66, 1–6. [Google Scholar]
- Weina, D.U.; Aigong, X.U.; Yaoxin, S.; Huasheng, S.U.N. Absolute radiometric calibration of level-1 detected ground range products of new SAR sensors. Remote Sens. Nat. Resour. 2016, 28, 30–34. [Google Scholar]
- Schmitt, M.; Zhu, X.X. Data Fusion and Remote Sensing: An Ever-Growing Relationship. IEEE Geosci. Remote Sens. Mag. 2016, 4, 6–23. [Google Scholar] [CrossRef]
- Hall, D.L.; McMullen, S.A. Mathematical Techniques in Multisensor Data Fusion; Artech House: Norwood, MA, USA, 2004; ISBN 1-58053-335-3. [Google Scholar]
- Belgiu, M.; Drăguţ, L. Random Forest in Remote Sensing: A Review of Applications and Future Directions. ISPRS-J. Photogramm. Remote Sens. 2016, 114, 24–31. [Google Scholar] [CrossRef]
- Cutler, D.R.; Edwards, T.C.; Beard, K.H.; Cutler, A.; Hess, K.T.; Gibson, J.; Lawler, J.J. Random Forests for Classification in ecology. Ecology 2007, 88, 2783–2792. [Google Scholar] [CrossRef] [PubMed]
- van der Linden, S.; Rabe, A.; Held, M.; Jakimow, B.; Leitão, P.; Okujeni, A.; Schwieder, M.; Suess, S.; Hostert, P. The EnMAP-Box—A Toolbox and Application Programming Interface for EnMAP Data Processing. Remote Sens. 2015, 7, 11249–11266. [Google Scholar] [CrossRef]
- Liaw, A.; Wiener, M. Classification and Regression by randomForest. R News 2002, 2, 5. [Google Scholar]
- Pontius, R.G.; Millones, M. Death to Kappa: Birth of Quantity Disagreement and Allocation Disagreement for Accuracy Assessment. Int. J. Remote Sens. 2011, 32, 4407–44293. [Google Scholar] [CrossRef]
- Rumelhart, D.E.; Hintont, G.E.; Williams, R.J. Learning Representations by Back-Propagating Errors. Nature 1986, 323, 533–536. [Google Scholar] [CrossRef]
- Cortes, C.; Vapnik, V. Support-Vector Networks. Mach Learn. 1995, 20, 273–297. [Google Scholar] [CrossRef]
- Loh, W. Classification and Regression Trees. WIREs Data Min Knowl. 2011, 1, 14–23. [Google Scholar] [CrossRef]
- Fisher, R.A. On the Mathematical Foundations of Theoretical Statistics. Phil. Trans. R. Soc. Lond. A 1922, 222, 309–368. [Google Scholar]
- Tou, J.T.; Gonzalez, R.C. Pattern Recognition Principles; Addison-Wesley Publishing Company: New York, NY, USA, 1974. [Google Scholar]
- Jensen, J.R.; Lulla, K. Introductory Digital Image Processing: A Remote Sensing Perspective. Geocarto Int. 1987, 2, 65. [Google Scholar] [CrossRef]
- Big Data Reveals 30 Years of Flood Evolution in China: Uncovering Areas Vulnerable to Flooding—Xinhua News. Available online: http://www.xinhuanet.com/yingjijiuyuan/2022-04/01/c_1211629474.htm (accessed on 1 October 2023).
- Jiangxi Provincial People’s Government—City and County Updates: Nanchang Selected as a National Sponge City Construction Demonstration City. Available online: http://www.jiangxi.gov.cn/art/2022/6/3/art_399_3983515.html (accessed on 1 October 2023).
Disclaimer/Publisher’s Note: The statements, opinions and data contained in all publications are solely those of the individual author(s) and contributor(s) and not of MDPI and/or the editor(s). MDPI and/or the editor(s) disclaim responsibility for any injury to people or property resulting from any ideas, methods, instructions or products referred to in the content. |
© 2023 by the authors. Licensee MDPI, Basel, Switzerland. This article is an open access article distributed under the terms and conditions of the Creative Commons Attribution (CC BY) license (https://creativecommons.org/licenses/by/4.0/).