

Vertical Characteristics of Vegetation Distribution in Wuyishan National Park Based on Multi-Source High-Resolution Remotely Sensed Data


 , , and
Abstract
:1. Introduction
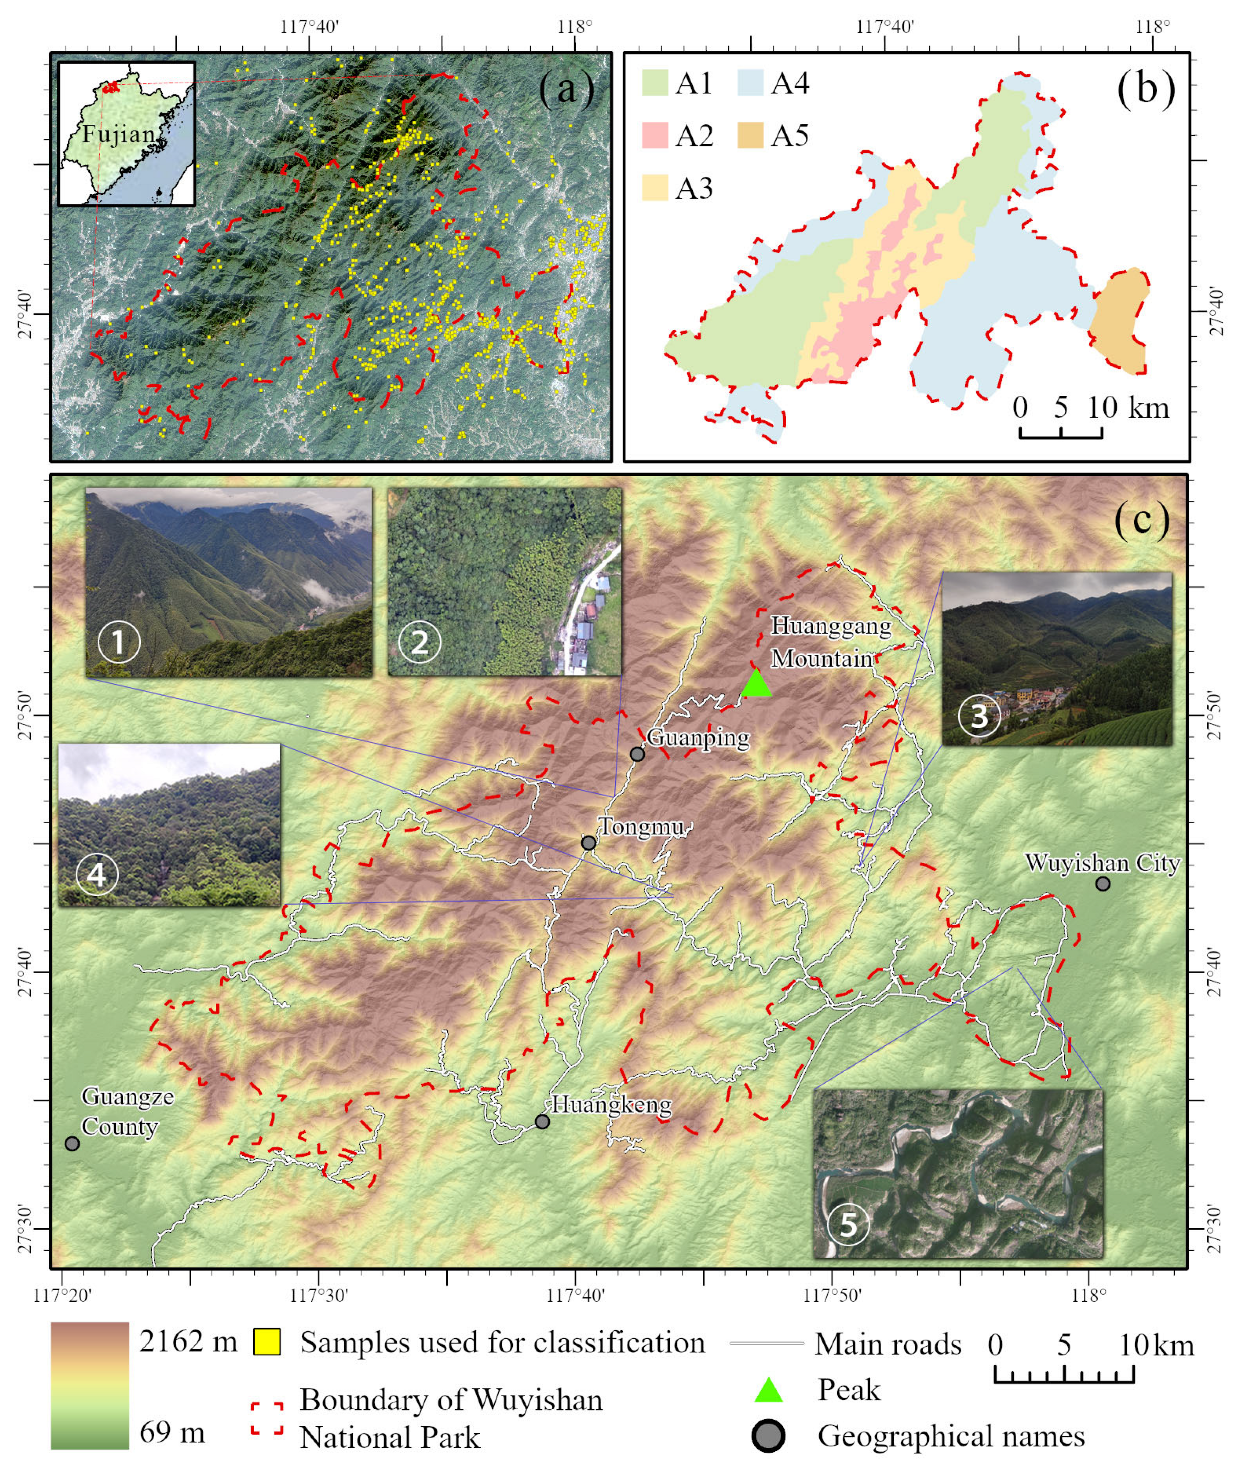
2. Study Area
3. Data and Methods
3.1. Dataset and Preprocessing
3.1.1. Sample Data Collection and Classification System Design
3.1.2. Collection and Preprocessing of Remotely Sensed Data
3.2. Vegetation Classification Based on the Fused Remotely Sensed Data
3.3. Characterizing Distribution Patterns of Vegetation Types
3.3.1. Vertical Distribution Patterns of Vegetation Types
3.3.2. Impact of Human Factors on Vegetation Type Distribution
4. Results
4.1. Analysis of Classification Results
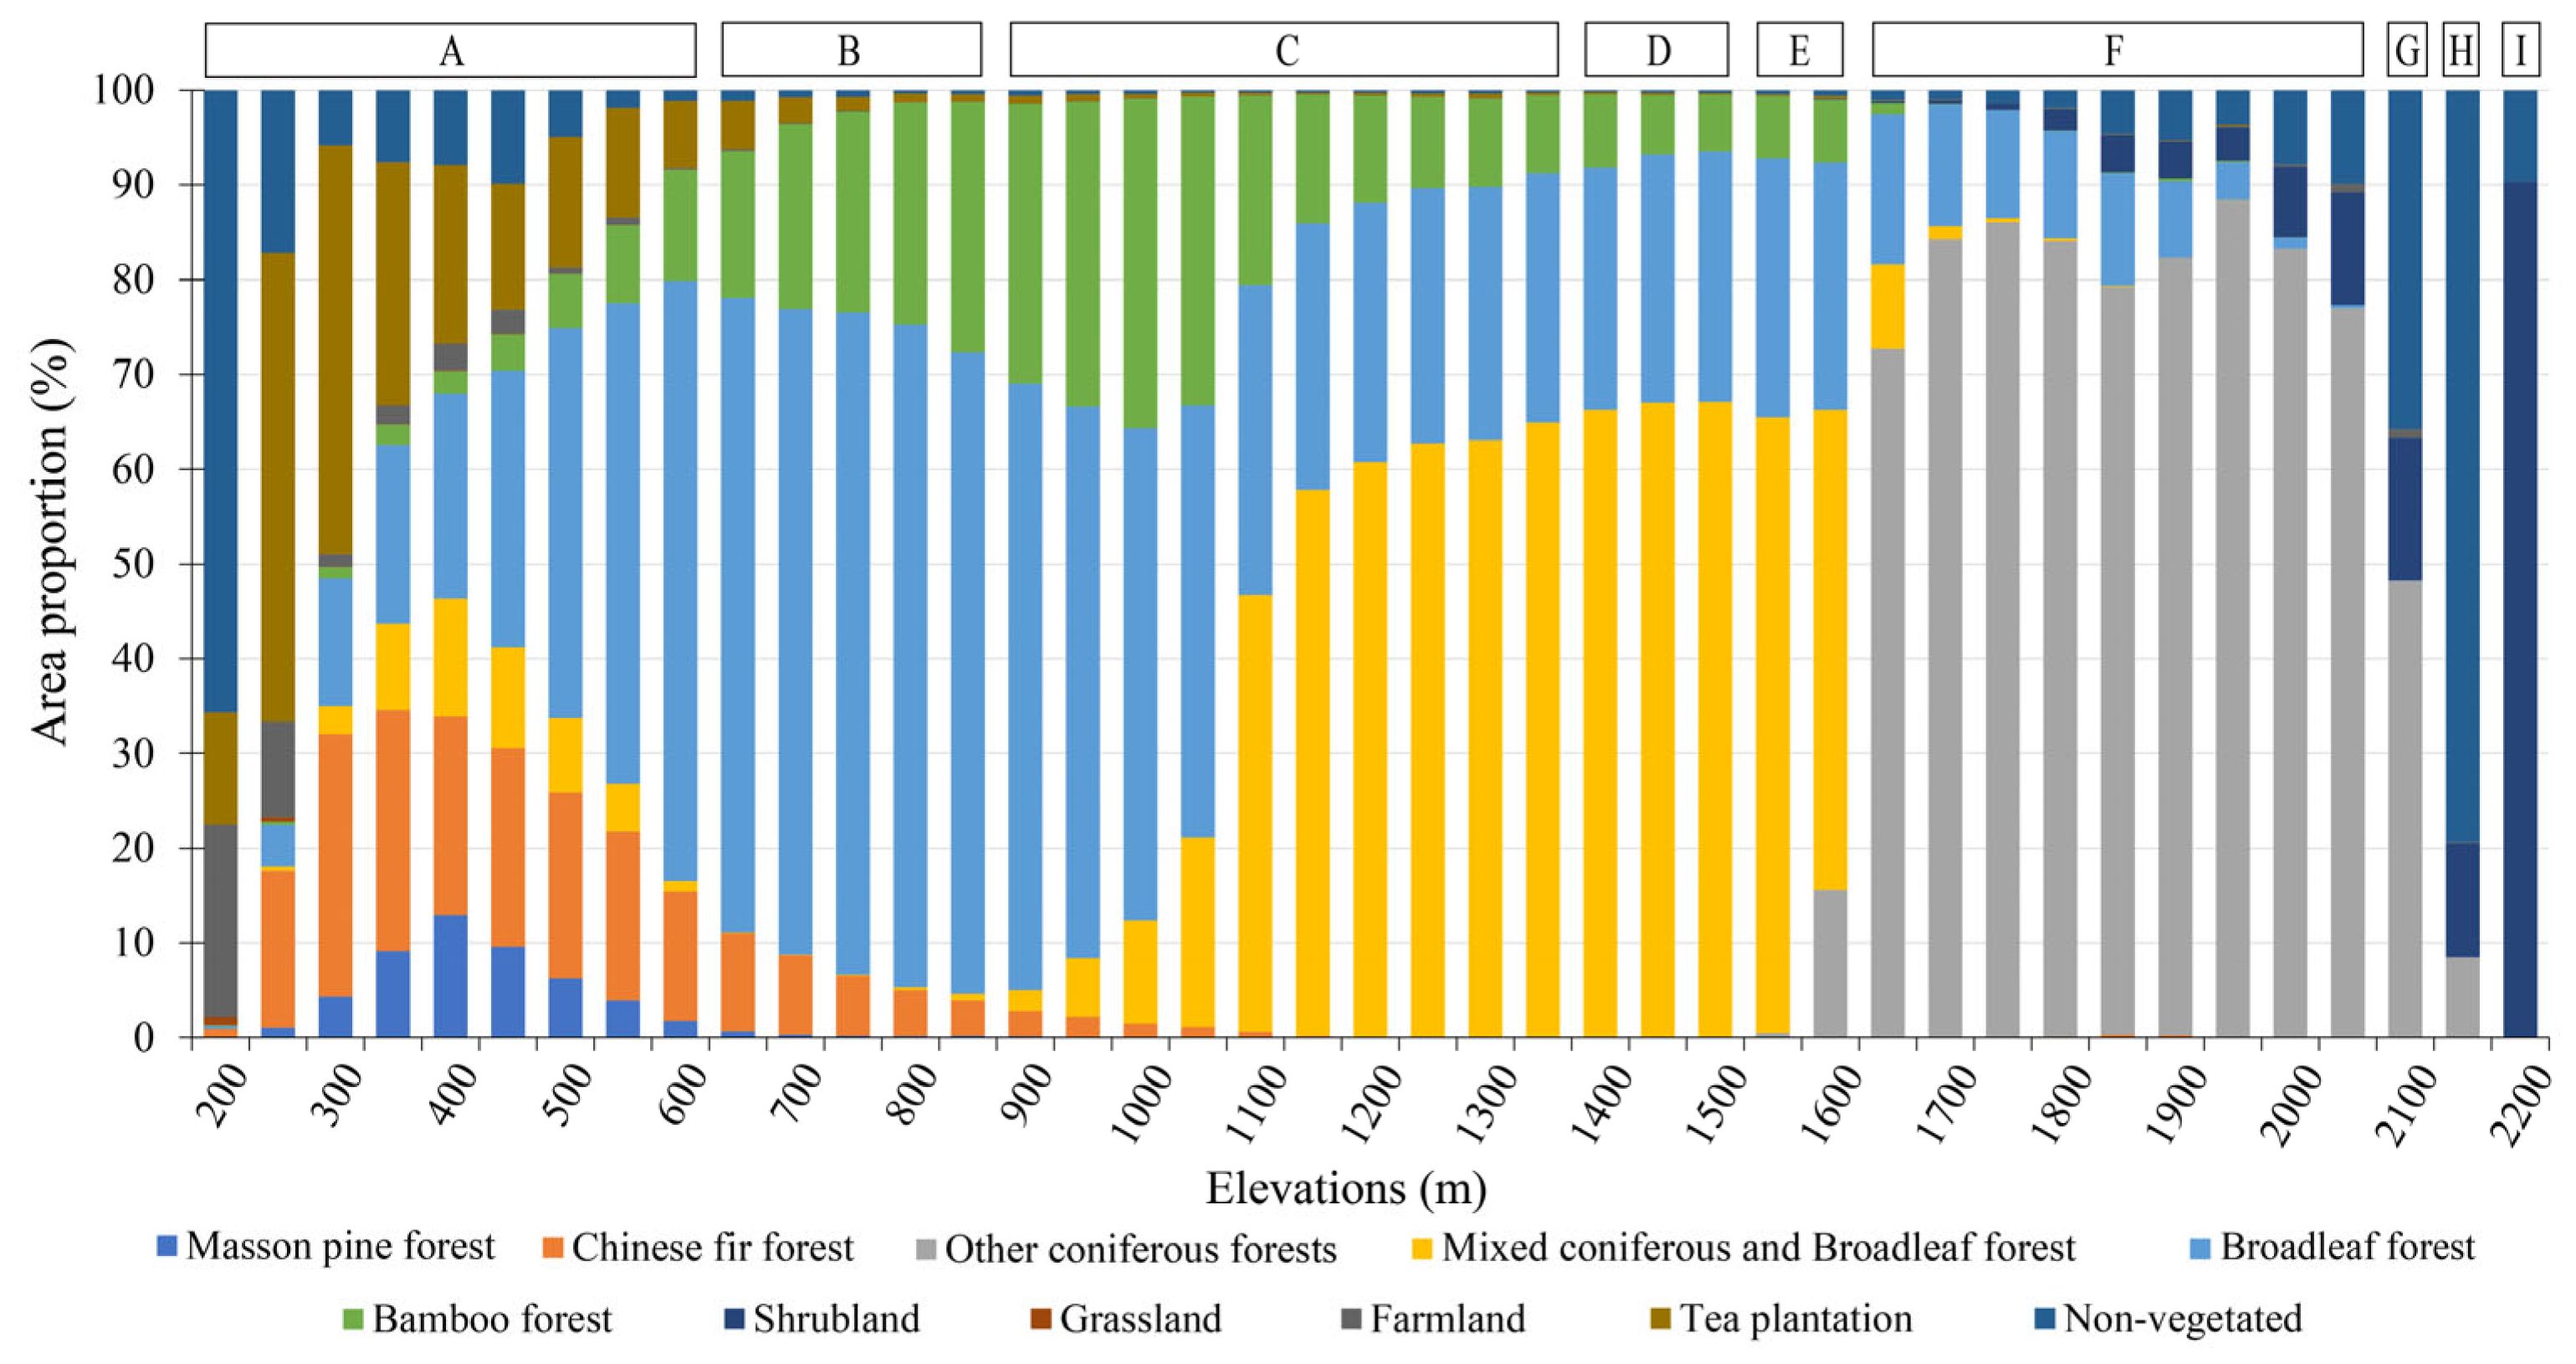
4.2. Vertical Characteristics of Vegetation Distribution in Wuyishan National Park
4.3. Influence of Human Factors on the Vertical Characteristics of Vegetation Distribution
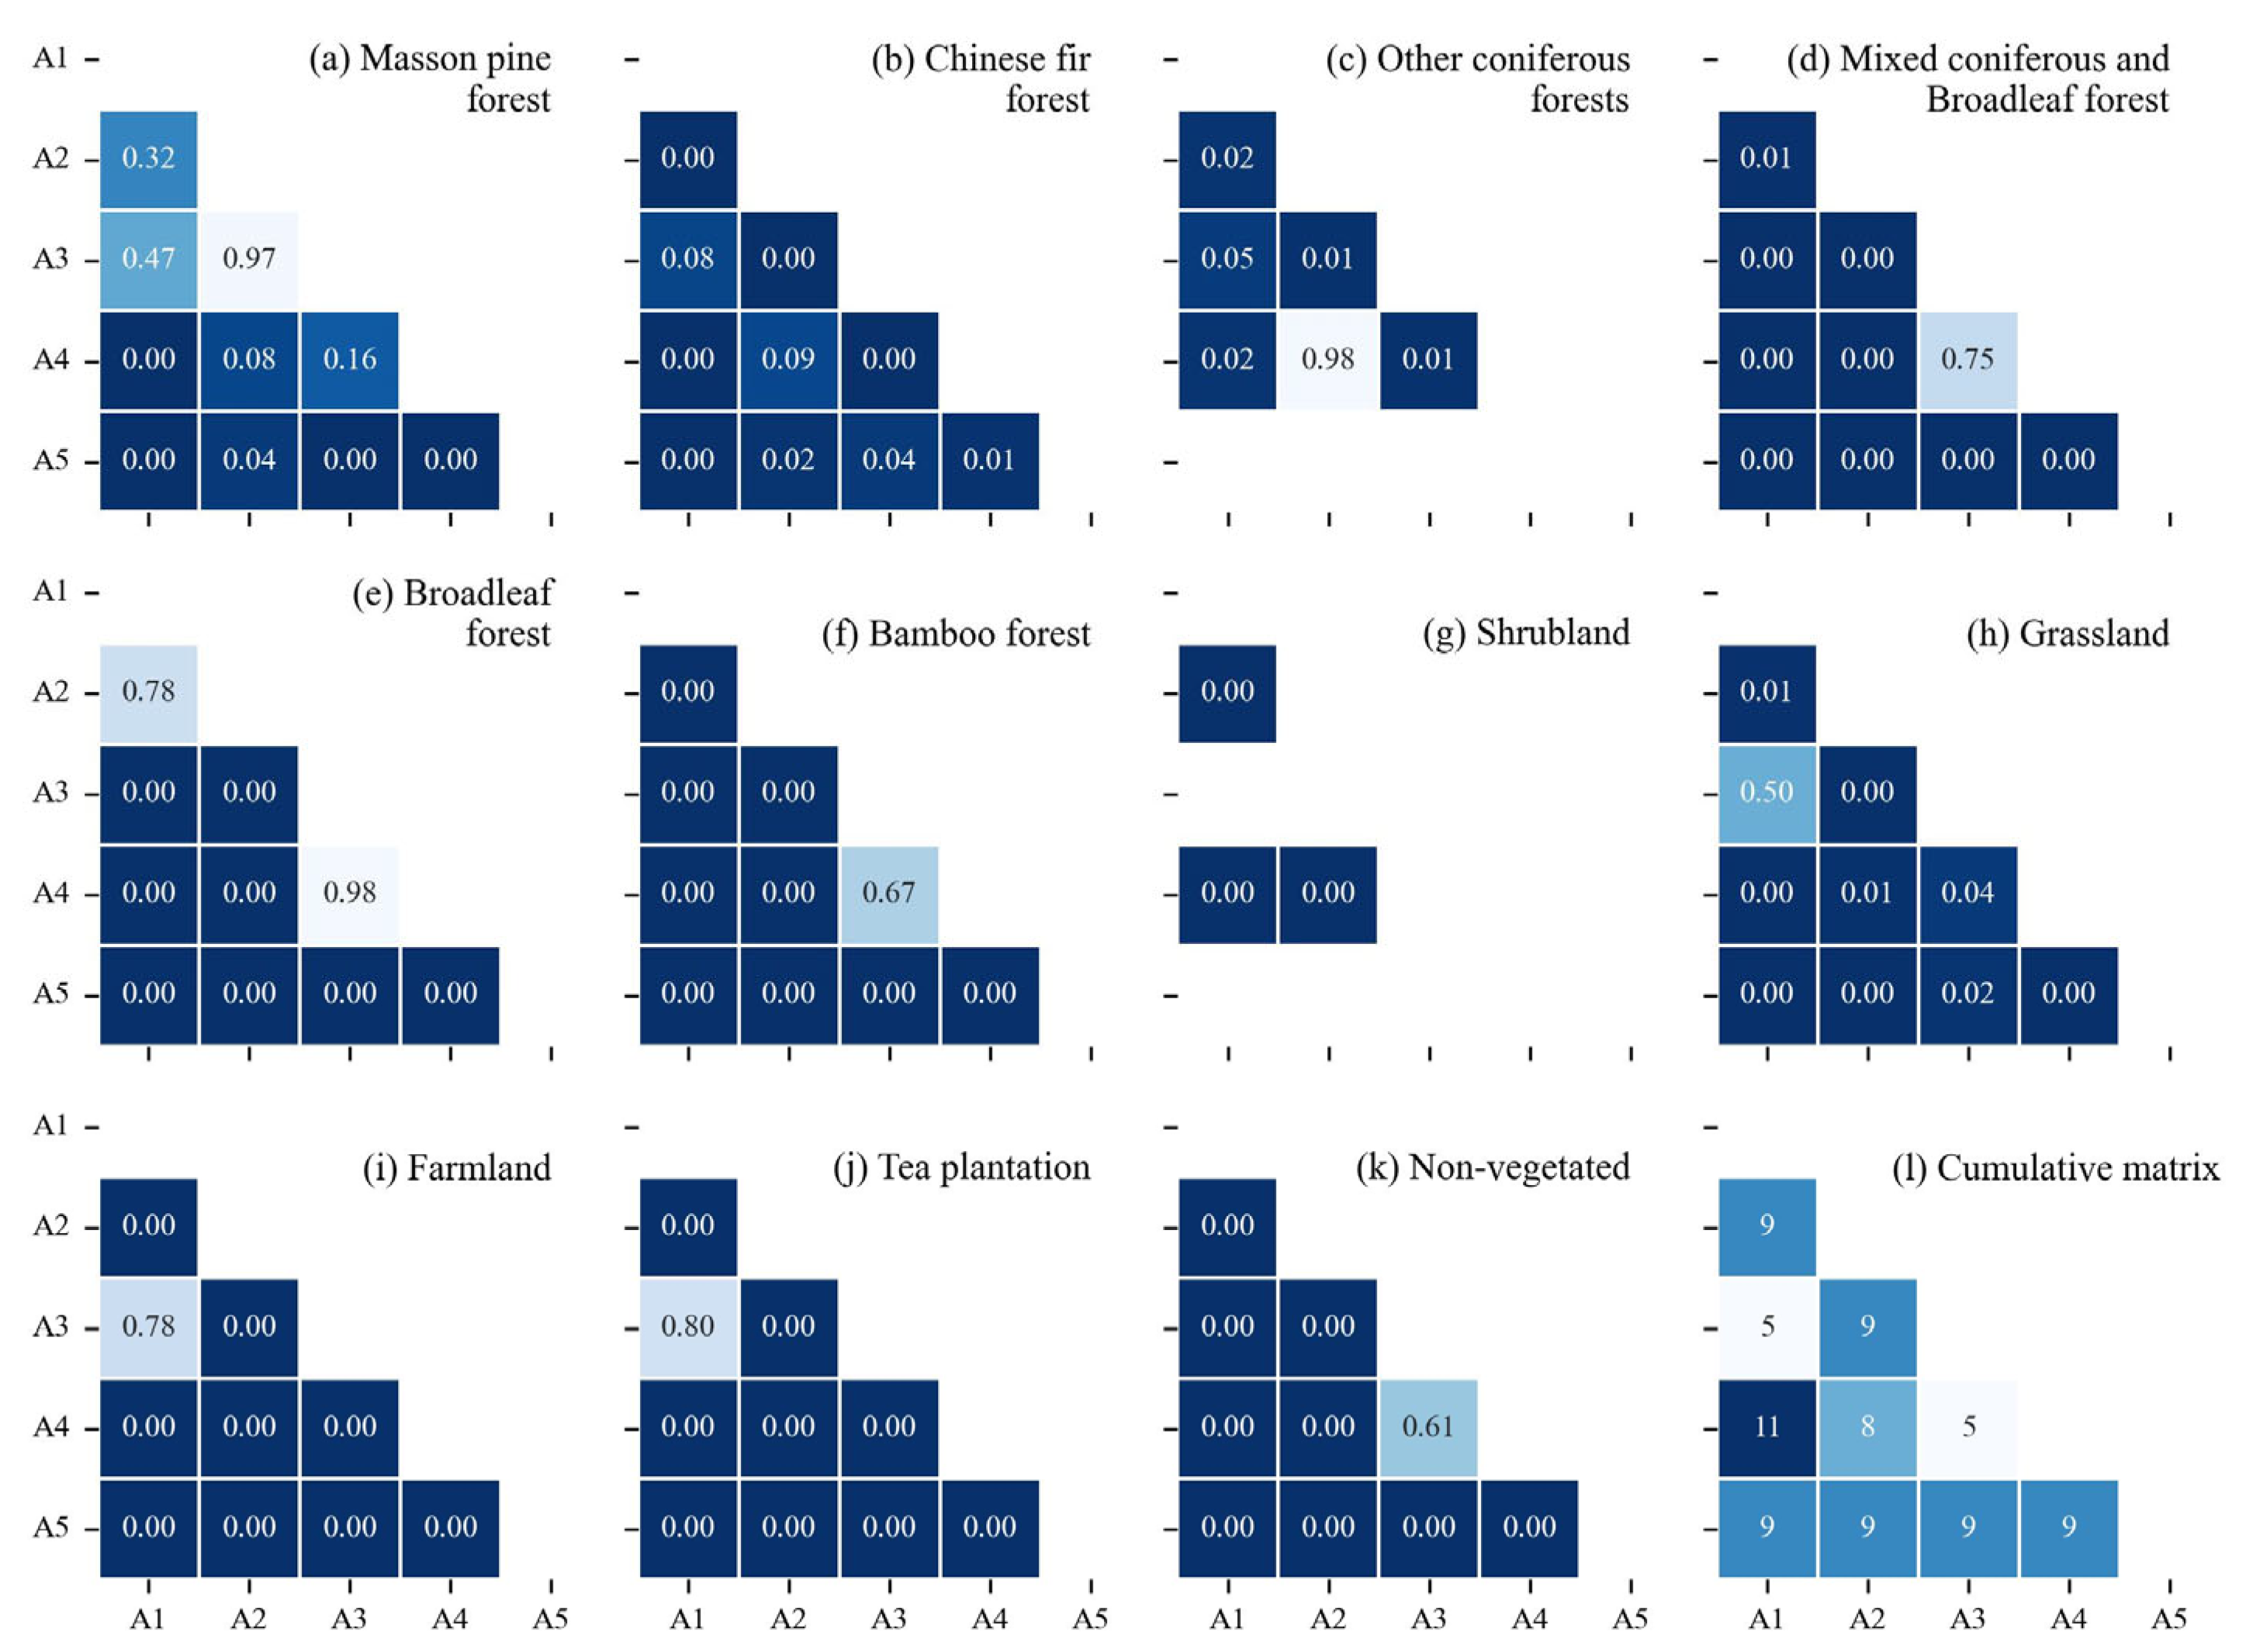
4.3.1. Vegetation Distribution in Five Subregions under Different Protection Levels
4.3.2. Vegetation Distribution with Road Distance
5. Discussion
5.1. Fine Classification of Vegetation Types Based on High-Resolution Remotely Sensed Data
5.2. Vertical Characteristics of Vegetation Distribution in Wuyishan National Park
5.3. Influences of Human Activities on Vertical Distribution of Vegetation Types
6. Conclusions
Author Contributions
Funding
Data Availability Statement
Acknowledgments
Conflicts of Interest
References
- Körner, C. The use of ‘altitude’ in ecological research. Trends Ecol. Evol. 2007, 22, 569–574. [Google Scholar] [CrossRef]
- Rahbek, C. The elevational gradient of species richness: A uniform pattern? Ecography 1995, 18, 200–205. [Google Scholar] [CrossRef]
- Pompa-García, M.; González-Cásares, M.; Gazol, A.; Camarero, J.J. Run to the hills: Forest growth responsiveness to drought increased at higher elevation during the late 20th century. Sci. Total Environ. 2021, 772, 145286. [Google Scholar] [CrossRef] [PubMed]
- Galván, J.D.; Camarero, J.J.; Gutiérrez, E. Seeing the trees for the forest: Drivers of individual growth responses to climate in Pinus uncinata mountain forests. J. Ecol. 2014, 102, 1244–1257. [Google Scholar] [CrossRef]
- Beniston, M. Climatic change in mountain regions: A review of possible impacts. Clim. Chang. 2003, 59, 5–31. [Google Scholar] [CrossRef]
- Zhao, F.; Zhang, B.; Zhu, L.; Yao, Y.; Cui, Y.; Liu, J. Spectra structures of altitudinal belts and their significance for determining the boundary between warm temperate and subtropical zones in the Qinling-Daba Mountains. Acta Geogr. Sin. 2019, 74, 889–901. [Google Scholar] [CrossRef]
- Piiroinen, R.; Fassnacht, F.E.; Heiskanen, J.; Maeda, E.; Mack, B.; Pellikka, P. Invasive tree species detection in the Eastern Arc Mountains biodiversity hotspot using one class classification. Remote Sens. Environ. 2018, 218, 119–131. [Google Scholar] [CrossRef]
- Zhang, Y.; Wu, X.; Zheng, D. Vertical differentiation of land cover in the central Himalayas. J. Geogr. Sci. 2020, 30, 969–987. [Google Scholar] [CrossRef]
- Chen, W.; Ding, H.; Li, J.; Chen, K.; Wang, H. Alpine treelines as ecological indicators of global climate change: Who has studied? What has been studied? Ecol. Inform. 2022, 70, 101691. [Google Scholar] [CrossRef]
- Gao, M.; Piao, S.; Chen, A.; Yang, H.; Liu, Q.; Fu, Y.H.; Janssens, I.A. Divergent changes in the elevational gradient of vegetation activities over the last 30 years. Nat. Commun. 2019, 10, 2970. [Google Scholar] [CrossRef]
- Chen, Y.; Zhao, S.; Xie, Z.; Lu, D.; Chen, E. Mapping multiple tree species classes using a hierarchical procedure with optimized node variables and thresholds based on high spatial resolution satellite data. GIScience Remote Sens. 2020, 57, 526–542. [Google Scholar] [CrossRef]
- Gómez, C.; White, J.C.; Wulder, M.A. Optical remotely sensed time series data for land cover classification: A review. ISPRS J. Photogramm. Remote Sens. 2016, 116, 55–72. [Google Scholar] [CrossRef]
- Neigh, C.S.R.; Masek, J.G.; Bourget, P.; Rishmawi, K.; Zhao, F.; Huang, C.; Cook, B.D.; Nelson, R.F. Regional rates of young US forest growth estimated from annual Landsat disturbance history and IKONOS stereo imagery. Remote Sens. Environ. 2016, 173, 282–293. [Google Scholar] [CrossRef]
- Kussul, N.; Lavreniuk, M.; Skakun, S.; Shelestov, A. Deep learning classification of land cover and crop types using remote sensing data. IEEE Geosci. Remote Sens. Lett. 2017, 14, 778–782. [Google Scholar] [CrossRef]
- Fu, D.; Li, D.; Lu, D.; Chen, Y. Accuracy assessment of three 30 m resolution global land cover products in Fujian province based on survey data. J. Fujian Norm. Univ. 2023, 39, 122–136. [Google Scholar]
- Tong, X.-Y.; Xia, G.-S.; Lu, Q.; Shen, H.; Li, S.; You, S.; Zhang, L. Land-cover classification with high-resolution remote sensing images using transferable deep models. Remote Sens. Environ. 2020, 237, 111322. [Google Scholar] [CrossRef]
- Chen, Y.; Peng, Z.; Ye, Y.; Jiang, X.; Lu, D.; Chen, E. Exploring a uniform procedure to map Eucalyptus plantations based on fused medium–high spatial resolution satellite images. Int. J. Appl. Earth Obs. Geoinf. 2021, 103, 102462. [Google Scholar] [CrossRef]
- Yu, X.; Lu, D.; Jiang, X.; Li, G.; Chen, Y.; Li, D.; Chen, E. Examining the roles of spectral, spatial, and topographic features in improving land-cover and forest classifications in a subtropical region. Remote Sens. 2020, 12, 2907. [Google Scholar] [CrossRef]
- Blaschke, T.; Hay, G.J.; Kelly, M.; Lang, S.; Hofmann, P.; Addink, E.; Feitosa, R.Q.; Van der Meer, F.; Van der Werff, H.; Van Coillie, F. Geographic object-based image analysis–towards a new paradigm. ISPRS J. Photogramm. Remote Sens. 2014, 87, 180–191. [Google Scholar] [CrossRef]
- Zhang, C.; Sargent, I.; Pan, X.; Li, H.; Gardiner, A.; Hare, J.; Atkinson, P.M. An object-based convolutional neural network (OCNN) for urban land use classification. Remote Sens. Environ. 2018, 216, 57–70. [Google Scholar] [CrossRef]
- Estoque, R.C.; Murayama, Y.; Akiyama, C.M. Pixel-based and object-based classifications using high-and medium-spatial-resolution imageries in the urban and suburban landscapes. Geocarto Int. 2015, 30, 1113–1129. [Google Scholar] [CrossRef]
- Vizzari, M. PlanetScope, Sentinel-2, and Sentinel-1 data integration for object-based land cover classification in Google Earth Engine. Remote Sens. 2022, 14, 2628. [Google Scholar] [CrossRef]
- Hughes, G. On the mean accuracy of statistical pattern recognizers. IEEE Trans. Inf. Theory 1968, 14, 55–63. [Google Scholar] [CrossRef]
- Lu, D.; Weng, Q. A survey of image classification methods and techniques for improving classification performance. Int. J. Remote Sens. 2007, 28, 823–870. [Google Scholar] [CrossRef]
- Xie, Z.; Chen, Y.; Lu, D.; Li, G.; Chen, E. Classification of land cover, forest, and tree species classes with ZiYuan-3 multispectral and stereo data. Remote Sens. 2019, 11, 164. [Google Scholar] [CrossRef]
- Belgiu, M.; Drăguţ, L. Random forest in remote sensing: A review of applications and future directions. ISPRS J. Photogramm. Remote Sens. 2016, 114, 24–31. [Google Scholar] [CrossRef]
- Maxwell, A.E.; Warner, T.A.; Fang, F. Implementation of machine-learning classification in remote sensing: An applied review. Int. J. Remote Sens. 2018, 39, 2784–2817. [Google Scholar] [CrossRef]
- Song, L.; Estes, A.B.; Estes, L.D. A super-ensemble approach to map land cover types with high resolution over data-sparse African savanna landscapes. Int. J. Appl. Earth Obs. Geoinf. 2023, 116, 103152. [Google Scholar] [CrossRef]
- Ding, H.; Yang, Y.; Xu, H.; Fang, Y.; Chen, X.; Yang, Q.; Yi, X.; Xu, H.; Wen, X.; Xu, X. Species composition and community structure of the typical evergreen broad-leaved forest in the Wuyi Mountains of Southeastern China. Acta Ecol. Sin. 2015, 35, 1142–1154. [Google Scholar] [CrossRef]
- Lan, S. Plant species diversity in Wuyishan national nature reserve. Sci. Silvae Sin. 2003, 39, 36–43. [Google Scholar] [CrossRef]
- Guo, Y.; Lei, P.; Yan, Y.; Yuan, R.; Wu, S.; Li, J. Plant species diversity changes along altitudinal gradient on the northwest slope of Huanggang Mountain of Jiangxi Wuyi Mountain. Chin. J. Ecol. 2015, 34, 3002–3008. [Google Scholar] [CrossRef]
- You, W.; He, D.; Huang, D.; Hong, W.; Wu, L.; Wang, Y.; Chen, B.; Yu, J.; Jiang, X. Spatial pattern and driving mechanism in Wuyishan scenery district. Mt. Res. 2011, 29, 677–687. [Google Scholar] [CrossRef]
- Fan, M.; Liao, K.; Lu, D.; Li, D. Examining vegetation change and associated spatial patterns in Wuyishan National Park at different protection levels. Remote Sens. 2022, 14, 1712. [Google Scholar] [CrossRef]
- Xu, D.; Geng, Q.; Jin, C.; Xu, Z.; Xu, X. Tree line identification and dynamics under climate change in Wuyishan National Park based on Landsat Images. Remote Sens. 2020, 12, 2890. [Google Scholar] [CrossRef]
- Zhou, M.; Li, D.; Liao, K.; Lu, D. Integration of Landsat time-series vegetation indices improves consistency of change detection. Int. J. Digit. Earth 2023, 16, 1276–1299. [Google Scholar] [CrossRef]
- He, J.; Lan, S.; Liu, C.; Li, L. Wuyishan research series. In Natural Resources; Xiamen University Press: Xiamen, China, 1994; ISBN 7-5615-0909-X. [Google Scholar]
- Brodu, N. Super-resolving multiresolution images with band-independent geometry of multispectral pixels. IEEE Trans. Geosci. Remote Sens. 2017, 55, 4610–4617. [Google Scholar] [CrossRef]
- Laben, C.A.; Brower, B.V. Process for Enhancing the Spatial Resolution of Multispectral Imagery Using Pan-Sharpening. U.S. Patent 6,011,875, 4 January 2000. [Google Scholar]
- Myint, S.W.; Gober, P.; Brazel, A.; Grossman-Clarke, S.; Weng, Q. Per-pixel vs. object-based classification of urban land cover extraction using high spatial resolution imagery. Remote Sens. Environ. 2011, 115, 1145–1161. [Google Scholar] [CrossRef]
- Jiang, X.; Zhao, S.; Chen, Y.; Lu, D. Exploring tree species classification in subtropical regions with a modified hierarchy-based classifier using high spatial resolution multisensor Data. J. Remote Sens. 2022, 2022, 9847835. [Google Scholar] [CrossRef]
- Räsänen, A.; Virtanen, T. Data and resolution requirements in mapping vegetation in spatially heterogeneous landscapes. Remote Sens. Environ. 2019, 230, 111207. [Google Scholar] [CrossRef]
- Zhao, S.; Jiang, X.; Li, G.; Chen, Y.; Lu, D. Integration of ZiYuan-3 multispectral and stereo imagery for mapping urban vegetation using the hierarchy-based classifier. Int. J. Appl. Earth Obs. Geoinf. 2021, 105, 102594. [Google Scholar] [CrossRef]
- Jiang, H.; Chen, A.; Wu, Y.; Zhang, C.; Chi, Z.; Li, M.; Wang, X. Vegetation monitoring for mountainous regions using a new integrated topographic correction (ITC) of the SCS + C correction and the shadow-eliminated vegetation index. Remote Sens. 2022, 14, 3073. [Google Scholar] [CrossRef]
- Wu, T.; Luo, J.; Gao, L.; Sun, Y.; Dong, W.; Zhou, Y.N.; Liu, W.; Hu, X.; Xi, J.; Wang, C.; et al. Geo-object-based vegetation mapping via machine learning methods with an intelligent sample collection scheme: A case study of Taibai Mountain, China. Remote Sens. 2021, 13, 249. [Google Scholar] [CrossRef]
- Mao, X.; Deng, Y.; Zhu, L.; Yao, Y. Hierarchical geographic object-based vegetation type extraction based on multi-source remote sensing data. Forests 2020, 11, 1271. [Google Scholar] [CrossRef]
- Du, H.; Mao, F.; Li, X.; Zhou, G.; Xu, X.; Han, N.; Sun, S.; Gao, G.; Cui, L.; Li, Y. Mapping global bamboo forest distribution using multisource remote sensing data. IEEE J. Sel. Top. Appl. Earth Obs. Remote Sens. 2018, 11, 1458–1471. [Google Scholar] [CrossRef]
- Lu, M.; Chen, B.; Liao, X.; Yue, T.; Yue, H.; Ren, S.; Li, X.; Nie, Z.; Xu, B. Forest types classification based on multi-source data fusion. Remote Sens. 2017, 9, 1153. [Google Scholar] [CrossRef]
- Zhou, G.; Ni, Z.; Zhao, Y.; Luan, J. Identification of bamboo species based on Extreme Gradient Boosting (XGBoost) using Zhuhai-1 orbita hyperspectral remote sensing imagery. Sensors 2022, 22, 5434. [Google Scholar] [CrossRef]
- Michałowska, M.; Rapiński, J. A review of tree species classification based on airborne LiDAR data and applied classifiers. Remote Sens. 2021, 13, 353. [Google Scholar] [CrossRef]
- Mäyrä, J.; Keski-Saari, S.; Kivinen, S.; Tanhuanpää, T.; Hurskainen, P.; Kullberg, P.; Poikolainen, L.; Viinikka, A.; Tuominen, S.; Kumpula, T. Tree species classification from airborne hyperspectral and LiDAR data using 3D convolutional neural networks. Remote Sens. Environ. 2021, 256, 112322. [Google Scholar] [CrossRef]
- Ma, L.; Hurtt, G.; Tang, H.; Lamb, R.; Lister, A.; Chini, L.; Dubayah, R.; Armston, J.; Campbell, E.; Duncanson, L. Spatial heterogeneity of global forest aboveground carbon stocks and fluxes constrained by spaceborne lidar data and mechanistic modeling. Glob. Change Biol. 2023, 29, 3378–3394. [Google Scholar] [CrossRef]
- Chraibi, E.; Arnold, H.; Luque, S.; Deacon, A.; Magurran, A.E.; Féret, J.-B. A remote sensing approach to understanding patterns of secondary succession in tropical forest. Remote Sens. 2021, 13, 2148. [Google Scholar] [CrossRef]
- Lechner, A.M.; Foody, G.M.; Boyd, D.S. Applications in remote sensing to forest ecology and management. One Earth 2020, 2, 405–412. [Google Scholar] [CrossRef]
- Zhang, W.; Chen, H.; Lin, W.; Dong, J.; Chen, S.; Zhao, W. Analysis on community diversity in coniferous-broadleaved mixed forests in Wuyi Mountain. J. For. Environ. 2016, 36, 136–140. [Google Scholar] [CrossRef]
- Zhang, H.; Xue, J. Spatial Pattern and competitive relationships of Moso bamboo in a native subtropical rainforest community. Forests 2018, 9, 774. [Google Scholar] [CrossRef]
- Yan, Y.; Xia, M.; Fan, S.; Zhan, M.; Guan, F. Detecting the competition between Moso bamboos and broad-leaved trees in mixed forests using a terrestrial laser scanner. Forests 2018, 9, 520. [Google Scholar] [CrossRef]
- Chen, Y.; Lu, D.; Luo, G.; Huang, J. Detection of vegetation abundance change in the alpine tree line using multitemporal Landsat Thematic Mapper imagery. Int. J. Remote Sens. 2015, 36, 4683–4701. [Google Scholar] [CrossRef]
- Ameztegui, A.; Coll, L.; Brotons, L.; Ninot, J.M. Land-use legacies rather than climate change are driving the recent upward shift of the mountain tree line in the Pyrenees. Glob. Ecol. Biogeogr. 2016, 25, 263–273. [Google Scholar] [CrossRef]
- Jacob, M.; Frankl, A.; Beeckman, H.; Mesfin, G.; Hendrickx, M.; Guyassa, E.; Nyssen, J. North Ethiopian afro-alpine tree line dynamics and forest-cover change since the early 20th century. Land Degrad. Dev. 2015, 26, 654–664. [Google Scholar] [CrossRef]
- Li, X.; Mao, F.; Du, H.; Zhou, G.; Xing, L.; Liu, T.; Han, N.; Liu, Y.; Zheng, J.; Dong, L. Spatiotemporal evolution and impacts of climate change on bamboo distribution in China. J. Environ. Manag. 2019, 248, 109265. [Google Scholar] [CrossRef]
- Li, R.; Xu, M.; Wong, M.H.G.; Qiu, S.; Sheng, Q.; Li, X.; Song, Z. Climate change-induced decline in bamboo habitats and species diversity: Implications for giant panda conservation. Divers. Distrib. 2015, 21, 379–391. [Google Scholar] [CrossRef]
- Tuanmu, M.-N.; Viña, A.; Winkler, J.A.; Li, Y.; Xu, W.; Ouyang, Z.; Liu, J. Climate-change impacts on understorey bamboo species and giant pandas in China’s Qinling Mountains. Nat. Clim. Chang. 2013, 3, 249–253. [Google Scholar] [CrossRef]
- Muise, E.R.; Coops, N.C.; Hermosilla, T.; Ban, S.S. Assessing representation of remote sensing derived forest structure and land cover across a network of protected areas. Ecol. Appl. 2022, 32, e2603. [Google Scholar] [CrossRef]
- Liu, K.; Wang, A.; Zhang, S.; Zhu, Z.; Bi, Y.; Wang, Y.; Du, X. Tree species diversity mapping using UAS-based digital aerial photogrammetry point clouds and multispectral imageries in a subtropical forest invaded by Moso bamboo (Phyllostachys edulis). Int. J. Appl. Earth Obs. Geoinf. 2021, 104, 102587. [Google Scholar] [CrossRef]
- Canavan, S.; Richardson, D.M.; Visser, V.; Le Roux, J.J.; Vorontsova, M.S.; Wilson, J.R. The global distribution of bamboos: Assessing correlates of introduction and invasion. AoB Plants 2017, 9, plw078. [Google Scholar] [CrossRef]
- Ren, B.; Park, K.; Shrestha, A.; Yang, J.; McHale, M.; Bai, W.; Wang, G. Impact of human disturbances on the spatial heterogeneity of landscape fragmentation in Qilian Mountain national park, China. Land 2022, 11, 2087. [Google Scholar] [CrossRef]
- Yang, H.; Viña, A.; Winkler, J.A.; Chung, M.G.; Dou, Y.; Wang, F.; Zhang, J.; Tang, Y.; Connor, T.; Zhao, Z.; et al. Effectiveness of China’s protected areas in reducing deforestation. Environ. Sci. Pollut. Res. 2019, 26, 18651–18661. [Google Scholar] [CrossRef] [PubMed]


| Code | Regions | Protection Measures | Area (km2) | Elevation Range (m) | Average Elevation (m) | Standard Deviation of Elevation (m) |
|---|---|---|---|---|---|---|
| A1 | Core Area of Nature Reserve | Strict protection, only allowing scientific research activities | 329.05 | 297–2155 | 1175.65 | 359.30 |
| A2 | Experimental Area of Nature Reserve | Strict protection, only allowing scientific research, teaching internships, and similar activities | 89.06 | 404–1655 | 915.50 | 232.28 |
| A3 | Buffer Area of Nature Reserve | Strict control, allowing scientific experiments, teaching internships, tourism, and similar activities | 159.85 | 421–1927 | 1190.60 | 310.68 |
| A4 | Ecological Protection Area | Strict control, allowing ecological restoration and scientific research and education, with limited tourism development | 424.14 | 200–1864 | 812.20 | 325.29 |
| A5 | Scenic Area | General, allowing planned production activities and infrastructure construction that comply with regulations | 64.09 | 171–724 | 288.67 | 89.20 |
| Data Source | Spatial Resolution | Acquire Time | |
|---|---|---|---|
| High-resolution data | GF-6 | Panchromatic band: 2 m | 22 November 2019 |
| Multispectral data | Sentinel-2 | Blue, Green, Red, NIR bands: 10 m Other bands used: 20 m | 13 December 2019 |
| Terrain data | ALOS PALSAR DEM | 12.5 m | \ |
| Terms | Definitions | Determination Method |
|---|---|---|
| Distribution of Upper/Lower Limits | The elevation at the highest and lowest zones where a vegetation type exhibits continuous distribution. | The highest elevation where the type appears within a zone represents the upper limit, whereas the lowest elevation represents the lower limit of the distribution for that type. |
| Core Distribution Zone | The number of vertical zones occupied by the type is less than one-third of the total number of vertical zones within its distribution range, and the areal proportion of the type’s distribution within these zones is more than two-thirds of the total distribution area for that type. | Starting from the elevation zone with the highest proportion of the vegetation type’s area, the core distribution zone extends equally in both directions (upward and downward) in terms of area ratio. When the cumulative areal proportion of the type reaches more than two-thirds, the vertical distribution range is defined as the core zone (core distribution range) for that type. The number of vertical zones within the core zone should be less than one-third of the total number of vertical zones occupied by the type. |
| Main Distribution Zone | The vertical zones where the vertical distribution area of the vegetation type accounts for more than two-thirds of the total area of that type while lacking core distribution zone within its vertical distribution range. | Starting from the vertical zone with the highest proportion of the vegetation type’s area, the main distribution zone extends equally in both directions (upward and downward) based on area ratio. When the cumulative areal proportion of the type reaches more than two-thirds, the vertical distribution range of that type is defined as the main distribution range. |
| Dominant Belt | One vegetation type accounts for more than two-thirds of the zone’s area. | The proportion of a specific vegetation type’s distribution area within a vertical zone exceeds two-thirds of that zone’s area. |
| Compound Dominant Zone | It is characterized by two or more vegetation types, with the name based on the proportion of their respective distribution areas. | No single vegetation type dominates a vertical zone (the proportion does not reach more than two-thirds of the area). Vegetation types with a combined proportion exceeding two-thirds are selected in descending order based on their areal proportions, and the zone is named after these dominant types. |
| MP | CF | OC | MCB | BL | BB | SL | GL | FL | TP | NV | Total | |
|---|---|---|---|---|---|---|---|---|---|---|---|---|
| MP | 17 | 2 | 19 | |||||||||
| CF | 1 | 43 | 2 | 4 | 2 | 52 | ||||||
| OC | 1 | 21 | 22 | |||||||||
| MCB | 3 | 2 | 1 | 21 | 1 | 1 | 29 | |||||
| BL | 1 | 1 | 5 | 24 | 2 | 2 | 35 | |||||
| BB | 1 | 1 | 44 | 2 | 48 | |||||||
| SL | 4 | 1 | 5 | |||||||||
| GL | 3 | 3 | ||||||||||
| FL | 40 | 1 | 1 | 42 | ||||||||
| TP | 1 | 1 | 2 | 1 | 2 | 33 | 40 | |||||
| NV | 2 | 3 | 88 | 93 | ||||||||
| Total | 24 | 47 | 22 | 31 | 30 | 48 | 5 | 5 | 45 | 41 | 90 | 388 |
| PA (%) | 70.8 | 91.5 | 95.5 | 67.7 | 80.0 | 91.7 | 80.0 | 60.0 | 88.9 | 80.5 | 97.8 | |
| UA (%) | 89.5 | 82.7 | 95.5 | 72.4 | 68.6 | 91.7 | 80.0 | 100.0 | 95.2 | 82.5 | 94.6 | |
| Area (km2) | 12.8 | 60.3 | 50.8 | 265.5 | 435.0 | 156.4 | 1.1 | 0.3 | 7.0 | 53.2 | 23.9 | |
| Area Percentage (%) | 1.2 | 5.7 | 4.8 | 24.9 | 40.8 | 14.7 | 0.1 | 0.03 | 0.7 | 5.0 | 2.3 |
| Vegetation Types | Distribution Upper/Lower Limits (m) | Core Distribution Zone (m) | Main Distribution Zone (m) |
|---|---|---|---|
| Masson pine | 200–1450 | / | 200–500 |
| Chinese fir | 200–1950 | / | 200–600 |
| Other coniferous forests | 1300–2150 | / | 1300–1750 |
| Mixed coniferous and broadleaf forest | 200–1950 | / | 200–1400 |
| Broadleaf forest | 200–1950 | / | 200–1000 |
| Bamboo forest | 200–2000 | / | 200–1050 |
| Shrubland | 900–2200 | / | 2150–2200 |
| Grassland | 200–1750 | 200–300 | / |
| Farmland | 200–1650 | 200–350 | / |
| Tea plantation | 200–1750 | / | 200–450 |
| Non-vegetated lands | 200–2200 | / | 200–450 |
| MP | CF | OC | MCB | BL | BB | SL | GL | FL | TP | NV | |
|---|---|---|---|---|---|---|---|---|---|---|---|
| Core Area (A1) | 0.14 | 0.30 | 10.62 | 33.14 | 43.19 | 10.60 | 0.23 | 0.00 | 0.18 | 0.75 | 0.86 |
| Experimental Area (A2) | 0.04 | 0.44 | 7.22 | 41.92 | 35.97 | 12.58 | 0.17 | 0.00 | 0.03 | 0.80 | 0.82 |
| Buffer Area (A3) | 0.14 | 1.43 | 0.06 | 21.77 | 37.66 | 33.96 | - | 0.01 | 0.09 | 3.06 | 1.82 |
| Ecological Protection Area (A4) | 1.52 | 10.80 | 1.01 | 15.91 | 45.41 | 16.57 | 0.01 | 0.03 | 0.65 | 6.33 | 1.75 |
| Scenic Area (A5) | 8.94 | 17.95 | - | 3.94 | 14.32 | 1.33 | - | 0.24 | 5.48 | 31.01 | 16.78 |
| Vegetation Type | 1980s (m) [36] | 2019 (This Study) | |
|---|---|---|---|
| Distribution Upper Limit/Lower Limit (m) | Main Distribution Zone (m) | ||
| Masson pine | 200–1100 | 200–1450 | 200–500 |
| Chinese fir | 500–1400 | 200–1950 | 200–600 |
| Other coniferous forests | Southern hemlock 1500–1800 Huangshan pine 1200–1900 | 1300–2150 | 1300–1750 |
| Mixed coniferous and broadleaf forest | 500–1700 | 200–1950 | 200–1400 |
| Broadleaf forest | 350–1400 | 200–1950 | 200–1000 |
| Bamboo forest | 200–2158 | 200–2000 | 200–1050 |
Disclaimer/Publisher’s Note: The statements, opinions and data contained in all publications are solely those of the individual author(s) and contributor(s) and not of MDPI and/or the editor(s). MDPI and/or the editor(s) disclaim responsibility for any injury to people or property resulting from any ideas, methods, instructions or products referred to in the content. |
© 2023 by the authors. Licensee MDPI, Basel, Switzerland. This article is an open access article distributed under the terms and conditions of the Creative Commons Attribution (CC BY) license (https://creativecommons.org/licenses/by/4.0/).
Share and Cite
Ye, Y.; Lu, D.; Wu, Z.; Liao, K.; Zhou, M.; Jian, K.; Li, D. Vertical Characteristics of Vegetation Distribution in Wuyishan National Park Based on Multi-Source High-Resolution Remotely Sensed Data. Remote Sens. 2023, 15, 5023. https://doi.org/10.3390/rs15205023
Ye Y, Lu D, Wu Z, Liao K, Zhou M, Jian K, Li D. Vertical Characteristics of Vegetation Distribution in Wuyishan National Park Based on Multi-Source High-Resolution Remotely Sensed Data. Remote Sensing. 2023; 15(20):5023. https://doi.org/10.3390/rs15205023
Chicago/Turabian StyleYe, Yongpeng, Dengsheng Lu, Zuohang Wu, Kuo Liao, Mingxing Zhou, Kai Jian, and Dengqiu Li. 2023. "Vertical Characteristics of Vegetation Distribution in Wuyishan National Park Based on Multi-Source High-Resolution Remotely Sensed Data" Remote Sensing 15, no. 20: 5023. https://doi.org/10.3390/rs15205023
APA StyleYe, Y., Lu, D., Wu, Z., Liao, K., Zhou, M., Jian, K., & Li, D. (2023). Vertical Characteristics of Vegetation Distribution in Wuyishan National Park Based on Multi-Source High-Resolution Remotely Sensed Data. Remote Sensing, 15(20), 5023. https://doi.org/10.3390/rs15205023