Article

Continuous Tracking of Forest Disturbance and Recovery in the Greater Khingan Mountains from Annual Landsat Imagery

1
Key Laboratory of Wetland Ecology and Environment, Northeast Institute of Geography and Agroecology, Chinese Academy of Sciences, Changchun 130102, China
2
University of Chinese Academy of Sciences, Beijing 100049, China
3
Fujian Key Laboratory of Big Data Application and Intellectualization for Tea Industry, Wuyi University, Nanping 354300, China
*
Author to whom correspondence should be addressed.
Remote Sens. 2023, 15(22), 5426; https://doi.org/10.3390/rs15225426
Submission received: 1 September 2023 / Revised: 16 November 2023 / Accepted: 16 November 2023 / Published: 20 November 2023
(This article belongs to the Special Issue Remote Sensing for Mountain Ecosystems II)

Abstract

:
Understanding accurate and continuous forest dynamics is of key importance for forest protection and management in the Greater Khingan Mountains (GKM). There has been a lack of finely captured and long-term information on forest disturbance and recovery since the mega-fire of 1987 which may limit the scientific assessment of the GKM’s vegetation conditions. Therefore, we proposed a rapid and robust approach to track the dynamics of forest disturbance and recovery from 1987 to 2021 using Landsat time series, LandTrendr, and random forests (RF) models. Furthermore, we qualified the spatial characteristics of forest changes in terms of burn severity, topography, and distances from roads and settlements. Our results revealed that the integrated method of LandTrendr and RF is well adapted to track forest dynamics in the GKM, with an overall accuracy of 0.86. From 1987 to 2021, forests in the GKM showed a recovery trend with a net increase of more than 4.72 × 10⁴ ha. Over 90% of disturbances occurred between 1987 and 2010 and over 75% of recovery occurred between 1987 and 1988. Mildly burned areas accounted for 51% of forest disturbance and severely burned areas contributed to 45% of forest recovery. Forest changes tended to occur in zones with elevations of 400–650 m, slopes of less than 9°, and within 6 km of roads and 24 km of settlements. Temporal trends of forest disturbance and recovery were mainly explained by the implementation timelines of major forestry policies. Our results provide high-resolution and time-series information on forest disturbance and recovery in the GKM which could support scientific decisions on forest management and sustainable utilization.

1. Introduction

Over the past few decades, forests have undergone rapid and significant changes due to alterations in population, the environment, and policies [1]. Forest changes can be broadly grouped into two categories, namely forest disturbance and recovery. Forest disturbances encompass both natural events (fires, hurricanes, etc.) and anthropogenic activities (deforestation, road construction, etc.) which collectively contributed to a global forest loss of approximately 1.78 × 10⁸ ha in 1990–2020 [2]. Forest recovery is considered beneficial for vegetation growth including the recovery from disturbed areas and the transition from non-forest areas to forest areas [3]. Both disturbance and recovery can impact the community composition, structure, and function of forests, thereby playing a critical role in regional carbon cycling, biodiversity, and climate change [4,5]. Therefore, an essential step in understanding forest resource dynamics is the reliable monitoring of forest disturbance and recovery [6].
Remote sensing technology has outstanding spatial and temporal continuous monitoring capabilities which can locate change information rapidly, including quantity, spatial distribution, and dynamic characteristics [7,8]. Traditional change detection methods, such as post-classification comparison and direct classification, rely on a limited number of images to identify changes. While these methods can deliver information regarding short-term or long-interval forest dynamics, they face challenges in providing a detailed understanding of long-term forest change processes [9,10]. Understanding the detailed changes in forests over a long period is crucial as it is an essential reference for developing policies towards the conservation and sustainable management of forest resources [11,12]. Time series analysis algorithms can leverage dense remote sensing data to capture changes in target features over long time scales dynamically [13,14], such as breaks for additive season and trend monitor (BFAST) [15], continuous change detection and classification (CCDC) [16], vegetation change tracker (VCT) [7], and Landsat-based detection of trends in disturbance and recovery (LandTrendr) [17]. Among these algorithms, VCT and LandTrendr are extensively utilized for mapping annual disturbances and recovery. VCT is commonly employed for extracting rapid changes by identifying deviations in the spectral signals [18]. LandTrendr can capture both abrupt and gradual signals, which has strong applicability in demonstrating forest dynamics by fitting and simplifying the trajectory of a single spectral index in the Landsat time series [17]. Particularly, Kennedy et al. transplanted the algorithm to the Google Earth Engine (GEE) platform which greatly facilitated the use of LandTrendr [19]. Commonly used spectral indices for LandTrendr include the normalized burn ratio (NBR), the normalized difference vegetation index (NDVI), and the normalized difference moisture index (NDMI) [20,21]. However, a single spectral index may not adequately capture the signals of vegetation change [22]. Thus, the selection of representative multispectral indices is essential for improving the accuracy of detected results. Additionally, due to factors such as phenology and image quality, time series observations may be mixed with a large proportion of noise and false signals. These data can be incorrectly interpreted by LandTrendr as the true changes, thereby affecting the evaluation of change dynamics [23]. Employing random forests (RF) as a classifier to re-identify detected information can effectively reduce errors of omission and commission, ultimately leading to improved accuracy [24,25]. In related studies, RF is predominantly employed for the classification of disturbed factors, with restricted application in the secondary identification of LandTrendr results [2,26]. Currently, the increasing demand for accurate and continuous capture of forest change footprints has further promoted the widespread application of the fusion approach of LandTrendr and RF secondary classification [20,22].
As the largest boreal forest in China, the Greater Khingan Mountains (GKM) regions play a pivotal role in the carbon cycle of terrestrial ecosystems [27]. On 6 May 1987, a severe fire occurred in the GKM, covering an area of over 1.10 × 10⁹ ha and causing great harm to the ecosystem services [28]. In response, the Chinese government attached great importance to the ecological recovery of the over-fired regions and implemented a series of forest policies [29]. However, frequent fires and other perturbations like deforestation and road construction have caused secondary damages to some recovering forests, threatening the ecosystem balance. In the GKM, Wang et al. used GLASS LAI data and the time-stepping modeling (TSM) algorithm to detect forest disturbance [30]. Chen et al. utilized four periods of Landsat imagery and calculated the disturbance index (DI) to analyze forest disturbance from 1990 to 2010 [31]. Huang et al. employed the spatial and temporal adaptive reflection fusion model (STARFM) algorithm to analyze the recovery of post-fire vegetation from 2000 to 2018 [32]. These relevant studies primarily focused on vegetation dynamics at short-term scales or separate time intervals, leaving a gap in assessing the long-term complexity of changes in forest disturbance and recovery after the mega-fire. Therefore, a comprehensive assessment of long-term forest dynamics is urgently needed for forest protection and management in the GKM.
Focusing on the GKM, the main objectives of this study are to (1) propose a rapid and robust approach using LandTrendr and RF to detect long-term forest disturbance and recovery; (2) apply the approach to reconstruct the history of forest disturbance and recovery in the GKM from 1987 to 2021; and (3) quantify the spatial patterns of forest changes in the GKM based on multiple factors, including burn severity, topography, and distances from roads and settlements.

2. Materials and Methods
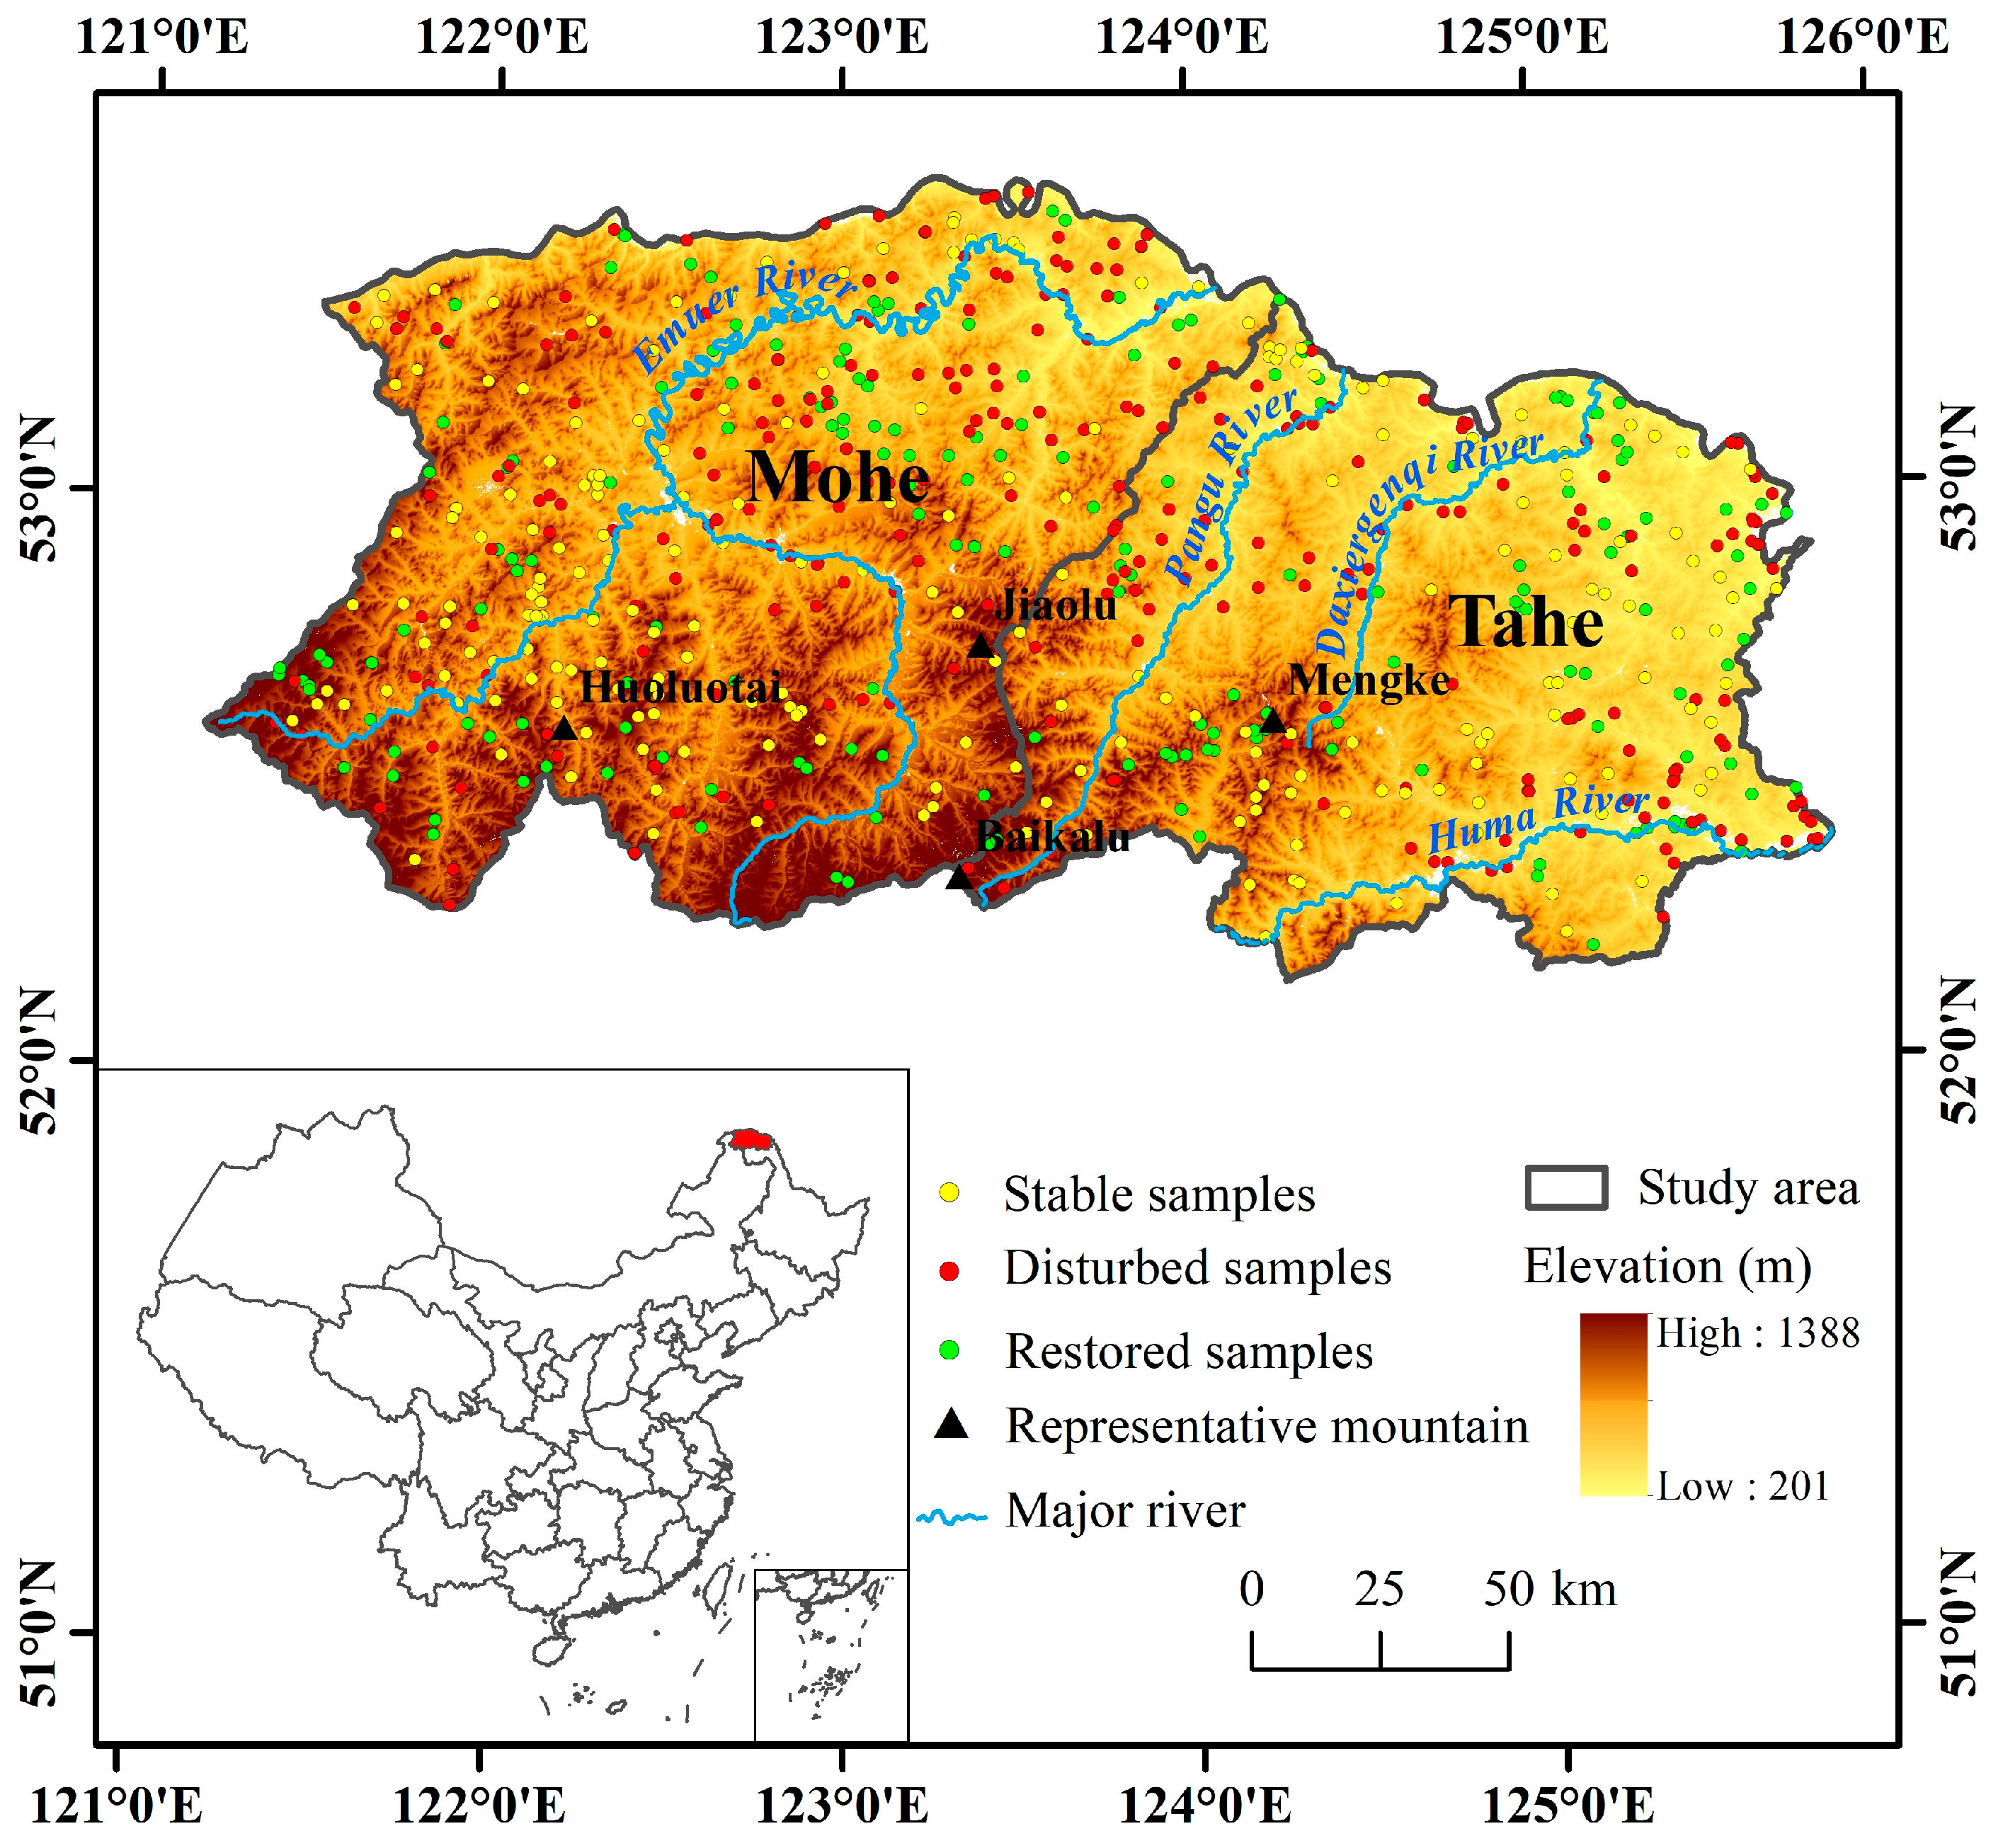
2.1. Study Area

Mohe City and Tahe County, located in the northern part of the GKM, were the disaster areas in the mega-fire of 1987. Since the mega-fire, the vegetation in this region has undergone complicated changes under the influence of various conservation measures and disturbed factors. We specifically focused on Mohe City and Tahe County, covering an area of approximately 3.28 × 10⁶ ha (Figure 1). The study area belongs to the cold temperate continental monsoon zone, with a short forest growing season and long and cold winters [29]. The average annual temperature ranges from −2 °C to −4 °C, accompanied by an annual precipitation of 400–500 mm [33]. The area is characterized by an undulating terrain, low-elevation areas in the north, and mountains with elevations as high as 1388 m in the south. Representative mountains include Huoluotai, Jiaolu, Baikalu, and Mengke. This region is also traversed by several major rivers, namely the Emuer River, Pangu River, Daxiergenqi River, and Huma River. Furthermore, there are abundant forest resources, with a forest coverage rate of more than 90%. Among them, Mohe City has a forest area of 1.63 × 10⁶ ha, with wood storage of 1.46 × 10⁸ m3 [34]; the forest area of Tahe County accounted for 90.7% and the forest stock volume reached 5.87 × 10⁷ m3. The forest structure of the study area is relatively homogeneous. The dominant tree species is the coniferous Larix gmelinii (larch). The main arbor trees consist of an assortment of Mongolian Pinus sylvestris (pine), white Betula platyphylla (birch), and larch [35].

2.2. Basic Data

Table 1 shows a detailed description of the fundamental datasets used in this study.
Landsat imagery provides a historically deep and data-rich archive on a terrestrial surface and is a valuable resource for change detection [36,37]. This study employs Landsat imagery for three primary purposes. Firstly, it is used to synthesize annual median imagery spanning from 1986 to 2021 in preparation for executing the LandTrendr algorithm. Secondly, it is utilized to generate training and validation samples based on the spectral variations in Landsat image chips. Lastly, it is introduced to extract the burned areas of the mega-fire.
The CLCD is among the limited number of publicly available annual land cover datasets. It provides forest region data for China in 1985 and from 1990 to 2021 [38]. Here, the CLCD was employed to determine the maximum forest extent within our study area. We used the NFI data to generate forest change samples for the period of 2016–2021. These samples were then utilized for secondary classification, aiming to reduce the commission error of the LandTrendr model. We also acquired the HGFC data to compare with our detected results [39]. The DEM and OSM data were intended to analyze the spatial characteristics of forest changes in the GKM.

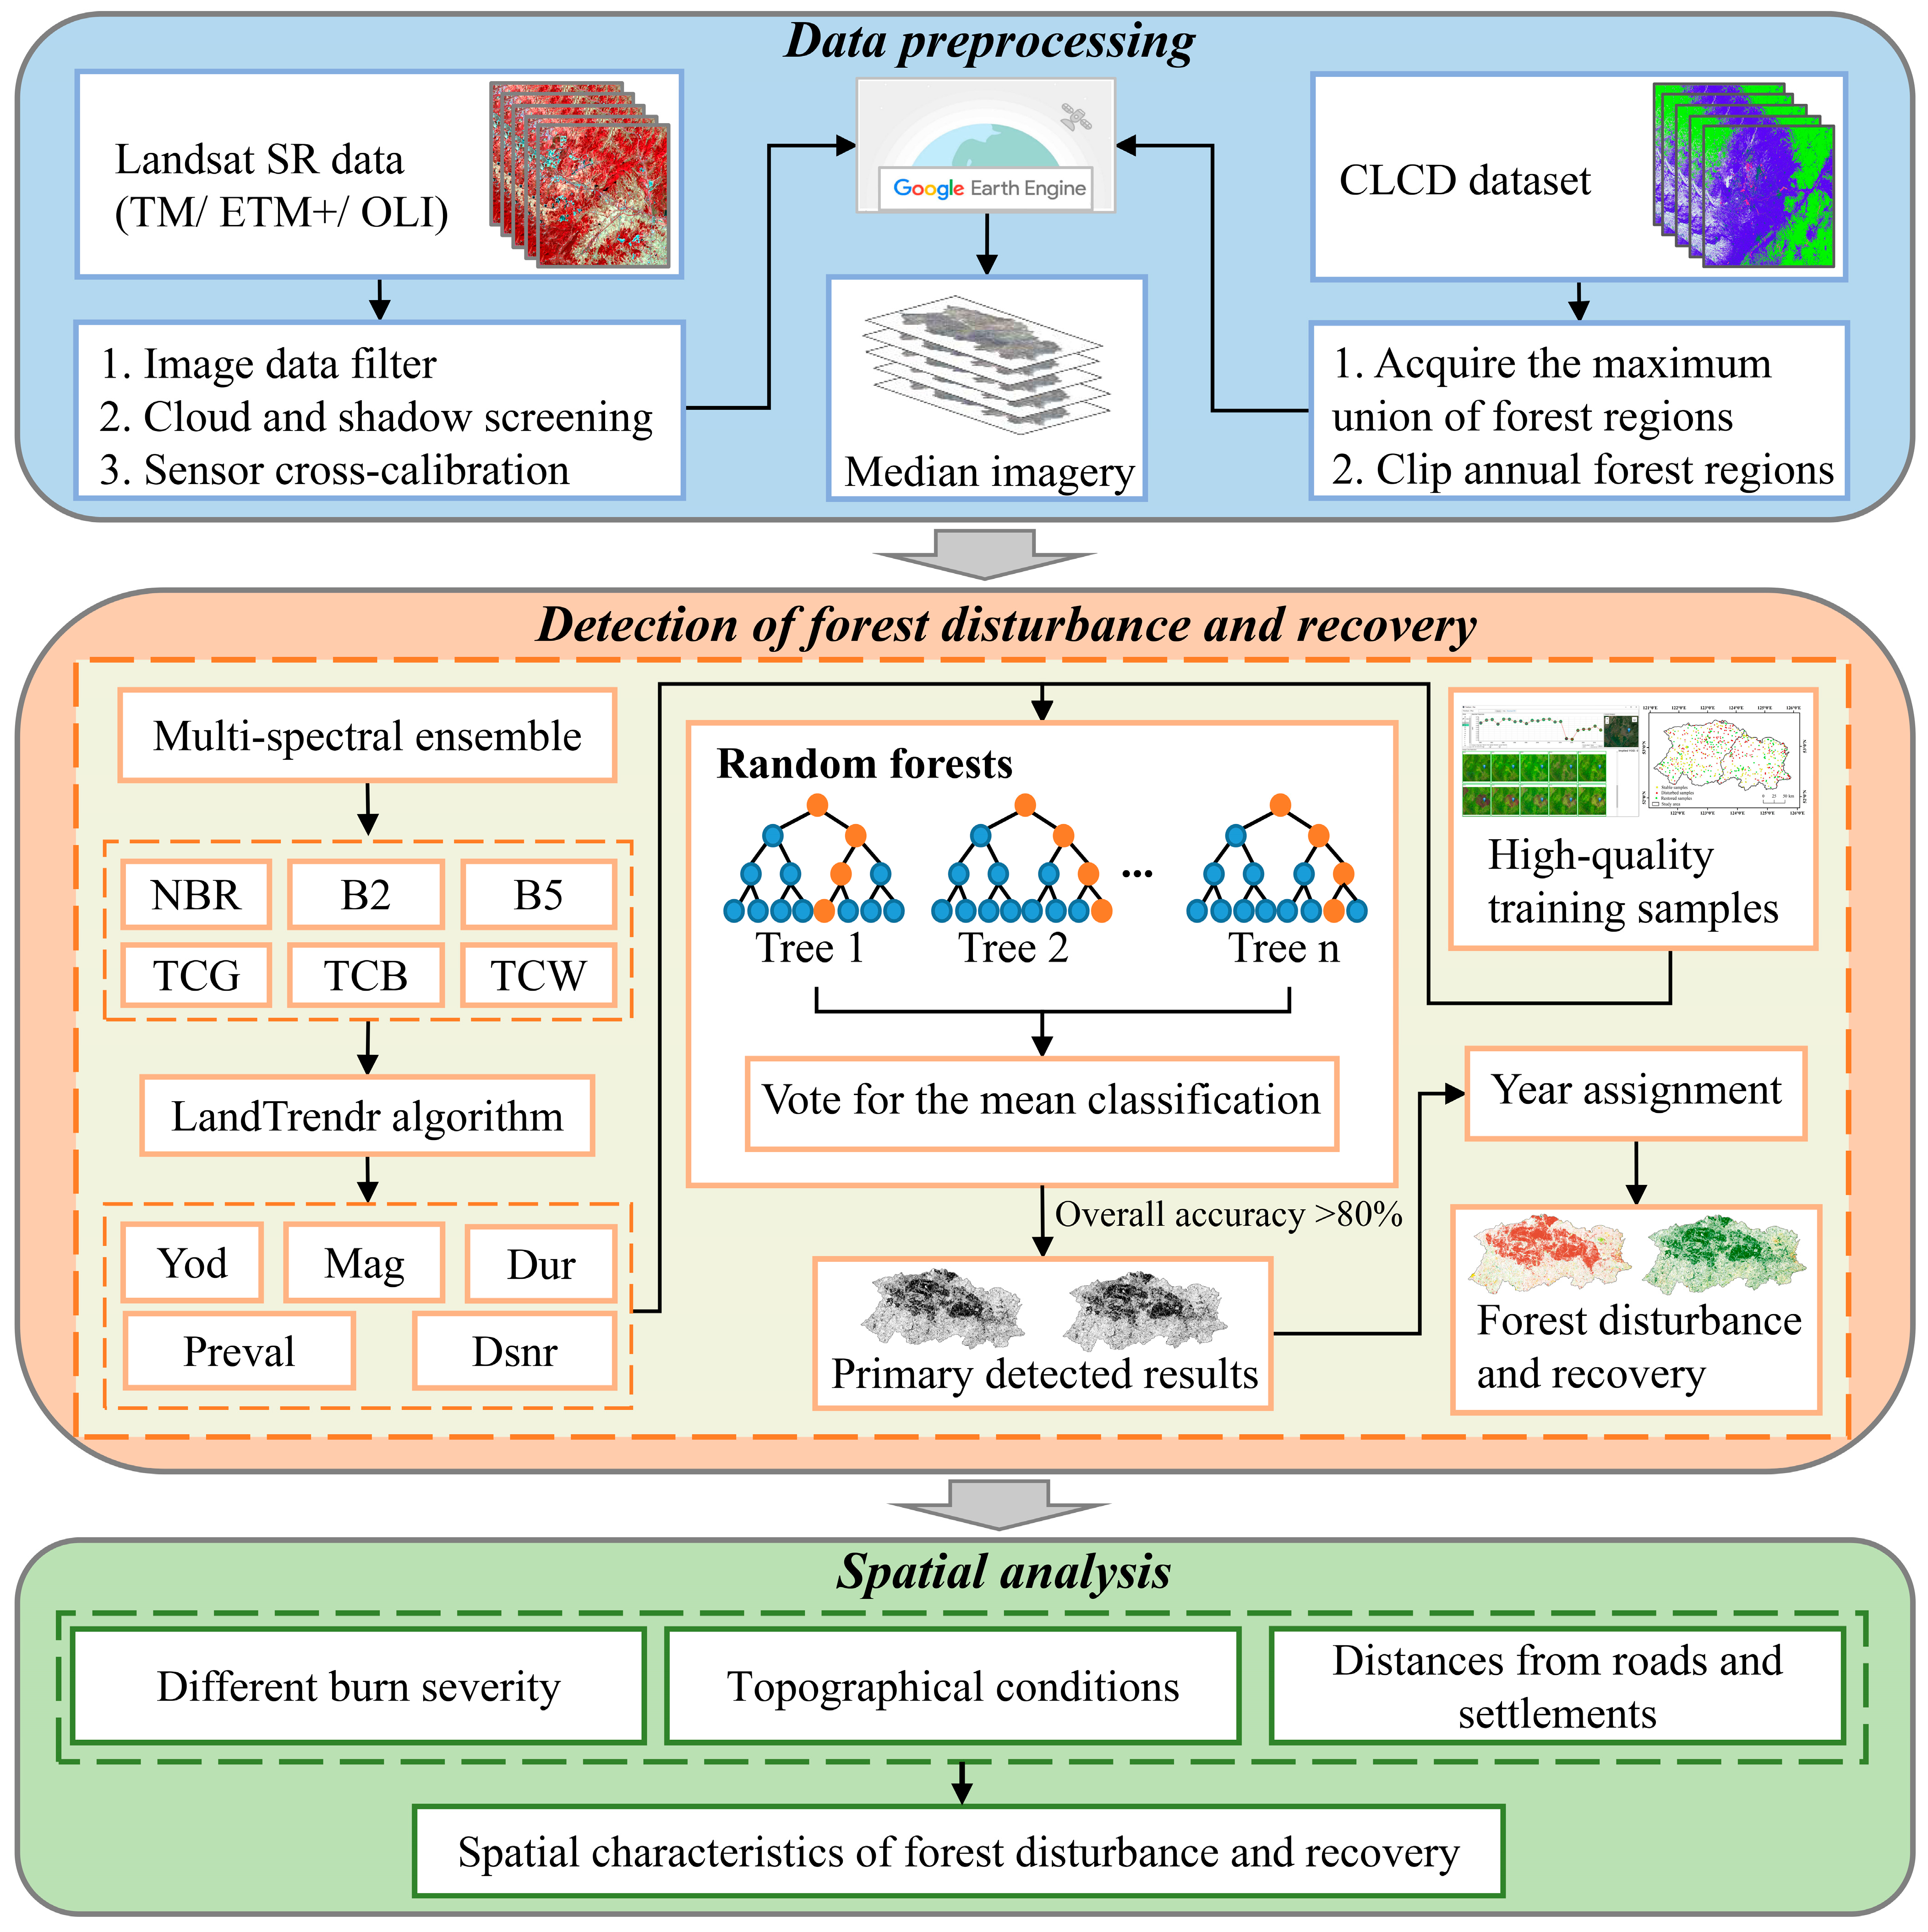
2.3. Integrated Detection of Forest Disturbance and Recovery

To finely capture forest dynamics information, our methodology comprised three specific steps (Figure 2). In step 1, we constructed annual Landsat median imagery and masked out the non-forested regions. In step 2, we used LandTrendr and RF to extract change information in forests and evaluated yearly detected results based on independent reference data. In our final and third steps, the spatial characteristics of forest disturbance and recovery were demonstrated, taking into account burn severity, topography, and distances from roads and settlements.

2.3.1. Processing of Annual Landsat Imagery

This study utilized the GEE platform [40] to acquire Landsat-5 TM, Landsat-7 ETM+, and Landsat-8 OLI surface reflectance (SR) data during 1986–2021. Here, we designated the imagery from 1986 as the reference baseline while the actual study period for analyzing forest dynamics spans from 1987 to 2021. The radiation calibration and atmospheric correction of TM and ETM+ data were processed by the Landsat ecosystem disturbance adaptive processing system (LEDAPS) model algorithm [41,42]. OLI data were processed by the land surface reflectance code (LaSRC) algorithm [43]. To confirm the growing season of vegetation and effectively avoid the impact of clouds, we screened the images from May to October and used the respective quality assessment (QA) band to remove clouds and their shadows. Then, we applied the coordination regression coefficients to minimize the differences in the multi-sensors [44]. To mask out the non-forest areas from our images, we selected the closest available dates from the CLCD, specifically 1985 and 2021, to represent the maximum union of the forest boundary. We also extracted the median values of each spectral band for every pixel, thereby creating a 36-year annual stack of median imagery.

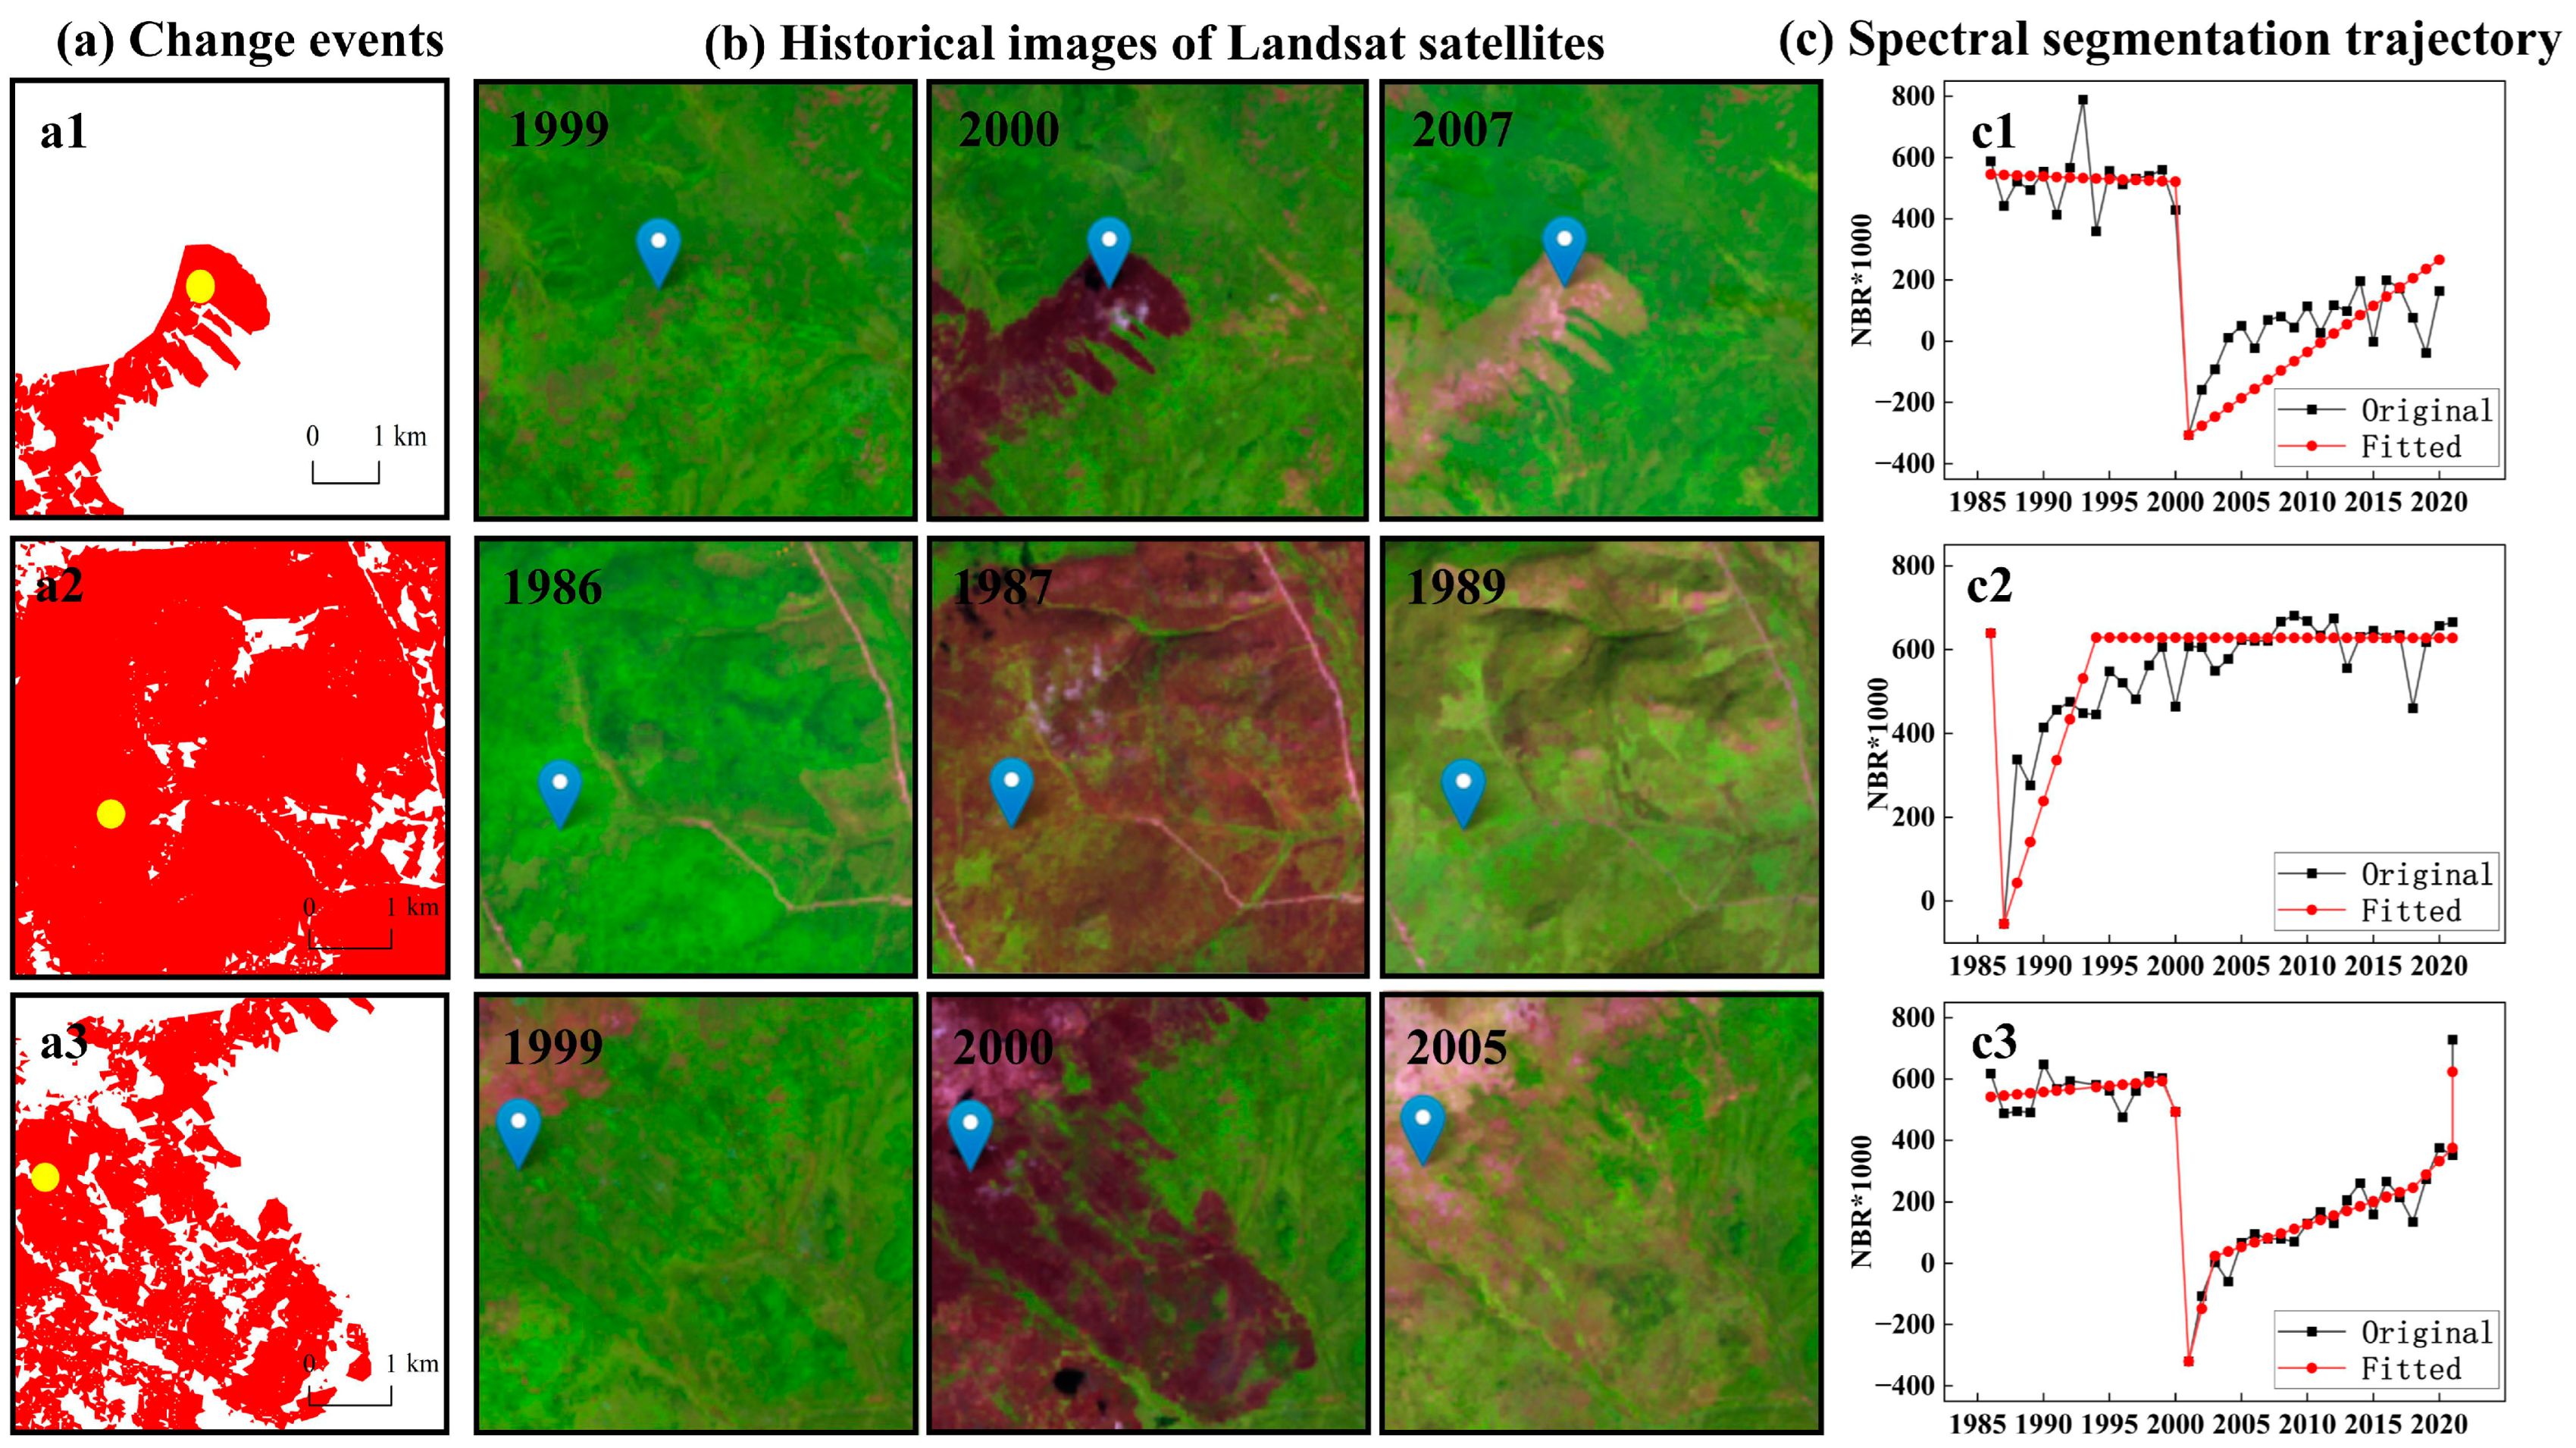
2.3.2. LandTrendr Algorithm and Parameter Settings

LandTrendr spectral–temporal segmentation algorithm is a pixel-based change detection method that can be used to identify disturbed and restored events and to capture changeable trends from the annual Landsat time series [17]. This algorithm consists of five main steps: (1) removing spikes, (2) identifying potential vertices, (3) fitting trajectories, (4) simplifying models, and (5) determining the best model [17]. Based on the GEE platform, we selected a multispectral ensemble with a relatively lower overall error to monitor forest dynamics, including NBR, green band reflectance (B2), shortwave infrared band 1 (B5), and the Tasseled-cap components (TCG, TCB, and TCW) [45]. We want to effectively identify recurring disturbed and restored events within extended periods while mitigating the adverse effects of excessive noise and disturbed signals in long-term forest dynamics [41]. To achieve this, we employed spans of five or six years as temporal windows and subdivided the study period into six intervals. We constructed a total set of 36 annual median time series stacks (i.e., 6 spectral indices × 6 temporal windows) and used the same parameter values as Cohen et al. [45]. To extract change locations more comprehensively, we labeled any segment with a non-zero slope in the direction of disturbance or recovery as a “change event”.

2.3.3. RF Classifier and Implementation

The derived trajectories contained several metrics, including the detected year (Yod), magnitude (Mag), duration (Dur), previous values (Preval), and the disturbance signal-to-noise ratio (Dsnr) [3]. We used RF as a secondary model to correct for events detected by LandTrendr. RF was then able to integrate multiple trees into one strong classifier for prediction or regression through the idea of integration learning [46,47]. We selected the Mag, Dur, Preval, and Dsnr metrics as characteristics of the RF classifier and built separate RF models for each time window. The training and validation samples were generated from TimeSync-Plus, a desktop application modeled after the original TimeSync tool [48] and NFI data. We utilized TimeSync-Plus, combined with Landsat image chips, spectral trajectories, and current high-resolution imagery, to record change events. We first used a stratified sampling design to select 996 sample points of which 154 samples were discarded due to bad image quality. Finally, 842 samples were obtained from annual image tile sets, including 197 samples that represented persistent forests, 303 samples that represented forest disturbance, and 342 samples that represented forest recovery. Additionally, we obtained 78 disturbed samples and 60 restored samples from 2016 to 2021 based on the NFI data. It is worth noting that we selected only 197 stable samples mainly because a portion of these samples remained unchanged over the entire study period, making them available for all of the time windows. For these samples in each time window, we only recorded the type of change (i.e., stability, disturbance, or recovery) without specifying the year it occurred. For each RF model, 80% of the samples were used to train the multiple classifiers, with the rest used for cross-validation. All the results were output based on 500 decision trees.

2.3.4. Year Assignment and Accuracy Assessment

Our ensemble approach generated a forest disturbance and recovery data product from 1987 to 2021 but did not record information about the changeable year. To assign a specific year to each patch, we collected the Yod and Dsnr values of bands and spectral indices. This study assumed that the count of the same disturbance year of each patch would be greater than or equal to half using the Yod value as the final year, or, conversely, using the Yod value with the highest Dsnr value as the changeable year.
To comprehensively assess the annual estimation of forest disturbance and recovery, we constructed a set of independent reference data labeled with year information using TimeSync-Plus. Specifically, we visually interpreted a total of 1020 samples (i.e., 30 points per year) within the study area from 1987 to 2021 and ensured a consistent number of stable, disturbed, and restored points per year. Annual information between the reference data and our final product was validated by constructing a confusion matrix and calculating assessment metrics including overall accuracy, commission error, and omission error [49].

2.4. Spatial Analysis of Forest Disturbance and Recovery Based on Multiple Factors

To quantify forest changes in different levels of burn severity caused by the mega-fire, we delimited the different burn severity zones and calculated the area variations from 1988 to 2021. We used Landsat-5 TM surface reflectance data from June to August 1986 and 1987 to extract different burn severity zones which we labeled mildly burned areas, moderately burned areas, and severely burned areas. We calculated the NBR index and used the median synthesis method to generate pre-fire and post-fire composite images. Then, we calculated the differential normalized burn ratio (dNBR) index and set appropriate thresholds (Table 2) for dNBR [50]. These thresholds were determined by referring to the “Compilation of Investigation Reports on the Restoration of Forest Resources and Ecological Environment in the Disaster Area of the Greater Khingan Mountains” [51]. We ensured a similar proportion of different burn severity zones. According to the aerial survey estimates provided in this report, the proportion of mildly burned areas, moderately burned areas, and severely burned areas in this fire was close to 36:24:40. In addition, based on the DEM and OSM data, we extracted information on elevation, slope, roads, and settlements, and created several buffer zones to demonstrate the quantities and distributions of forest disturbance and recovery.

3. Results

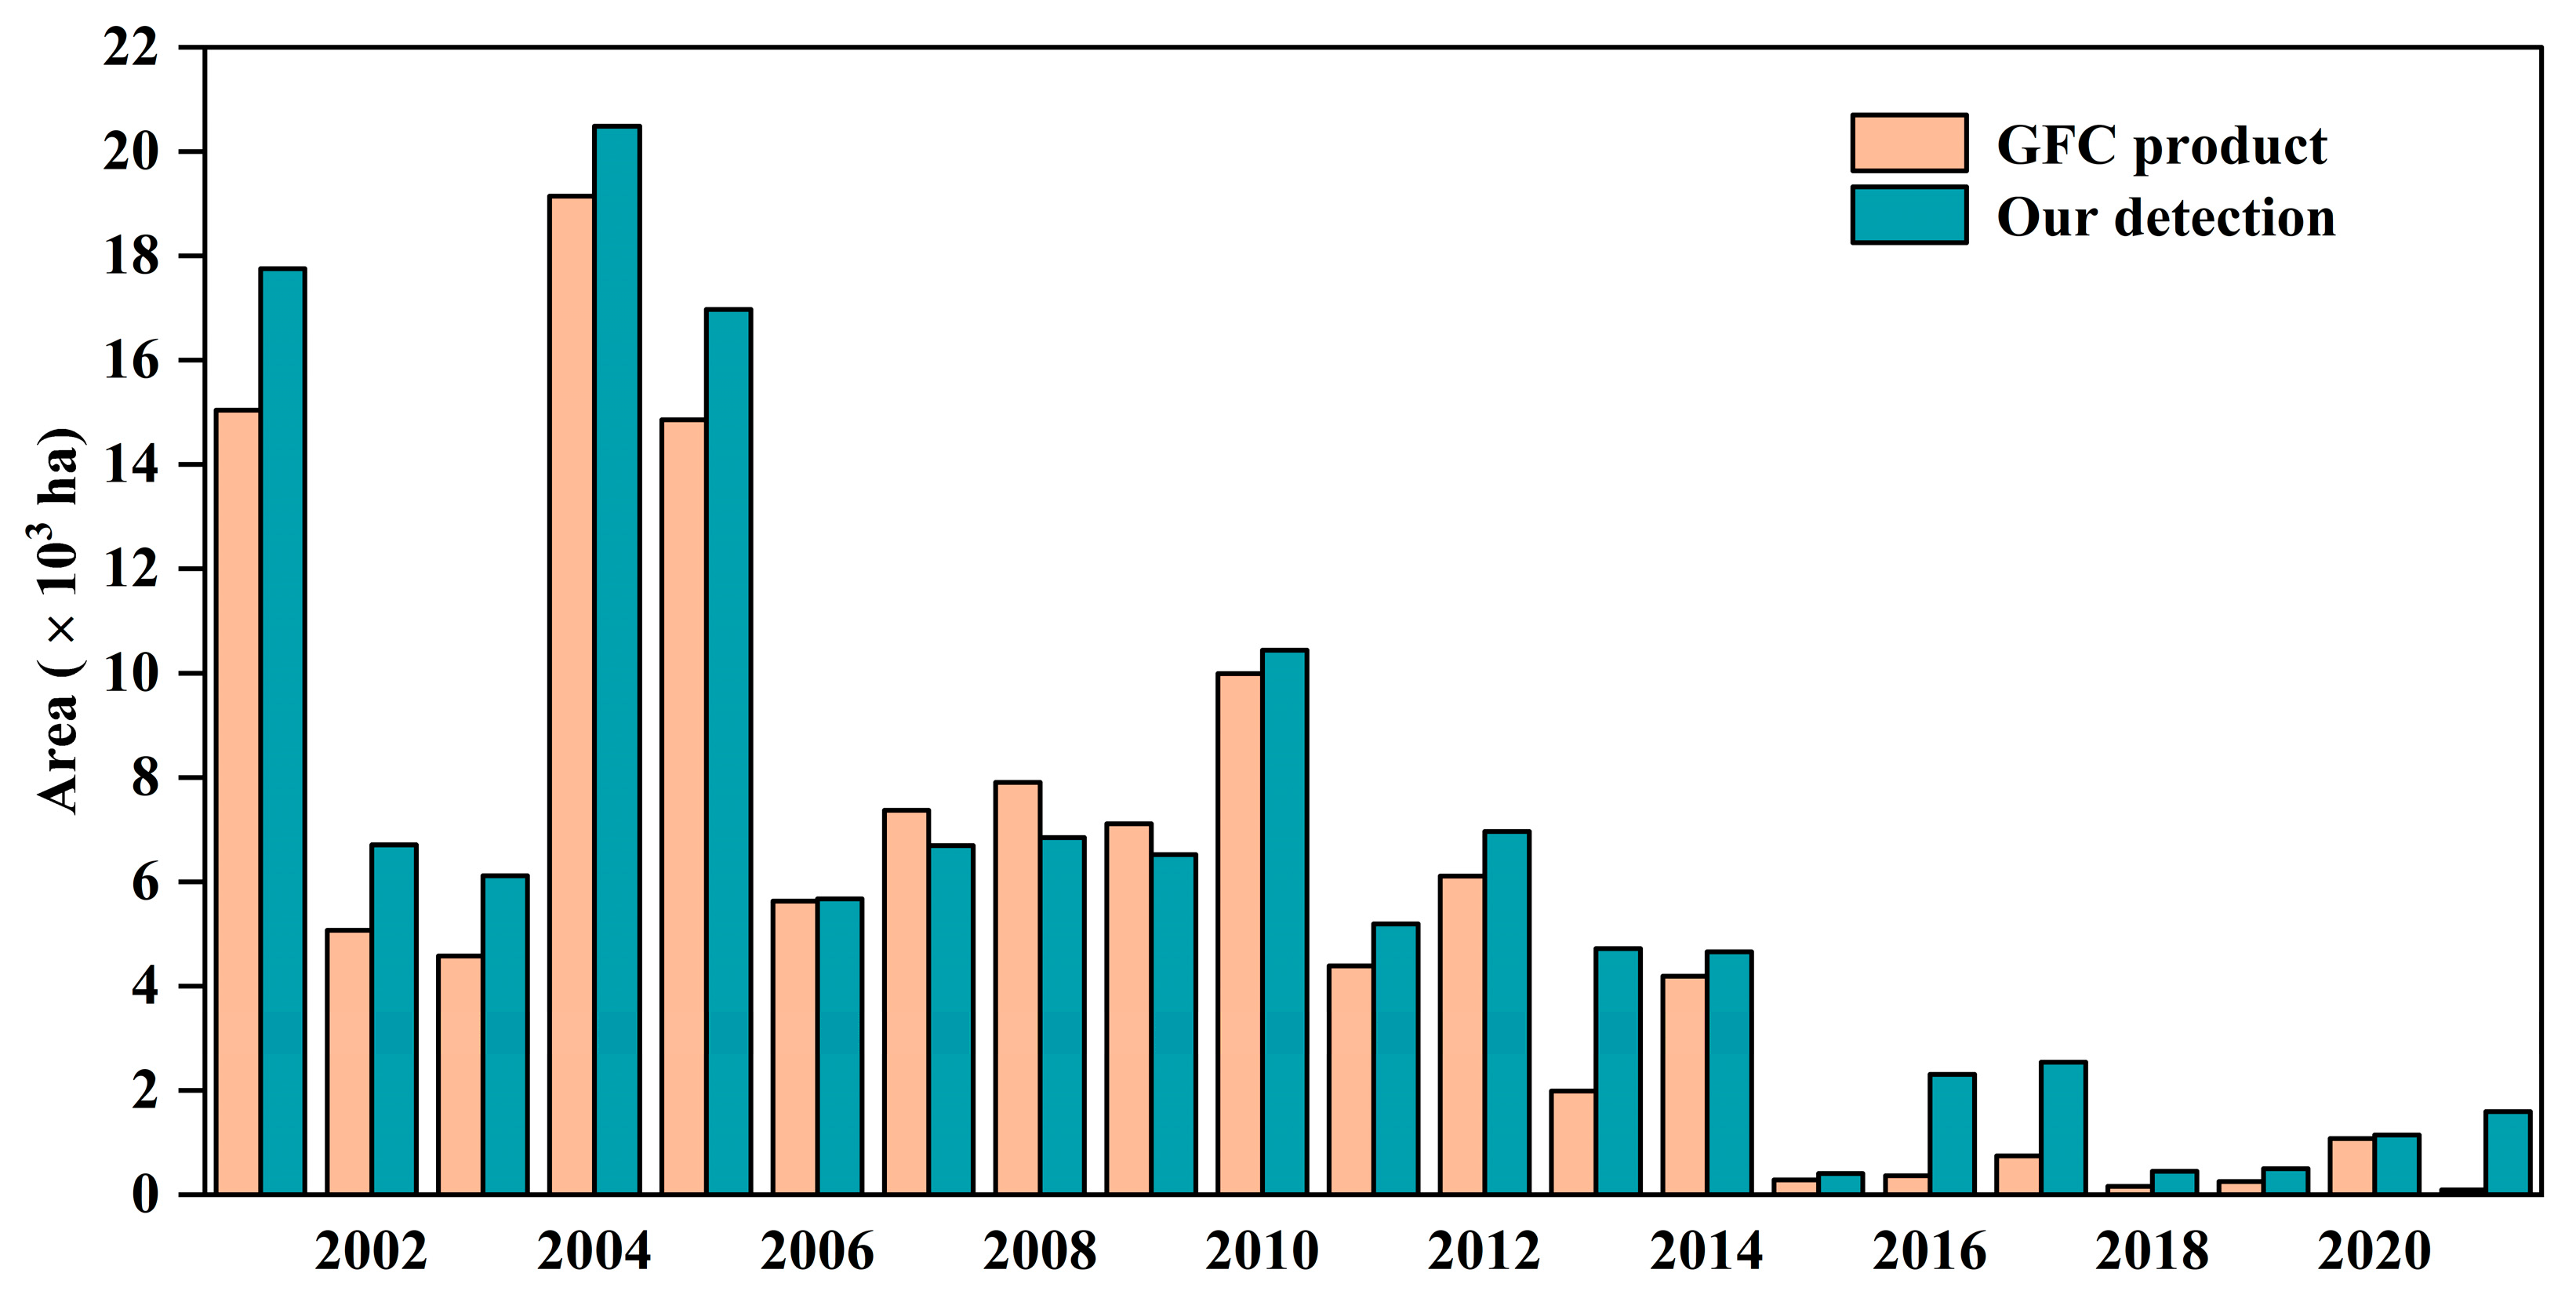
3.1. Accuracy Assessment

This study evaluated the accuracy of each classification model based on the confusion matrix method (Table 3). These models exhibited robust performance in secondary classification with low commission and omission errors. The average accuracy of the models for disturbances and the models for recovery were 0.88 and 0.85, respectively. The lower detection accuracy of restored events compared to disturbed events can be attributed to the insignificant spectral differences between some restored samples and stable samples. Nevertheless, it is worth noting that despite this difference, the overall accuracy of each model remained above 0.80.
The validation of our ultimate product of forest changes demonstrated an overall accuracy of 0.86. The overall accuracy of disturbed events was 0.87, with omission and commission errors of 0.15 and 0.10, respectively. Similarly, the overall accuracy of restored events was 0.86, with omission error and commission error of 0.16 and 0.18, respectively. We also selected three typical sample regions to show the forest dynamics, revealing that our detected results closely matched the disturbed boundary of the Landsat images (Figure 3). The historical images of Landsat satellites clearly showed when disturbance and recovery occurred; the image changes were coincident with the NBR time series curves fitted by the LandTrendr algorithm. When disturbance occurred, the values of the NBR index decreased significantly and then showed gradually increasing trends, indicating that the forest pixels were slowly recovering.

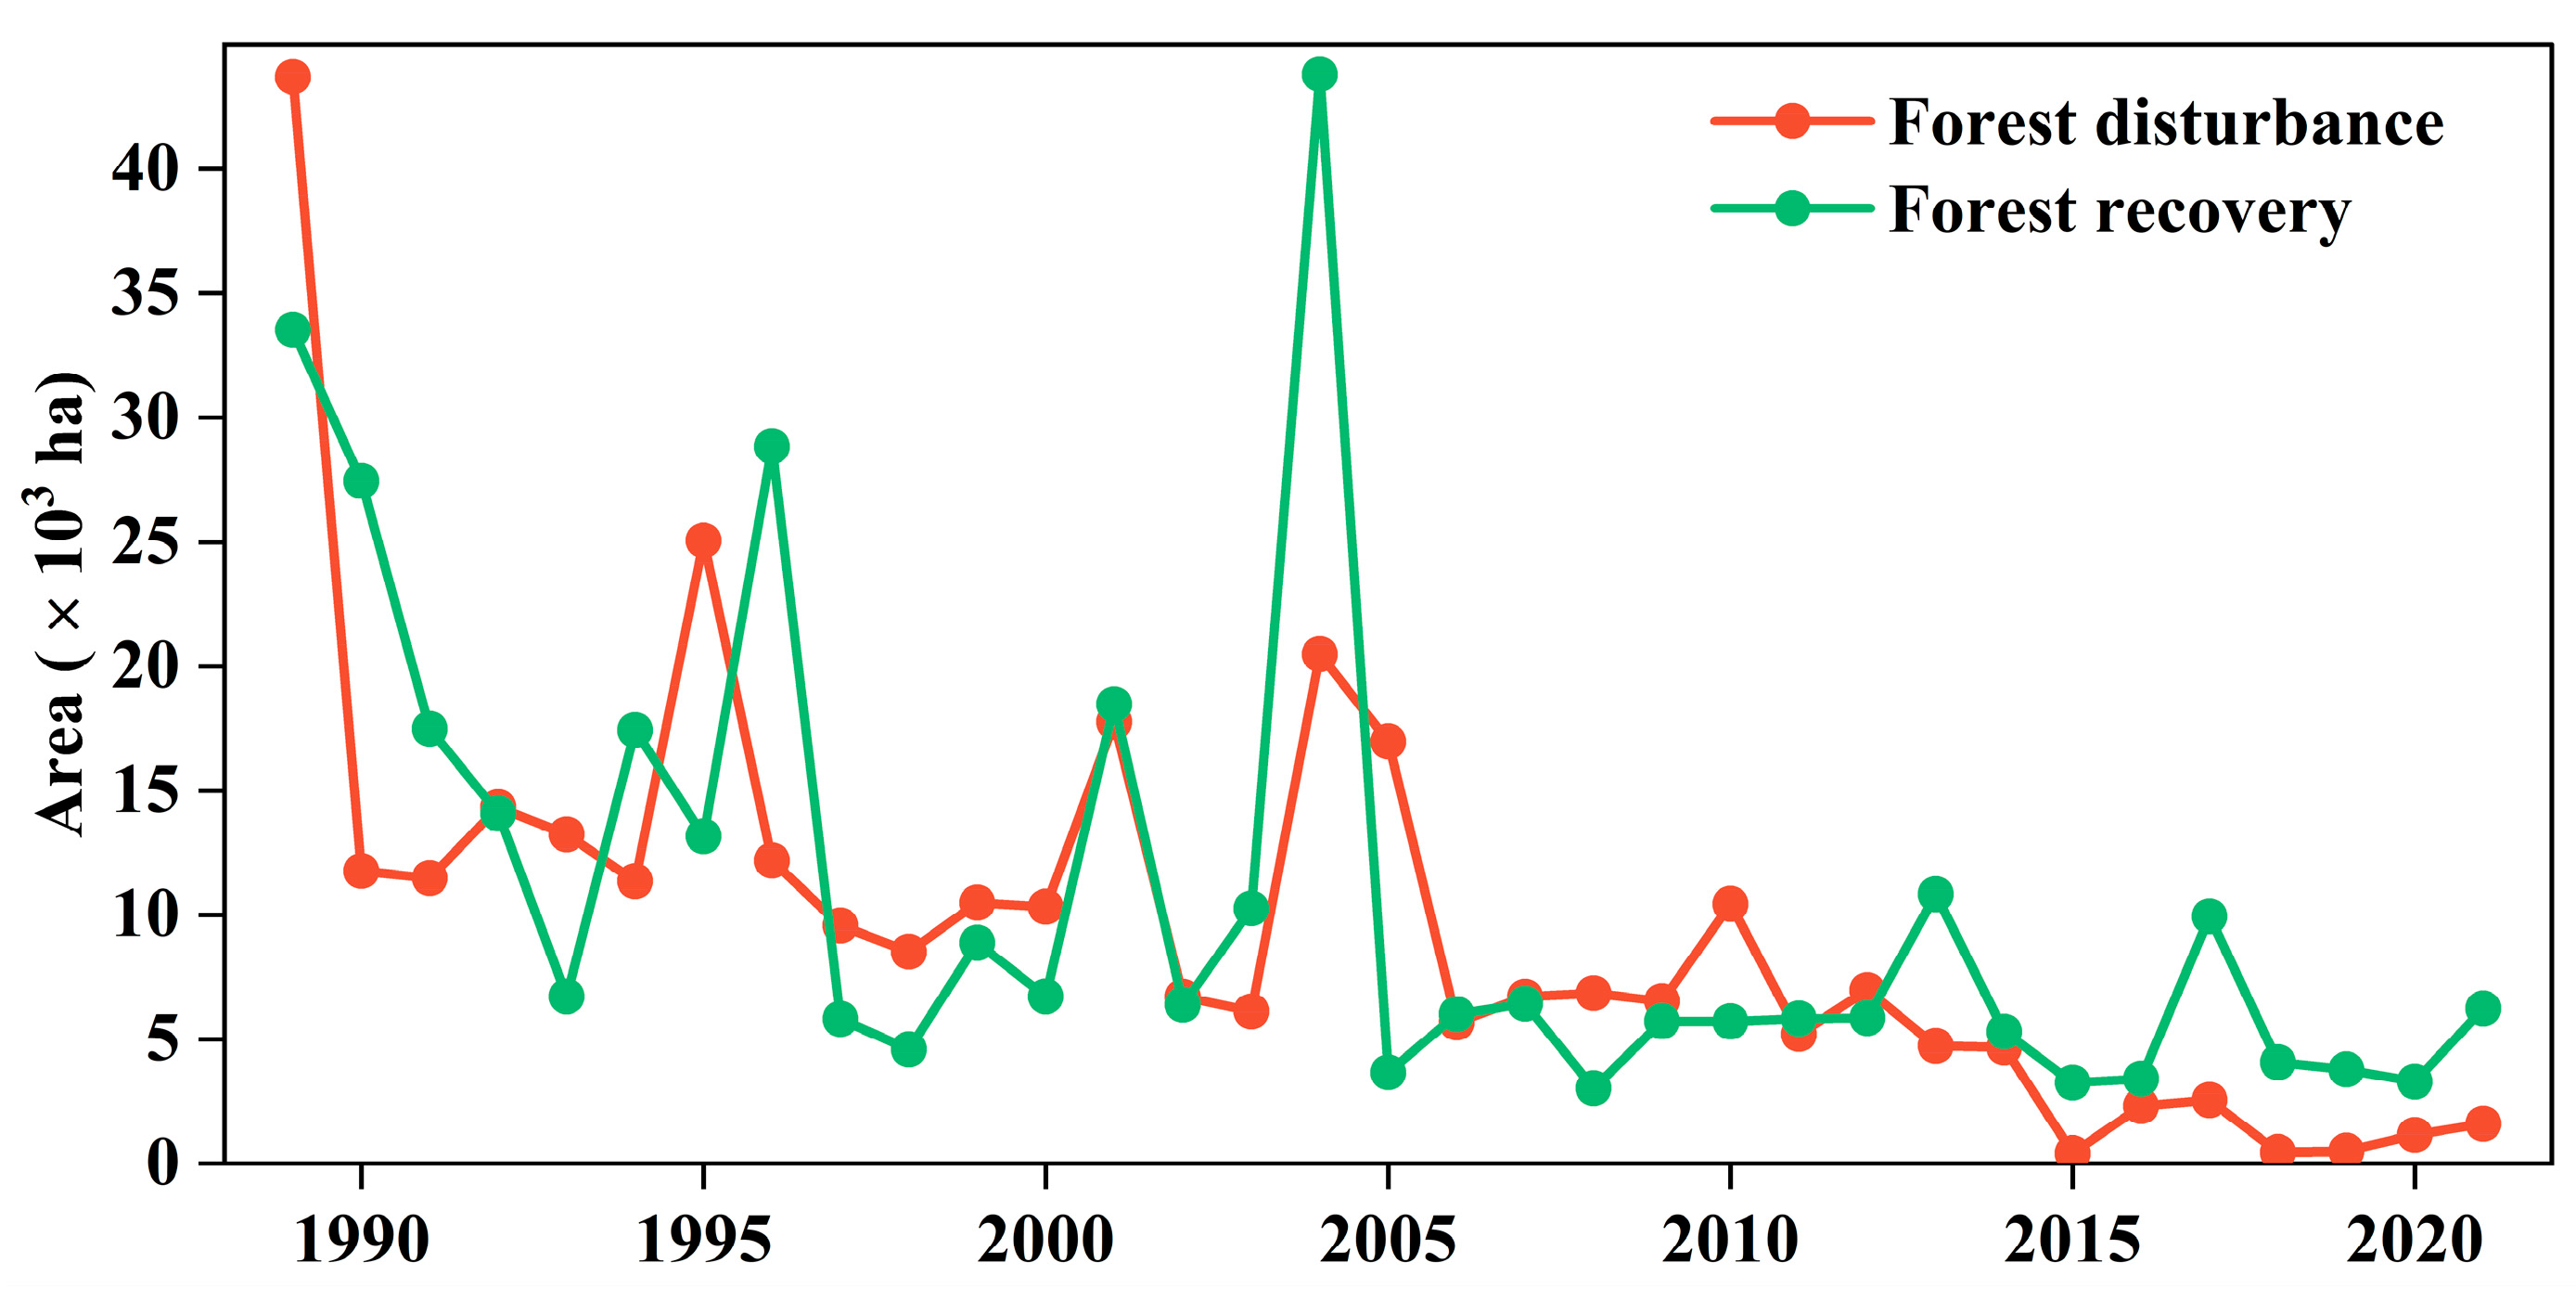
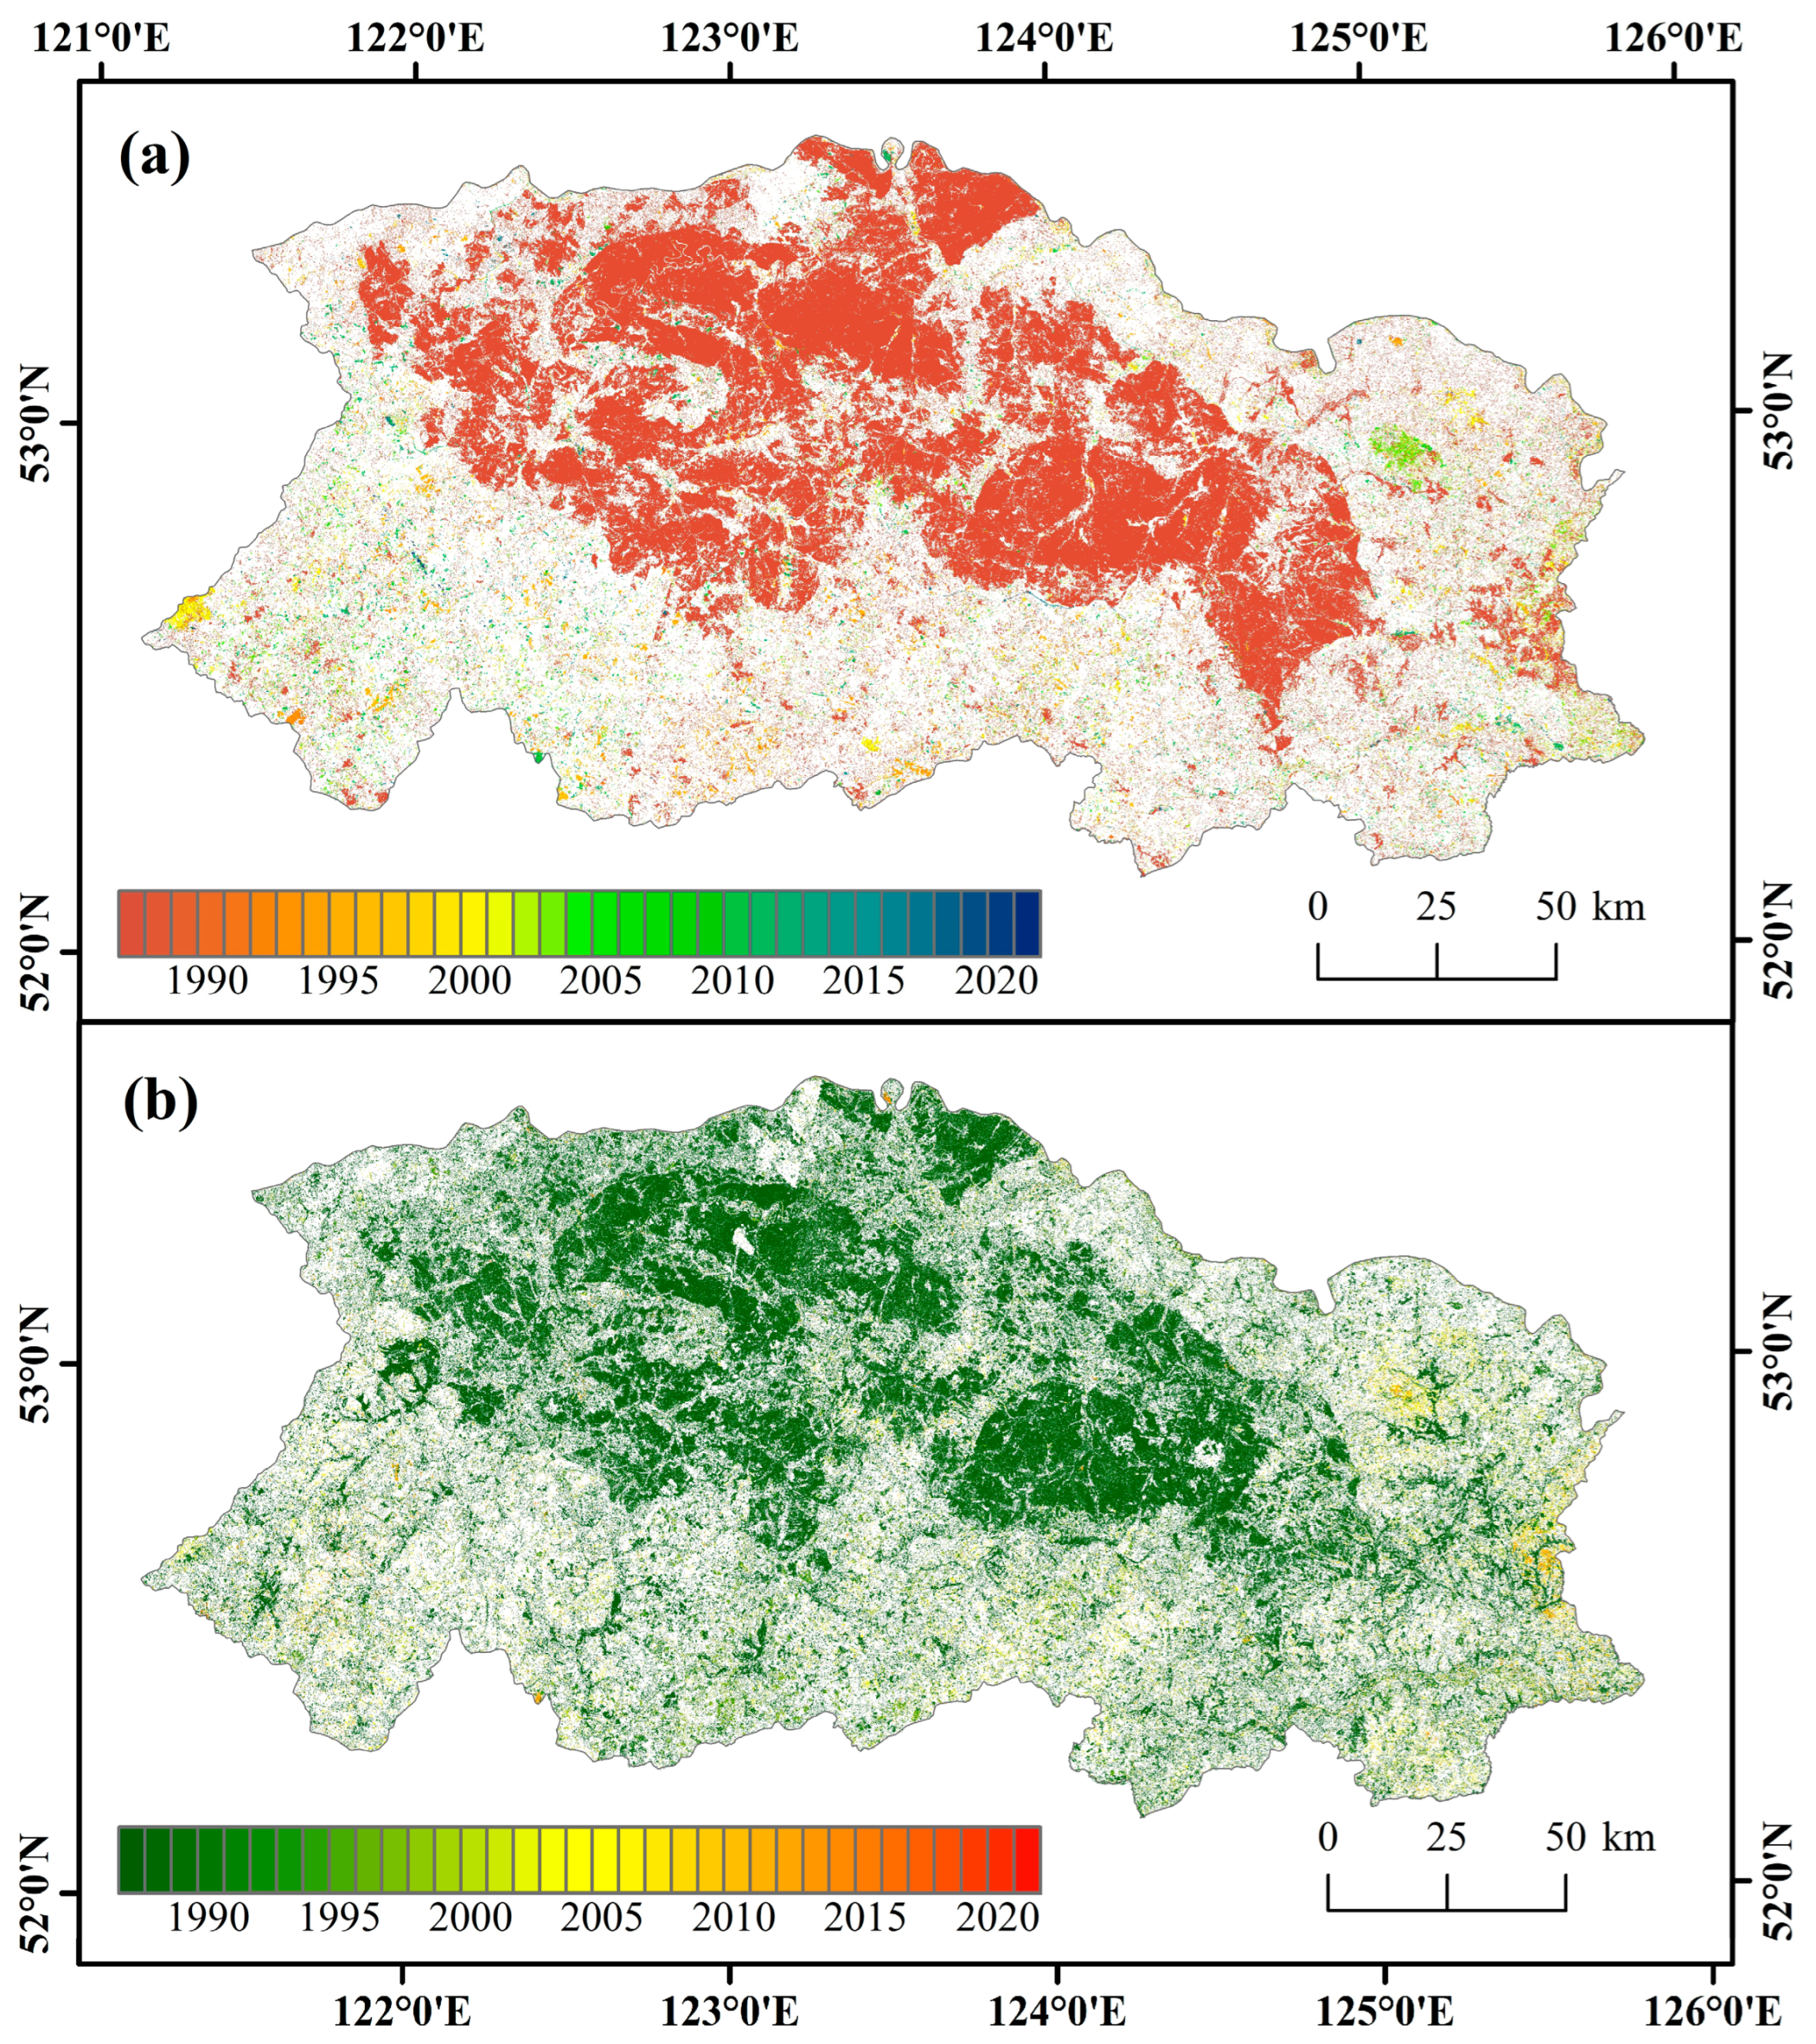
3.2. Historical Reconstruction of Forest Disturbance and Recovery

The disturbed area reached 1.38 × 10⁶ ha from 1987 to 2021. The majority of disturbances occurred in 1987. During that year, the disturbed area encompassed 1.04 × 10⁶ ha of space, accounting for approximately 75.40% of the total disturbed area. For context, the disturbed area in 1988 was only 2.34 × 10⁴ ha. From 1989 to 2010, the disturbed area was relatively large, with an average annual area of 1.30 × 10⁴ ha (Figure 4). After 2010, the disturbed area decreased notably and the annual area was less than 0.30 × 10⁴ ha. The area of forest recovery reached approximately 1.43 × 10⁶ ha from 1987 to 2021. In 1987, the restored area was the largest, 0.75 × 10⁶ ha, contributing to approximately 52.27% of the cumulatively restored area. In 1988, the restored area was 0.33 × 10⁶ ha, accounting for 22.84%. The inter-annual variation of forest recovery from 1989 to 2021 showed a fluctuating trend. The areas in 1989, 1990, 1996, and 2004 all exceeded 2.50 × 10⁴ ha (Figure 4). In 2008, the restored area was the smallest, at only 0.30 × 10⁴ ha.
Over the 35-year time period, disturbed events occurred frequently, with more in the north and less in the south (Figure 5a). Overall, large disturbance patches were highly clustered in the middle of our study area, mainly due to the mega-fire. The areas closer to the boundary had smaller and more widely distributed patches. The spatial distribution characteristics of forest recovery were similar to those of forest disturbance (Figure 5b). Hot spots in restored areas were mainly concentrated in the center zones. The monitored regions between disturbance and recovery were also roughly similar, indicating that the disturbed areas had, to some extent, recovered in subsequent years.

3.3. Spatial Characteristics of Forest Disturbance and Recovery

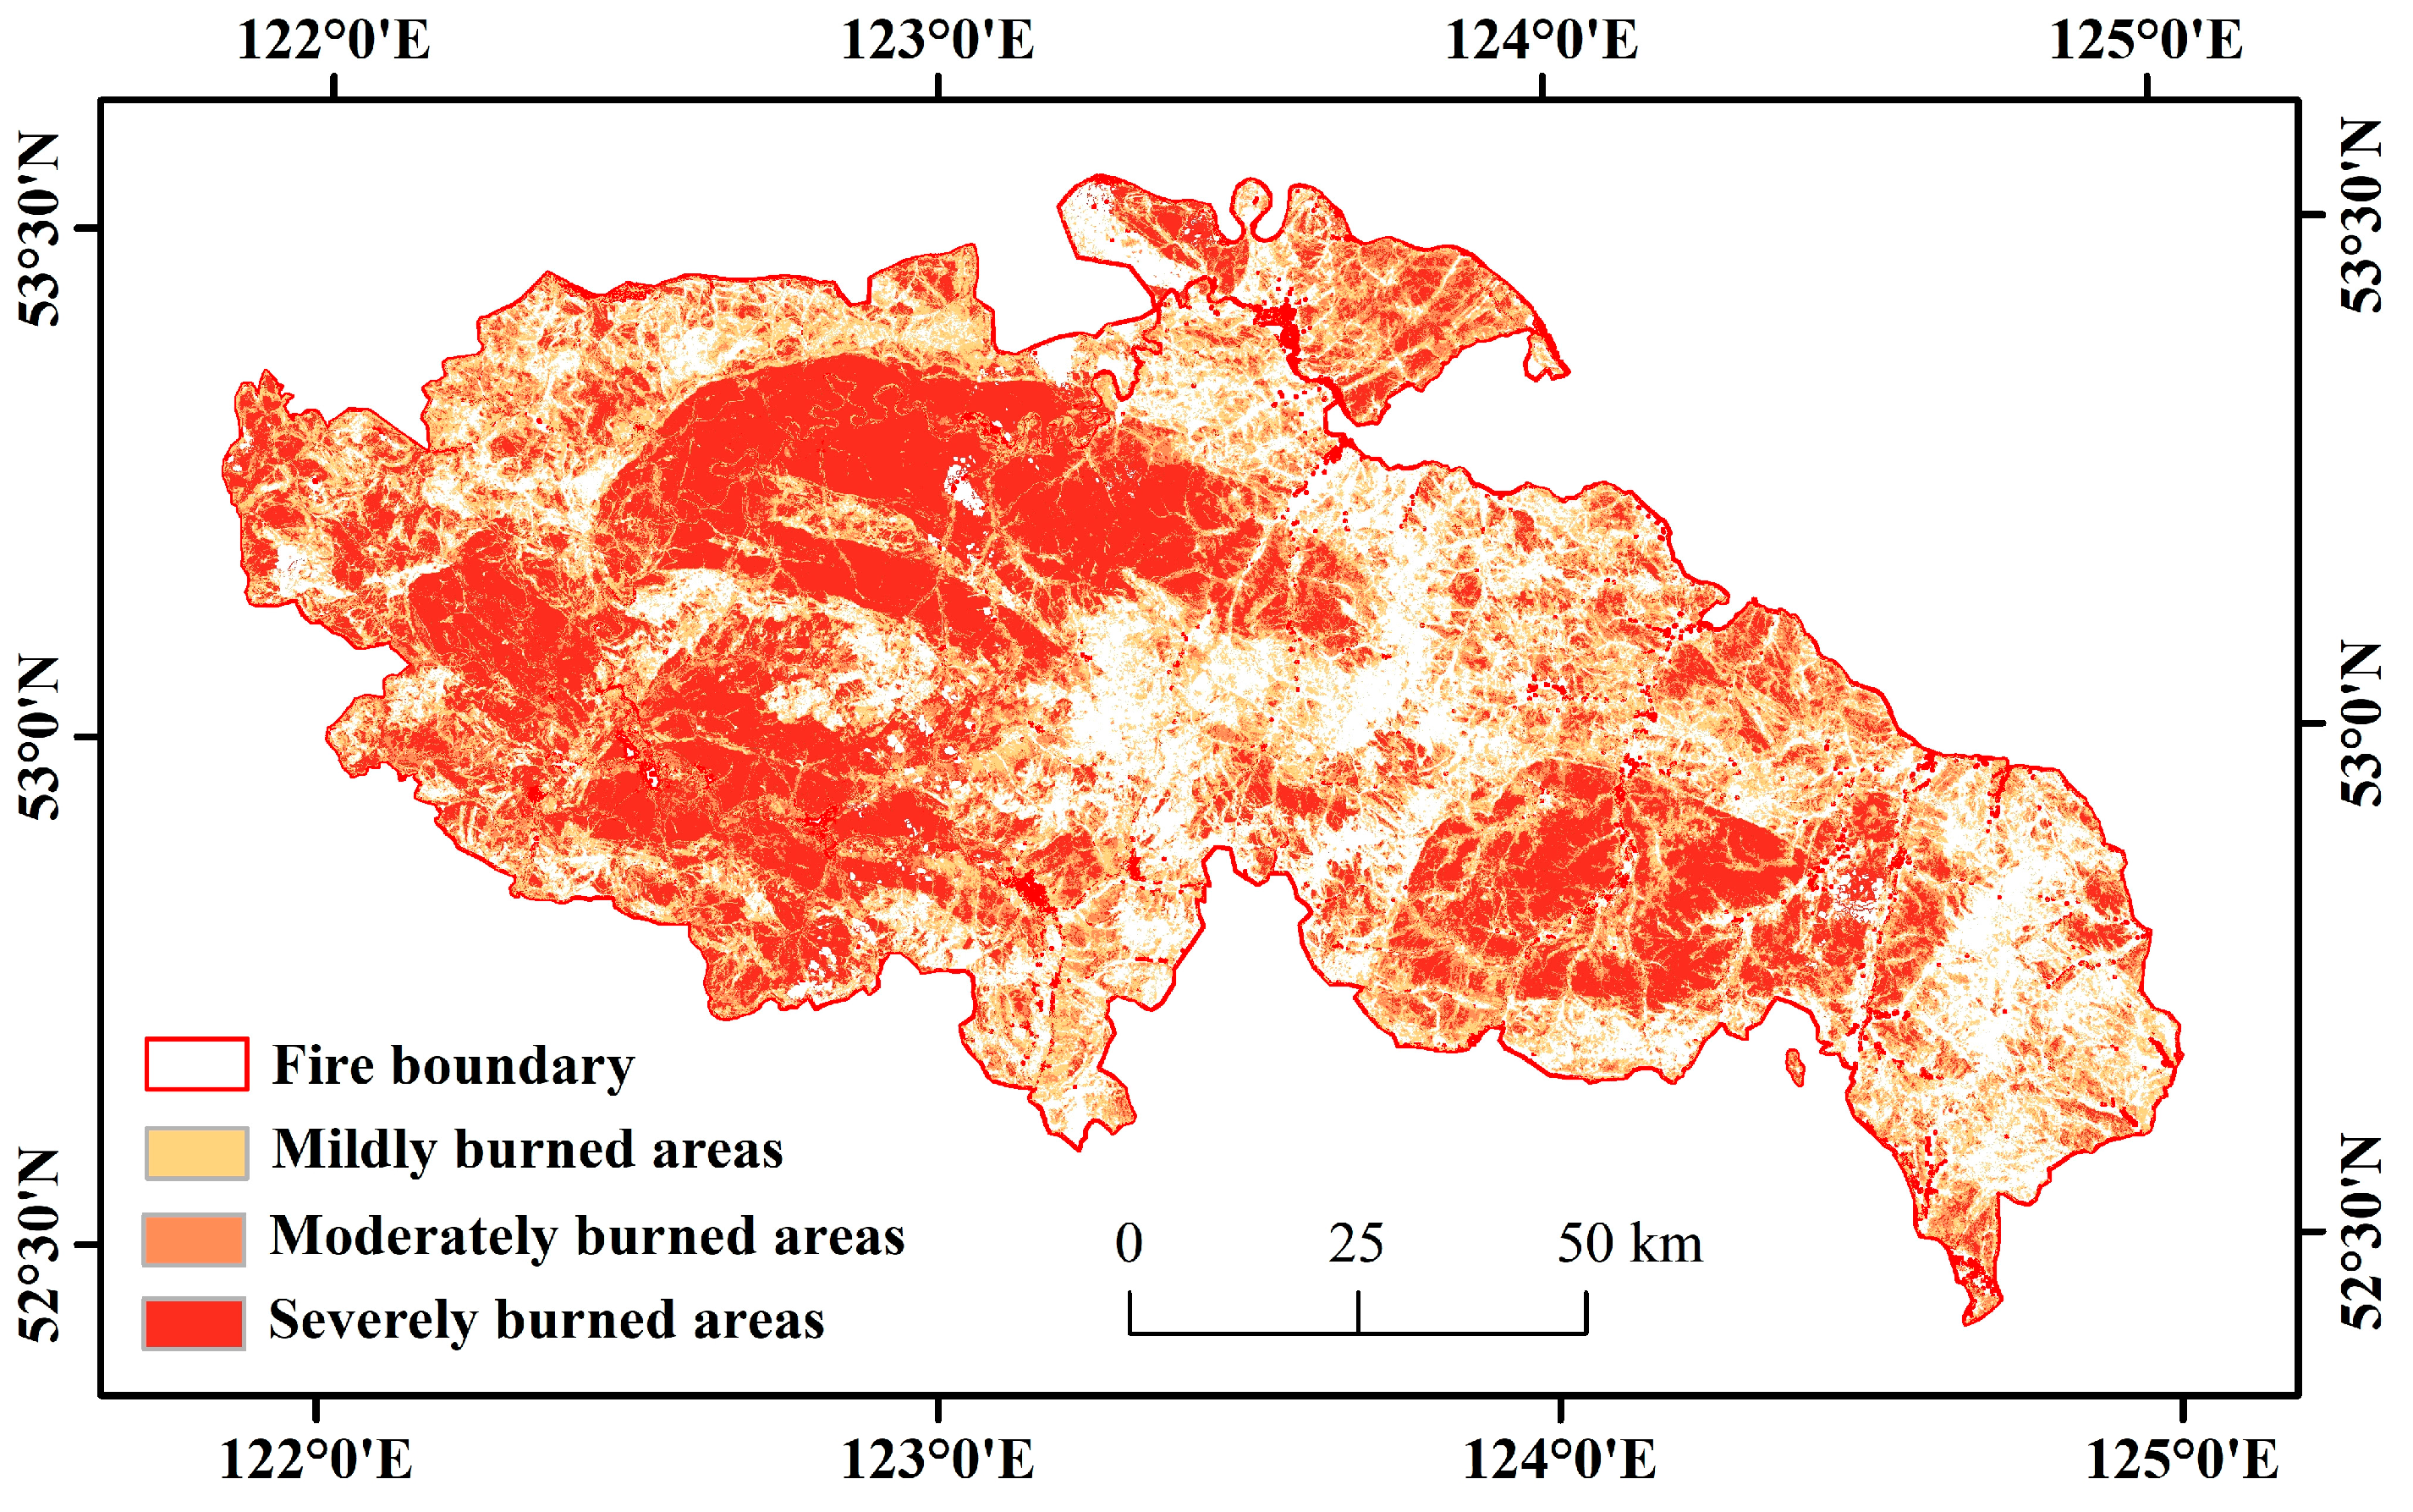
3.3.1. Forest Disturbance and Recovery Distribution across Varying Levels of Burn Severity

The spatial distribution of the forest regions burned in 1987 is shown in Figure 6, with a total area of 0.95 × 10⁶ ha. The mildly burned areas accounted for 35.61%, with an area of 0.34 × 10⁶ ha. The moderately burned areas accounted for 24.21%, reaching 0.23 × 10⁶ ha. Lastly, the severely burned areas accounted for 40.18%, with an area of 0.38 × 10⁶ ha. Based on the over-fired regions, we analyzed the relationship between the forest changes and different fire conditions from 1988 to 2021 (Table 4). Change events varied with burn severity. The disturbed area in mildly burned areas was the largest, followed by severely burned areas and moderately burned areas, with the proportions close to 0.51, 0.24, and 0.25, respectively. The restored area in the severely burned areas was the largest, followed by mildly burned areas and moderately burned areas, with proportions close to 0.45, 0.30, and 0.25, respectively.

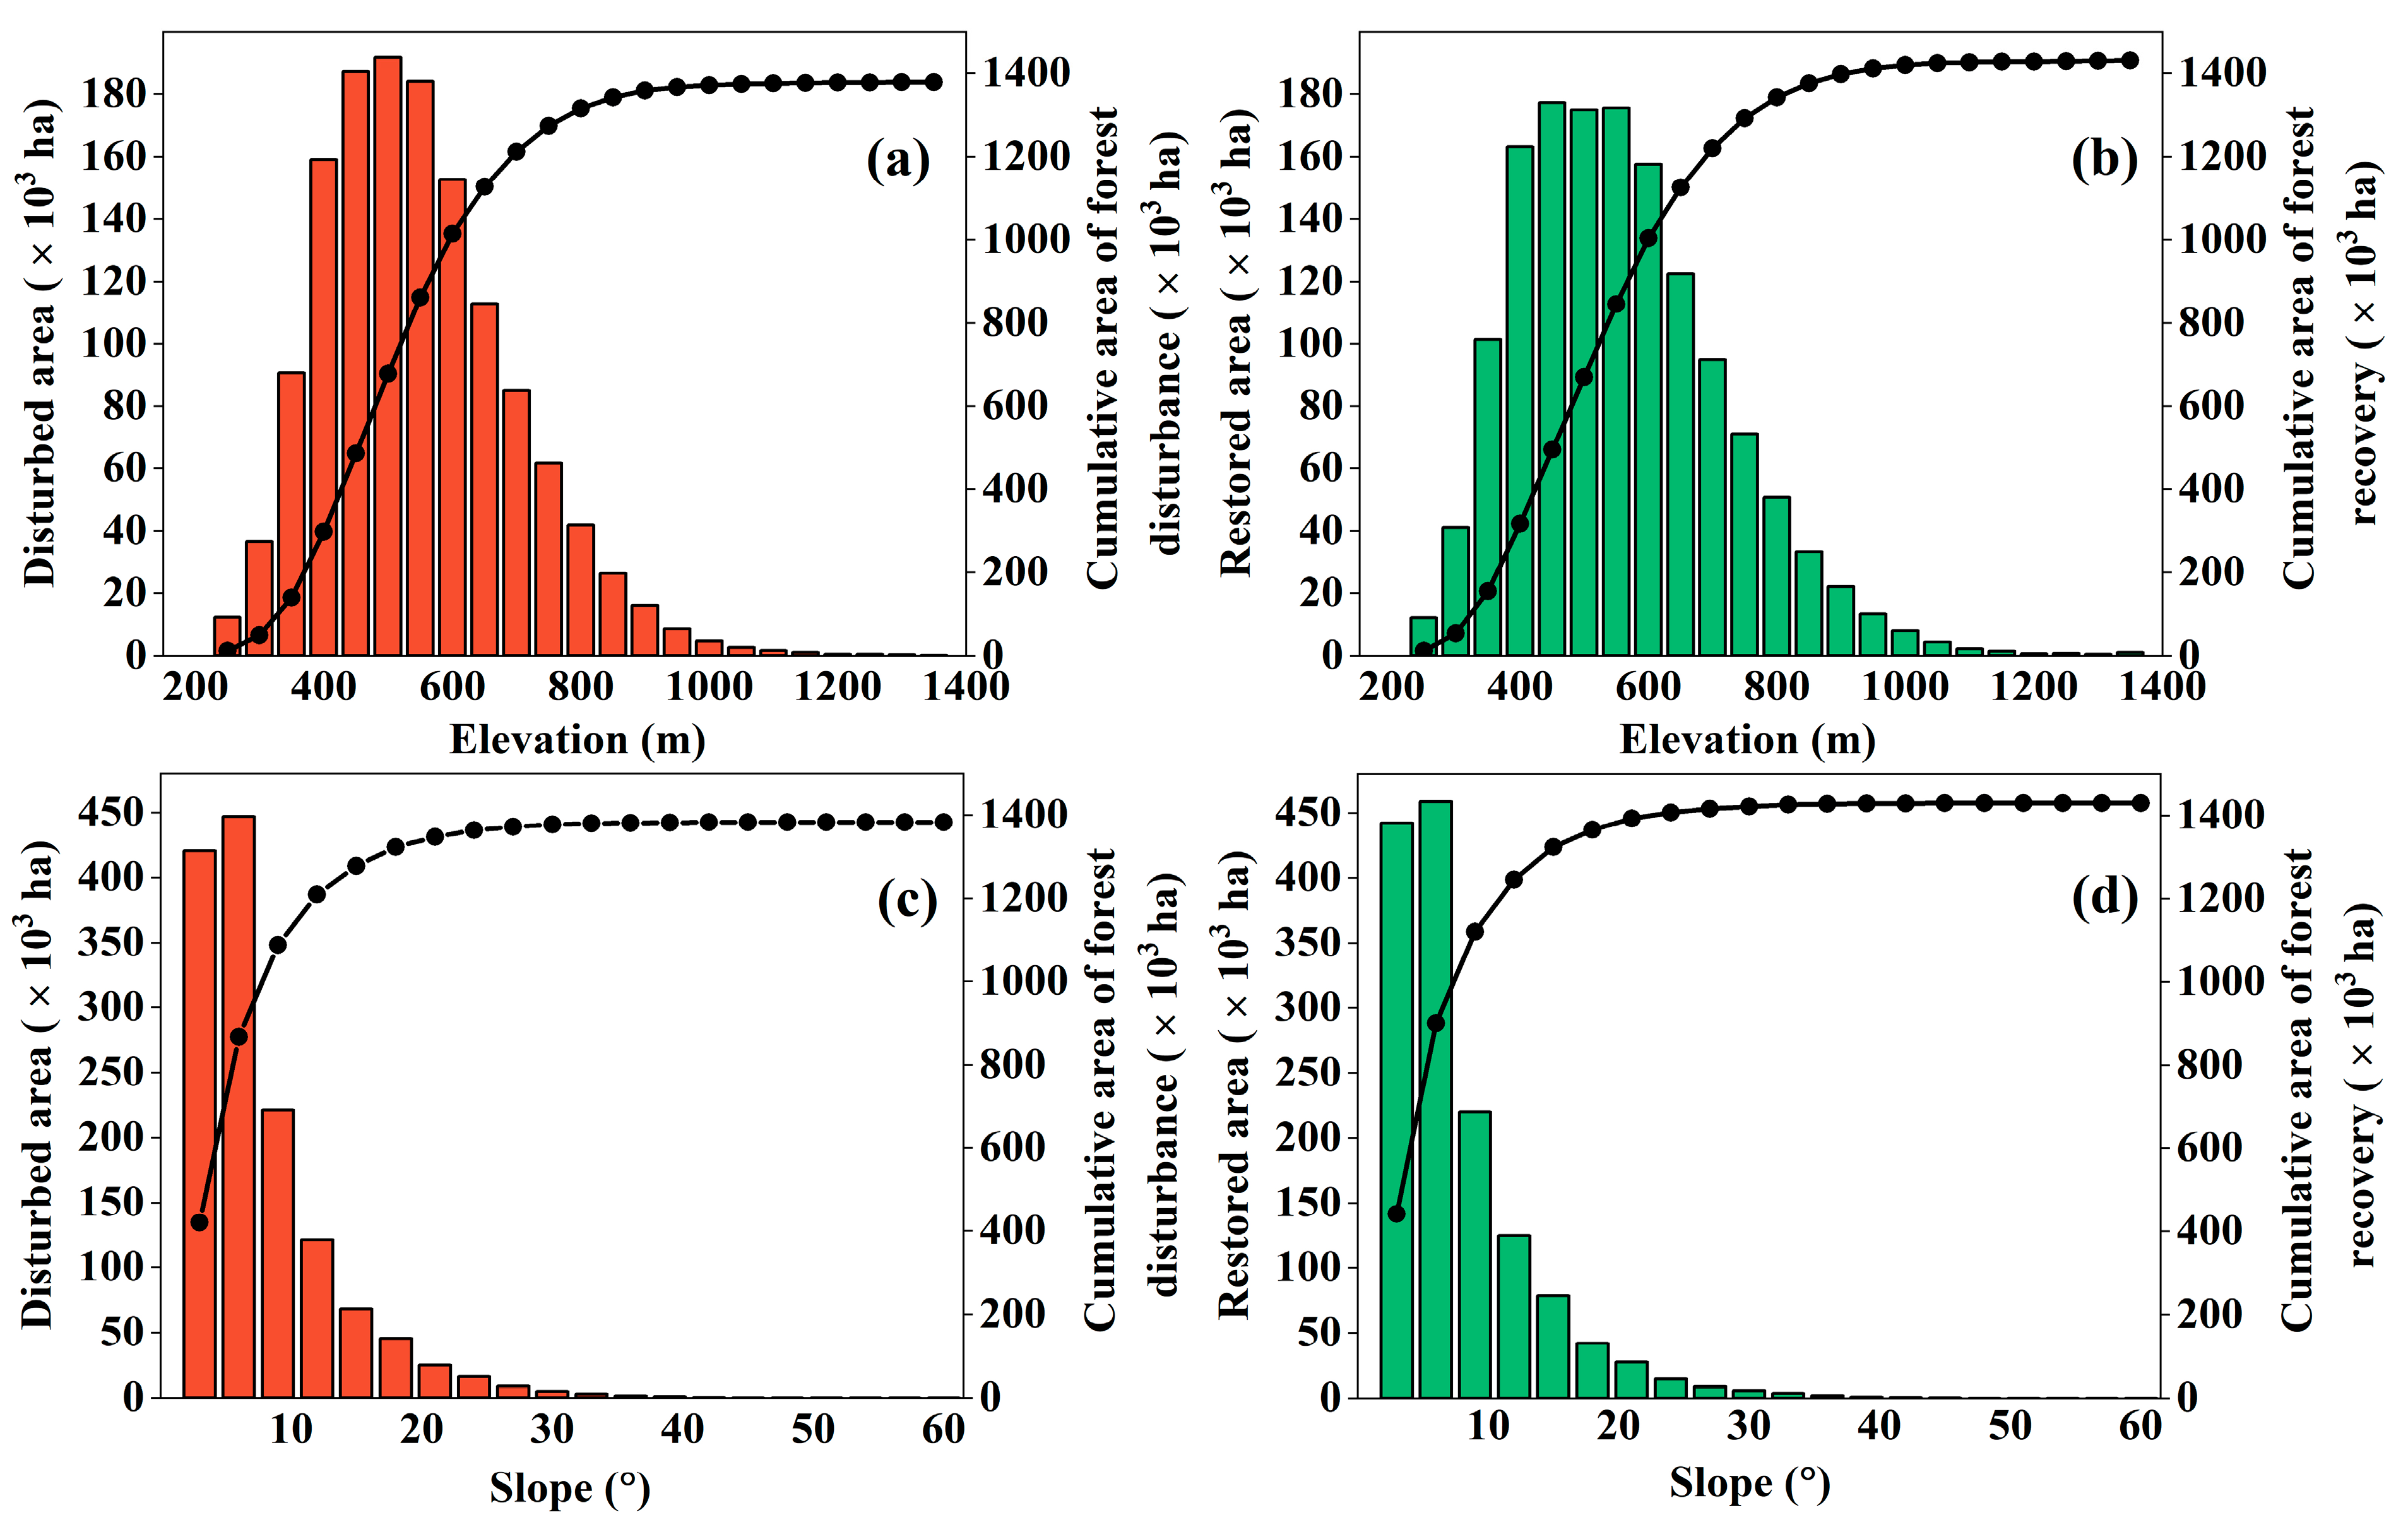
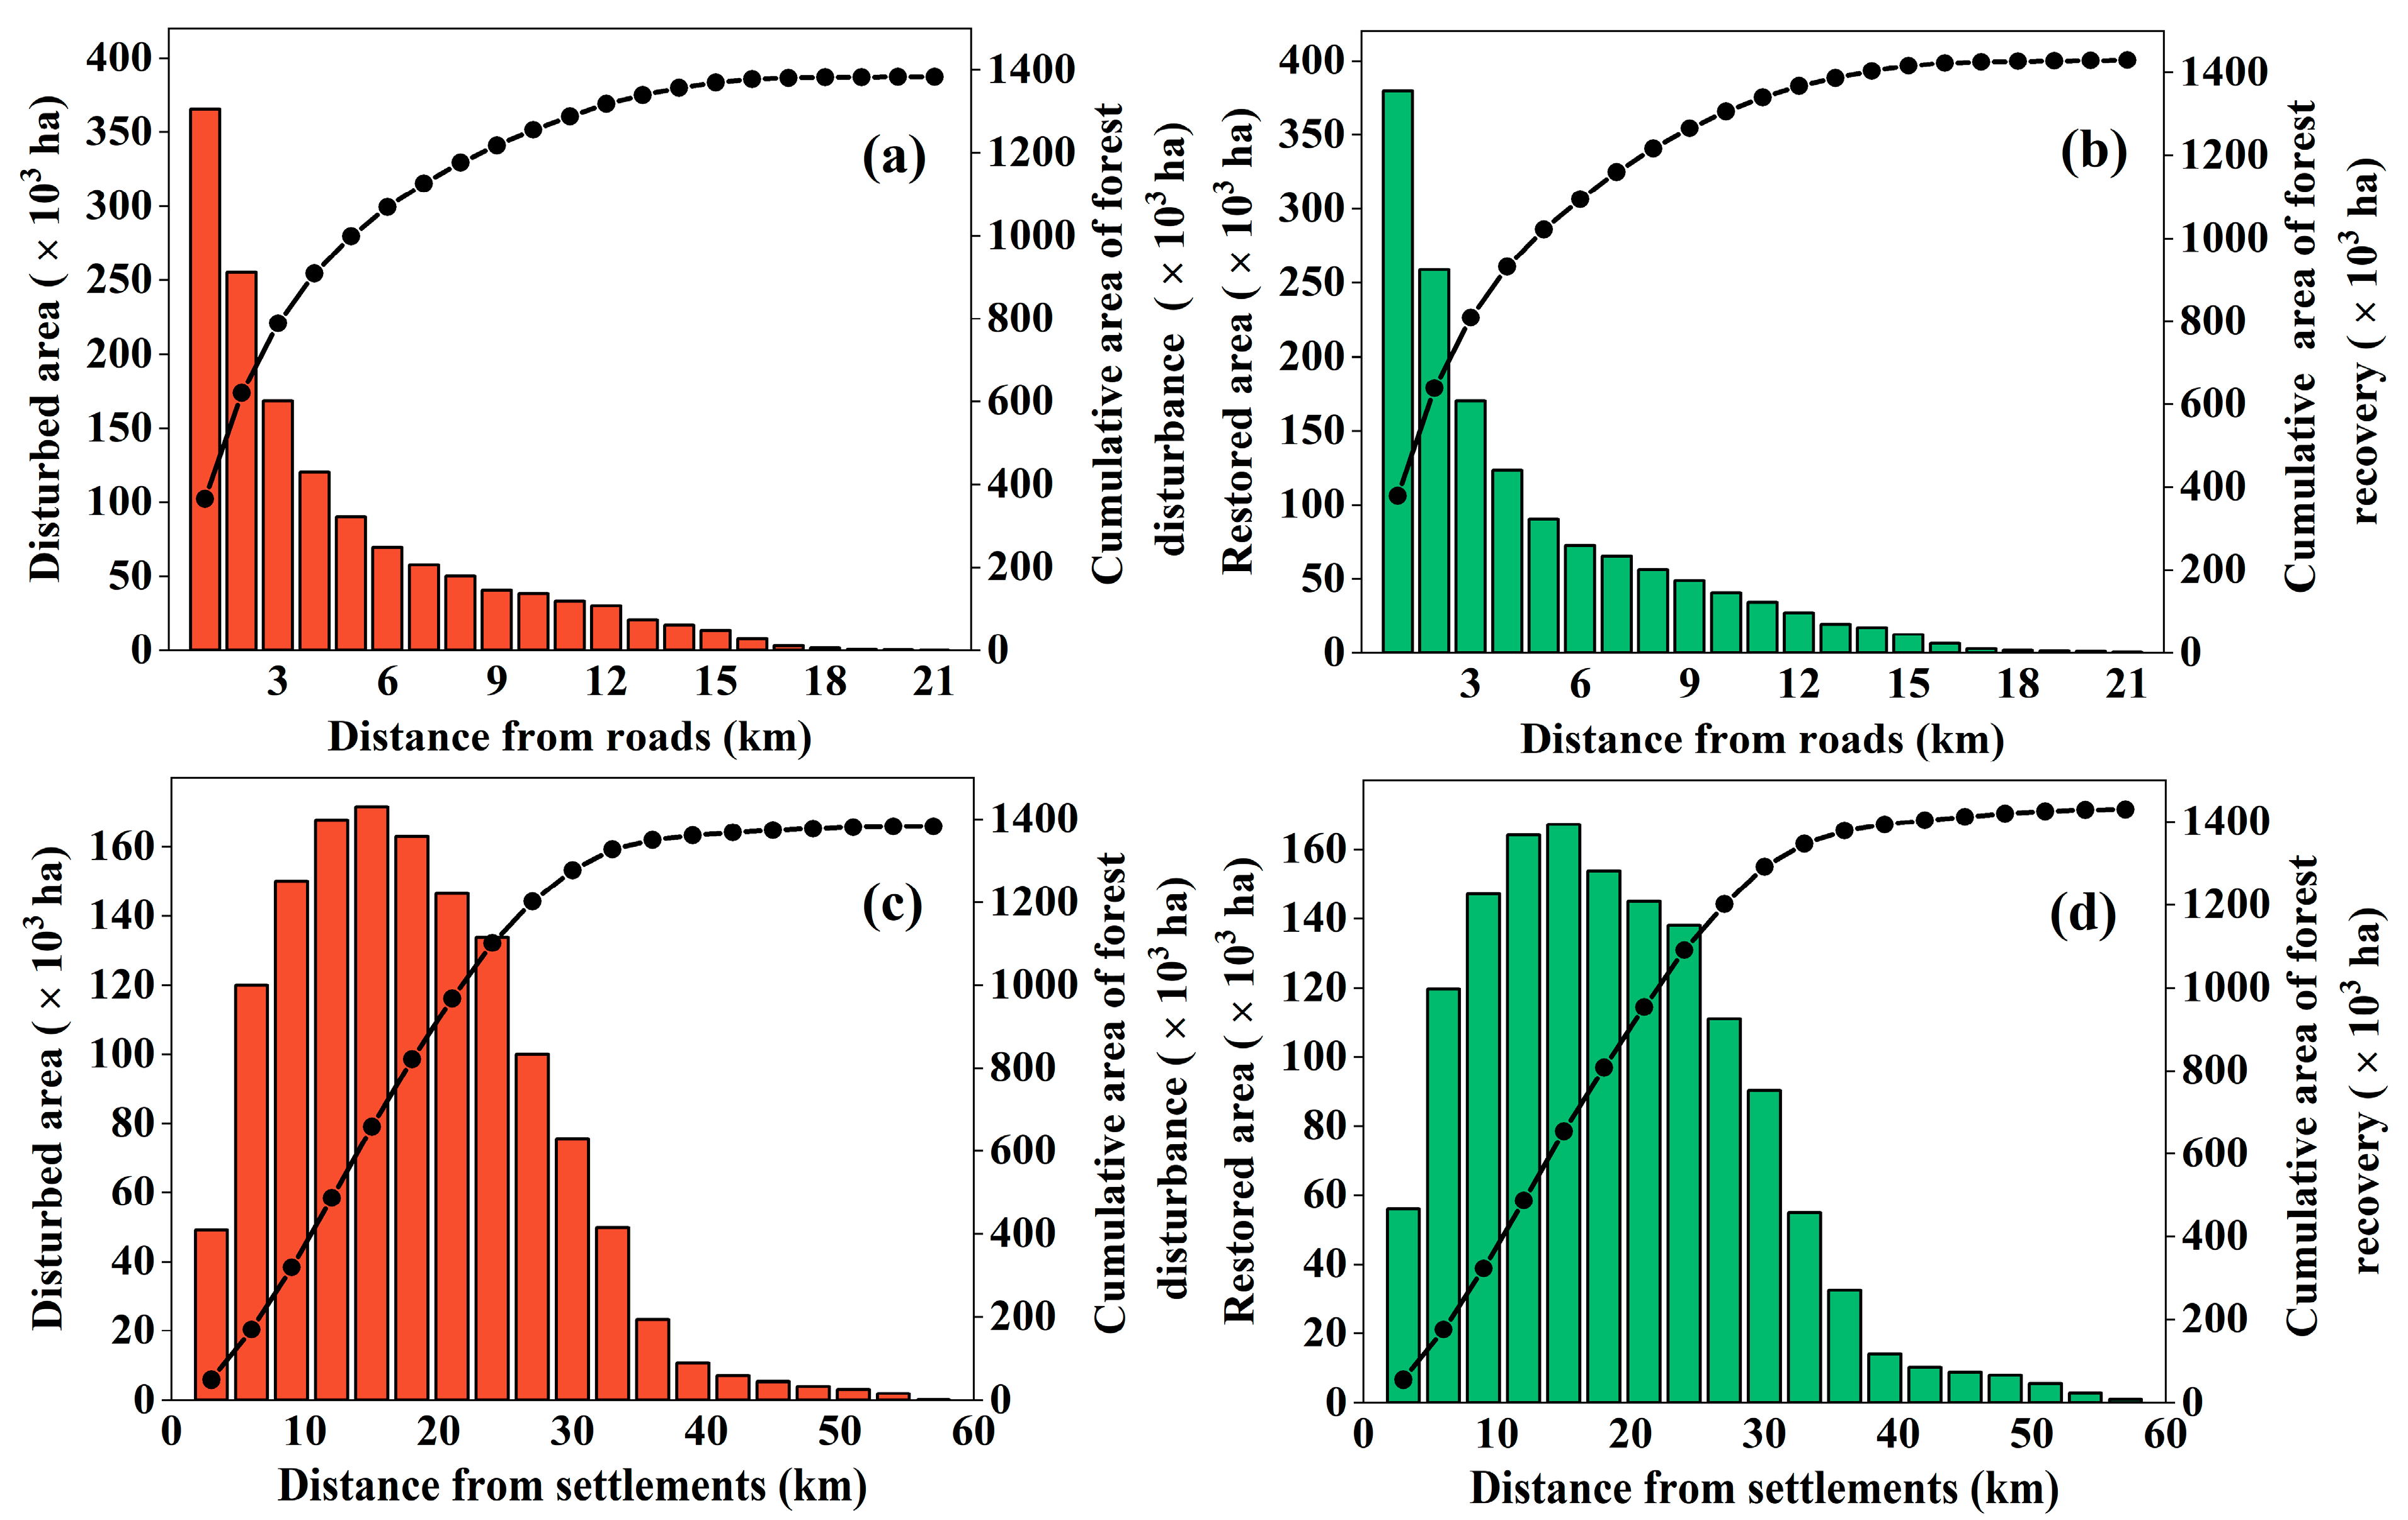
3.3.2. Spatial Variations in Forest Disturbance and Recovery across Distinct Topographic and Geographic Conditions

We analyzed the change area in different elevation and slope zones to understand the relationship between the change events and topographic factors. With increasing elevation, the area of forest disturbance and recovery first increased and then decreased, reaching its peak at elevations of 450–500 m (Figure 7a,b). Similarly, the change area increased rapidly with the increase in slope in the range of 0–6° (Figure 7c,d)). However, beyond 6°, the total area of disturbance and recovery decreased rapidly along the increasing slope gradient. Generally speaking, change events were rarely found in high elevations and steep slope zones, with over 75% of the area occurring at elevations of 400–650 m and slopes of less than 9°.
According to our resultant statistics, we found that the relationship between roads and the change area was monotonic, with the area disturbed or restored becoming progressively smaller as the distance from the road increased (Figure 8a,b). More than 75% of the change area occurred within 6 km of the road. Conversely, the area of forest disturbance and recovery exhibited an initial increase followed by a decrease with increasing distance, with more than 75% of the area occurring within 24 km of settlements (Figure 8c,d).

4. Discussion

4.1. Advantages and Reliability of the Proposed Approach

This study developed an improved method for change detection in forests through annual Landsat imagery on the GEE platform. It is the first fine-scale and long-term mapping of forest disturbance and recovery in the GKM. The successful application of this approach can be attributed to three factors, namely a dense Landsat archive, the high-quality samples, and the robust integrated detection. Firstly, the open-accessed Landsat imagery provides a valuable resource for continuously monitoring forest disturbance and recovery. While some high-resolution images are available, image availability and expensive cost limit their applicability to long-term monitoring. Landsat imagery, with 30 m resolution, is therefore the optimal choice for capturing long-term signal changes [49]. Secondly, we utilized sufficient and effective samples extracted from both Landsat image chips and high-resolution imagery. Compared with the conventional method of selecting samples based on HGFC data [36], we constructed a higher-quality sample database which contributed to improving the reliability and accuracy of secondary classification data. Thirdly, we enhanced the LandTrendr algorithm by utilizing a multispectral ensemble and multiple time windows to better detect subtle signals and identify different types of change signals [45,52]. Moreover, the separate classification models for each time window were developed to filter out various false positive signals, thereby reducing the probability of misclassification and thus increasing the robustness of our method [49]. Thanks to these, we were able to provide a promising and favorable approach to monitoring long-term forest dynamics and its implications are essential for policymakers and conservation practitioners working towards sustainable forest management.

4.2. Spatio-Temporal Patterns of Forest Disturbance and Recovery

Our study generated a dataset on the inter-annual temporal and spatial dynamics of forest disturbance and recovery in the GKM from 1987 to 2021. We discovered that the forests exhibited a recovery trend over the past 35 years, with a net increase in more than 4.72 × 10⁴ ha. In the GKM, disturbances were mainly concentrated from 1987 to 2010 and the area decreased significantly after 2010. This is in line with the findings from previous studies that forest disturbance rates in northeastern China exhibit a decreasing trend [53]. Moreover, the disturbed area displayed the same time variation trend as the HGFC data from 2001 to 2021 (Figure 9) while our estimated disturbed area was 2.93 × 10⁴ ha larger than that of the HGFC. This finding further supports published results that the HGFC data often underestimate the change areas due to insufficient sample data in China and the limited capture of weaker signals, such as forest degradation and road construction [52]. The majority of recovery events were active at the beginning of the observation period, 1987–1988, and showed a slow increase after 1989.
The spatial distribution of forest disturbance and recovery varies substantially. We statistically analyzed forest changes in different burn severity zones caused by the mega-fire. The resultant data showed that mildly burned areas accounted for 51% of forest disturbance and that severely burned areas contributed to 45% of forest recovery. The burn severity and post-fire renewal measures both have an impact on long-term forest changes [54]. In mildly burned areas, there were still mother trees and canopies, allowing for seed propagation and seedling renewal under appropriate fire conditions [55]. Thus, natural regeneration was the primary approach for these areas. Conversely, in moderately-burned areas, the damage to surface vegetation and soil quality was more serious. The vegetation in these areas relied upon the artificial promotion of natural regeneration [56]. In severely burned areas, trees were almost completely dead and seed propagation was extremely poor. As a result, artificial regeneration and forest enclosure were the primary strategies [56]. Furthermore, we conducted an assessment of forest disturbance and recovery patterns in relation to varying topographic and geographic conditions. Reportedly, forest recovery in the protected areas of northeast China from 1986 to 2018 predominantly occurred in the elevation range from 300 to 900 m [57]. Our study provides a more detailed spatial distribution in the GKM that more than 75% of forest disturbance and recovery occurred in areas with elevations ranging from 400 to 650 m. We also indicated that over 75% of forest changes occurred in zones with slopes of less than 9° and within 6 km of roads and 24 km of settlements. These distribution characteristics also indirectly reflect the impact of topography and human activities on forest changes. Chen et al. emphasized that topographic indicators, especially elevation, have an essential impact on vegetation dynamics in the GKM [28]. Slope is another important factor since soil erosion and water loss are severe in areas with steeper slopes, resulting in relatively low nutrient content and insufficient vegetation growth [58]. It is worth adding that variations in human accessibility across different geographical locations can result in disparities in the frequency and severity of human disturbances [59]. Forest changes tend to occur in areas with frequent human activities where roads and settlements are more recurrent. Similar anthropogenic disturbance patterns also exist in other regions, such as Indonesian Borneo and the Andes [60,61].

4.3. Forestry Policies and Forest Changes

Many studies have highlighted the key role of forestry policies, which function as essential measures, regulations, and laws for forest protection and management, in driving changes in forest dynamics [22,52,62]. We confirmed a strong connection between forest changes and major forestry policies that the implementation timelines of the policies could explain the dynamics of forest disturbance and recovery in the GKM well. After the mega-fire, forest managers carried out extensive firewood logging activities to obtain economically valuable timber, resulting in the secondary destruction of biological heritage and the reduction in heterogeneity and structural complexity in forests [63]. The rapid decline of forest resources has brought significant attention to the issue of ecological security [64]. In 1998, the Chinese government implemented the NFCP, which, to a certain extent, alleviated human interference with natural forests [65]. Wang et al. indicated that the NFCP effectively curtailed forest loss in the northeast regions over a decade, leading to a rapid expansion of forests [57]. We also found that the NFCP demonstrated a significant advantage in promoting forest gain areas in the GKM, particularly in 2004 when the total recovery area reached 400 km2. In 1998, China also revised its forest laws and promulgated the Forest Fire Prevention Regulations to further restrict logging [64] and minimize fire risks. The regulations were revised in 2008 and were formally implemented in 2009. The new legislation focused primarily on reducing fire incidents at the source. In 2015, a stricter policy was implemented which banned all commercial logging [53]. The average annual area of the forest disturbance area decreased significantly from 1.35 × 10⁴ ha (1988–2010) to 0.34 × 10⁴ ha (2011–2021). Generally, the reasons behind forest disturbance and recovery are complex. It is not clear whether natural (climate, topography, etc.) or human factors (policies, human activities, etc.) dominate forest dynamics. Furthermore, there is overlap among these agents. It is necessary to analyze these relationships further and more deeply to promote the conservation and sustainable development of forests.

4.4. Implications in Forest Monitoring and Its Protection

The results of this study on the long-term forest disturbance and recovery in the GKM can provide critical data support for assessing the forest conditions and making scientific decisions about forest protection and management. Approximately half of forest disturbances occurred in mildly burned areas, underscoring the need for forest managers to focus on their protection to minimize disturbances and facilitate ecological recovery. Our findings further indicated that more than 75% of forest changes took place in areas with elevations of 400–650 m, slopes of less than 9°, and within 6 km of roads and 24 km of settlements. Thus, we strongly recommend prioritizing monitoring efforts in these specific areas. It is crucial for forest managers to enhance patrols and enforcement efforts and improve responsibilities related to forest protection within these regions.

5. Conclusions

To track the annual forest dynamics in the GKM, we developed a rapid and robust approach, which integrated LandTrendr and RF secondary classification, to map forest disturbance and recovery from intensive Landsat time series. This method demonstrated good performance in long-term forest monitoring in the GKM, achieving an overall accuracy of 0.86. According to our resultant detection, forests in the GKM experienced a recovery trend from 1987 to 2021. Disturbed events were highly clustered during 1987–2010 and the restored events were primarily concentrated in 1987 and 1988. To achieve a more comprehensive understanding of the forest dynamics, we provided a temporally consistent regional characterization of forest dynamics in relation to burn severity, topography, and distances from roads and settlements. For the disturbed area, the mildly burned zone was larger than those moderately and severely affected; for the recovery area, the severely burned zone was larger than the mildly and moderately affected. Forest changes tended to occur in regions with elevations of 400–650 m, slopes of less than 9°, and within 6 km of roads and 24 km of settlements. Furthermore, our findings highlight the importance of effective policy implementation and enforcement as the forest dynamics in the GKM were closely linked to the implementation timelines of major forestry policies. Overall, this study provides quantitative information on forest changes and its implications are essential for policymakers and conservation practitioners working towards sustainable forest management in the GKM.

Author Contributions

Conceptualization, H.R. and C.R.; methodology, H.R. and C.R.; validation, H.R. and P.L.; resources, M.J.; data curation, C.X.; writing—original draft preparation, H.R.; writing—review and editing, C.R., Z.W., M.J., W.Y., P.L. and C.X.; visualization, H.R. and C.R.; funding acquisition, C.R. All authors have read and agreed to the published version of the manuscript.

Funding

This research was jointly funded by the National Natural Science Foundation of China, grant number 42171367, Science and Technology Fundamental Resources Investigation Program, grant number 2022FY101902, and the Open Project Program of Fujian Key Laboratory of Big Data Application and Intellectualization for Tea Industry, Wuyi University, grant number FKLBDAITI202201.

Data Availability Statement

Data will be made available on request.

Acknowledgments

We are grateful to the anonymous reviewers and editors for appraising our manuscript and for offering instructive comments. We also would like to thank the Google Earth Engine platform and Google Earth Pro platform for providing Landsat datasets and high-resolution images; the Forest Bureau of Heilongjiang province for providing the statistical data; and the Xin Huang Group for providing land cover data.

Conflicts of Interest

The authors declare no conflict of interest.

References

  1. Gauthier, S.; Bernier, P.; Kuuluvainen, T.; Shvidenko, A.Z.; Schepaschenko, D.G. Boreal forest health and global change. Science 2015, 349, 819–822. [Google Scholar] [CrossRef]
  2. Li, Y.; Xu, X.; Wu, Z.; Fan, H.; Tong, X.; Liu, J. A forest type-specific threshold method for improving forest disturbance and agent attribution mapping. GI Sci. Remote Sens. 2022, 59, 1624–1642. [Google Scholar] [CrossRef]
  3. Hua, J.; Chen, G.; Yu, L.; Ye, Q.; Jiao, H.; Luo, X. Improved Mapping of Long-Term Forest Disturbance and Recovery Dynamics in the Subtropical China Using All Available Landsat Time-Series Imagery on Google Earth Engine Platform. IEEE J. Sel. Top. Appl. Earth Obs. Remote Sens. 2021, 14, 2754–2768. [Google Scholar] [CrossRef]
  4. Lu, J.; Huang, C.; Tao, X.; Gong, W.; Schleeweis, K. Annual forest disturbance intensity mapped using Landsat time series and field inventory data for the conterminous United States (1986–2015). Remote Sens. Environ. 2022, 275, 113003. [Google Scholar] [CrossRef]
  5. Zhang, Y.; Woodcock, C.E.; Chen, S.; Wang, J.A.; Sulla-Menashe, D.; Zuo, Z.; Olofsson, P.; Wang, Y.; Friedl, M.A. Mapping causal agents of disturbance in boreal and arctic ecosystems of North America using time series of Landsat data. Remote Sens. Environ. 2022, 272, 112935. [Google Scholar] [CrossRef]
  6. Hethcoat, M.G.; Edwards, D.P.; Carreiras, J.M.B.; Bryant, R.G.; Franca, F.M.; Quegan, S. A machine learning approach to map tropical selective logging. Remote Sens. Environ. 2019, 221, 569–582. [Google Scholar] [CrossRef]
  7. Huang, C.; Goward, S.N.; Masek, J.G.; Thomas, N.; Zhu, Z.; Vogelmann, J.E. An automated approach for reconstructing recent forest disturbance history using dense Landsat time series stacks. Remote Sens. Environ. 2010, 114, 183–198. [Google Scholar] [CrossRef]
  8. Woodcock, C.E.; Loveland, T.R.; Herold, M.; Bauer, M.E. Transitioning from change detection to monitoring with remote sensing: A paradigm shift. Remote Sens. Environ. 2020, 238, 111558. [Google Scholar] [CrossRef]
  9. Gemitzi, A.; Albarakat, R.; Kratouna, F.; Lakshmi, V. Land cover and vegetation carbon stock changes in Greece: A 29-year assessment based on CORINE and Landsat land cover data. Sci. Total Environ. 2021, 786, 147408. [Google Scholar] [CrossRef]
  10. Wan, L.; Xiang, Y.; You, H. A Post-Classification Comparison Method for SAR and Optical Images Change Detection. IEEE Geosci. Remote Sens. Lett. 2019, 16, 1026–1030. [Google Scholar] [CrossRef]
  11. Mulverhill, C.; Coops, N.C.; Achim, A. Continuous monitoring and sub-annual change detection in high-latitude forests using Harmonized Landsat Sentinel-2 data. ISPRS J. Photogramm. Remote Sens. 2023, 197, 309–319. [Google Scholar] [CrossRef]
  12. Xiao, H.; Zhang, X.; Yan, M.; Zhang, L.; Wang, H.; Ma, Y.; Liu, J. The Temporal-Based Forest Disturbance Monitoring Analysis: A Case Study of Nature Reserves of Hainan Island of China from 1987 to 2020. Front. Environ. Sci. 2022, 10, 891752. [Google Scholar] [CrossRef]
  13. Chen, S.; Olofsson, P.; Saphangthong, T.; Woodcock, C.E. Monitoring shifting cultivation in Laos with Landsat time series. Remote Sens. Environ. 2023, 288, 113507. [Google Scholar] [CrossRef]
  14. Giannetti, F.; Pecchi, M.; Travaglini, D.; Francini, S.; D’Amico, G.; Vangi, E.; Cocozza, C.; Chirici, G. Estimating VAIA Windstorm Damaged Forest Area in Italy Using Time Series Sentinel-2 Imagery and Continuous Change Detection Algorithms. Forests 2021, 12, 680. [Google Scholar] [CrossRef]
  15. Schultz, M.; Verbesselt, J.; Avitabile, V.; Souza, C.; Herold, M. Error Sources in Deforestation Detection Using BFAST Monitor on Landsat Time Series Across Three Tropical Sites. IEEE J. Sel. Top. Appl. Earth Obs. Remote Sens. 2016, 9, 3667–3679. [Google Scholar] [CrossRef]
  16. Zhu, Z.; Woodcock, C.E. Continuous change detection and classification of land cover using all available Landsat data. Remote Sens. Environ. 2014, 144, 152–171. [Google Scholar] [CrossRef]
  17. Kennedy, R.E.; Yang, Z.; Cohen, W.B. Detecting trends in forest disturbance and recovery using yearly Landsat time series: 1. LandTrendr—Temporal segmentation algorithms. Remote Sens. Environ. 2010, 114, 2897–2910. [Google Scholar] [CrossRef]
  18. Gelabert, P.J.; Rodrigues, M.; de la Riva, J.; Ameztegui, A.; Sebasti, M.T.; Vega-Garcia, C. LandTrendr smoothed spectral profiles enhance woody encroachment monitoring. Remote Sens. Environ. 2021, 262, 112521. [Google Scholar] [CrossRef]
  19. Kennedy, R.; Yang, Z.; Gorelick, N.; Braaten, J.; Cavalcante, L.; Cohen, W.; Healey, S. Implementation of the LandTrendr Algorithm on Google Earth Engine. Remote Sens. 2018, 10, 691. [Google Scholar] [CrossRef]
  20. Hislop, S.; Jones, S.; Soto-Berelov, M.; Skidmore, A.; Haywood, A.; Nguyen, T.H. A fusion approach to forest disturbance mapping using time series ensemble techniques. Remote Sens. Environ. 2019, 221, 188–197. [Google Scholar] [CrossRef]
  21. Schneibel, A.; Stellmes, M.; Roeder, A.; Frantz, D.; Kowalski, B.; Hass, E.; Hill, J. Assessment of spatio-temporal changes of smallholder cultivation patterns in the Angolan Miombo belt using segmentation of Landsat time series. Remote Sens. Environ. 2017, 195, 118–129. [Google Scholar] [CrossRef]
  22. Zhang, Y.; Liu, S.; Wang, Y.; Gao, H.; Jiang, Y.; Wei, D. Forest management practices and policies exert strong impacts on the spatio-temporal variations of forest disturbance in Hunan Province, China over the last three decades. For. Ecol. Manag. 2023, 544, 121167. [Google Scholar] [CrossRef]
  23. Cohen, W.B.; Healey, S.P.; Yang, Z.; Stehman, S.V.; Brewer, C.K.; Brooks, E.B.; Gorelick, N.; Huang, C.; Hughes, M.J.; Kennedy, R.E.; et al. How Similar Are Forest Disturbance Maps Derived from Different Landsat Time Series Algorithms? Forests 2017, 8, 98. [Google Scholar] [CrossRef]
  24. Healey, S.P.; Cohen, W.B.; Yang, Z.; Kenneth Brewer, C.; Brooks, E.B.; Gorelick, N.; Hernandez, A.J.; Huang, C.; Joseph Hughes, M.; Kennedy, R.E.; et al. Mapping forest change using stacked generalization: An ensemble approach. Remote Sens. Environ. 2018, 204, 717–728. [Google Scholar] [CrossRef]
  25. Zhao, C.; Jia, M.; Wang, Z.; Mao, D.; Wang, Y. Toward a better understanding of coastal salt marsh mapping: A case from China using dual-temporal images. Remote Sens. Environ. 2023, 295, 113664. [Google Scholar] [CrossRef]
  26. Li, Y.; Wu, Z.; Xu, X.; Fan, H.; Tong, X.; Liu, J. Forest disturbances and the attribution derived from yearly Landsat time series over 1990–2020 in the Hengduan Mountains Region of Southwest China. For. Ecosyst. 2021, 8, 73. [Google Scholar] [CrossRef]
  27. Zhang, Q.; Homayouni, S.; Yao, H.; Shu, Y.; Li, M.; Zhou, M. Joint Analysis of Lightning-Induced Forest Fire and Surface Influence Factors in the Great Xing’an Range. Forests 2022, 13, 1867. [Google Scholar] [CrossRef]
  28. Chen, X.; Chen, W.; Xu, M. Remote-Sensing Monitoring of Postfire Vegetation Dynamics in the Greater Hinggan Mountain Range Based on Long Time-Series Data: Analysis of the Effects of Six Topographic and Climatic Factors. Remote Sens. 2022, 14, 2958. [Google Scholar] [CrossRef]
  29. Chen, W.; Moriya, K.; Sakai, T.; Koyama, L.; Cao, C. Monitoring of post-fire forest recovery under different restoration modes based on time series Landsat data. Eur. J. Remote Sens. 2017, 47, 153–168. [Google Scholar] [CrossRef]
  30. Wang, J.; Wang, J.; Zhou, H.; Xiao, Z. Detecting Forest Disturbance in Northeast China from GLASS LAI Time Series Data Using a Dynamic Model. Remote Sens. 2017, 9, 1293. [Google Scholar] [CrossRef]
  31. Chen, W.; Sakai, T.; Cao, C.; Moriya, K.; Koyama, L. Detection of forest disturbance in the Greater Hinggan Mountain of China based on Landsat time-series data. In Proceedings of the IEEE International Geoscience and Remote Sensing Symposium (IGARSS), Munich, Germany, 22–27 July 2012; pp. 7232–7235. [Google Scholar]
  32. Huang, Z.; Cao, C.; Chen, W.; Xu, M.; Dang, Y.; Singh, R.P.; Bashir, B.; Xie, B.; Lin, X. Remote Sensing Monitoring of Vegetation Dynamic Changes after Fire in the Greater Hinggan Mountain Area: The Algorithm and Application for Eliminating Phenological Impacts. Remote Sens. 2020, 12, 156. [Google Scholar] [CrossRef]
  33. Li, K.; Xu, E. Differentiating effects of salvage logging and recovery patterns on post-fire boreal forests in Northeast China using a modified forest disturbance index. Gisci. Remote Sens. 2023, 60, 2188674. [Google Scholar] [CrossRef]
  34. Liu, Z.; Yang, J.; He, H.; Chang, Y. Spatial point analysis of fire occurrence and its influence factor in Huzhong forest area of the Great Xing′an Mountains in Heilongjiang Province, China. Acta Ecol. Sin. 2011, 31, 1669–1677. [Google Scholar]
  35. Liu, B.; Yang, J.; Johnstone, J.F. Understory vascular plant community assembly in relation to time-since-fire and environmental variables in a Chinese boreal forest. J. Mt. Sci. 2017, 14, 1317–1328. [Google Scholar] [CrossRef]
  36. Myroniuk, V.; Bell, D.M.; Gregory, M.J.; Vasylyshyn, R.; Bilous, A. Uncovering forest dynamics using historical forest inventory data and Landsat time series. For. Ecol. Manag. 2022, 513, 120184. [Google Scholar] [CrossRef]
  37. Zhou, G.X.; Liu, M.; Liu, X.N. An autoencoder-based model for forest disturbance detection using Landsat time series data. Int. J. Digit. Earth 2021, 14, 1087–1102. [Google Scholar] [CrossRef]
  38. Yang, J.; Huang, X. The 30 m annual land cover dataset and its dynamics in China from 1990 to 2019. Earth Syst. Sci. Data 2021, 13, 3907–3925. [Google Scholar] [CrossRef]
  39. Hansen, M.C.; Potapov, P.V.; Moore, R.; Hancher, M.; Turubanova, S.A.; Tyukavina, A.; Thau, D.; Stehman, S.V.; Goetz, S.J.; Loveland, T.R.; et al. High-Resolution Global Maps of 21st-Century Forest Cover Change. Science 2013, 342, 850–853. [Google Scholar] [CrossRef]
  40. de Jong, S.M.; Shen, Y.; de Vries, J.; Bijnaar, G.; van Maanen, B.; Augustinus, P.; Verweij, P. Mapping mangrove dynamics and colonization patterns at the Suriname coast using historic satellite data and the LandTrendr algorithm. Int. J. Appl. Earth Obs. Geoinf. 2021, 97, 102293. [Google Scholar] [CrossRef]
  41. Huang, C.; Goward, S.N.; Masek, J.G.; Gao, F.; Vermote, E.F.; Thomas, N.; Schleeweis, K.; Kennedy, R.E.; Zhu, Z.; Eidenshink, J.C.; et al. Development of time series stacks of Landsat images for reconstructing forest disturbance history. Int. J. Digit. Earth 2009, 2, 195–218. [Google Scholar] [CrossRef]
  42. Masek, J.G.; Vermote, E.F.; Saleous, N.E.; Wolfe, R.; Hall, F.G.; Huemmrich, K.F.; Gao, F.; Kutler, J.; Lim, T.K. A Landsat surface reflectance dataset for North America, 1990–2000. IEEE Geosci. Remote Sens. Lett. 2006, 3, 68–72. [Google Scholar] [CrossRef]
  43. Skakun, S.; Vermote, E.F.; Roger, J.-C.; Justice, C.O.; Masek, J.G. Validation of the LaSRC Cloud Detection Algorithm for Landsat 8 Images. IEEE J. Sel. Top. Appl. Earth Obs. Remote Sens. 2019, 12, 2439–2446. [Google Scholar] [CrossRef]
  44. Fu, B.; Lan, F.; Xie, S.; Liu, M.; He, H.; Li, Y.; Liu, L.; Huang, L.; Fan, D.; Gao, E.; et al. Spatio-temporal coupling coordination analysis between marsh vegetation and hydrology change from 1985 to 2019 using LandTrendr algorithm and Google Earth Engine. Ecol. Indic. 2022, 137, 108763. [Google Scholar] [CrossRef]
  45. Cohen, W.B.; Yang, Z.; Heale, S.P.; Kennedy, R.E.; Gorelic, N. A LandTrendr multispectral ensemble for forest disturbance detection. Remote Sens. Environ. 2018, 205, 131–140. [Google Scholar] [CrossRef]
  46. Pal, M. Random forest classifier for remote sensing classification. Int. J. Remote Sens. 2005, 26, 217–222. [Google Scholar] [CrossRef]
  47. Ren, Y.; Mao, D.; Wang, Z.; Yu, Z.; Xu, X.; Huang, Y.; Xi, Y.; Luo, L.; Jia, M.; Song, K.; et al. China’s wetland soil organic carbon pool: New estimation on pool size, change, and trajectory. Glob. Change Biol. 2023, 29, 6139–6156. [Google Scholar] [CrossRef] [PubMed]
  48. Cohen, W.B.; Yang, Z.; Kennedy, R. Detecting trends in forest disturbance and recovery using yearly Landsat time series: 2. TimeSync—Tools for calibration and validation. Remote Sens. Environ. 2010, 114, 2911–2924. [Google Scholar] [CrossRef]
  49. De Marzo, T.; Pflugmacher, D.; Baumann, M.; Lambin, E.F.; Gasparri, I.; Kuemmerle, T. Characterizing forest disturbances across the Argentine Dry Chaco based on Landsat time series. Int. J. Appl. Earth Obs. Geoinf. 2021, 98, 102310. [Google Scholar] [CrossRef]
  50. Barboza Castillo, E.; Turpo Cayo, E.Y.; de Almeida, C.M.; Salas Lopez, R.; Rojas Briceno, N.B.; Silva Lopez, J.O.; Barrena Gurbillon, M.A.; Oliva, M.; Espinoza-Villar, R. Monitoring Wildfires in the Northeastern Peruvian Amazon Using Landsat-8 and Sentinel-2 Imagery in the GEE Platform. ISPRS Int. J. Geo-Inf. 2020, 9, 564. [Google Scholar] [CrossRef]
  51. Expert Group of The State Council Leading Group for the Restoration of Production and Reconstruction in the Disaster Areas. Compilation of Investigation Reports on the Restoration of Forest Resources and Ecological Environment in the Disaster Area of the Greater Khingan Mountains; China Forestry Publishing House: Beijing, China, 1987; pp. 2–3. [Google Scholar]
  52. Shen, J.; Chen, G.; Hua, J.; Huang, S.; Ma, J. Contrasting Forest Loss and Gain Patterns in Subtropical China Detected Using an Integrated LandTrendr and Machine-Learning Method. Remote Sens. 2022, 14, 3238. [Google Scholar] [CrossRef]
  53. Liu, Z.; Wang, W.J.; Ballantyne, A.; He, H.S.; Wang, X.; Liu, S.; Ciais, P.; Wimberly, M.C.; Piao, S.; Yu, K.; et al. Forest disturbance decreased in China from 1986 to 2020 despite regional variations. Commun. Earth Environ. 2023, 4, 15. [Google Scholar] [CrossRef]
  54. Meng, R.; Dennison, P.E.; Huang, C.; Moritz, M.A.; D’Antonio, C. Effects of fire severity and post-fire climate on short-term vegetation recovery of mixed-conifer and red fir forests in the Sierra Nevada Mountains of California. Remote Sens. Environ. 2015, 171, 311–325. [Google Scholar] [CrossRef]
  55. Liu, Z. Effects of climate and fire on short-term vegetation recovery in the boreal larch forests of Northeastern China. Sci. Rep. 2016, 6, 37572. [Google Scholar] [CrossRef]
  56. Chen, W.; Jiang, H.; Moriya, K.; Sakai, T.; Cao, C. Monitoring of post-fire forest regeneration under different restoration treatments based on ALOS/PALSAR data. New For. 2017, 49, 105–121. [Google Scholar] [CrossRef]
  57. Wang, J.; He, Z.; Wang, C.; Feng, M.; Pang, Y.; Yu, T.; Li, X. Investigation of Long-Term Forest Dynamics in Protected Areas of Northeast China Using Landsat Data. Remote Sens. 2022, 14, 2988. [Google Scholar] [CrossRef]
  58. Francos, M.; Sanchez-Garcia, C.; Girona-Garcia, A.; Fernandez-Garcia, V. Influence of topography on sediment dynamics and soil chemical properties in a Mediterranean forest historically affected by wildfires: NE Iberian Peninsula. Environ. Earth Sci. 2021, 80, 436. [Google Scholar] [CrossRef]
  59. Tian, X.; Zhao, F.; Shu, L.; Wang, M. Distribution characteristics and the influence factors of forest fires in China. For. Ecol. Manag. 2013, 310, 460–467. [Google Scholar] [CrossRef]
  60. Mitchell Aide, T.; Ricardo Grau, H.; Graesser, J.; Jose Andrade-Nunez, M.; Araoz, E.; Barros, A.P.; Campos-Cerqueira, M.; Chacon-Moreno, E.; Cuesta, F.; Espinoza, R.; et al. Woody vegetation dynamics in the tropical and subtropical Andes from 2001 to 2014: Satellite image interpretation and expert validation. Glob. Change Biol. 2019, 25, 2112–2126. [Google Scholar] [CrossRef] [PubMed]
  61. Curran, L.M.; Trigg, S.N.; McDonald, A.K.; Astiani, D.; Hardiono, Y.M.; Siregar, P.; Caniago, I.; Kasischke, E. Lowland forest loss in protected areas of Indonesian Borneo. Science 2004, 303, 1000–1003. [Google Scholar] [CrossRef] [PubMed]
  62. Zhang, D. China’s forest expansion in the last three plus decades: Why and how? For. Policy Econ. 2019, 98, 75–81. [Google Scholar] [CrossRef]
  63. Xu, J.T.; Tao, R.; Amacher, G.S. An empirical analysis of China’s state-owned forests. For. Policy Econ. 2004, 6, 379–390. [Google Scholar] [CrossRef]
  64. Yu, D.; Zhou, L.; Zhou, W.; Ding, H.; Wang, Q.; Wang, Y.; Wu, X.; Dai, L. Forest management in Northeast China: History, problems, and challenges. Environ. Manag. 2011, 48, 1122–1135. [Google Scholar] [CrossRef] [PubMed]
  65. Wang, X.; He, H.S.; Li, X. The long-term effects of fire suppression and reforestation on a forest landscape in Northeastern China after a catastrophic wildfire. Landsc. Urban Plan. 2007, 79, 84–95. [Google Scholar] [CrossRef]
Figure 1. Geographical location of the study area and different types of samples for RF classifiers.
Remotesensing 15 05426 g001
Figure 2. The general framework for forest change detection in the GKM.
Remotesensing 15 05426 g002
Figure 3. Three examples of change detection in forests and its NBR time series segmentation trajectory by the LandTrendr and RF models. Note: the yellow dots are the disturbed samples; (a1a3) are our detected results; (c1c3) are the fitted NBR time series.
Remotesensing 15 05426 g003
Figure 4. Annual area of forest disturbance and recovery from 1989 to 2021.
Remotesensing 15 05426 g004
Figure 5. Spatial distribution of forest disturbance and recovery from 1987 to 2021. (a) Forest disturbance; (b) Forest recovery.
Remotesensing 15 05426 g005
Figure 6. Spatial distribution of burned areas and severity classification.
Remotesensing 15 05426 g006
Figure 7. Forest changes in relation to topographical conditions from 1987 to 2021. (a) Disturbed area by elevation; (b) Restored area by elevation; (c) Disturbed area by slope; (d) Restored area by slope.
Remotesensing 15 05426 g007
Figure 8. Forest changes in relation to roads and settlements from 1987 to 2021. (a) Disturbed area at varied distances from roads; (b) Restored area at varied distances from roads; (c) Disturbed area at varied distances from settlements; (d) Restored area at varied distances from settlements.
Remotesensing 15 05426 g008
Figure 9. Comparisons of disturbed areas in forests between our detection and the HGFC product in the GKM from 2001 to 2021.
Remotesensing 15 05426 g009
Table 1. Datasets used in this study.
Data Name Spatial ResolutionTime RangeData Source
Landsat imagery30 m1986–2021http://landsat.usgs.gov/ (accessed on 1 September 2022)
Annual China Land Cover
Dataset (CLCD)
30 m1985 and 2021https://doi.org/10.5281/zenodo.5816591 (accessed on 1 June 2022)
National Forest Inventory
(NFI) data
-2016–2021The Forest Bureau of the Heilongjiang province
Hansen Global Forest Change v1.10 (HGFC)30 m2001–2021https://glad.earthengine.app/view/global-forest-change (accessed on 1 September 2022)
The Shuttle Radar Topography Mission (SRTM) 1-arcsecond global digital elevation model (DEM)30 m-http://www2.jpl.nasa.gov/srtm (accessed on 1 June 2022)
OpenStreetMap (OSM)-Up to dateHttps://www.openstreetmap.org/ (accessed on 1 September 2022)
Table 2. Threshold classification of burn severity.
Burn SeverityThreshold
Unburned areas≤0.23
Mildly burned areas0.23–0.52
Moderately burned areas0.60–0.72
Severely burned areas≥0.72
Table 3. Overall accuracy, commission error, and omission error of forest disturbance and recovery.
Temporal
Window
Forest DisturbanceForest Recovery
Overall AccuracyCommissionOmissionOverall AccuracyCommissionOmission
1986–199283.3320.0011.1182.6023.079.09
1992–199888.2412.5012.5084.6221.428.33
1998–200485.7116.679.0984.0020.007.69
2004–201089.6612.506.6789.2913.337.14
2010–201688.0014.297.6985.1920.0020.00
2016–202191.675.2610.0086.4910.5315.00
1986–202187.0415.1810.3885.5715.8617.86
Table 4. Areal extents (×104 ha) of forest changes in different burn severity zones during 1988–2021.
Burn SeverityForest DisturbanceForest Recovery
Mildly burned areas7.3312.27
Moderately burned areas3.4510.22
Severely burned areas3.6018.40
Disclaimer/Publisher’s Note: The statements, opinions and data contained in all publications are solely those of the individual author(s) and contributor(s) and not of MDPI and/or the editor(s). MDPI and/or the editor(s) disclaim responsibility for any injury to people or property resulting from any ideas, methods, instructions or products referred to in the content.

