

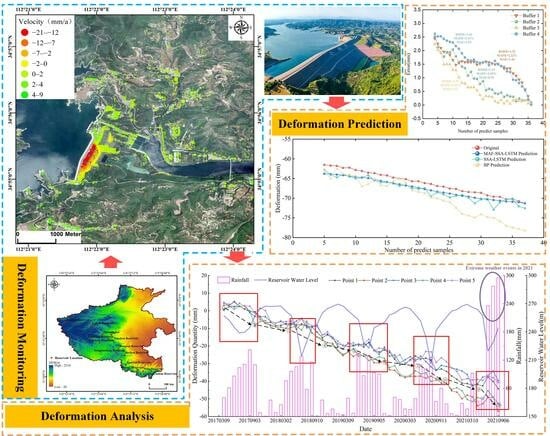
Soil and Rockfill Dams Safety Assessment for Henan Province: Monitoring, Analysis and Prediction
 ,
,  , , ,
, , ,
Abstract
:
1. Introduction
2. Study Area and Data
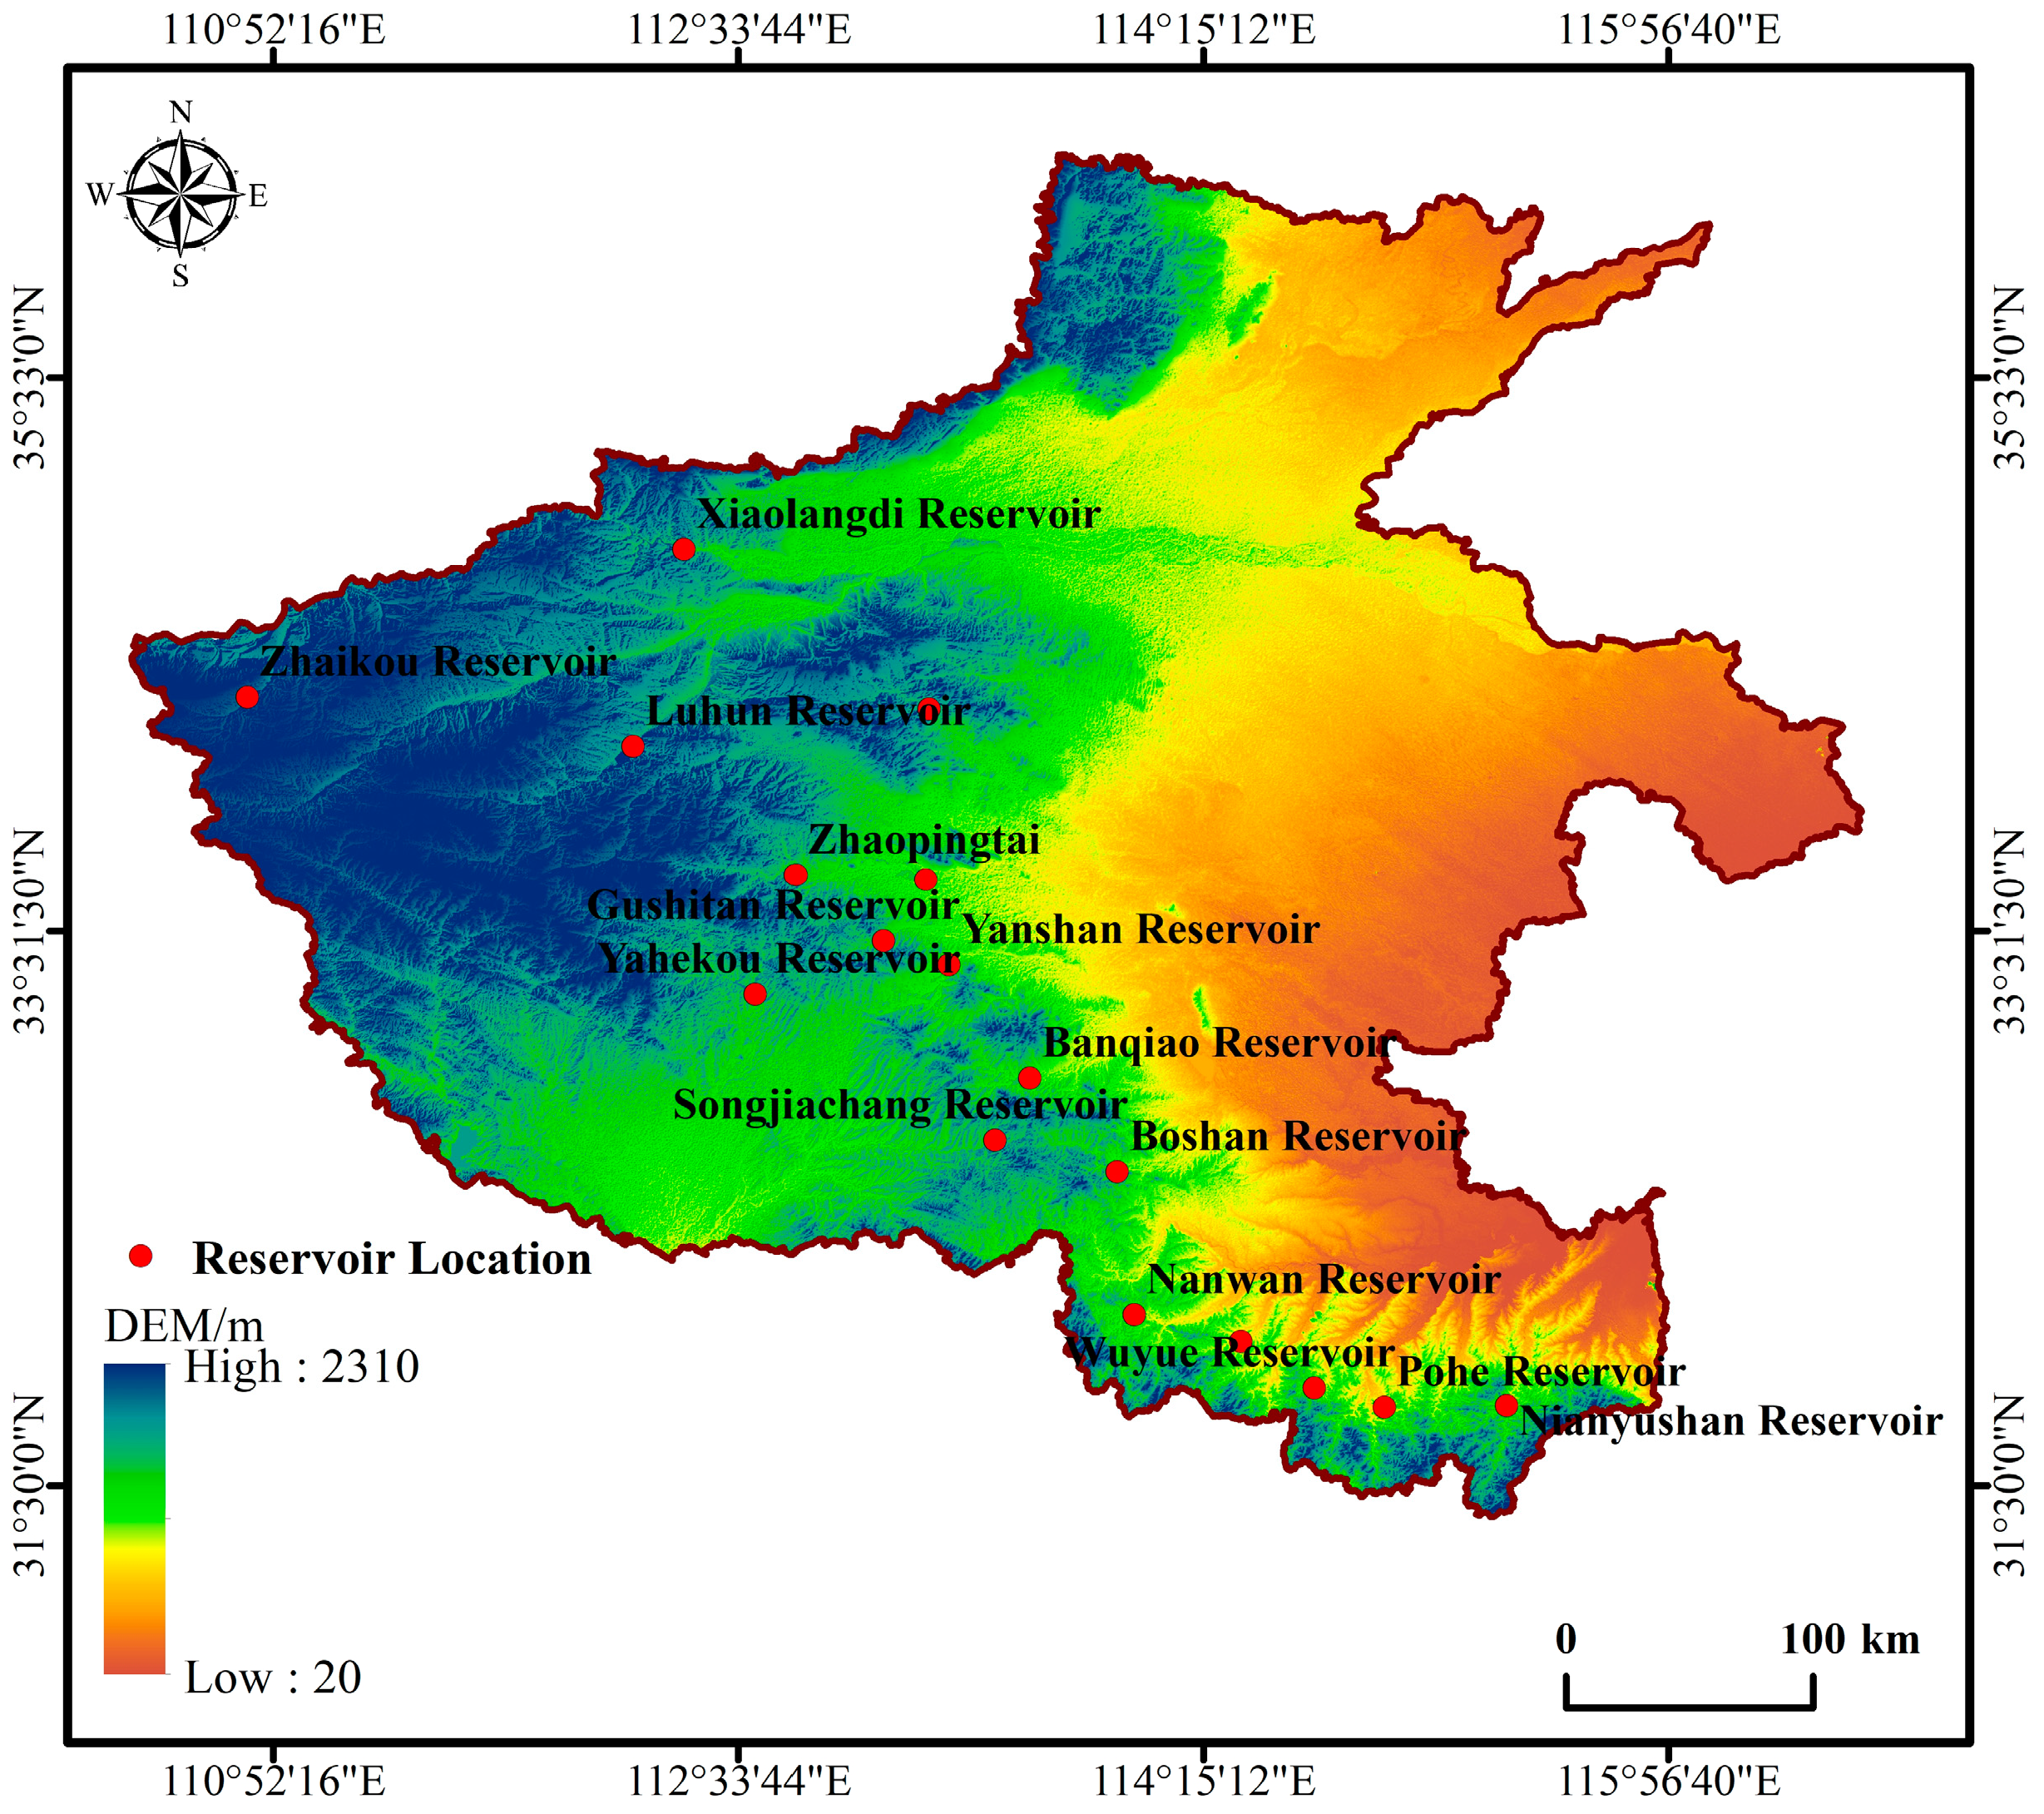
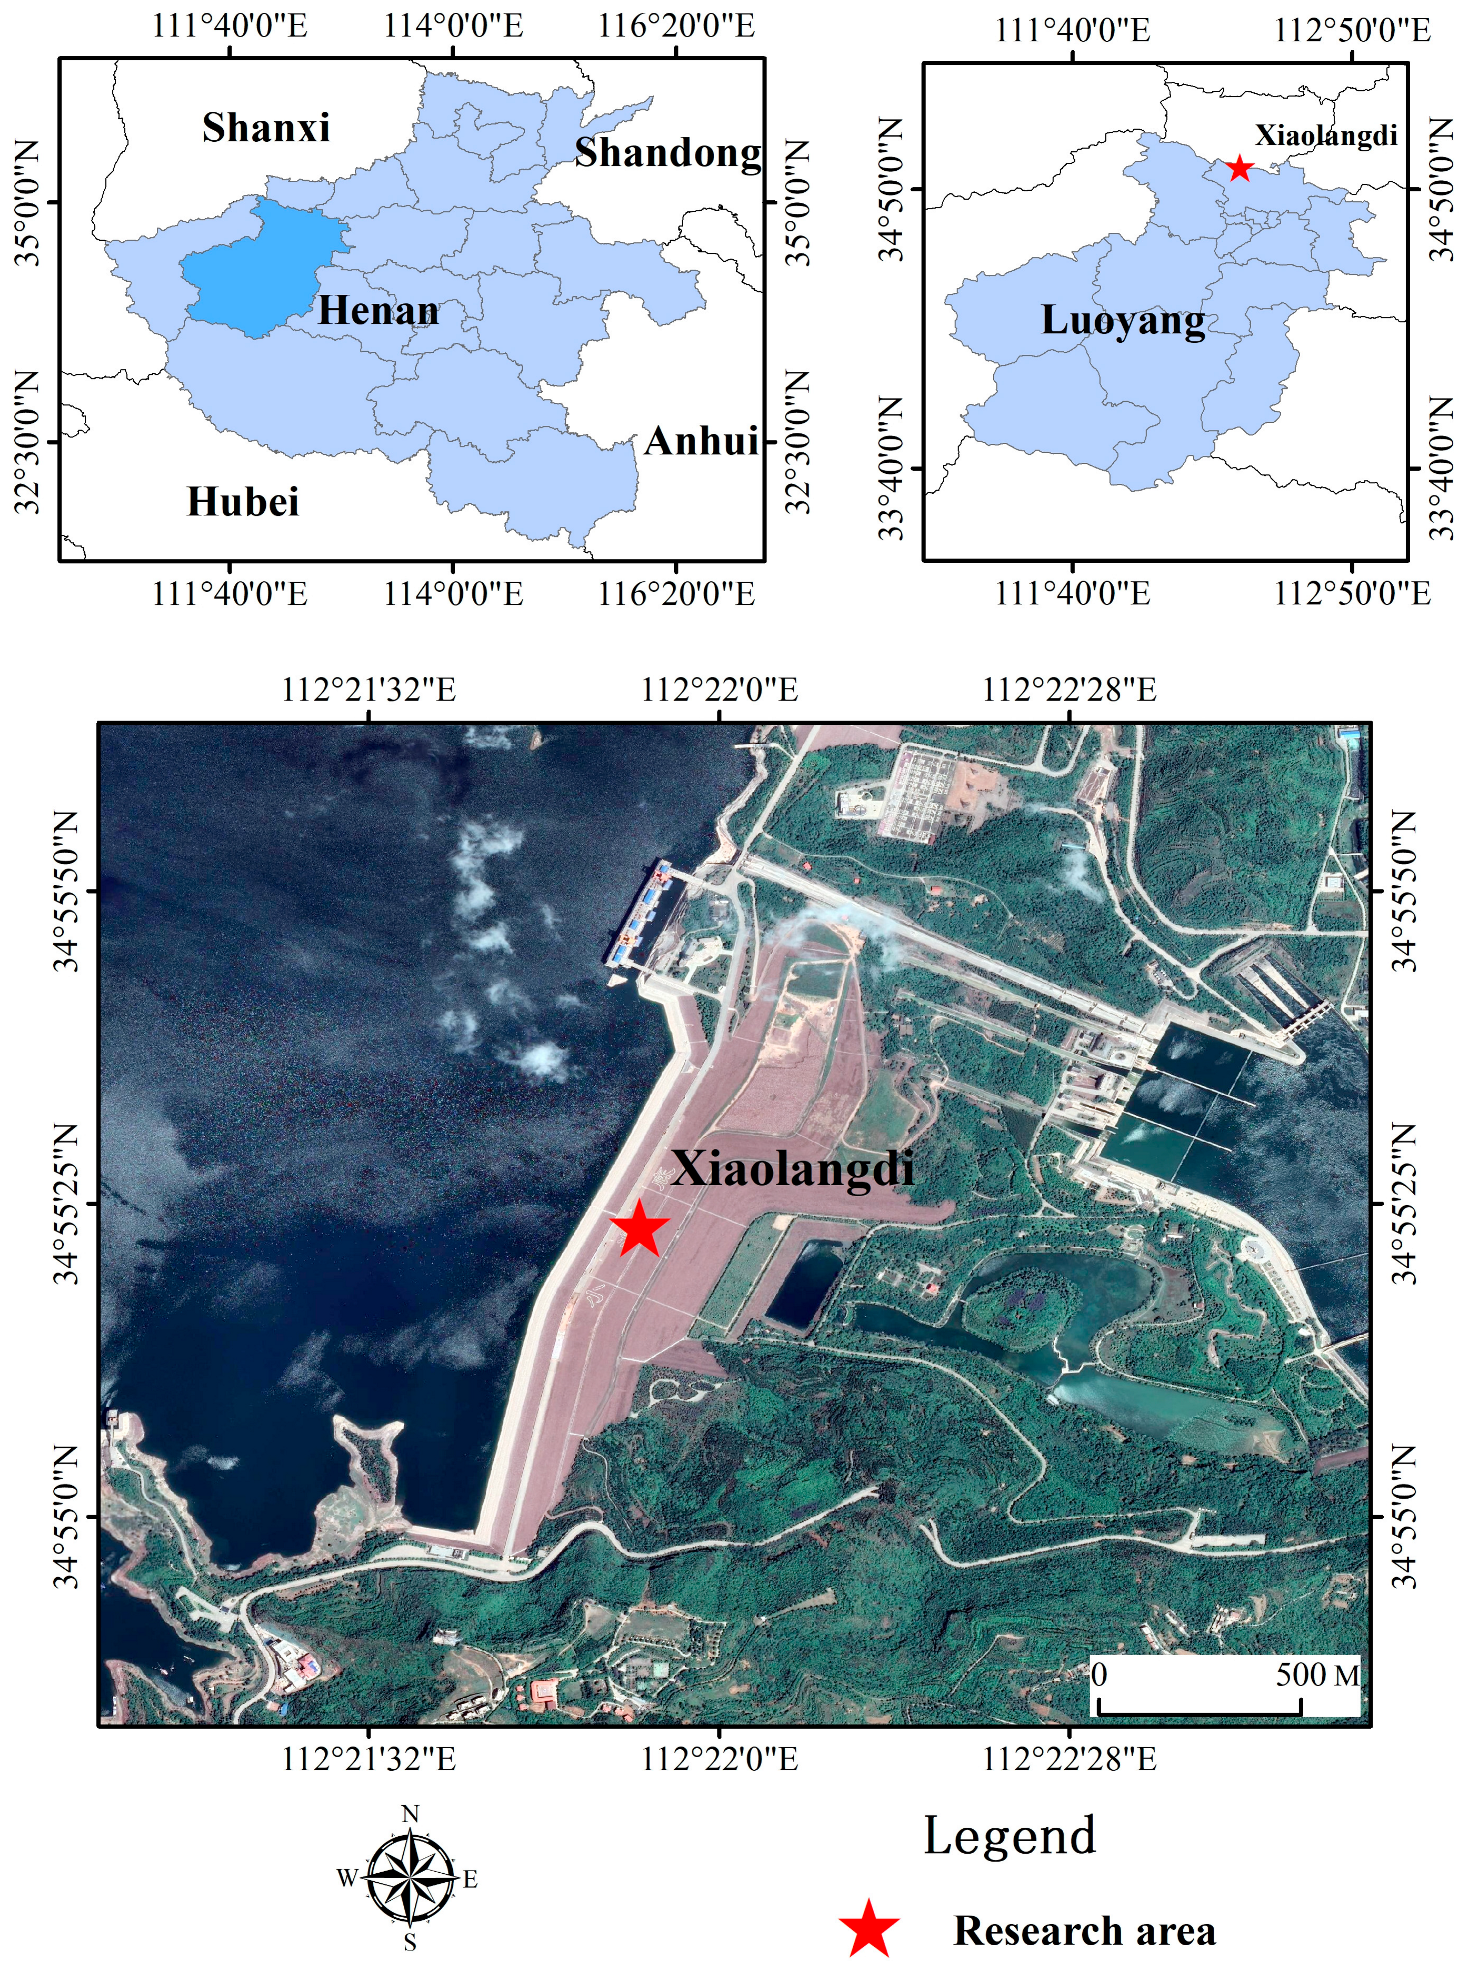
2.1. Study Area
2.2. Data Source
3. Methods
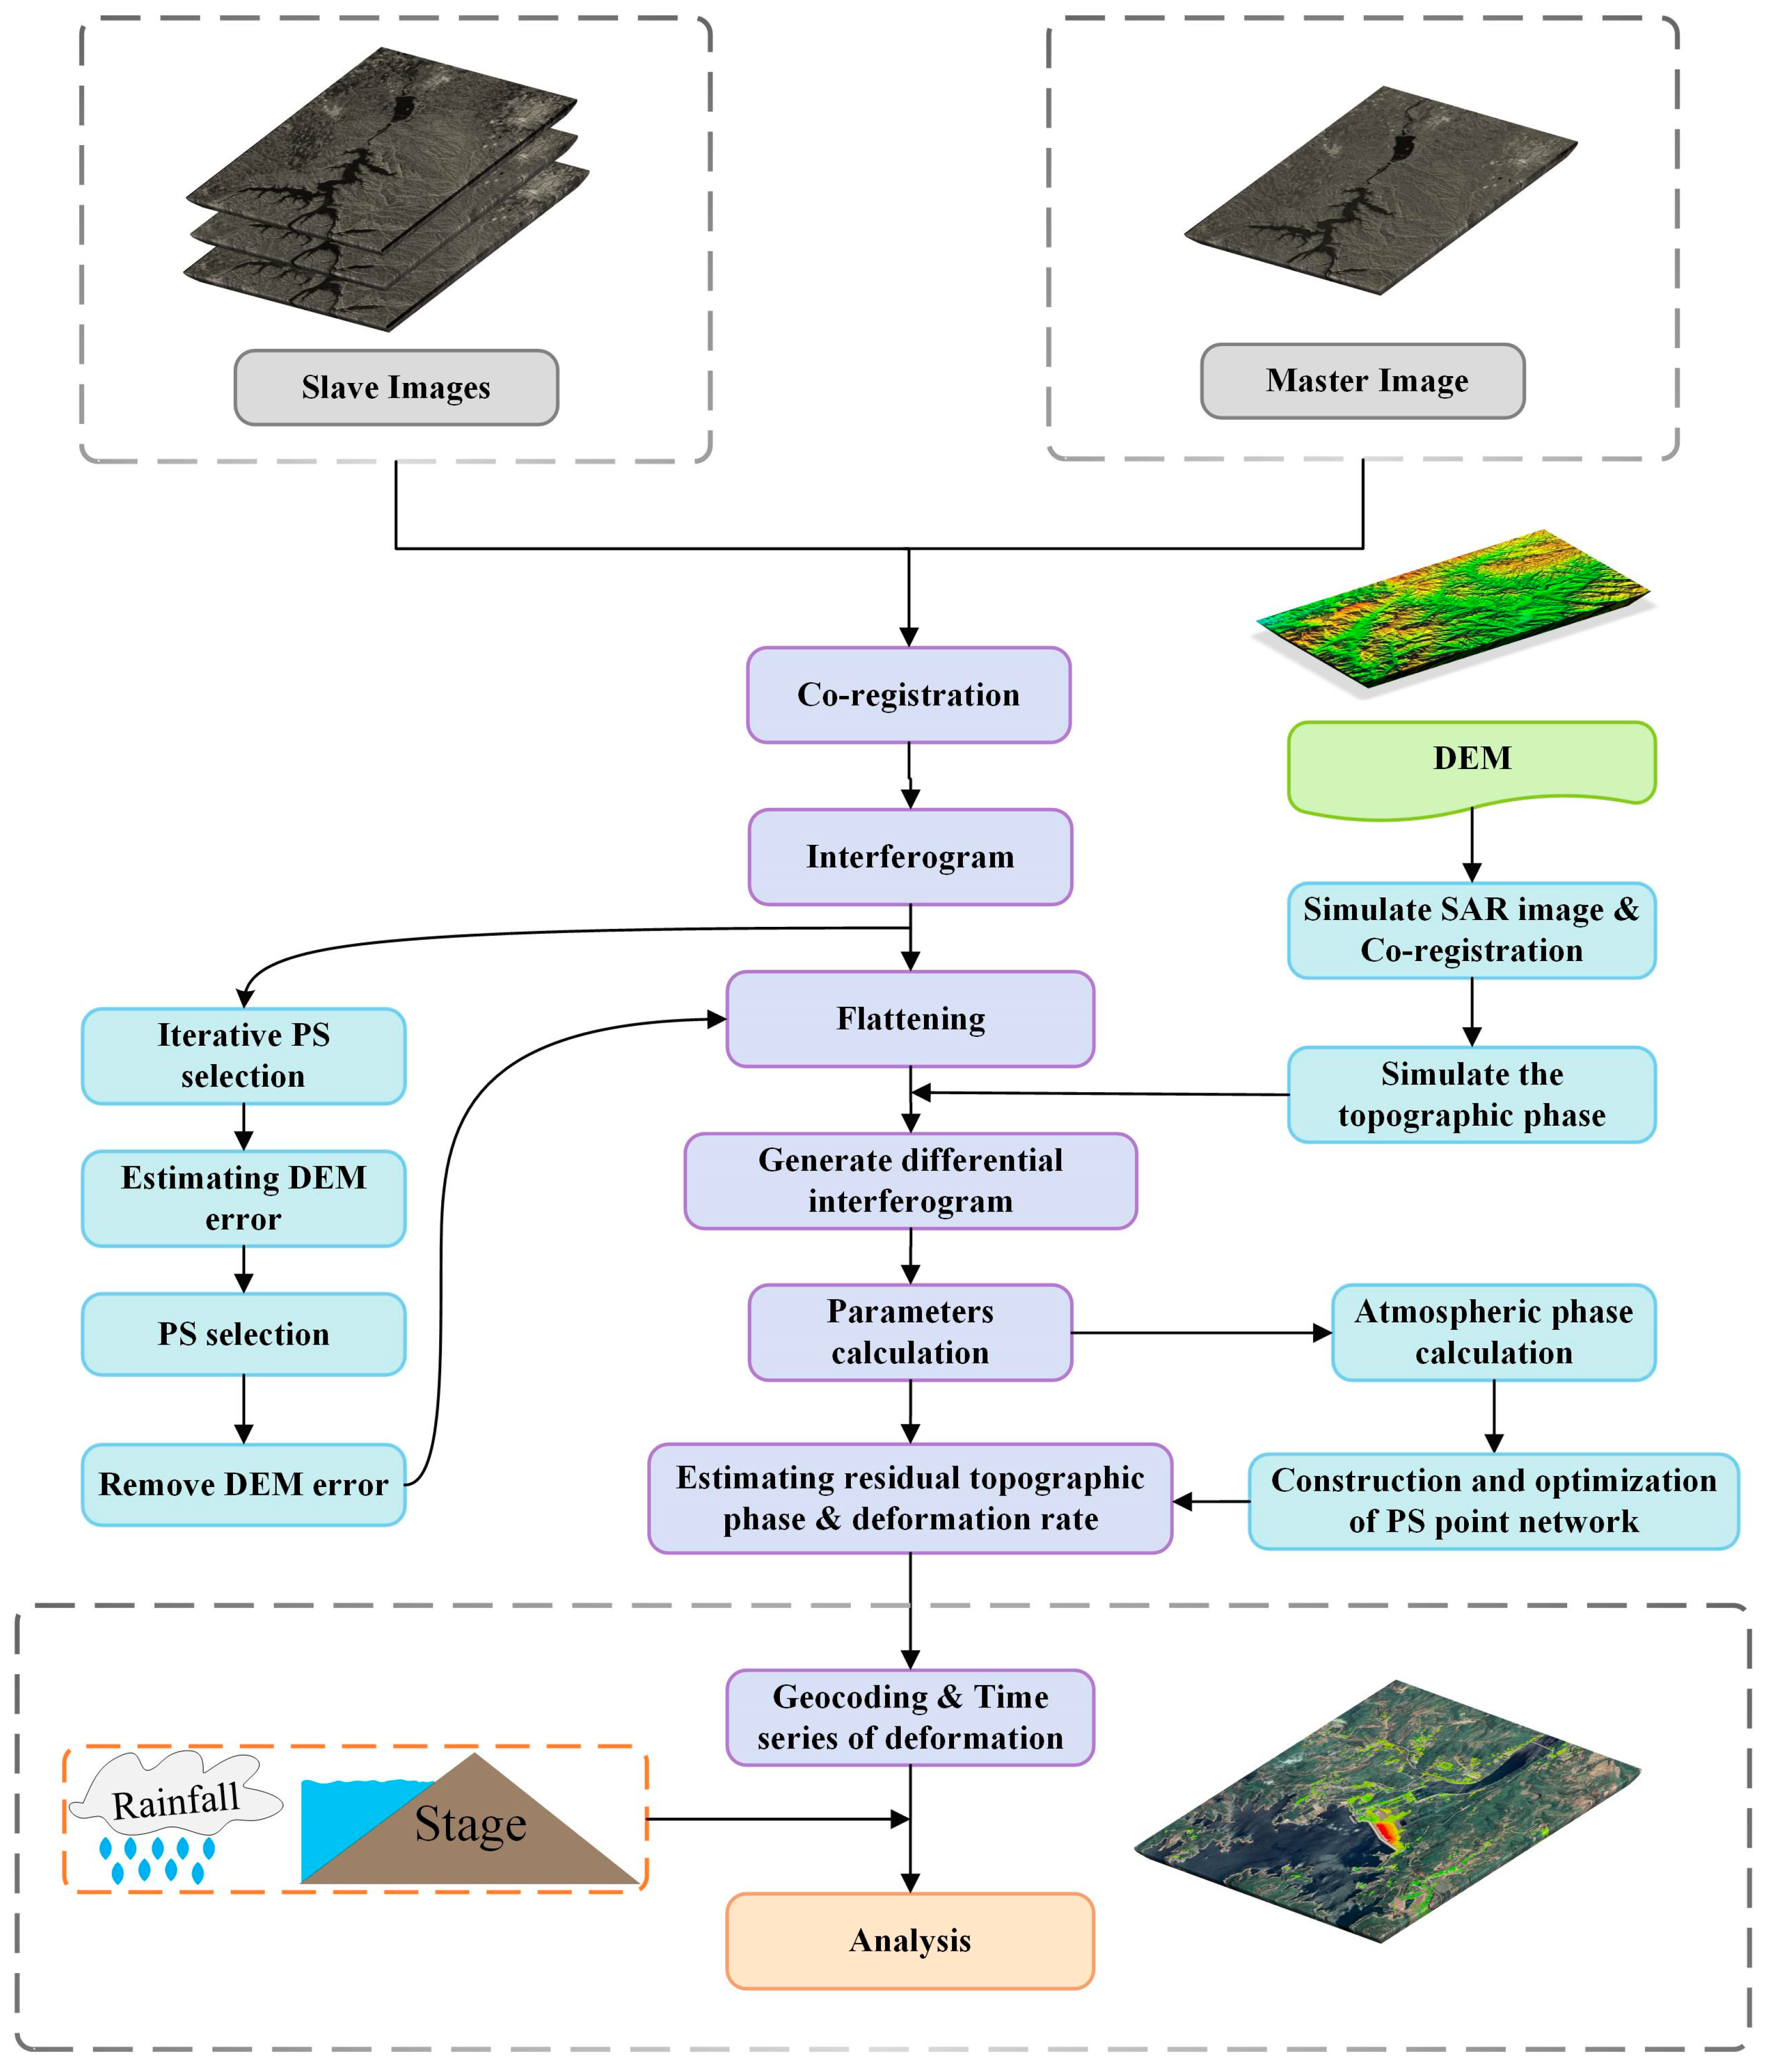
3.1. PS-InSAR Technique
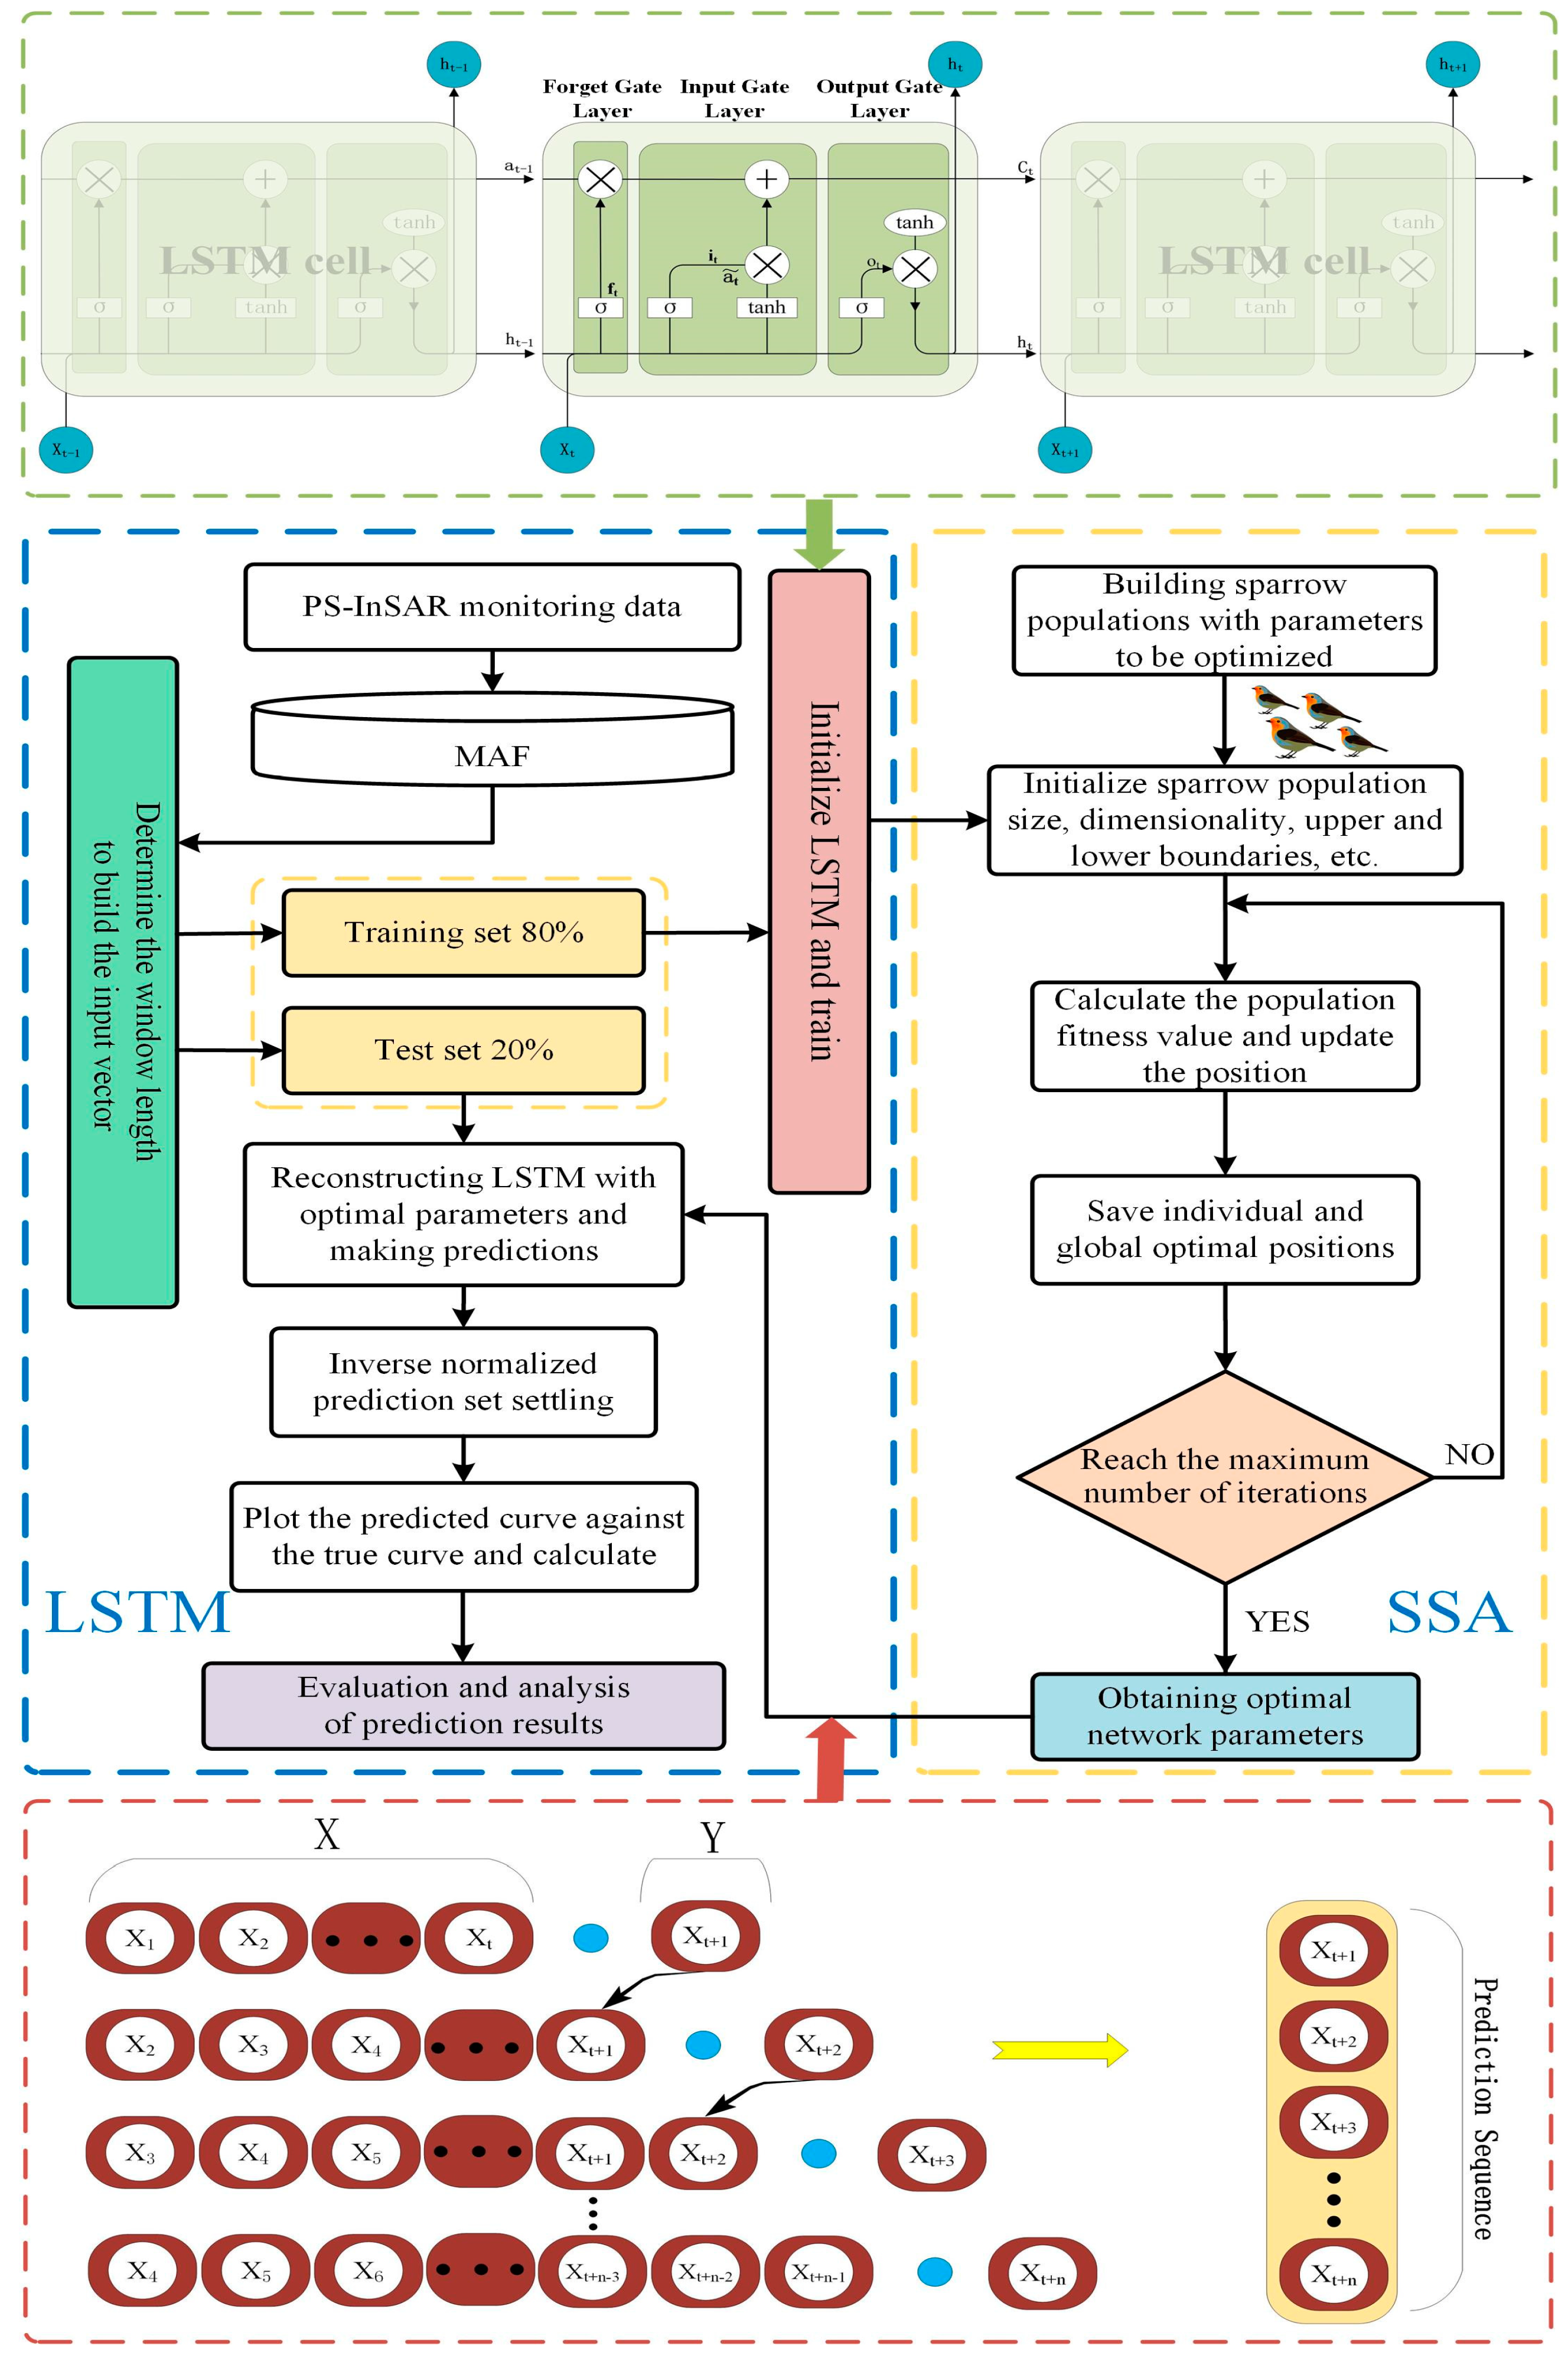
3.2. MAF-SSA-LSTM Model
- (1)
- With the initial learning rate, regularization parameter, and the number of nodes in the hidden layer of the LSTM structure as the optimization objects, determine the sparrow population number, the maximum number of iterations, the number of optimization parameters, and the upper and lower bounds of parameter values (initial Learning rate, regularization coefficient, and the number of nodes in the hidden layer), and initialize the value of the SSA optimization algorithm.
- (2)
- Calculate the fitness value and update the position of each sparrow based on the number of sparrows in the population, and use Equations (6)–(8) to update the optimal individual position and global optimal position in the iterative sparrow population, and save the iteratively searched position.
- (3)
- Determine whether the maximum number of iterations has been reached. If so, exit the loop to obtain the optimal network parameters. Otherwise, continue with Step (2) above until the iteration ends and output the optimal network end parameters.
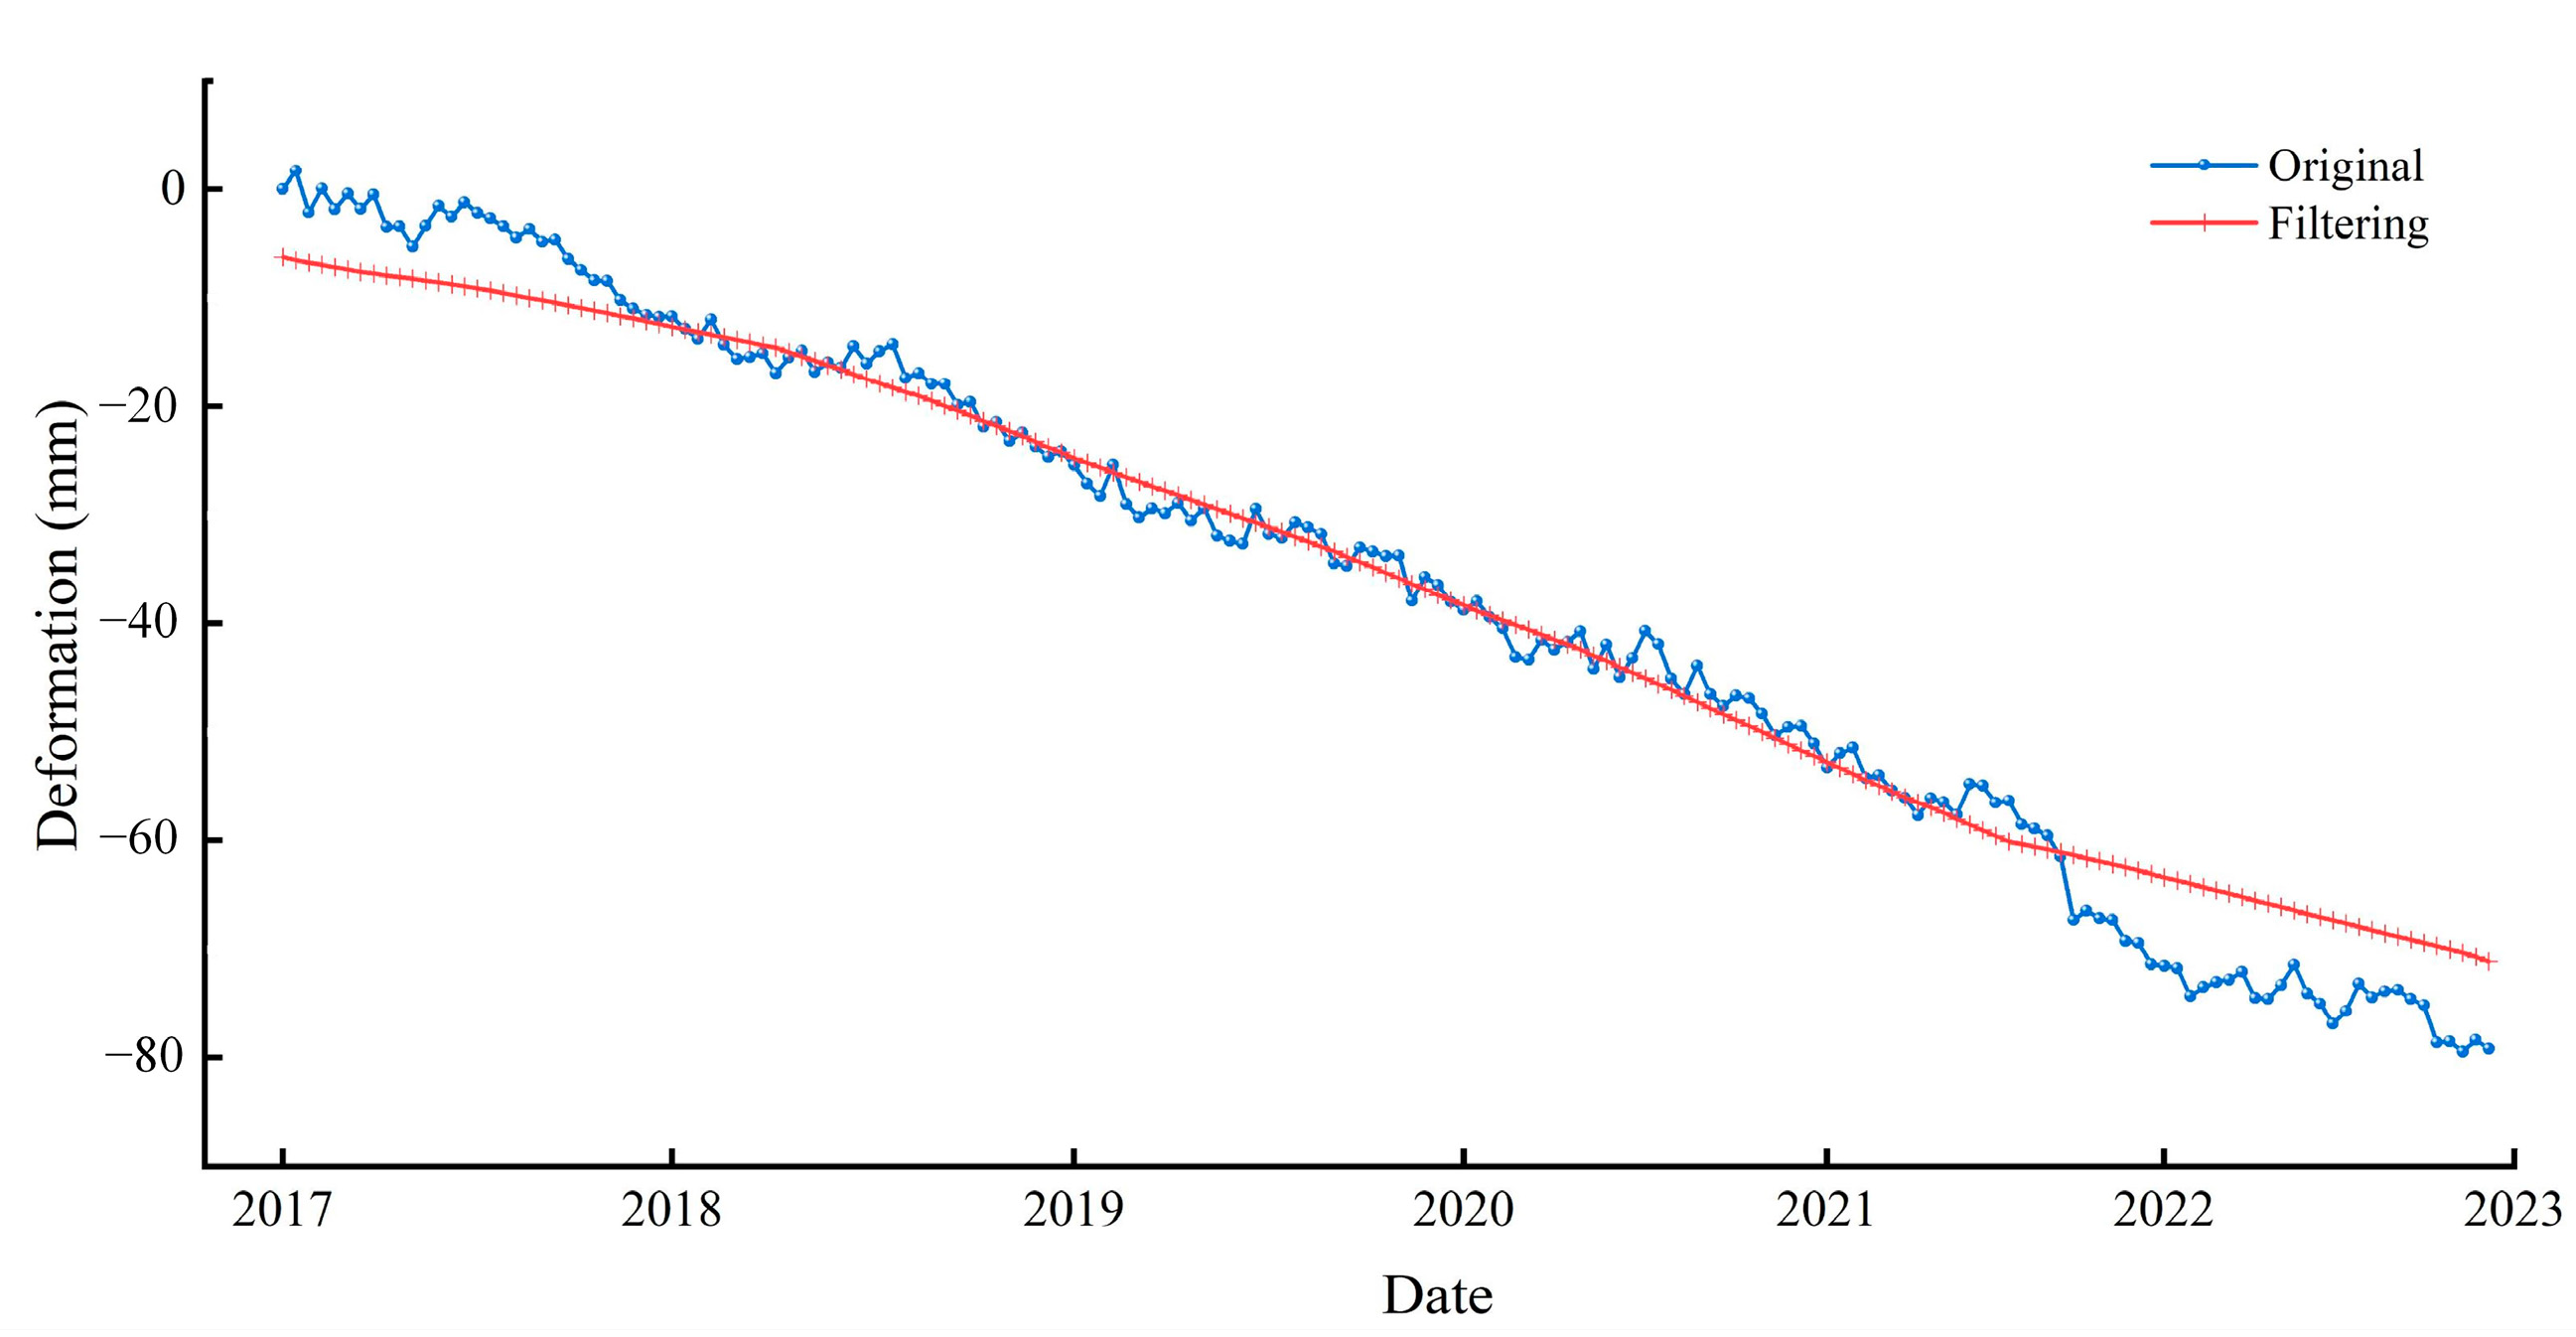
3.2.1. MAF
3.2.2. SSA
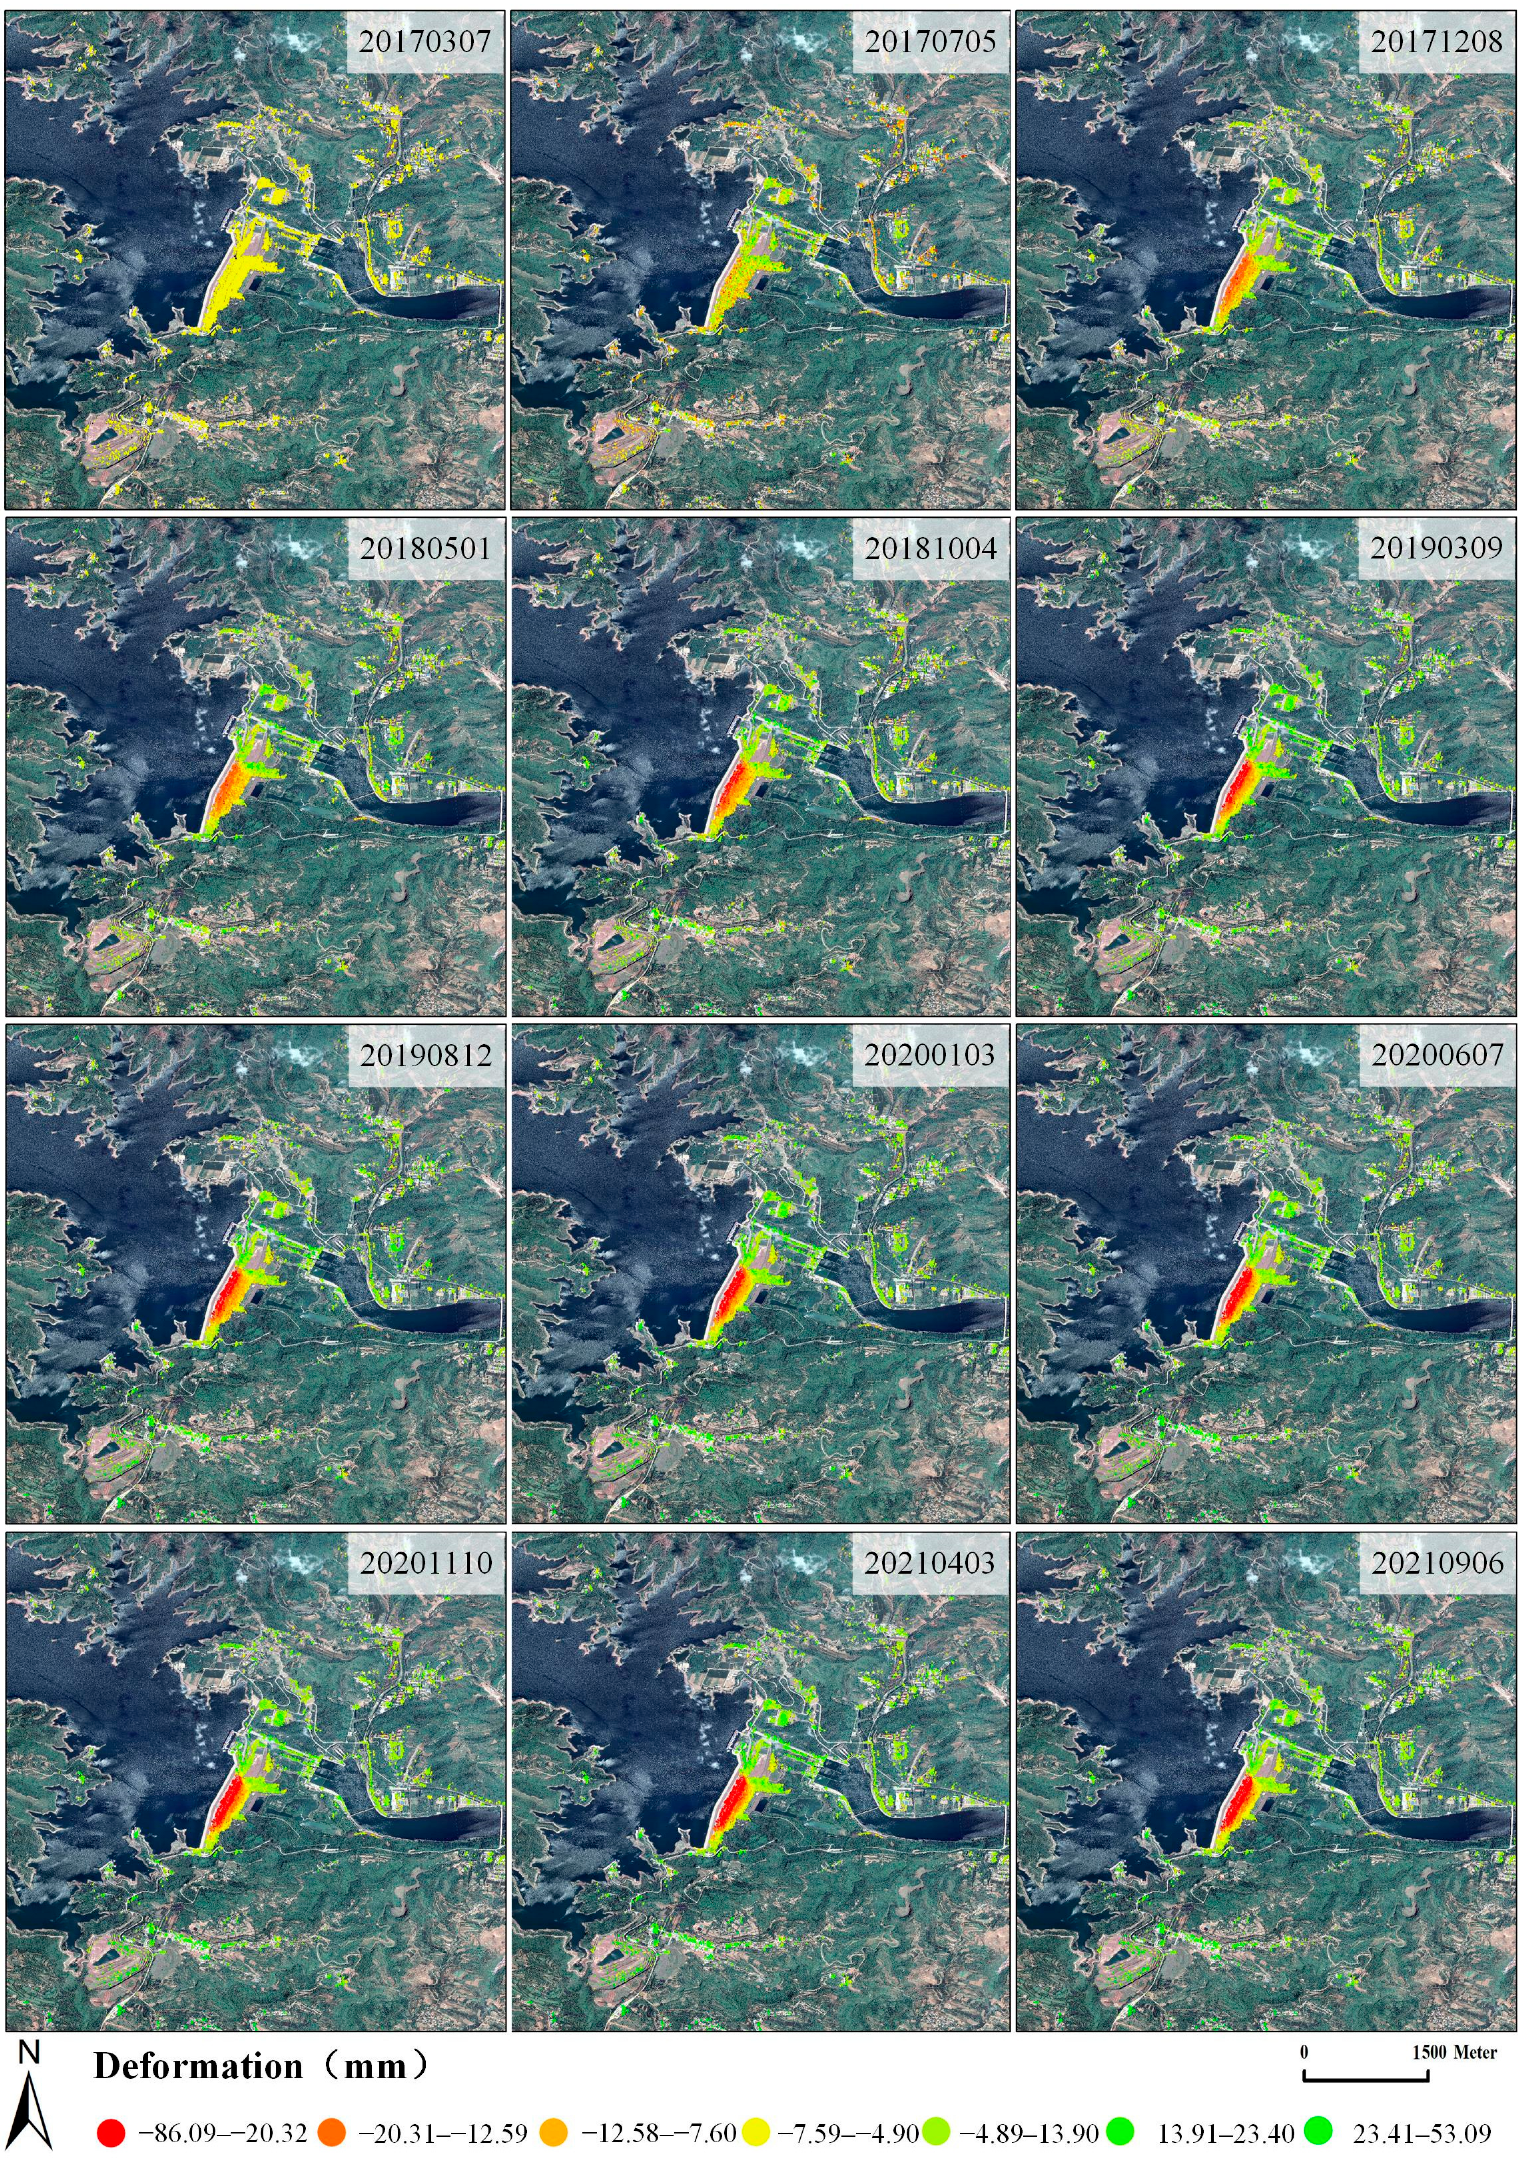
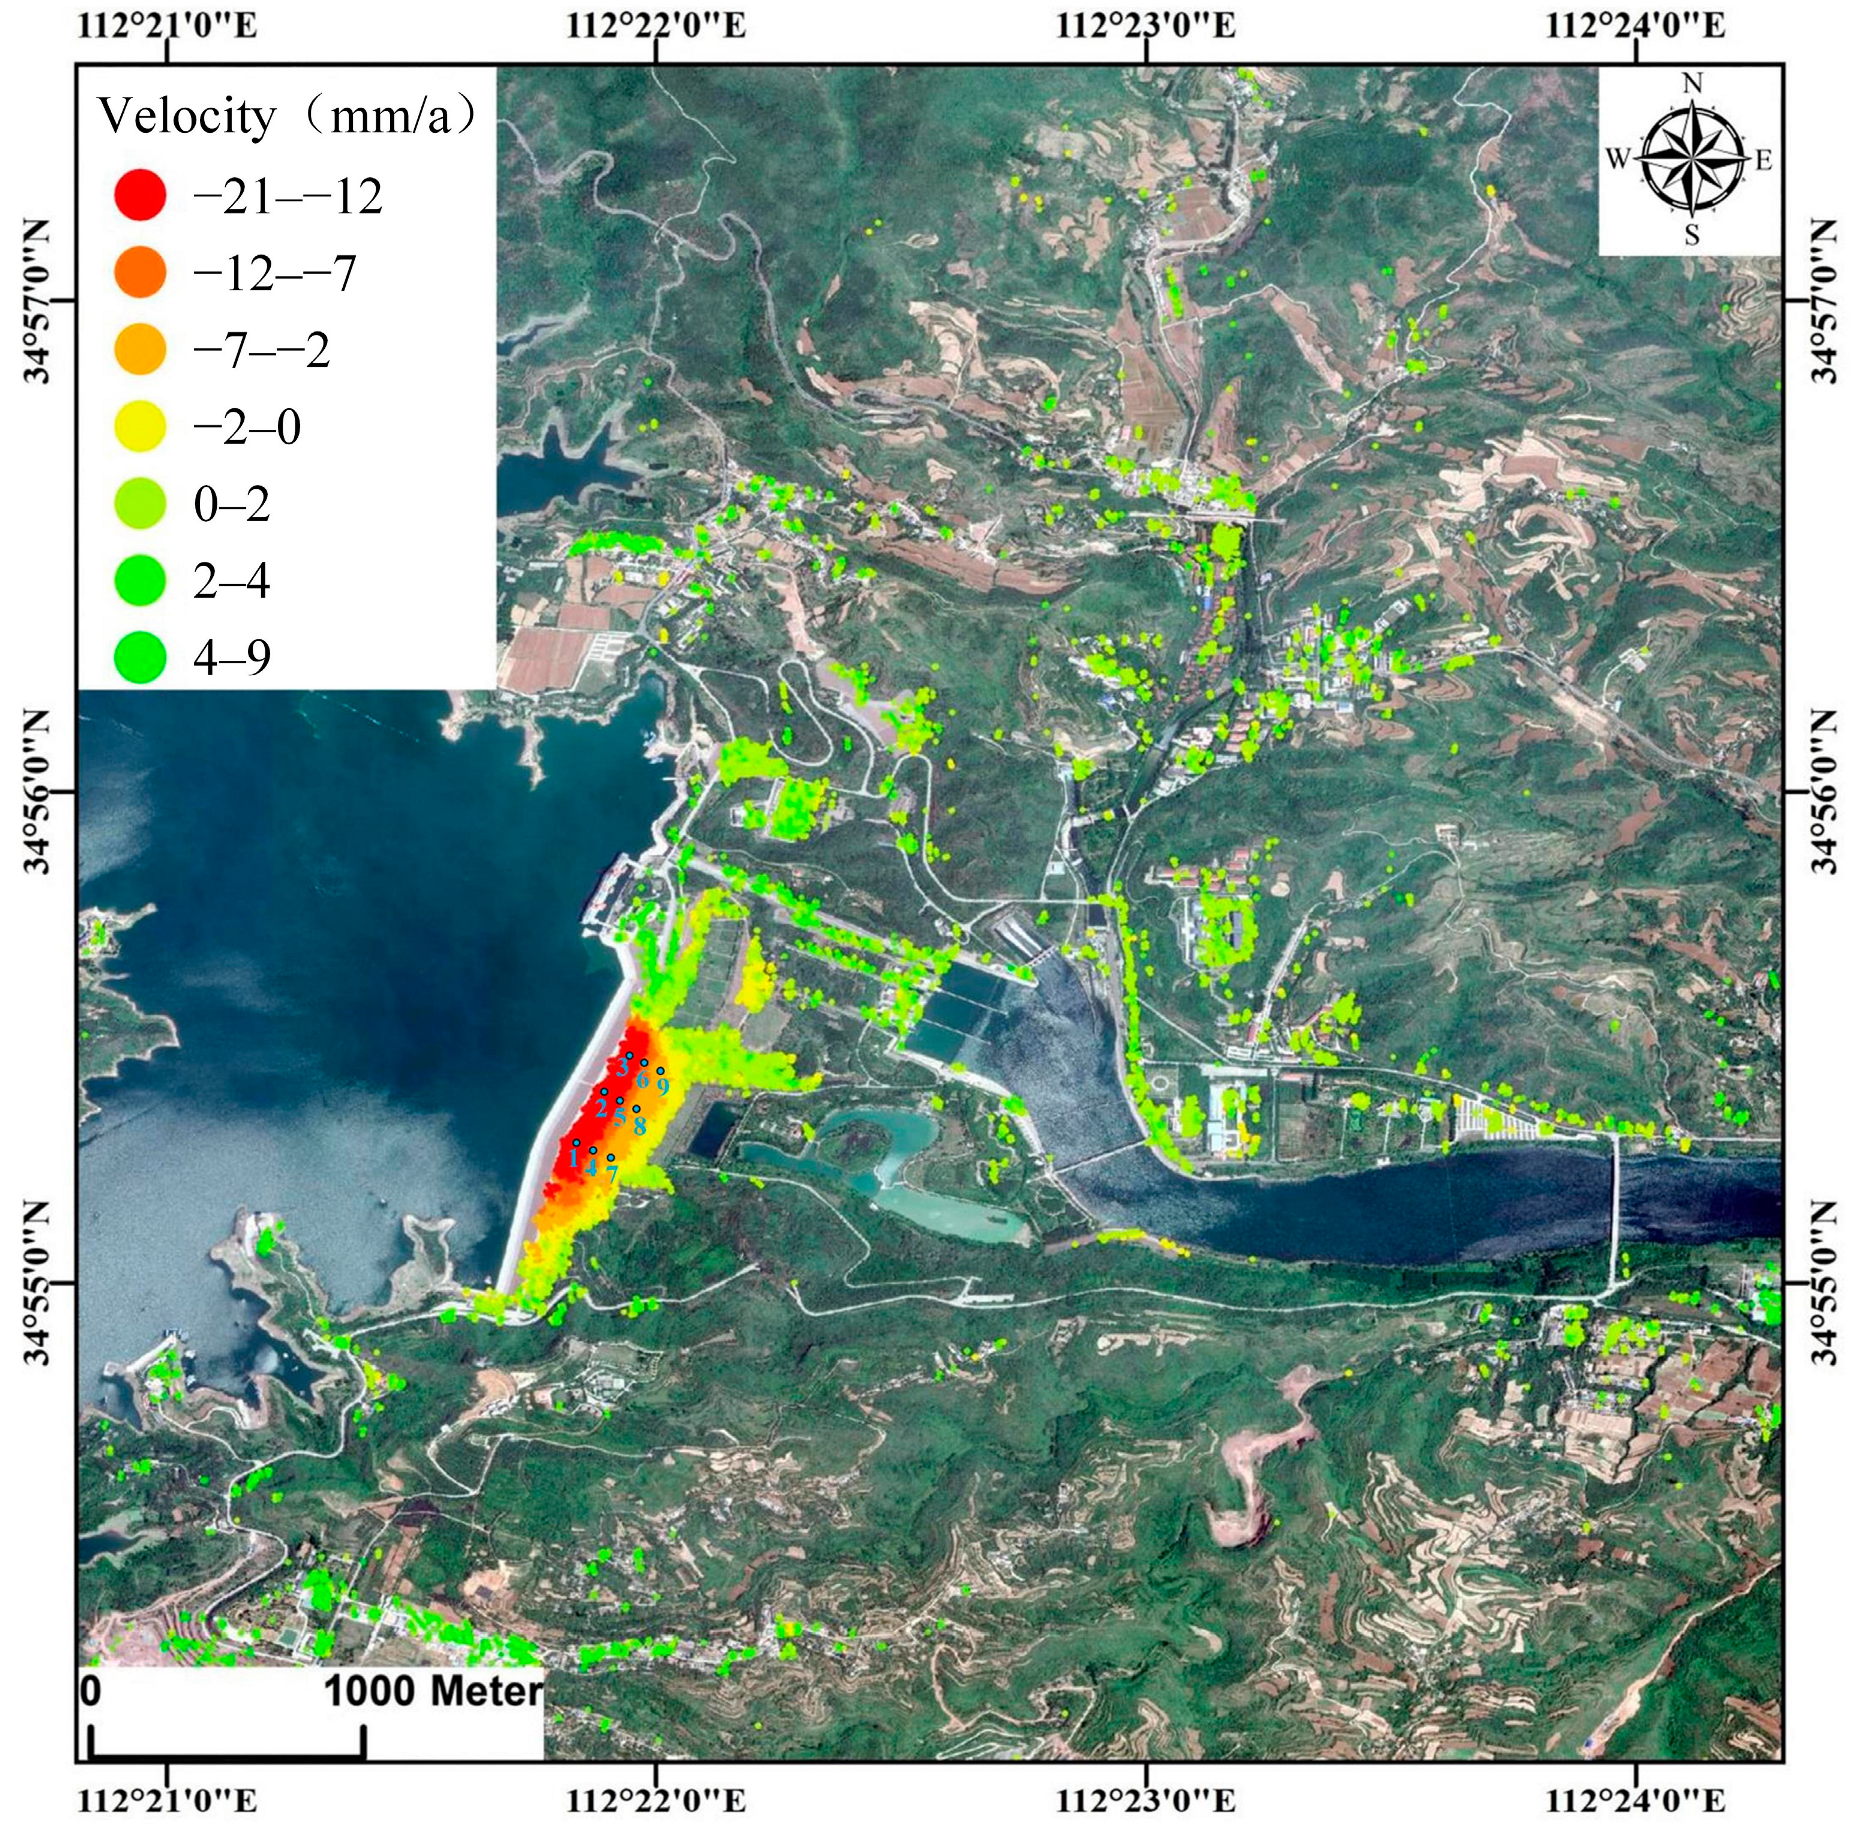
4. Results
5. Discussion
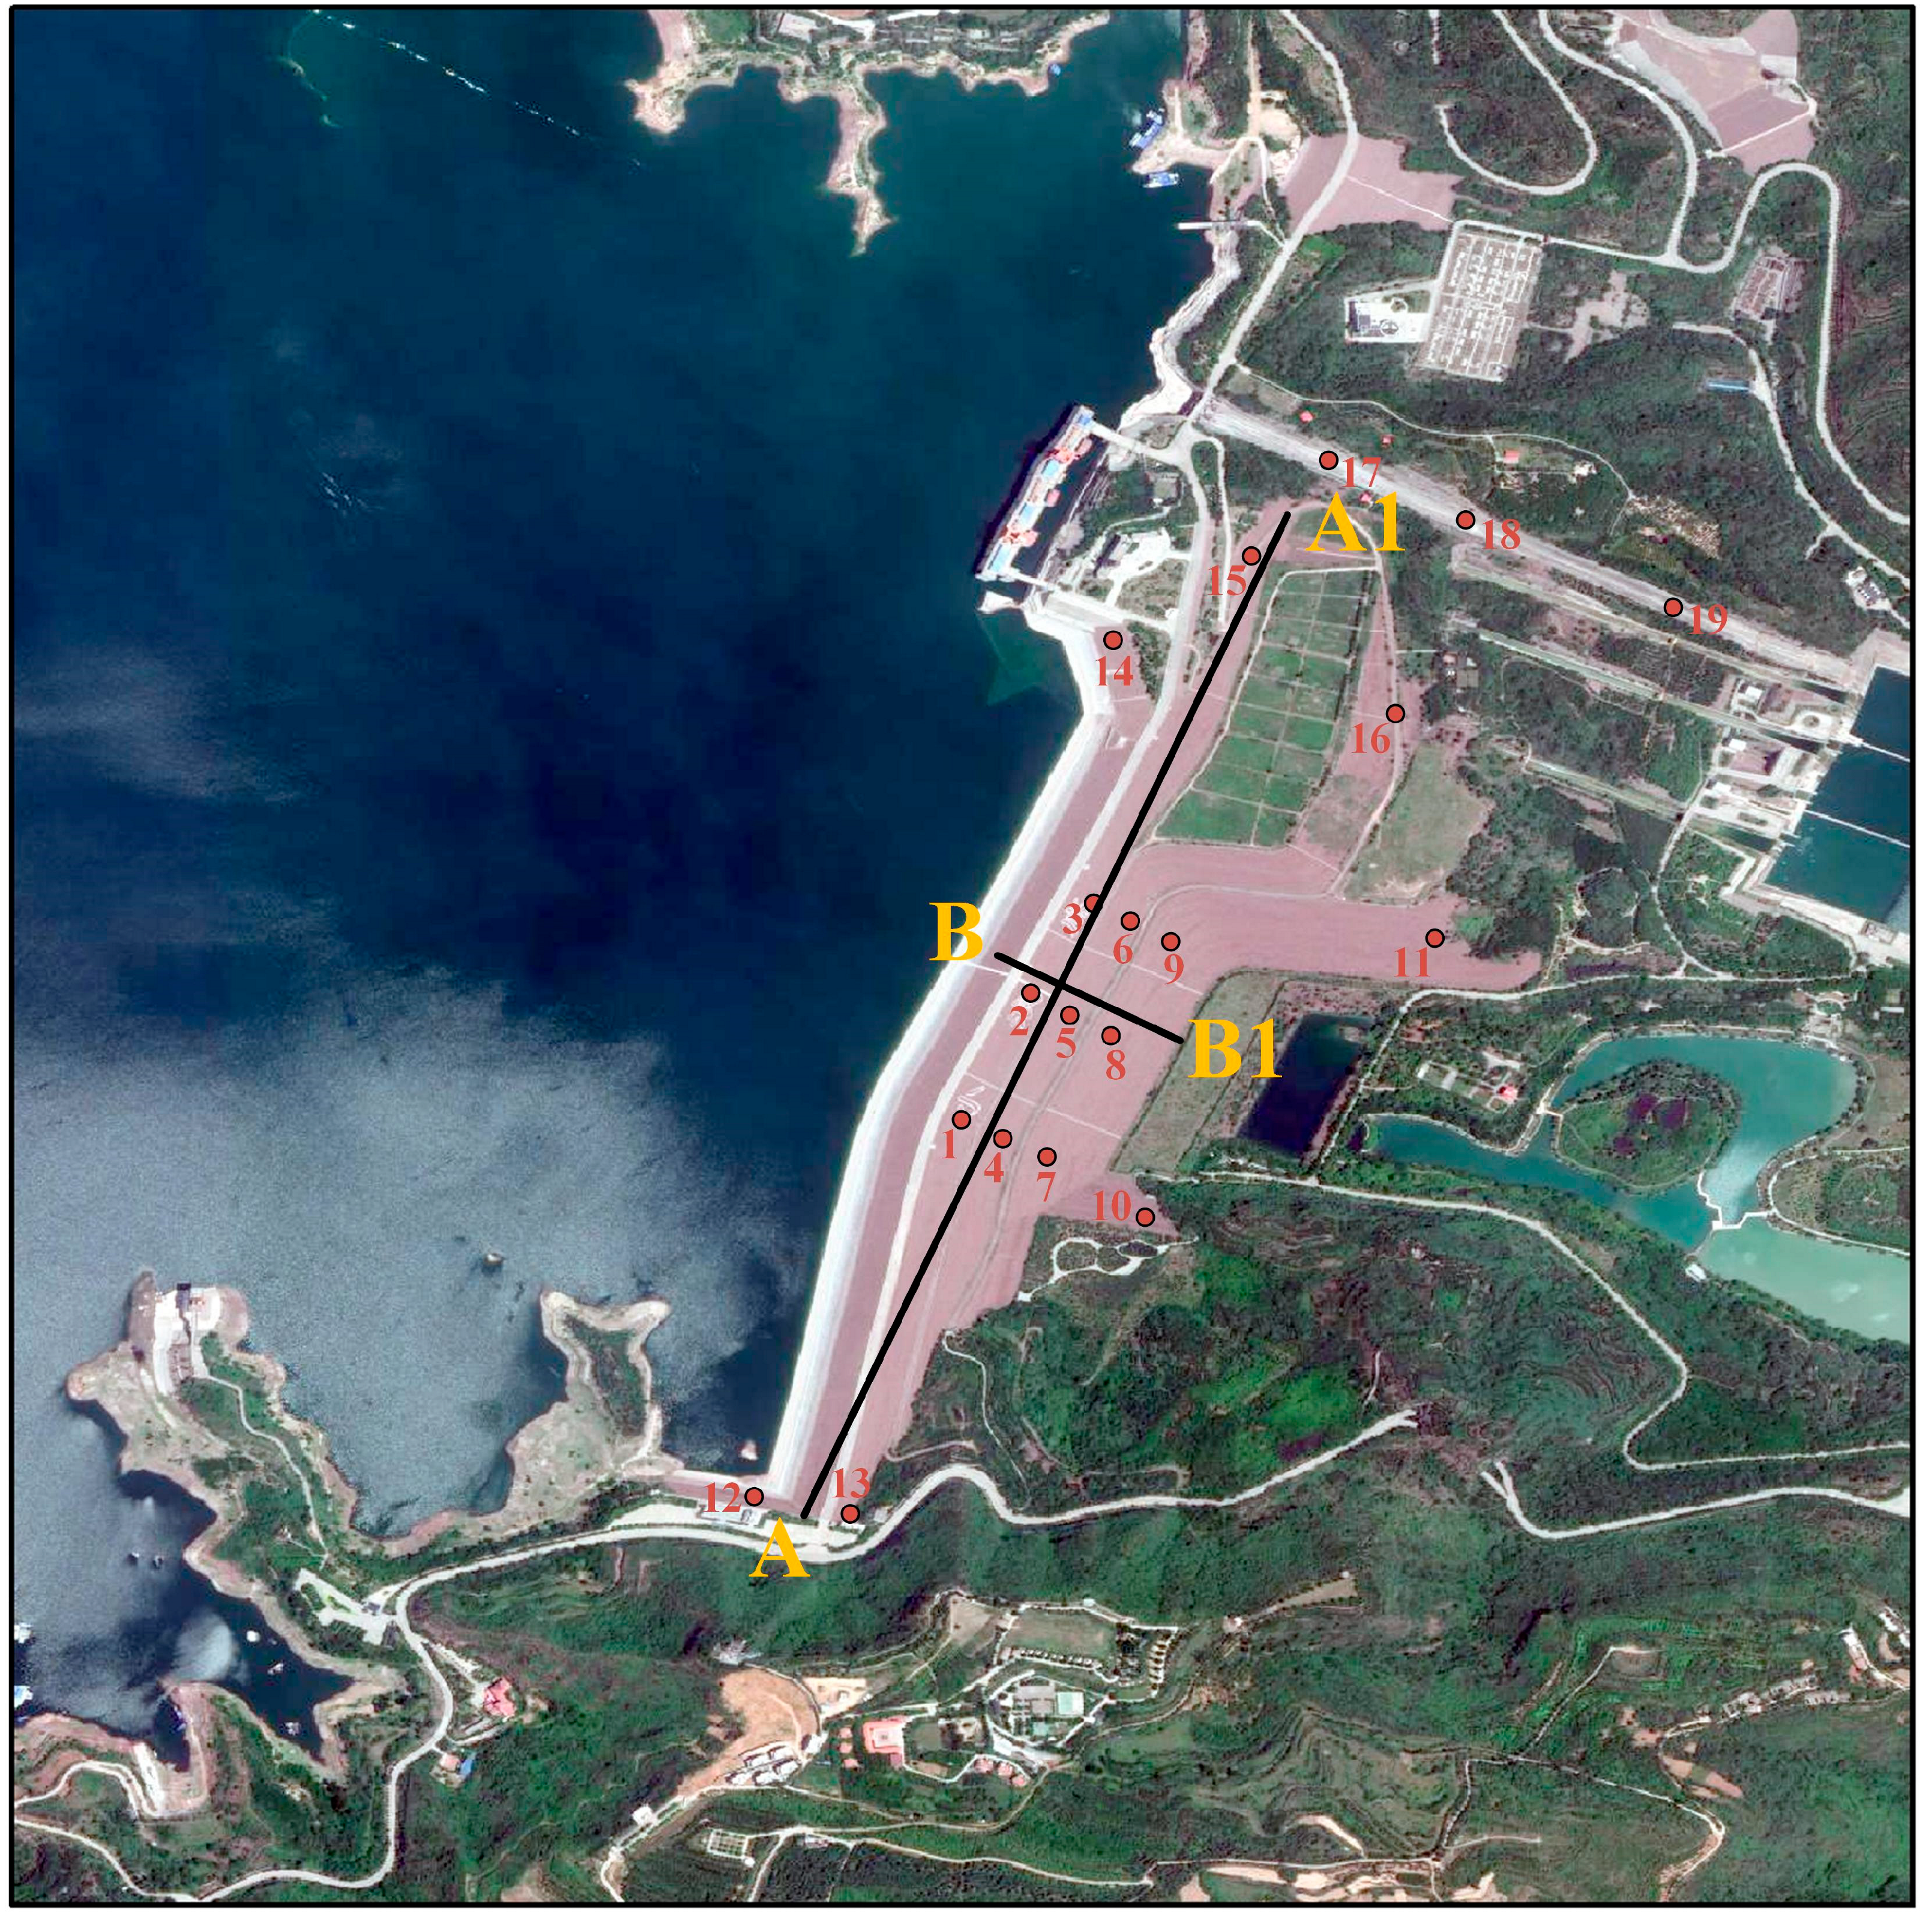
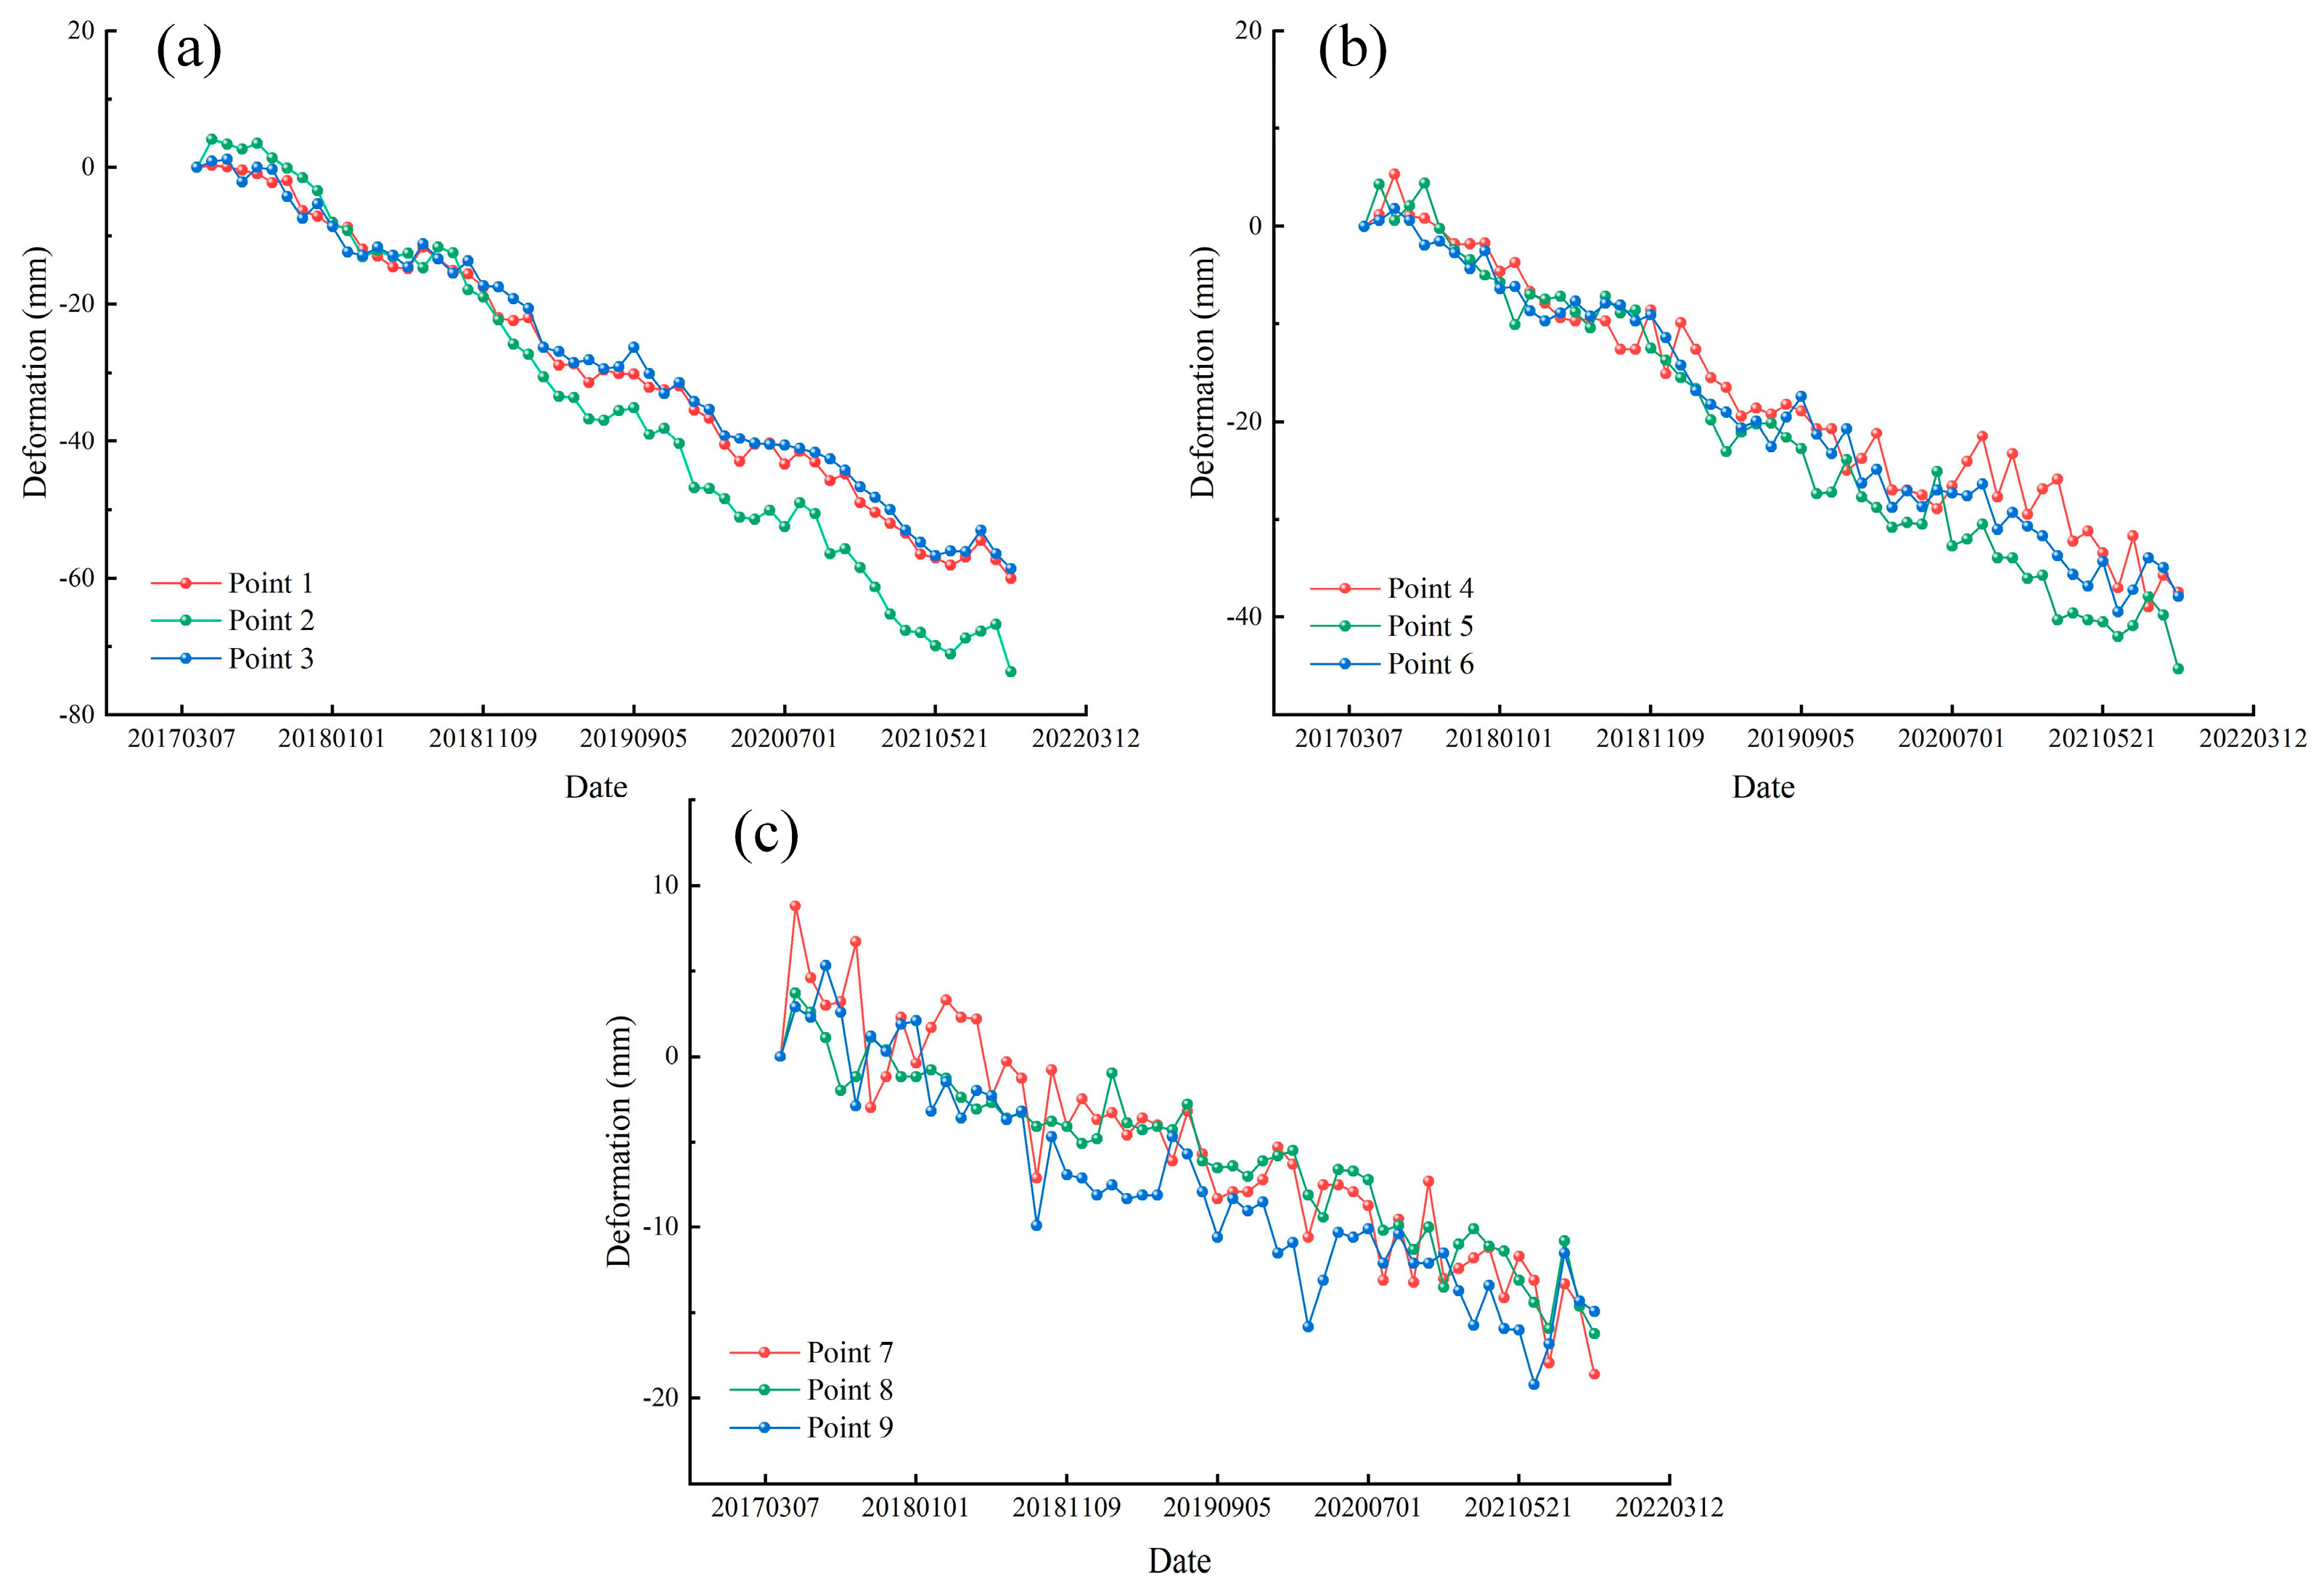
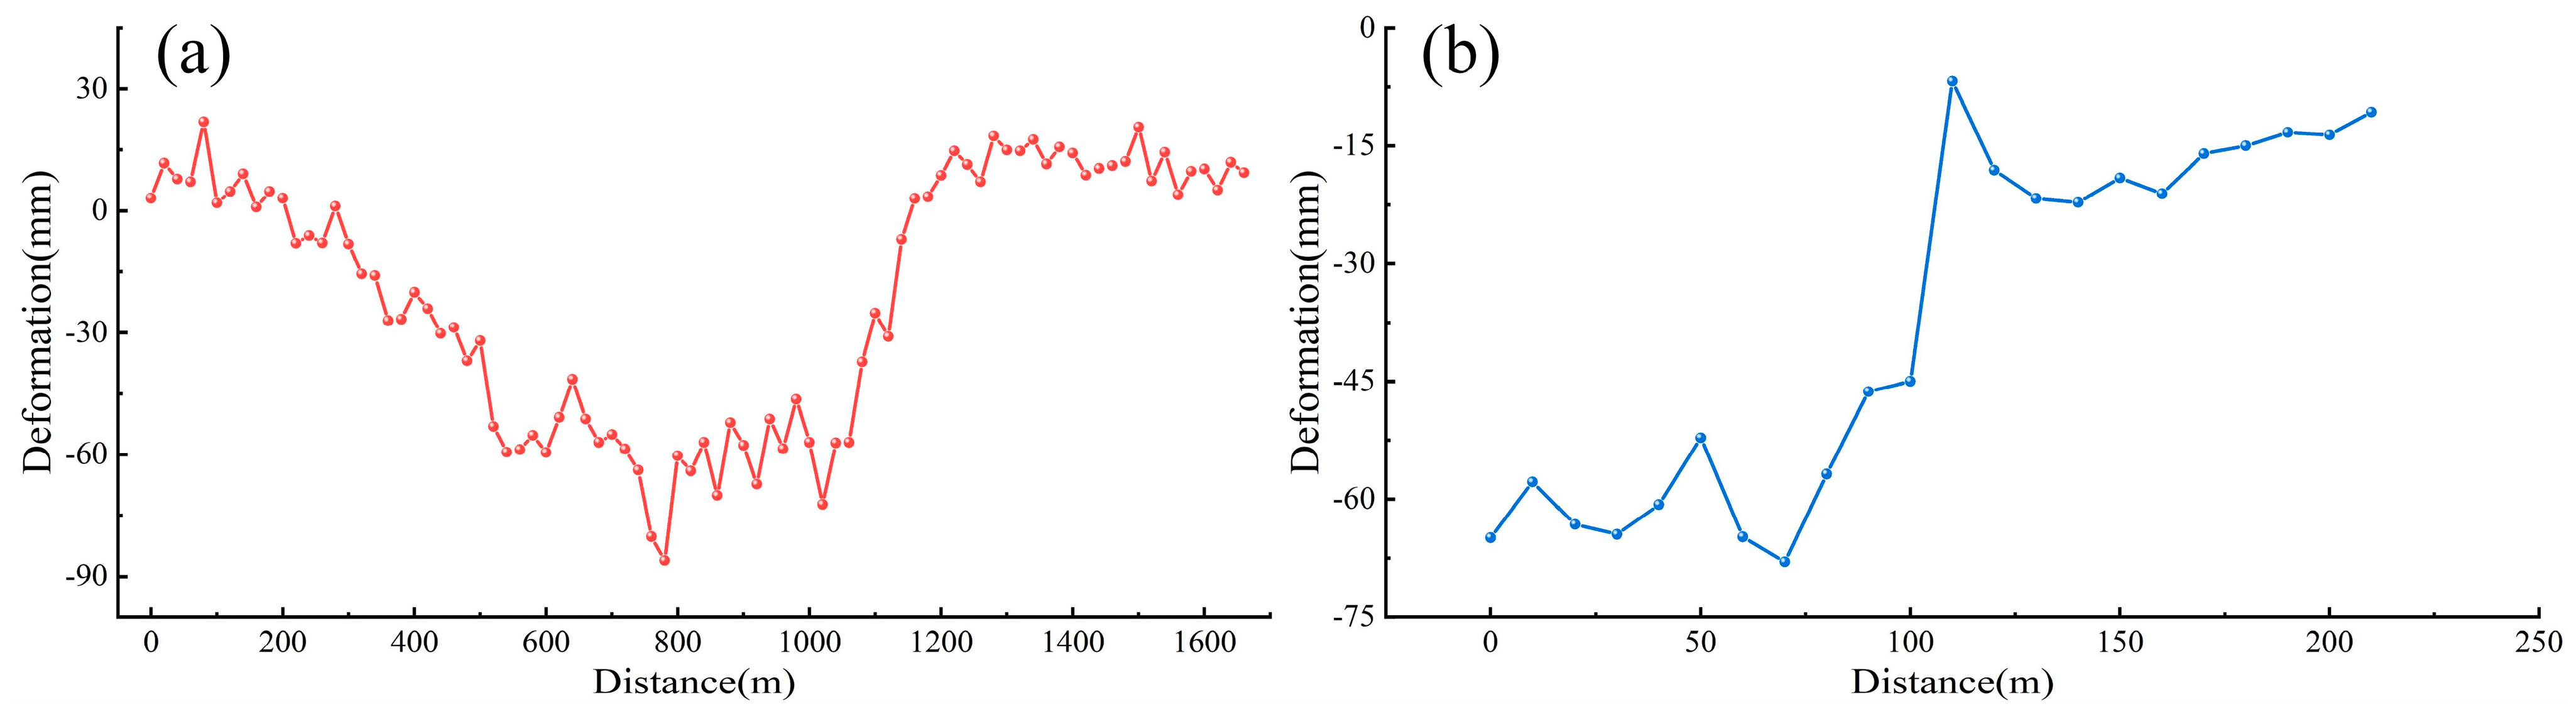
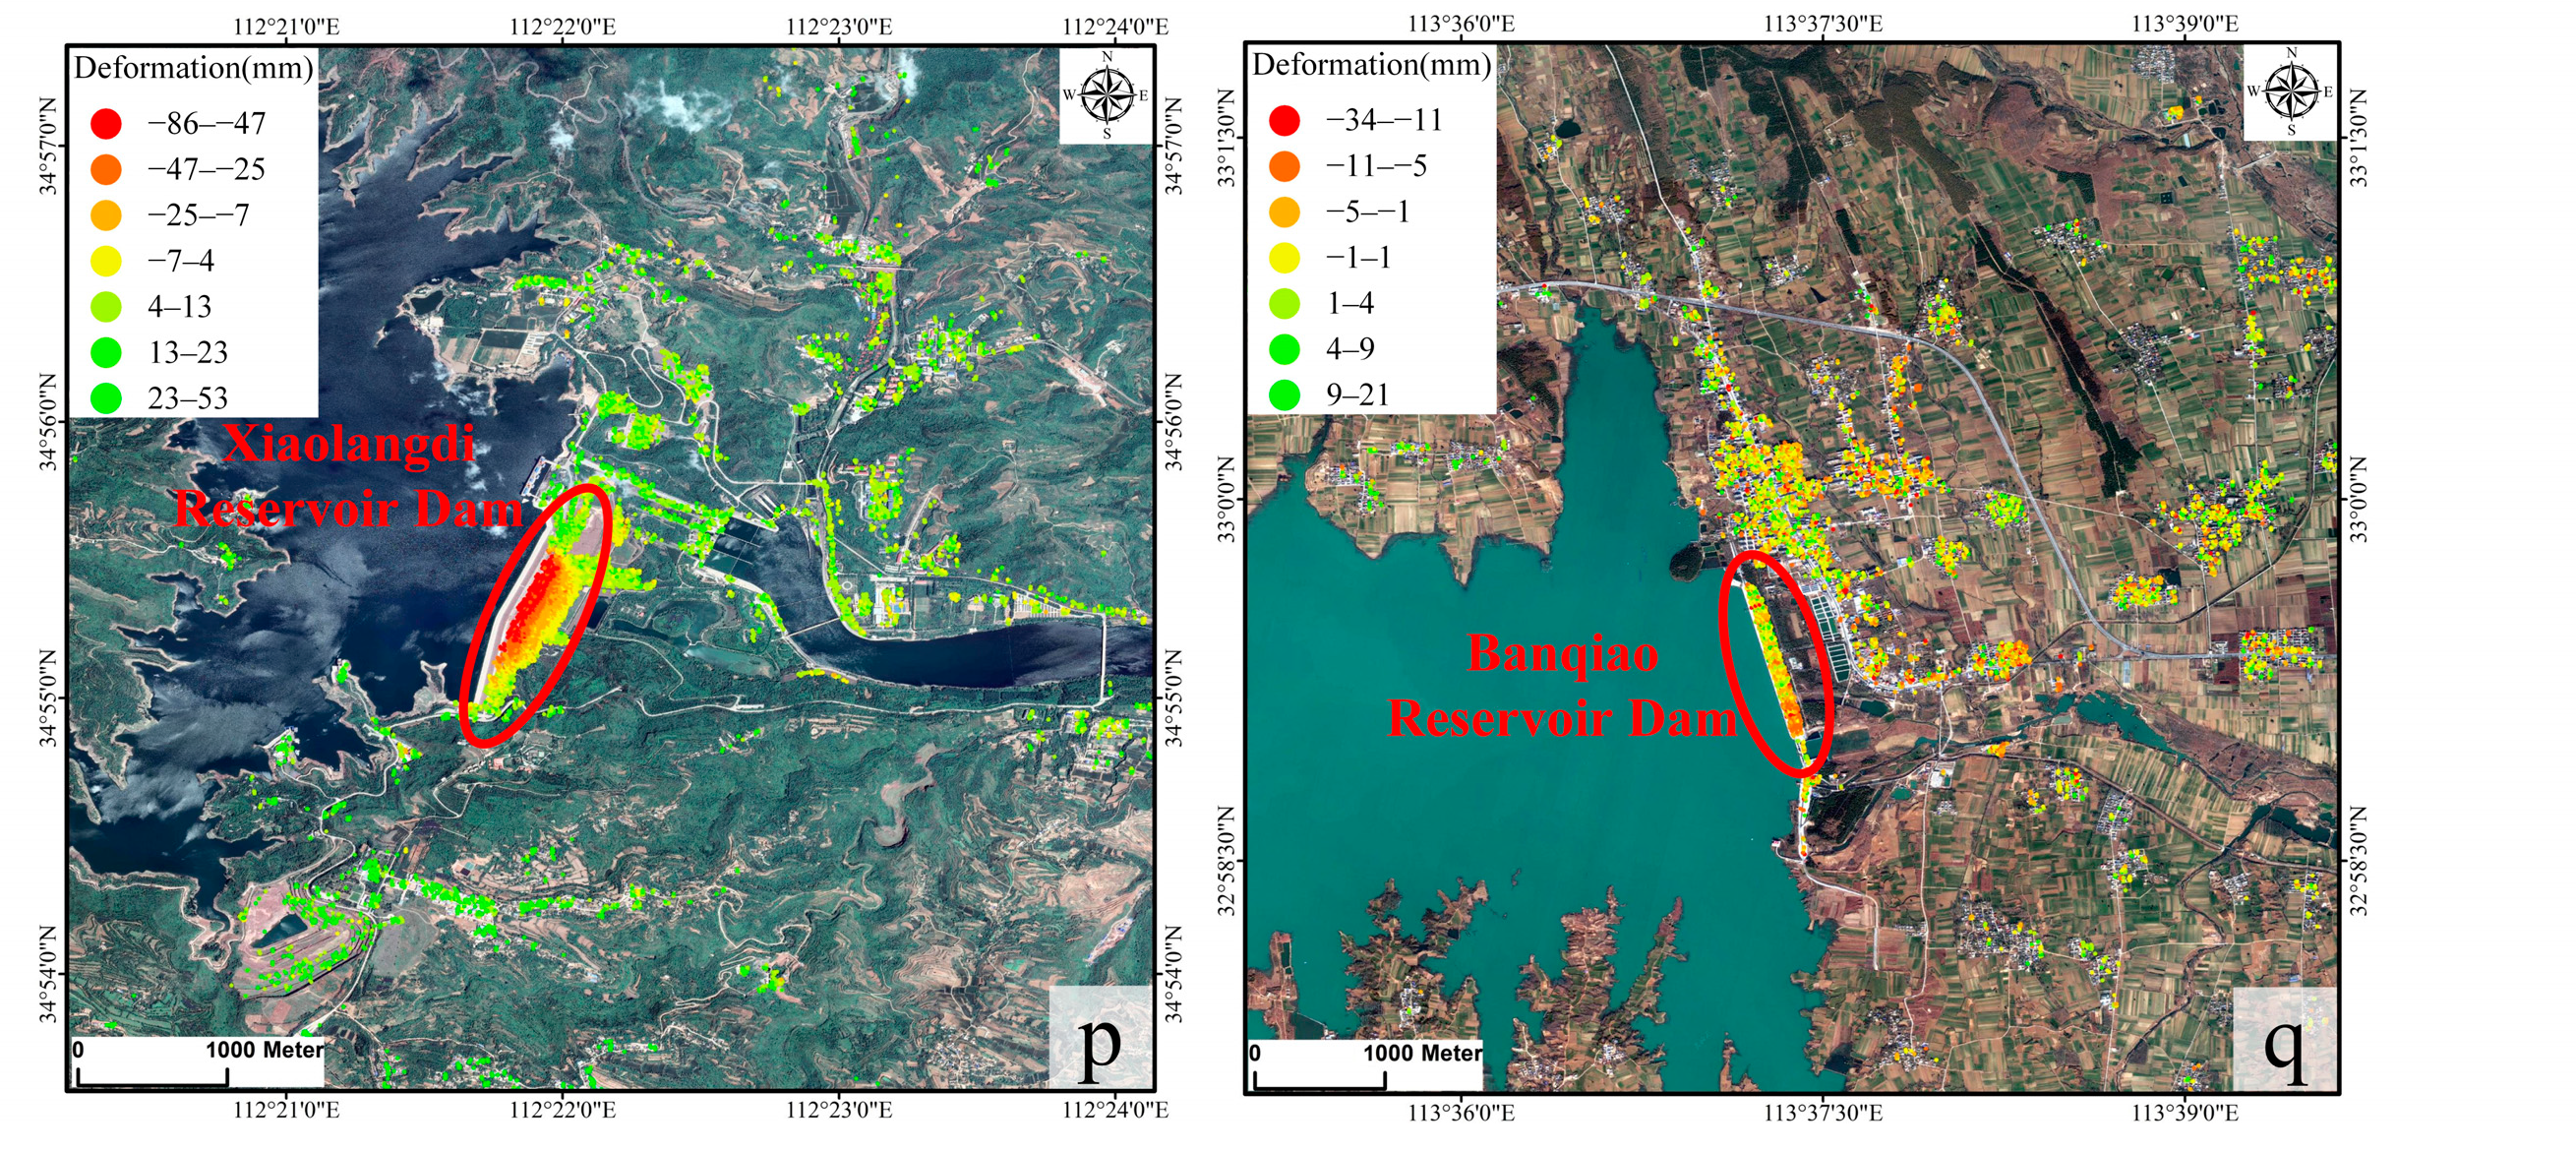
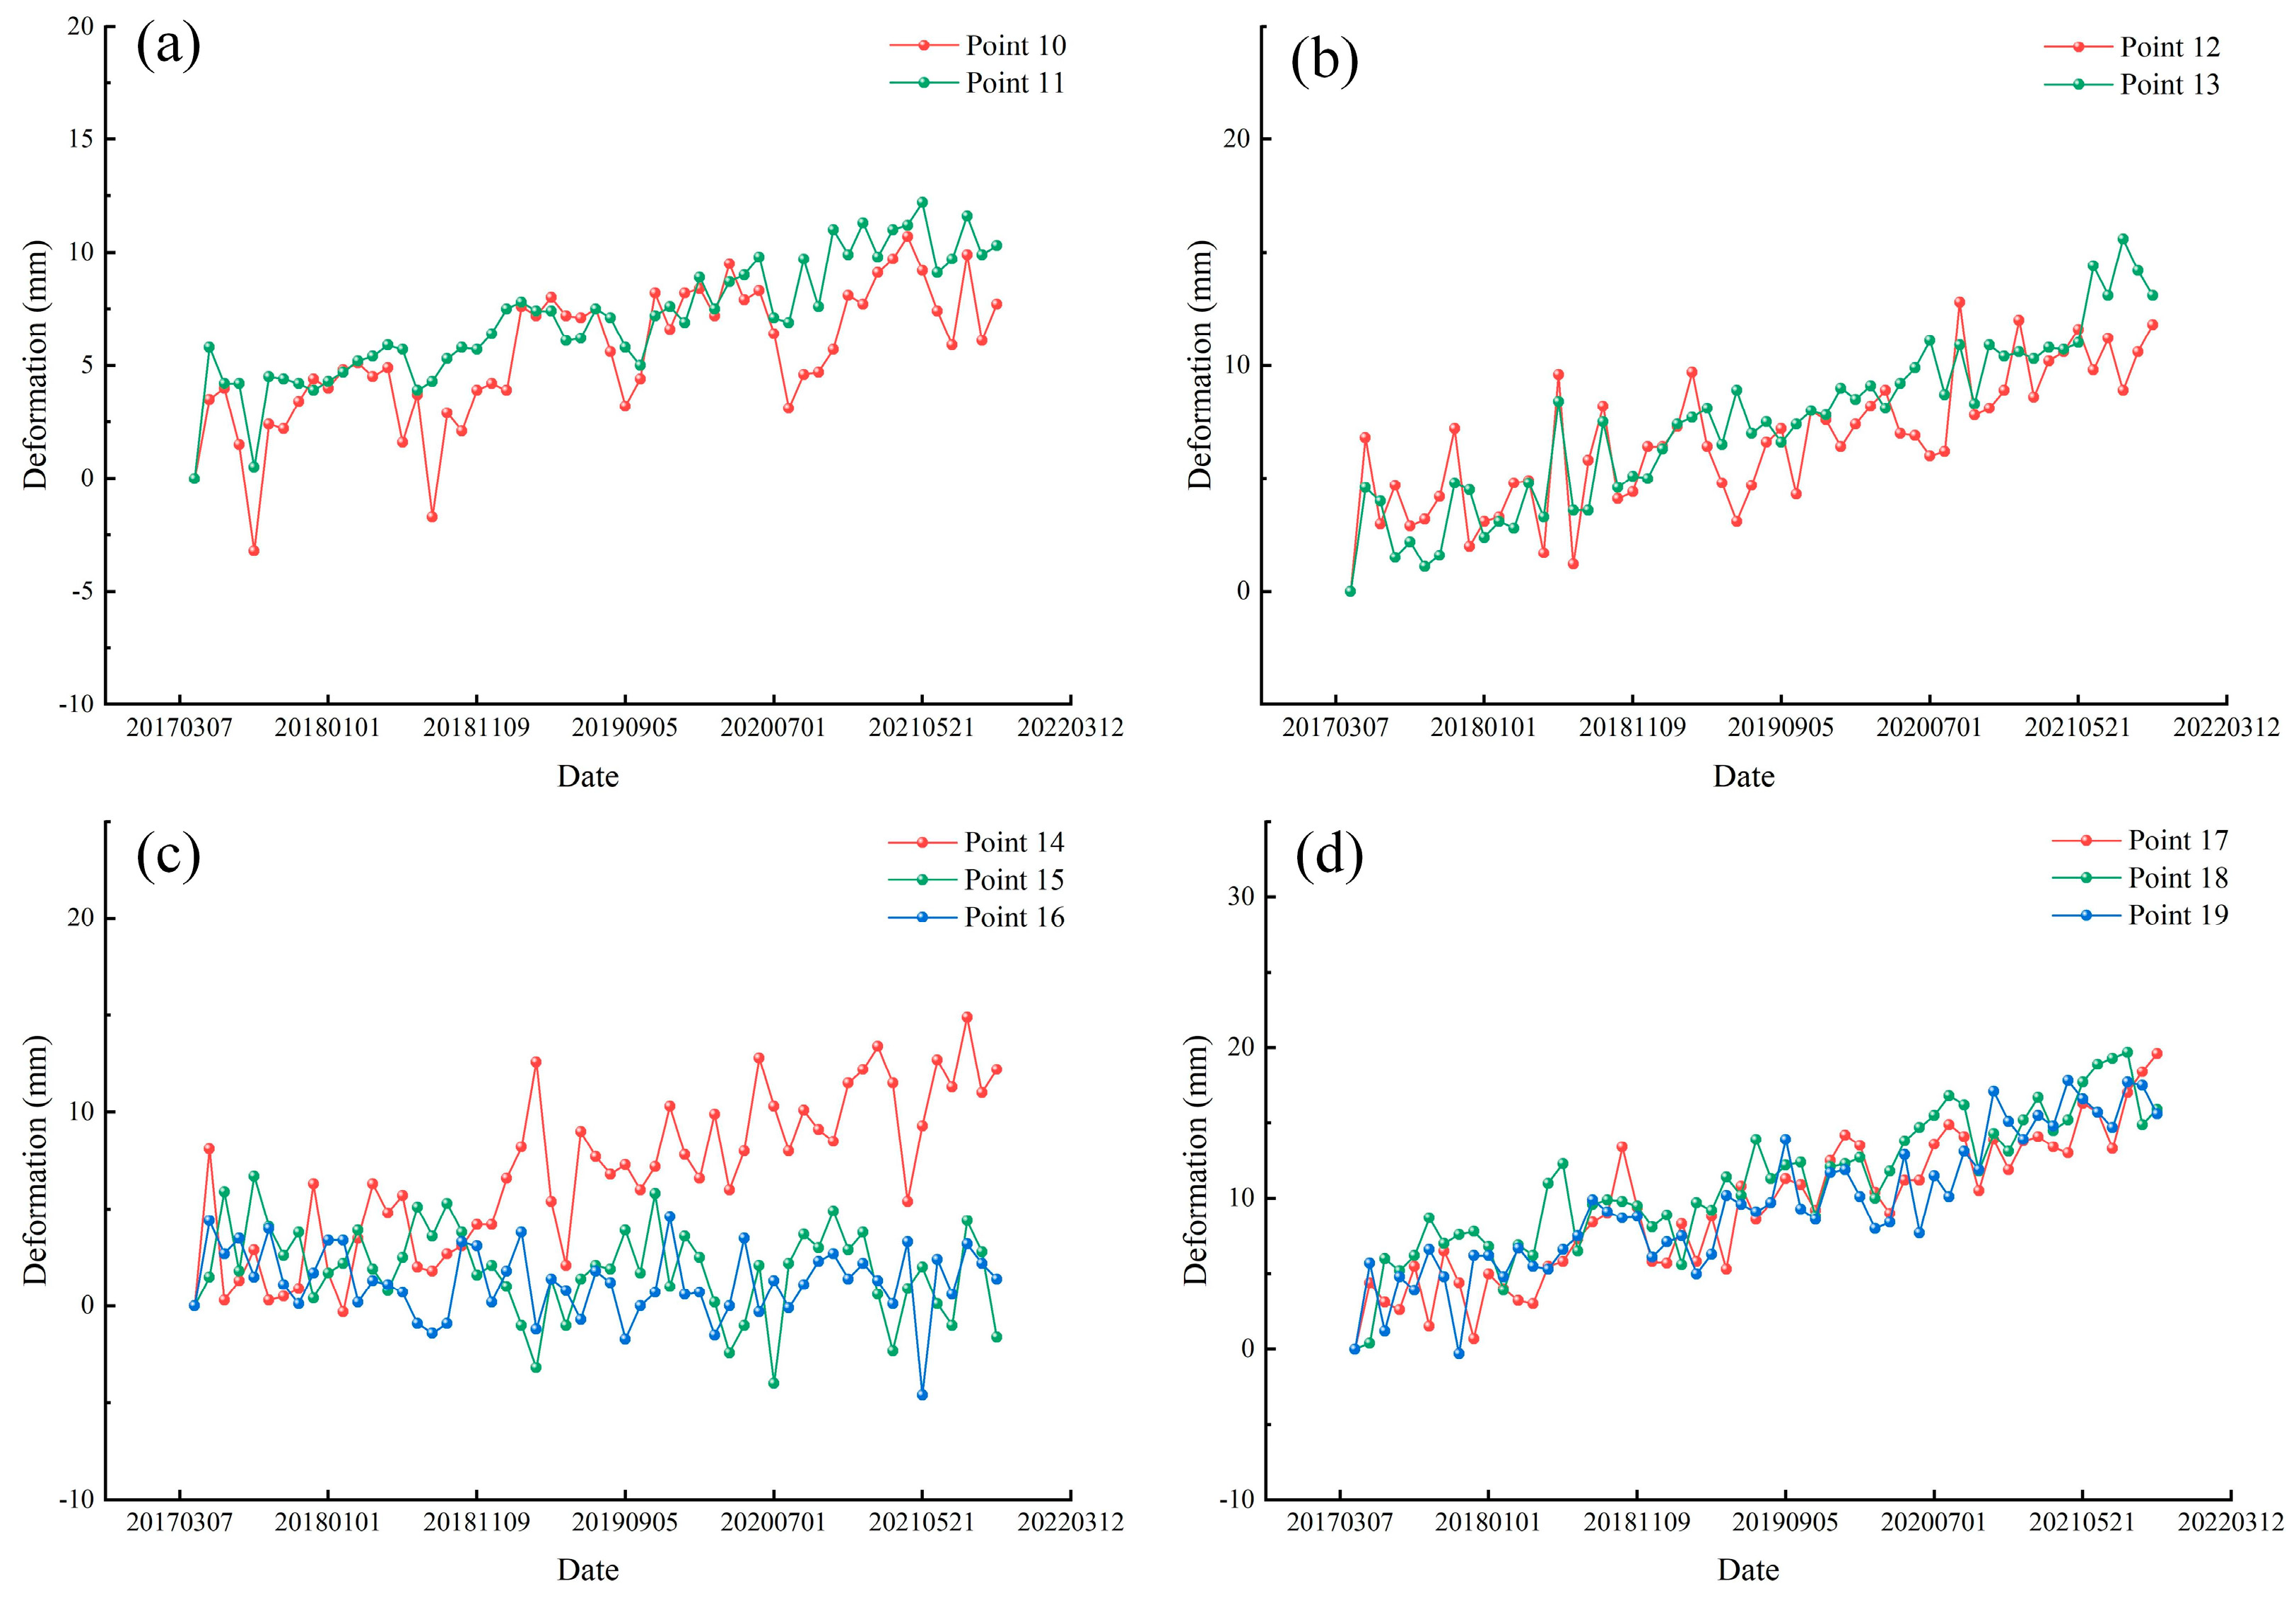
5.1. Deformation Monitoring Analysis of Xiaolangdi Soil and Rockfill Dam
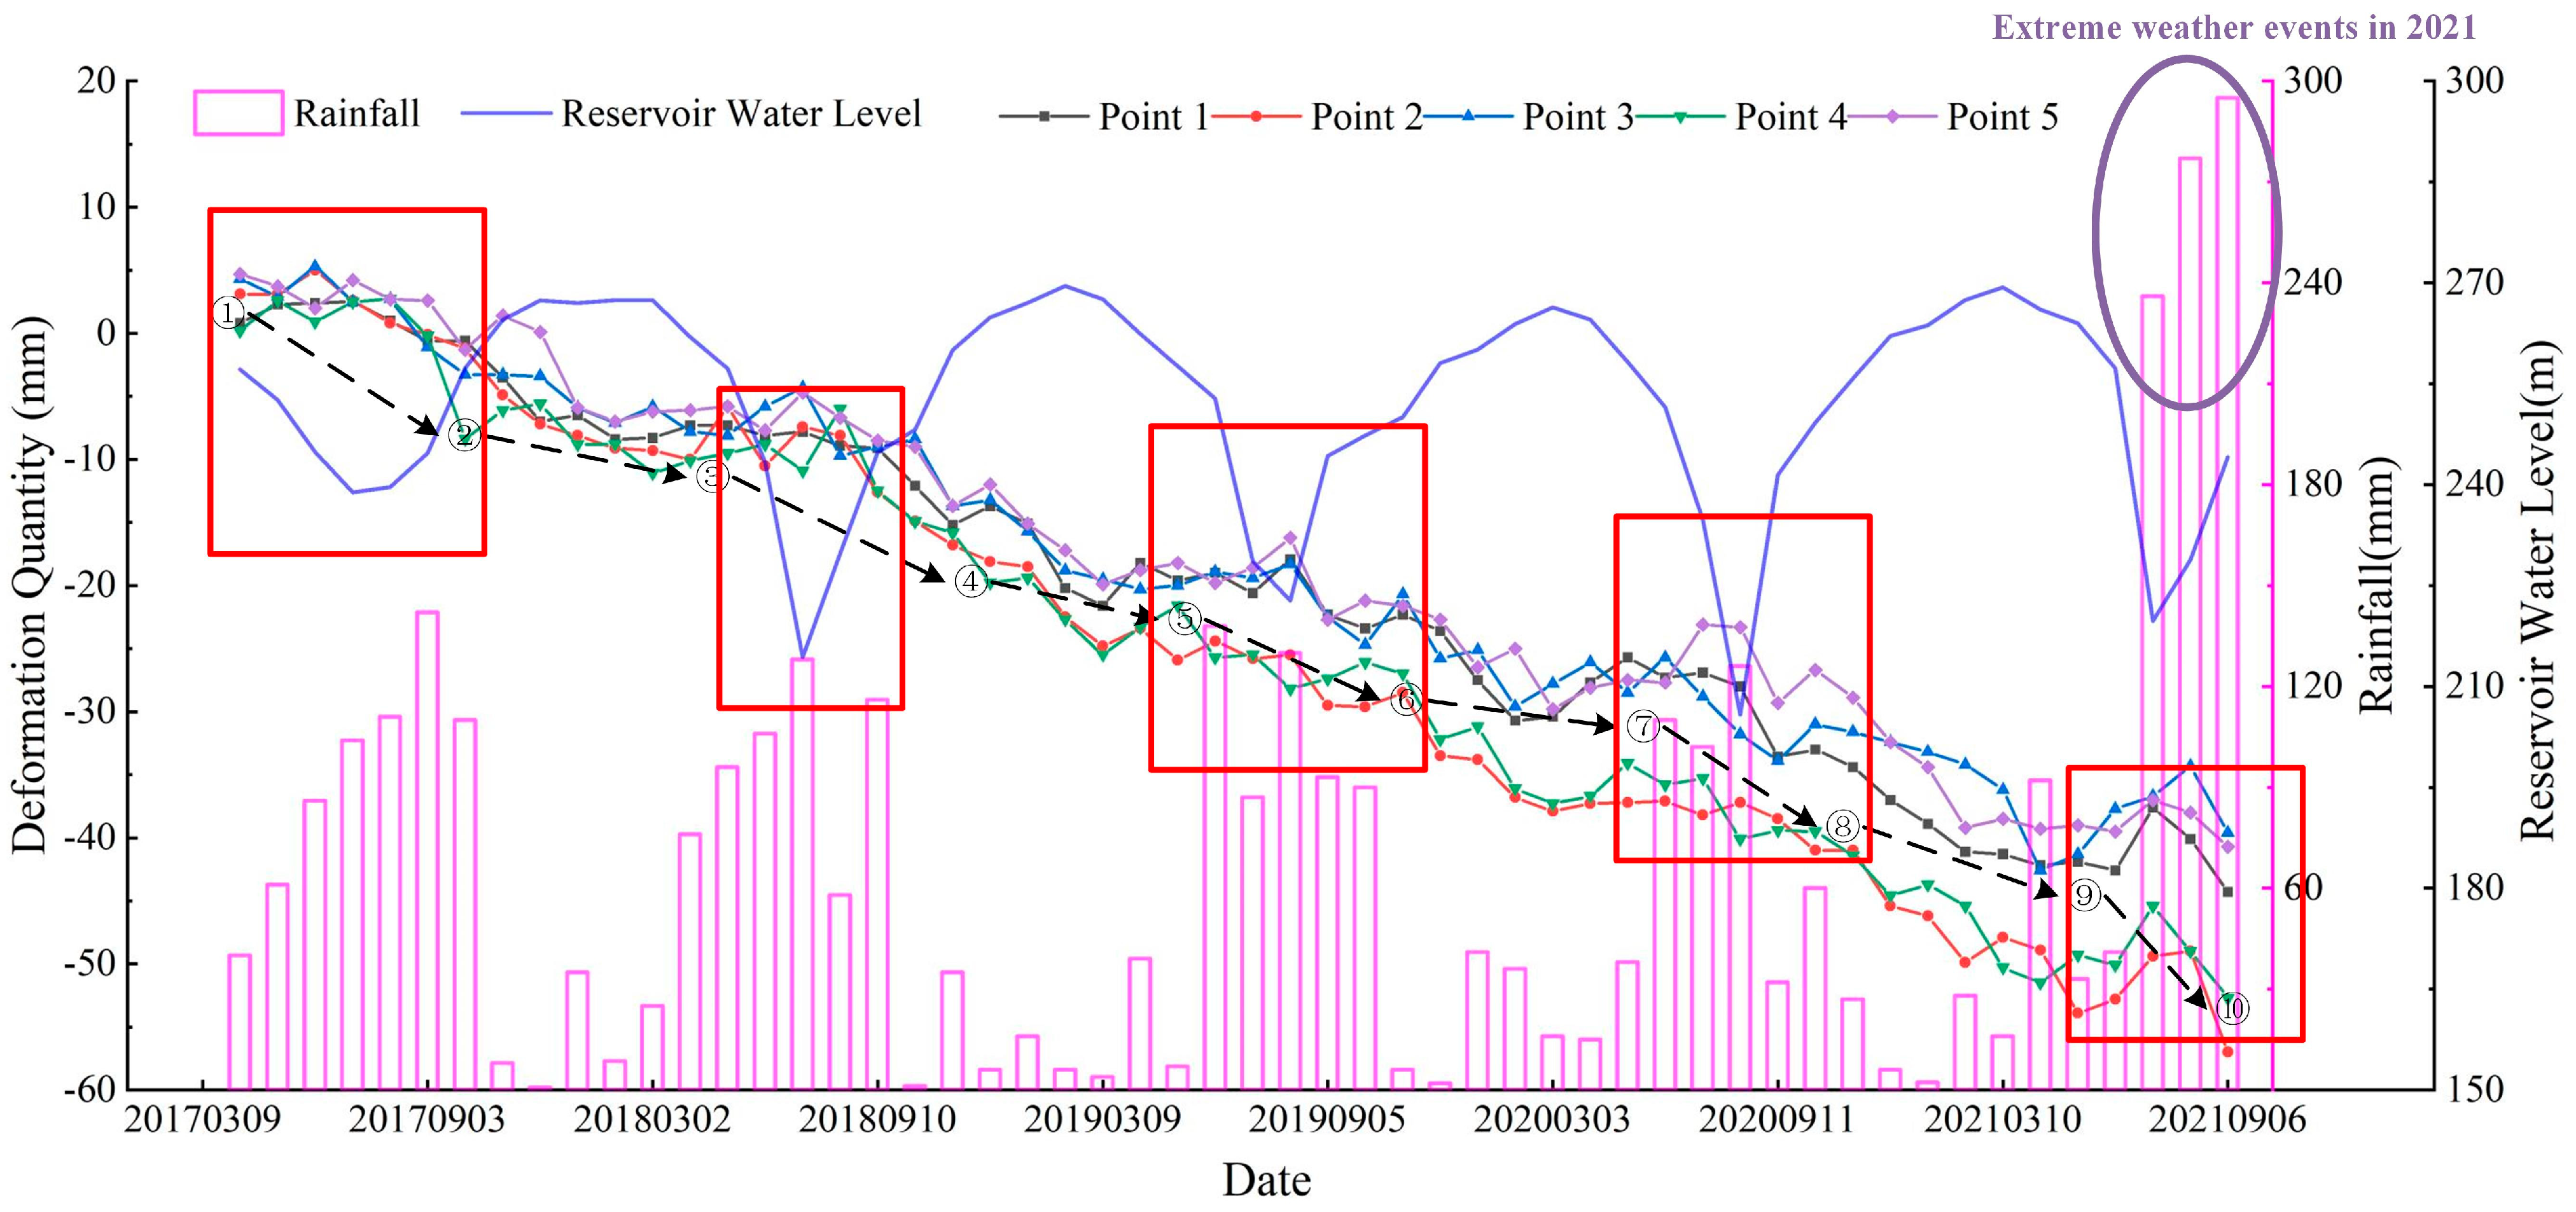
5.2. Correlation Analysis of Reservoir Water Level, Rainfall and Deformation
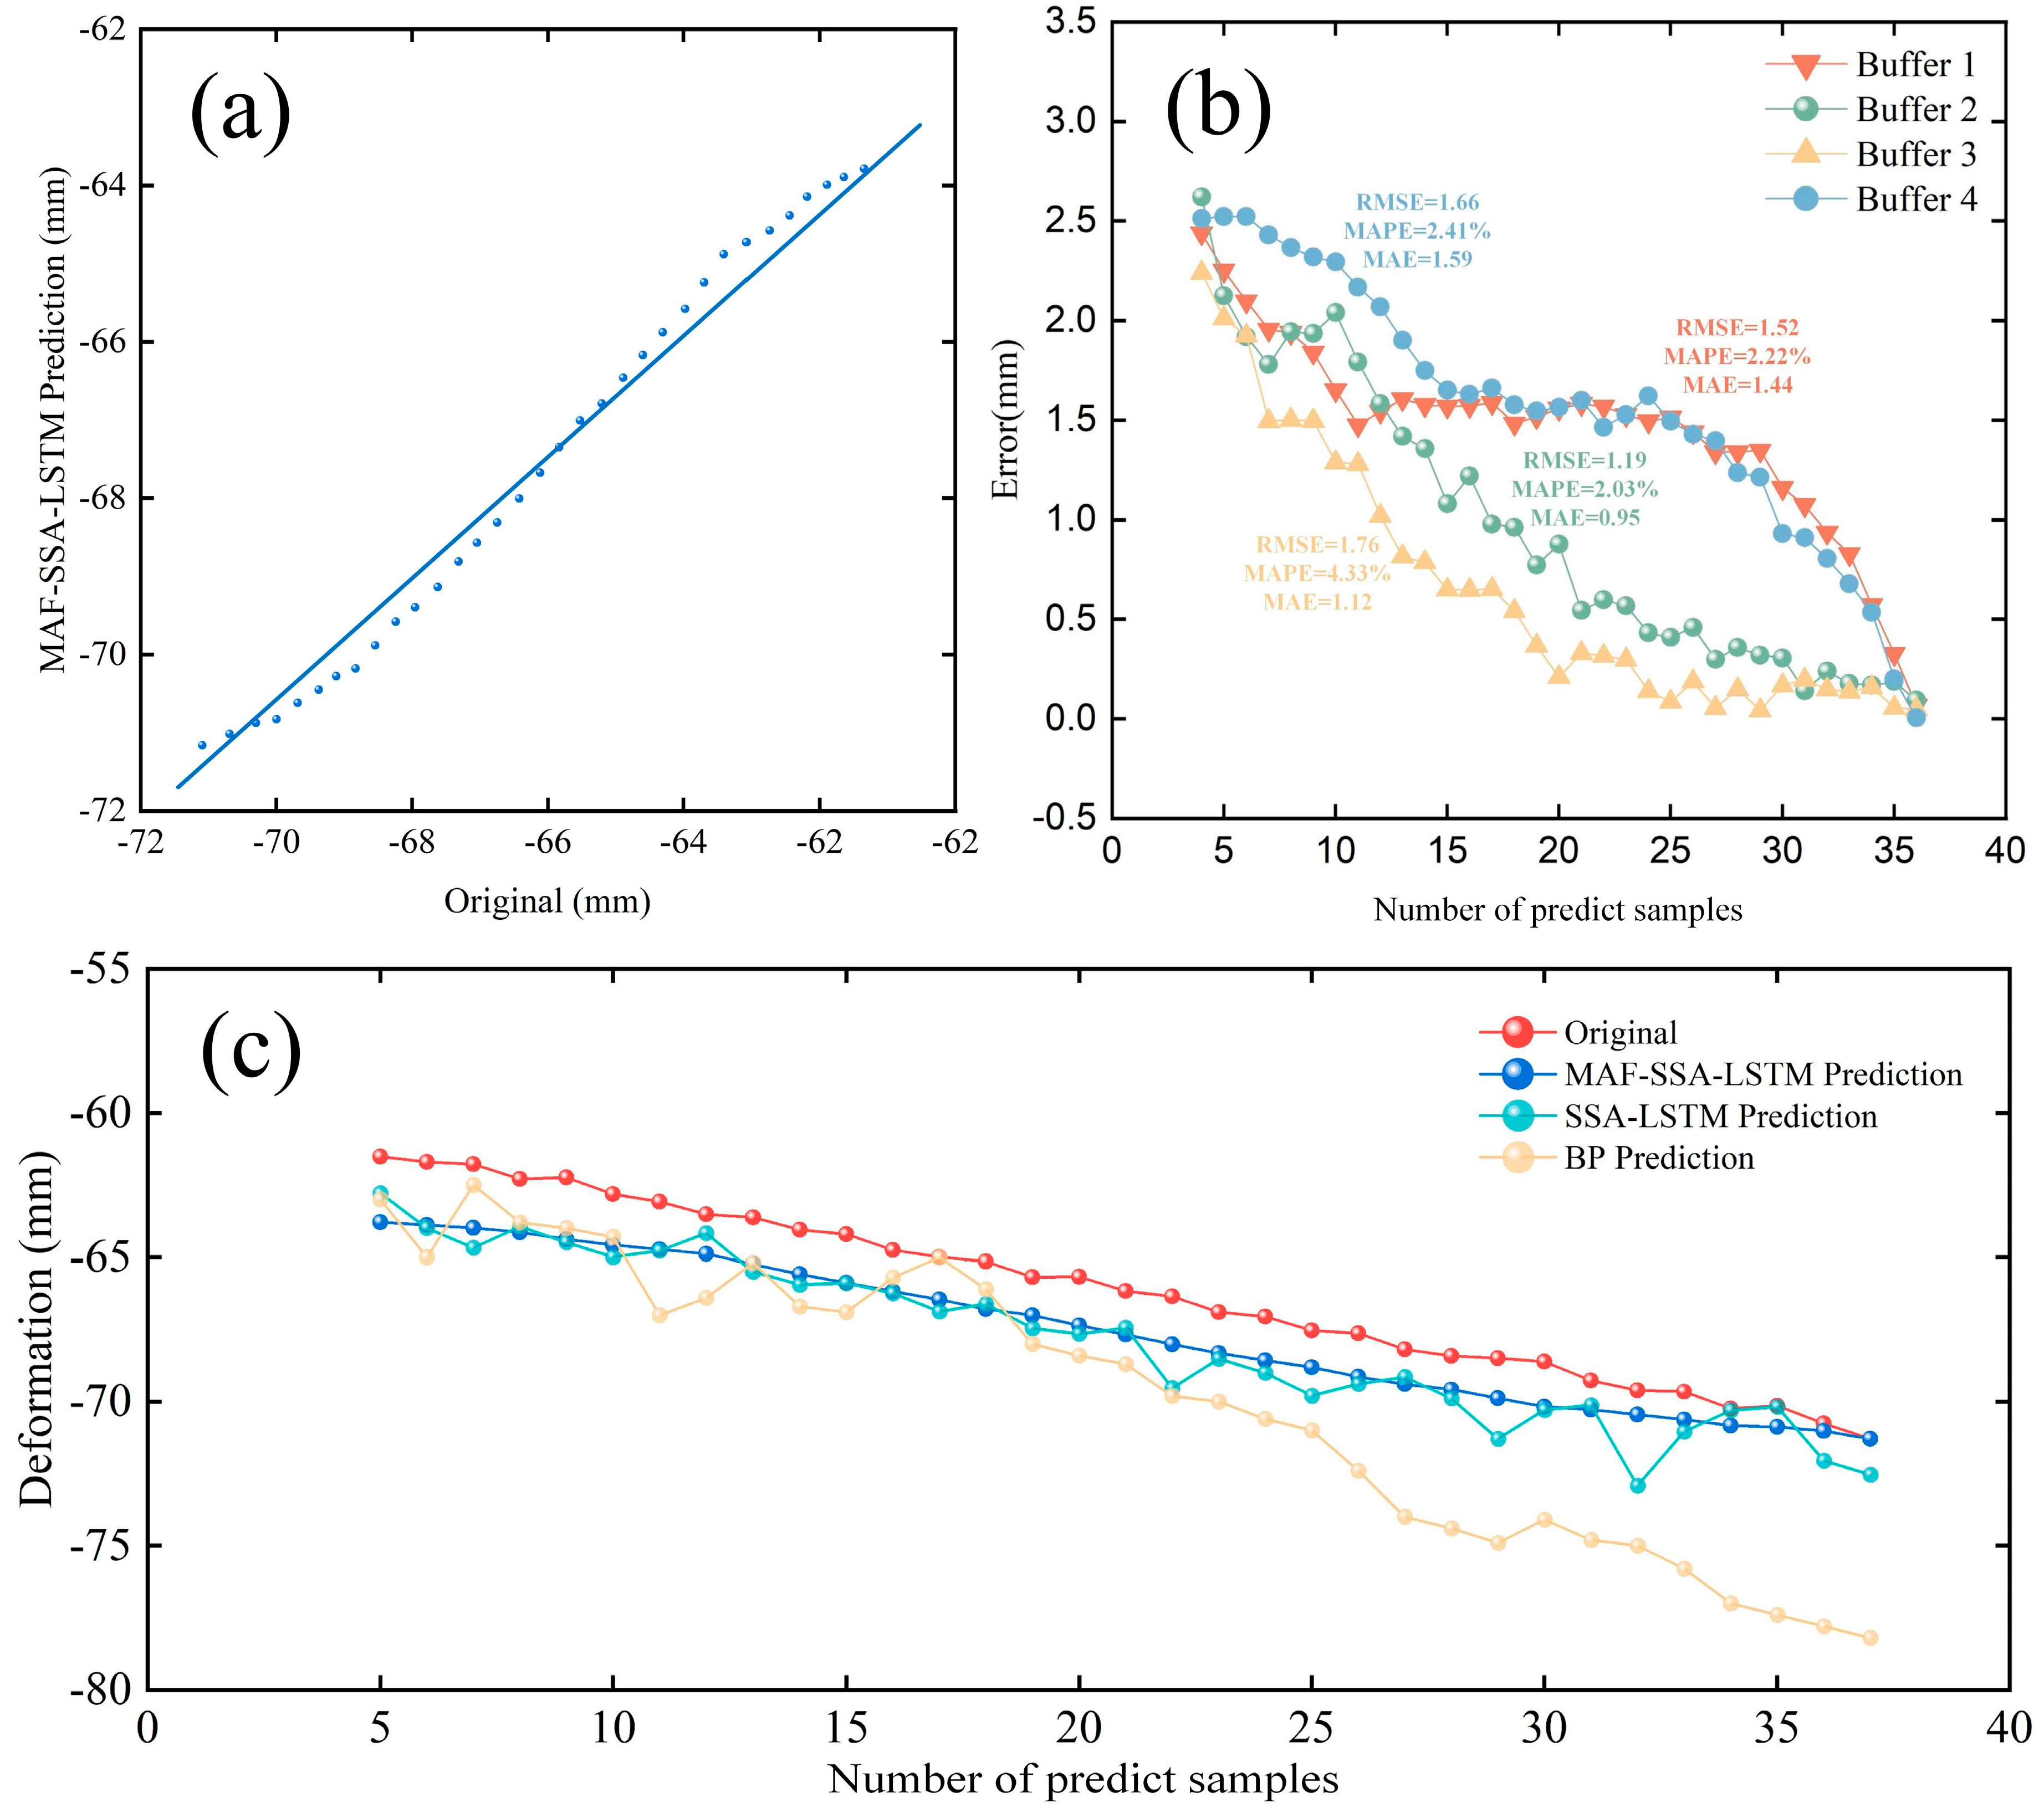
5.3. Results and Accuracy Evaluation of MAF-SSA-LSTM Model
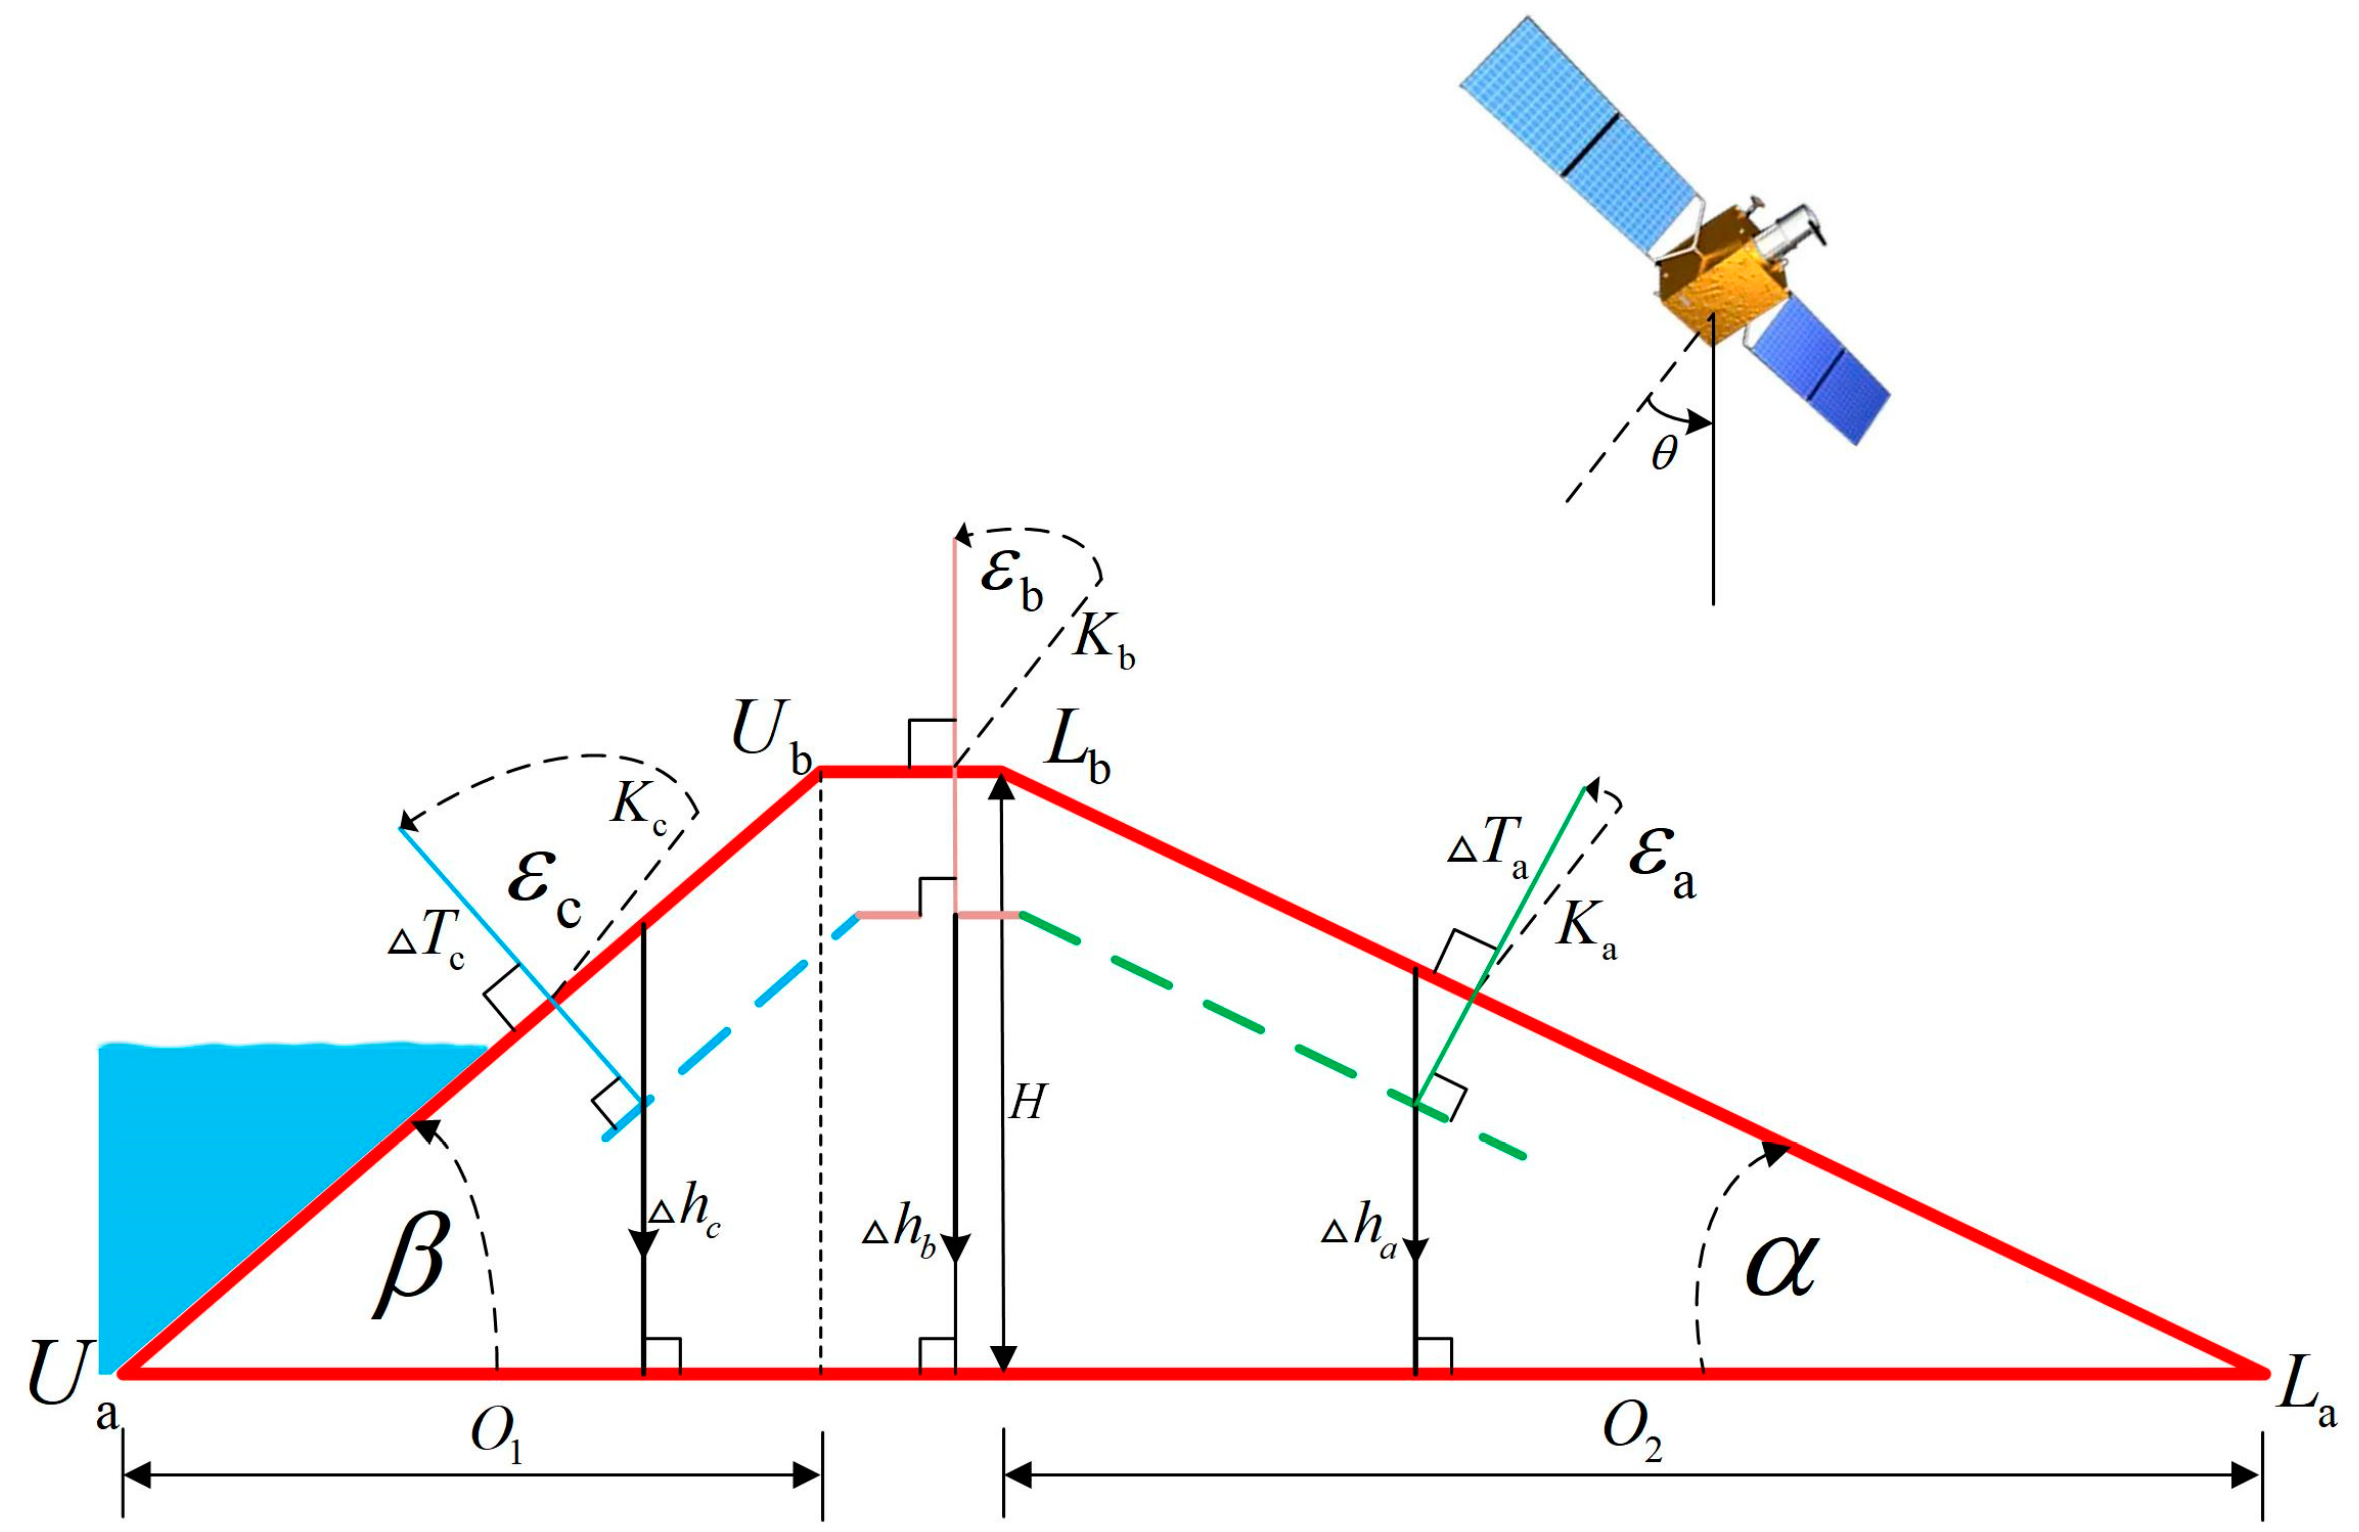
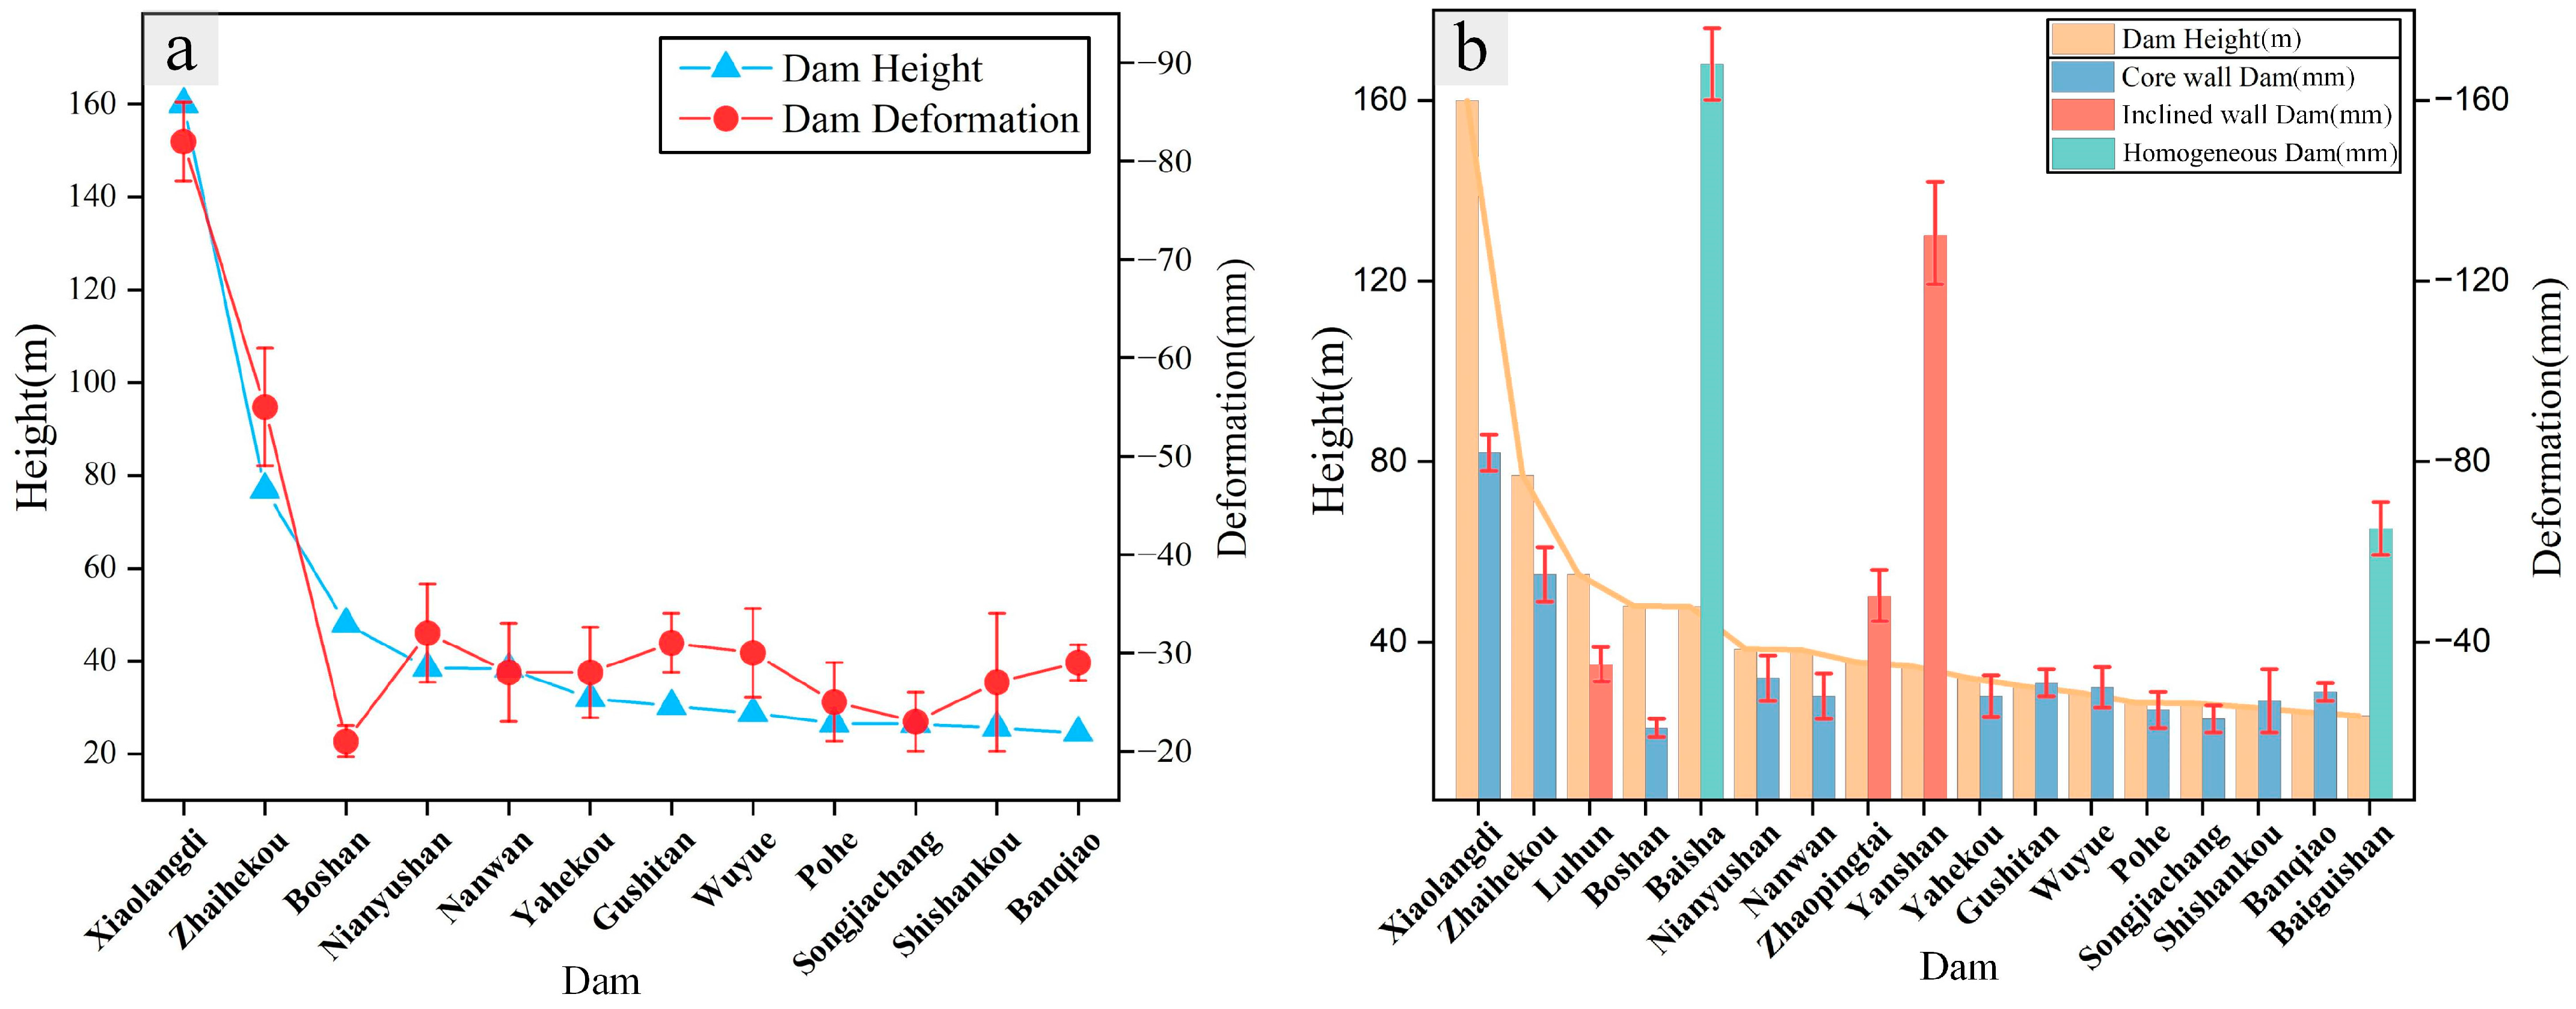
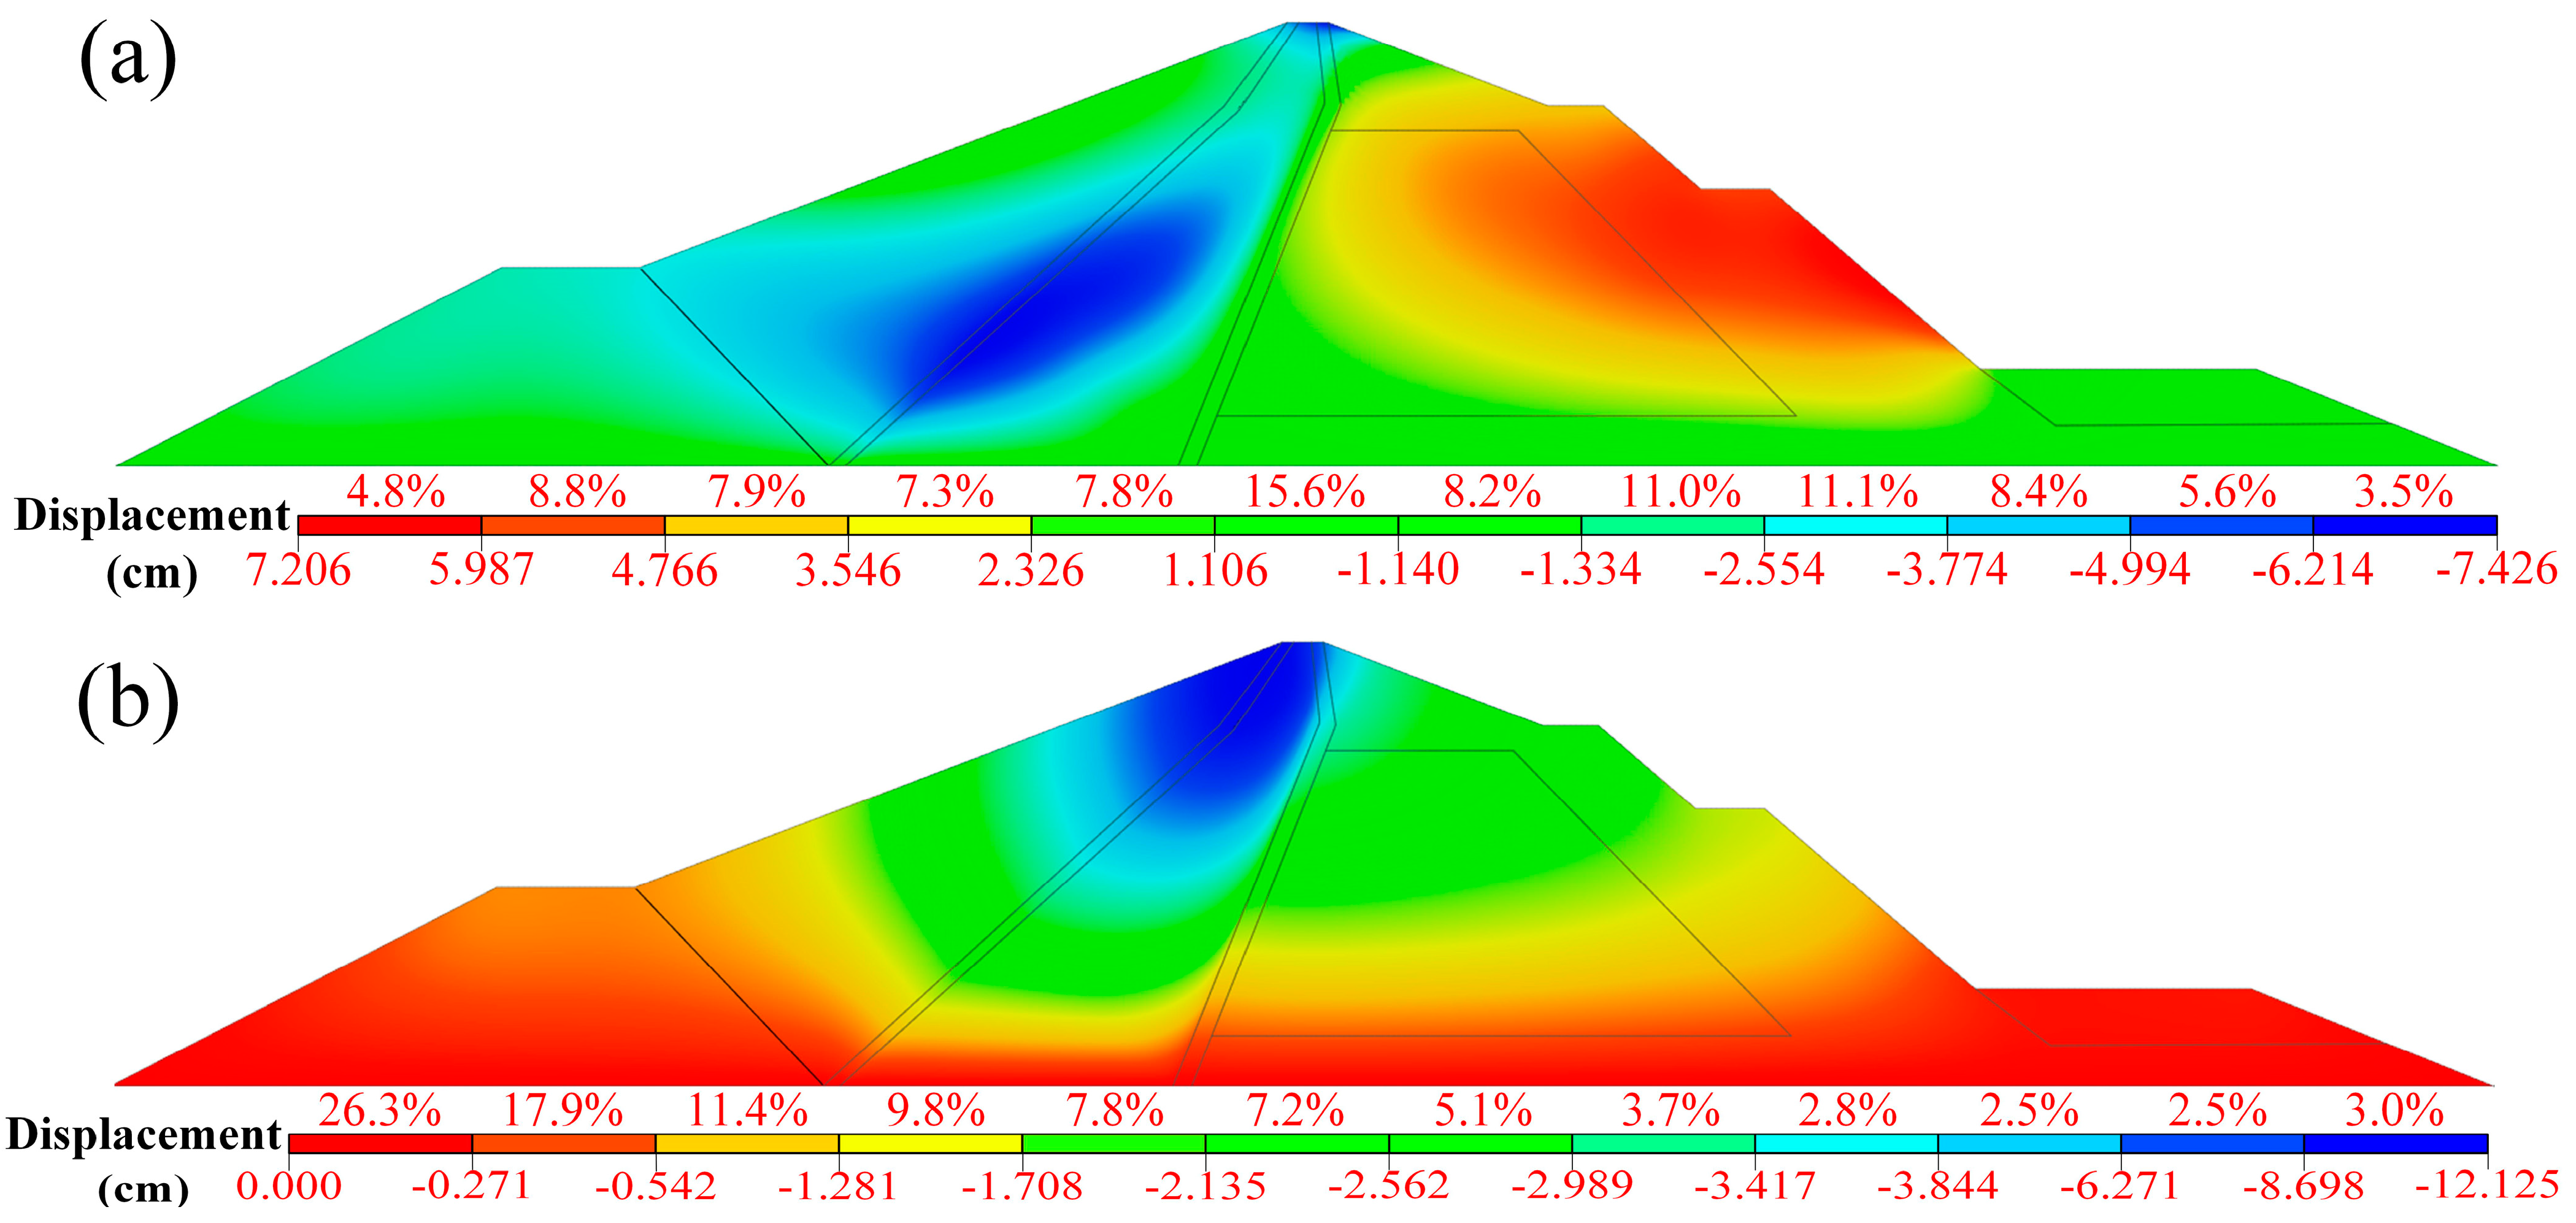
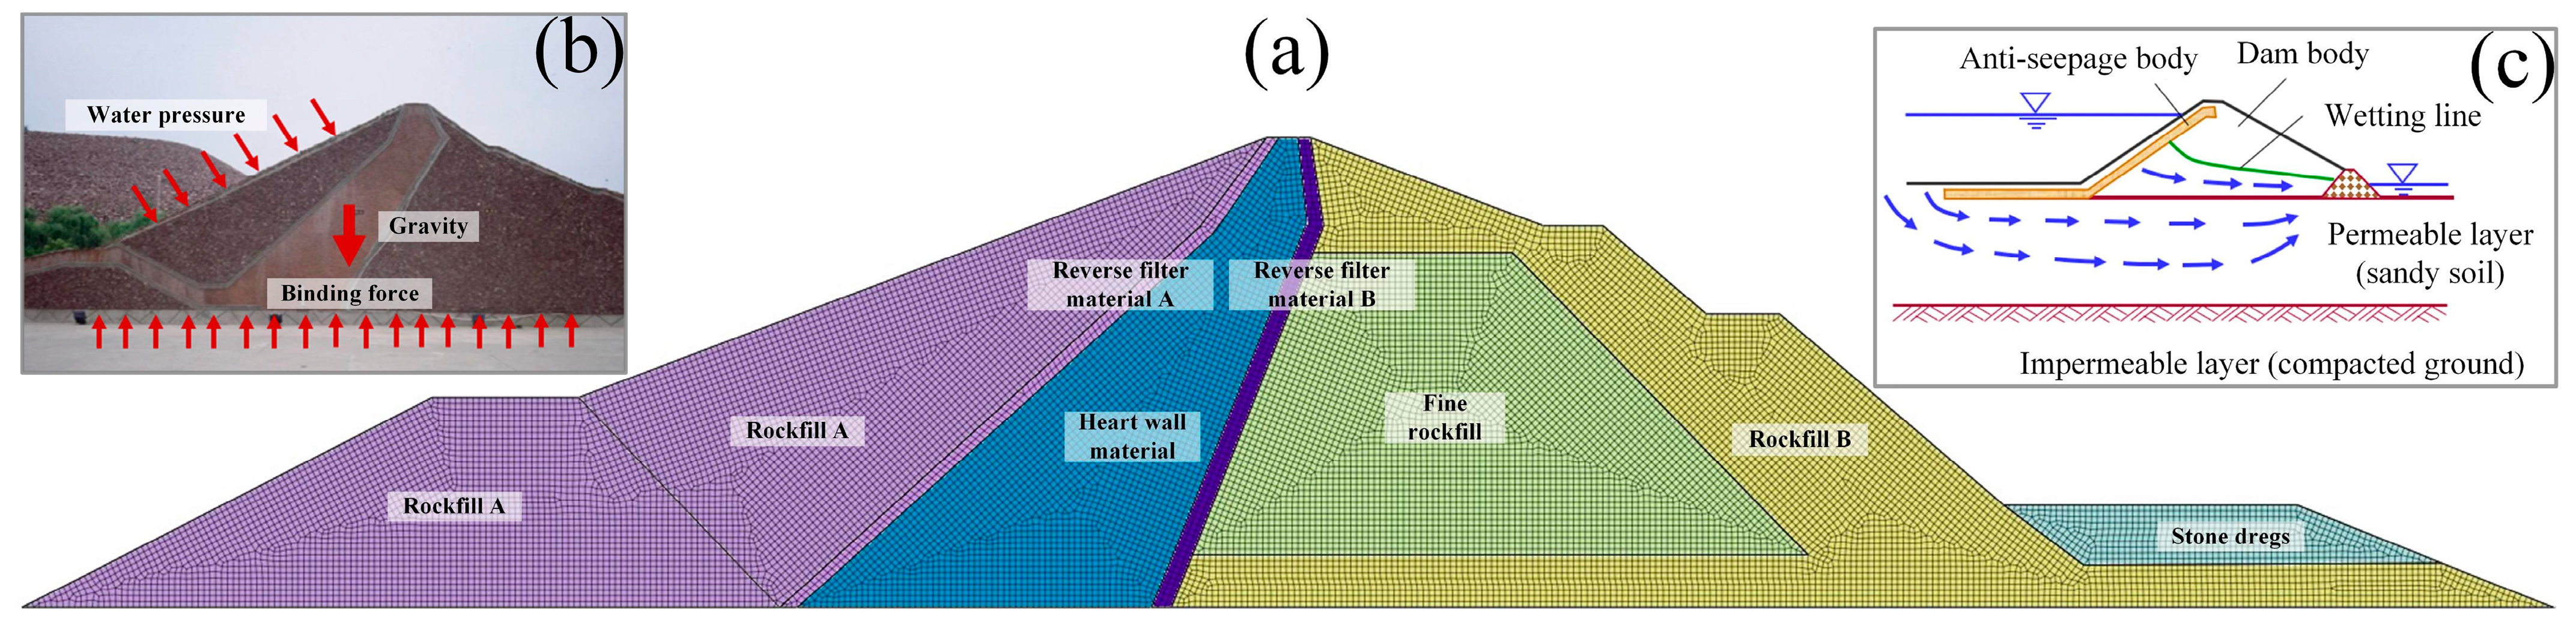
5.4. Stability Analysis of Soil and Rockfill Dam
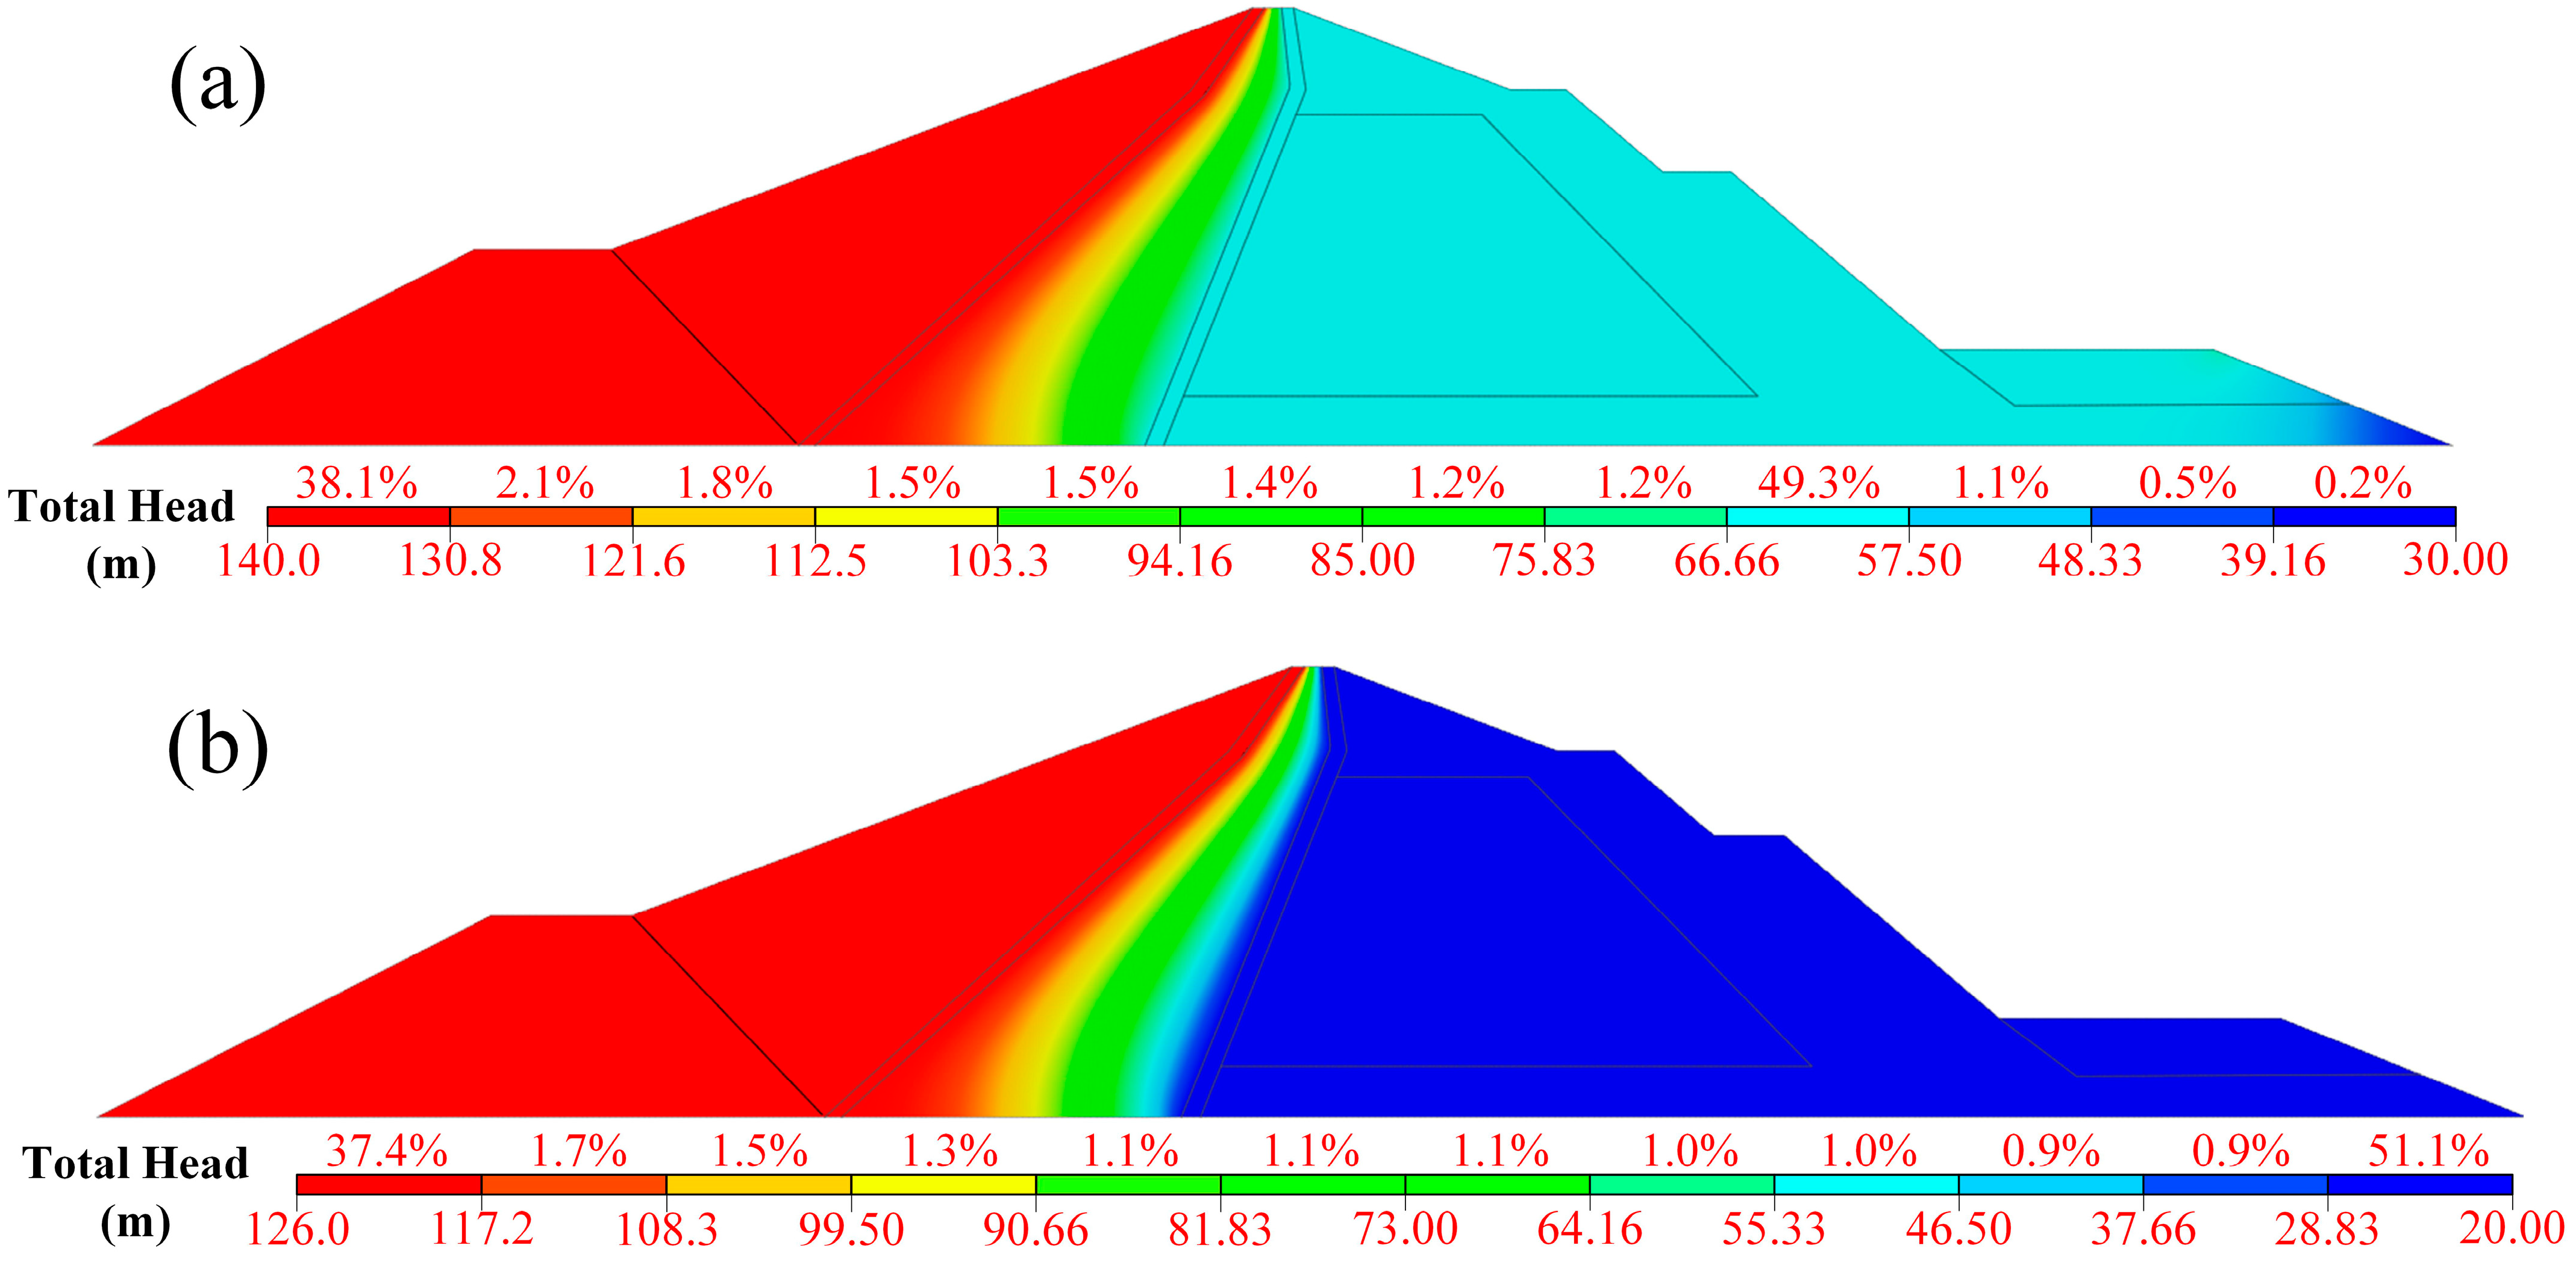
5.4.1. Seepage Stability Analysis
5.4.2. Stress Stability Analysis
6. Conclusions
Author Contributions
Funding
Data Availability Statement
Acknowledgments
Conflicts of Interest
References
- National Bureau of Statistics. 2020 China Statistical Yearbook; China Statistics Press: Beijing, China, 2021. [Google Scholar]
- Liu, W.; Liu, H.; Song, Z.; Hu, Q. Discussion on lterative Construction Strategy and Application of Domestic lnland Water in SAR Satellite Constellation. J. North China Univ. Water Resour. Electr. Power Nat. Sci. Ed. 2022, 43, 1–10. [Google Scholar]
- Sheng, J.; Li, H.; Sheng, T. Statistical analysis of dam failure and its loss of life in China. Hydro-Sci. Eng. 2023, 1, 1–15. [Google Scholar]
- Liu, H.; Yue, J.; Liu, W.; Huang, Q.; Li, G.; Liu, M. Multi-baseline phase unwrapping with robust branch and bound pure integer programming algorithm. Opt. Lasers Eng. 2023, 161, 107352. [Google Scholar] [CrossRef]
- Liu, H. Research on Antennas Design and Three-Dimensional lmaging Techniques for MIMO Sparse Array SAR. Ph.D. Thesis, Information Engineering University, Zhenzhou, China, 2017. [Google Scholar]
- Jänichen, J.; Schmullius, C.; Baade, J.; Last, K.; Bettzieche, V.; Dubois, C. Monitoring of Radial Deformations of a Gravity Dam Using Sentinel-1 Persistent Scatterer Interferometry. Remote Sens. 2022, 14, 1112. [Google Scholar] [CrossRef]
- Ruiz-Armenteros, A.; Lazecky, M.; Hlaváčová, I.; Bakoň, M.; Delgado, J.; Sousa, J.; Lamas-Fernández, F.; Marchamalo, M.; Caro-Cuenca, M.; Papco, J.; et al. Deformation monitoring of dam infrastructures via spaceborne MT-InSAR. The case of La Viñuela (Málaga, Southern Spain). Procedia Comput. Sci. 2018, 138, 346–353. [Google Scholar] [CrossRef]
- Othman, A.; Al-Maamar, A.; Al-Manmi, D.; Liesenberg, V.; Hasan, S.; Al-Saady, Y.; Shihab, A.; Khwedim, K. Application of DInSAR-PSI technology for deformation monitoring of the Mosul dam, Iraq. Remote Sens. 2019, 11, 2632. [Google Scholar] [CrossRef]
- Zhang, Q.; Zhao, C.; Ding, X.; Chen, Y.; Wang, L.; Huang, G.; Yang, C.; Ding, X.; Jing, M. Research on recent characteristics of spatio-temporal evolution and mechanism of Xi’an land subsidence and ground fissure by using GPS and InSAR techniques. Chin. J. Geophys. 2009, 52, 1214–1222. [Google Scholar]
- Liu, Q.; Zhang, Y.; Deng, M.; Wu, H.; Kang, Y. Time series prediction method of large-scale surface subsidence based on deep learning. Acta Geod. Et Cartogr. Sin. 2021, 50, 396–404. [Google Scholar]
- Liu, H.; Xu, Q.; Jin, G.; Lou, L. Urban Buildings MIMO Downward-Looking Array SAR 3D Simulation Under Non-ideal Traiector. Geomat. Inf. Sci. Wuhan Univ. 2019, 44, 413–421+442. [Google Scholar]
- Aslan, G.; Foumelis, M.; Raucoules, D.; Michele, M.; Bernardie, S.; Cakir, Z. Landslide Mapping and Monitoring Using Persistent Scatterer Interferometry (PSI) Technique in the French Alps. Remote Sens. 2020, 12, 1305. [Google Scholar] [CrossRef]
- Nefros, C.; Alatza, S.; Loupasakis, C.; Kontoes, C. Persistent Scatterer Interferometry (PSI) Technique for the Identification and Monitoring of Critical Landslide Areas in a Regional and Mountainous Road Network. Remote Sens. 2023, 15, 1550. [Google Scholar] [CrossRef]
- Liao, M.; Tang, Q.; Wang, T.; Timo, B.; Zhang, L. Application of High Resolution SAR Data in Landslide Monitoring in Three Gorges Reservoir Area. Sci. China Earth Sci. 2012, 42, 217–229. [Google Scholar]
- Wu, H.; Zhang, Y.; Zhong, W. Monitoring Mine Subsidence with Time-Series SAR Interferometry. Adv. Mater. Res. 2012, 524–527, 618–621. [Google Scholar] [CrossRef]
- Ng, H.; Ge, L.; Yan, Y.; Li, X.; Chang, H.; Zhang, K.; Rizos, C. Mapping accumulated mine subsidence using small stack of SAR differential interferograms in the Southern coalfield of New South Wales, Australia. Eng. Geol. 2010, 115, 1–15. [Google Scholar] [CrossRef]
- Zhou, L.; Zhang, D.; Jie, W.; Huang, Z.; Pan, D. Mapping Land Subsidence Related to Underground Coal Fires in the Wuda Coalfield (Northern China) Using a Small Stack of ALOS PALSAR Differential Interferograms. Remote Sens. 2013, 5, 1152–1176. [Google Scholar] [CrossRef]
- Liu, H.; Yue, J.; Huang, Q.; Li, G.; Liu, M. A Novel Branch and Bound Pure Integer Programming Phase Unwrapping Algorithm for Dual-Baseline InSAR. Front. Environ. Sci. 2022, 10, 890343. [Google Scholar] [CrossRef]
- Xu, X.; Sandwell, D.; Smith-Konter, B. Coseismic displacements and surface fractures from Sentinel-1 InSAR: 2019 Ridgecrest earthquakes. Selsmol. Res. Lett. 2020, 91, 1979–1985. [Google Scholar] [CrossRef]
- Ji, Y.; Sumantyo, J.; Chua, M.; Waqar, M. Earthquake/tsunami damage level mapping of urban areas using full polarimetric SAR data. IEEE J. Sel. Top. Appl. Earth Obs. Remote. Sens. 2018, 11, 2296–2309. [Google Scholar] [CrossRef]
- Liu, J.; Hu, J.; Li, Z.; Ma, Z.; Shi, J.; Xu, W.; Sun, Q. Three-dimensional surface displacements of the 8 January 2022 Mw6. 7 Menyuan earthquake, China from Sentinel-1 and AlOS-2 SAR observations. Remote Sens. 2022, 14, 1404. [Google Scholar] [CrossRef]
- Necsoiu, M.; Onaca, A.; Wigginton, S.; Urdea, P. Rock glacier dynamics in Southern Carpathian Mountains from high-resolution optical and multi-temporal SAR satellite imagery. Remote Sens. Environ. 2016, 177, 21–36. [Google Scholar] [CrossRef]
- Mohammadimanesh, F.; Salehi, B.; Mahdianpari, M.; English, J.; Chamberland, J.; Alasset, P. Monitoring surface changes in discontinuous permafrost terrain using small baseline SAR interferometry, object-based classification, and geological features: A case study from Mayo, Yukon Territory, Canada. Gisci. Remote Sens. 2019, 56, 485–510. [Google Scholar] [CrossRef]
- Ye, Y.; Xiaolei, L.; Xikai, F.; Feiyang, X. Application of spaceborne interferometric synthetic aperture radar to geohazard monitoring. J. Radars 2020, 9, 73–85. [Google Scholar]
- Cigna, F.; Osmanoğlu, B.; Cabral-Cano, E.; Dixon, T.; Ávila-Olivera, J.; Garduño-Monroy, V.; DeMets, C.; Wdowinski, S. Monitoring land subsidence and its induced geological hazard with Synthetic Aperture Radar Interferometry: A case study in Morelia, Mexico. Remote Sens. Environ. 2012, 117, 146–161. [Google Scholar] [CrossRef]
- Kussul, N.; Shelestov, A.; Skakun, S. Flood monitoring from SAR data. In Use of Satellite and In-Situ Data to Improve Sustainability; Springer: Dordrecht, The Netherlands, 2011; Volume 97, pp. 19–29. [Google Scholar]
- Mura, J.; Gama, F.; Paradella, W.; Negrão, P.; Carneiro, S.; De Oliveira, C.; Brandão, W. Monitoring the vulnerability of the dam and dikes in Germano iron mining area after the collapse of the tailings dam of Fundão (Mariana-MG, Brazil) using DInSAR techniques with TerraSAR-X data. Remote Sens. 2018, 10, 1507. [Google Scholar] [CrossRef]
- Scaioni, M.; Marsella, M.; Crosetto, M.; Tornatore, V.; Wang, J. Geodetic and remote-sensing sensors for dam deformation monitoring. Sensors 2018, 18, 3682. [Google Scholar] [CrossRef]
- Liu, G.; Guo, H.; Perski, Z.; Fan, J.; Bai, S.; Yan, S.; Song, R. Monitoring the slope movement of the Shuping landslide in the Three Gorges Reservoir of China, using X-band time series SAR interferometry. Adv. Space Res. 2016, 57, 2487–2495. [Google Scholar] [CrossRef]
- Perissin, D.; Wang, T. Time-series InSAR applications over urban areas in China. IEEE J. Sel. Top. Appl. Earth Obs. Remote. Sens. 2010, 4, 92–100. [Google Scholar] [CrossRef]
- Qiu, Z.; Jiao, M.; Jiang, T.; Zhou, L. Dam structure deformation monitoring by GB-InSAR approach. IEEE Access 2020, 8, 123287–123296. [Google Scholar] [CrossRef]
- Sousa, J.; Ruiz, A.; Bakoň, M.; Lazecky, M.; Hlaváčová, I.; Patricio, G.; Delgado, J.; Perissin, D. Potential of C-band SAR interferometry for dam monitoring. Procedia Comput. Sci. 2016, 100, 1103–1114. [Google Scholar] [CrossRef]
- Voege, M.; Frauenfelder, R.; Larsen, Y. Displacement monitoring at Svartevatn dam with interferometric SAR. In Proceedings of the 2012 IEEE International Geoscience and Remote Sensing Symposium, Munich, Germany, 22–27 July 2012; pp. 3895–3898. [Google Scholar]
- Wang, J.; Zhang, Q.; Gou, T.; Mo, J.; Wang, Z.; Gao, M. Spatial-temporal changes of urban areas and terrestrial carbon storage in the Three Gorges Reservoir in China. Ecol. Indic. 2018, 95, 343–352. [Google Scholar] [CrossRef]
- Li, T.; Motagh, M.; Wang, M.; Zhang, W.; Gong, C.; Xiong, X.; He, J.; Chen, L.; Liu, J. Earth and rock-filled dam monitoring by high-resolution X-band interferometry: Gongming dam case study. Remote Sens. 2019, 11, 246. [Google Scholar] [CrossRef]
- Liu, H.; Zhao, W.; Qin, Z.; Wang, T.; Li, G.; Zhu, M. Time-Series InSAR Deformation Monitoring of High Fill Characteristic Canal of South-North Water Diversion Project in China. Appl. Sci. 2023, 13, 6415. [Google Scholar] [CrossRef]
- Lee, S.; Lee, K.; Yoon, H. Using artificial neural network models for groundwater level forecasting and assessment of the relative impacts of influencing factors. Hydrogeol. J. 2019, 27, 567–579. [Google Scholar] [CrossRef]
- Kumar, H.; Syed, T.; Amelung, F.; Agrawal, R.; Venkatesh, A. Space-time evolution of land subsidence in the National Capital Region of India using ALOS-1 and Sentinel-1 SAR data: Evidence for groundwater overexploitation. J. Hydrol. 2022, 605, 127329. [Google Scholar] [CrossRef]
- Sharaky, A.; Elewa, H.; Kasem, A. Impact of the Grand Ethiopian Renaissance Dam (GERD) on Gezira Groundwater, Sudan. In Grand Ethiopian Renaissance Dam Versus Aswan High Dam; Springer International Publishing AG: Cham, Germany, 2019; Volume 79, pp. 519–557. [Google Scholar]
- Aswathi, J.; Binojkumar, R.; Oommen, T.; Bouali, E.; Sajinkumar, K. InSAR as a tool for monitoring hydropower projects: A review. Energy Geosci. 2022, 3, 160–171. [Google Scholar] [CrossRef]
- Wang, Q.; Huang, Q.; He, N.; He, B.; Wang, Z.; Wang, Y. Displacement monitoring of upper Atbara dam based on time series InSAR. Surv. Rev. 2020, 52, 485–496. [Google Scholar] [CrossRef]
- Yu, H.; Jiang, X.; Zhang, Q.; Cao, L. Analysis of Arching Effect of Core Wall of Xiaolangdi Dam. Yellow River 2017, 39, 135–137. [Google Scholar]
- Zhang, W.; Zhu, W.; Tian, X.; Zhang, Q.; Wang, C. Improved DEM Reconstruction Method Based on Multibaseline InSAR. IEEE Geosci. Remote. Sens. Lett. 2021, 99, 1–5. [Google Scholar] [CrossRef]
- Ferretti, A.; Prati, C.; Rocca, F. Nonlinear subsidence rate estimation using permanent scatterers in differential SAR interferometry. IEEE Trans. Geosci. Remote Sens. 2000, 38, 2202–2212. [Google Scholar] [CrossRef]
- Fiorentini, N.; Maboudi, M.; Leandri, P.; Losa, M. Can Machine Learning and PS-InSAR Reliably Stand in for Road Profilometric Surveys? Sensors 2021, 21, 3377. [Google Scholar] [CrossRef]
- Evers, M.; Kyriou, A.; Thiele, A.; Hammer, H.; Nikolakopoulus, K.; Schulz, K. How to set up a dam monitoring system with PSInSAR and GPS. SPIE Remote Sens. 2020, 11534, 115340L. [Google Scholar]
- Liu, H.; Zhou, B.; Bai, Z.; Zhao, W.; Zhu, M.; Zheng, K.; Yang, S.; Li, G. Applicability Assessment of Multi-Source DEM-Assisted InSAR Deformation Monitoring Considering Two Topographical Features. Land 2023, 12, 1284. [Google Scholar] [CrossRef]
- Xue, J.; Shen, B. A novel swarm intelligence optimization approach: Sparrow search algorithm. Syst. Sci. Control Eng. 2020, 8, 22–34. [Google Scholar] [CrossRef]
- SL274-2020; Design Code for Rolled Earth Rock Fill Dams. Ministry of Water Resources of the People’s Republic of China; China Water Resources and Hydropower Press: Beijing, China, 2020. [Google Scholar]
- He, Z.; Yu, H.; Xie, S.; Yu, L.; Chen, L. Deformation monitoring of Xiaolangdi dam based on SBAS-InSAR technology. Sci. Surv. Mapp. 2022, 47, 66–72+82. [Google Scholar]
- Chai, T.; Draxler, R. Root mean square error (RMSE) or mean absolute error (MAE)?—Arguments against avoiding RMSE in the literature. Geosci. Model Dev. 2014, 7, 1247–1250. [Google Scholar] [CrossRef]


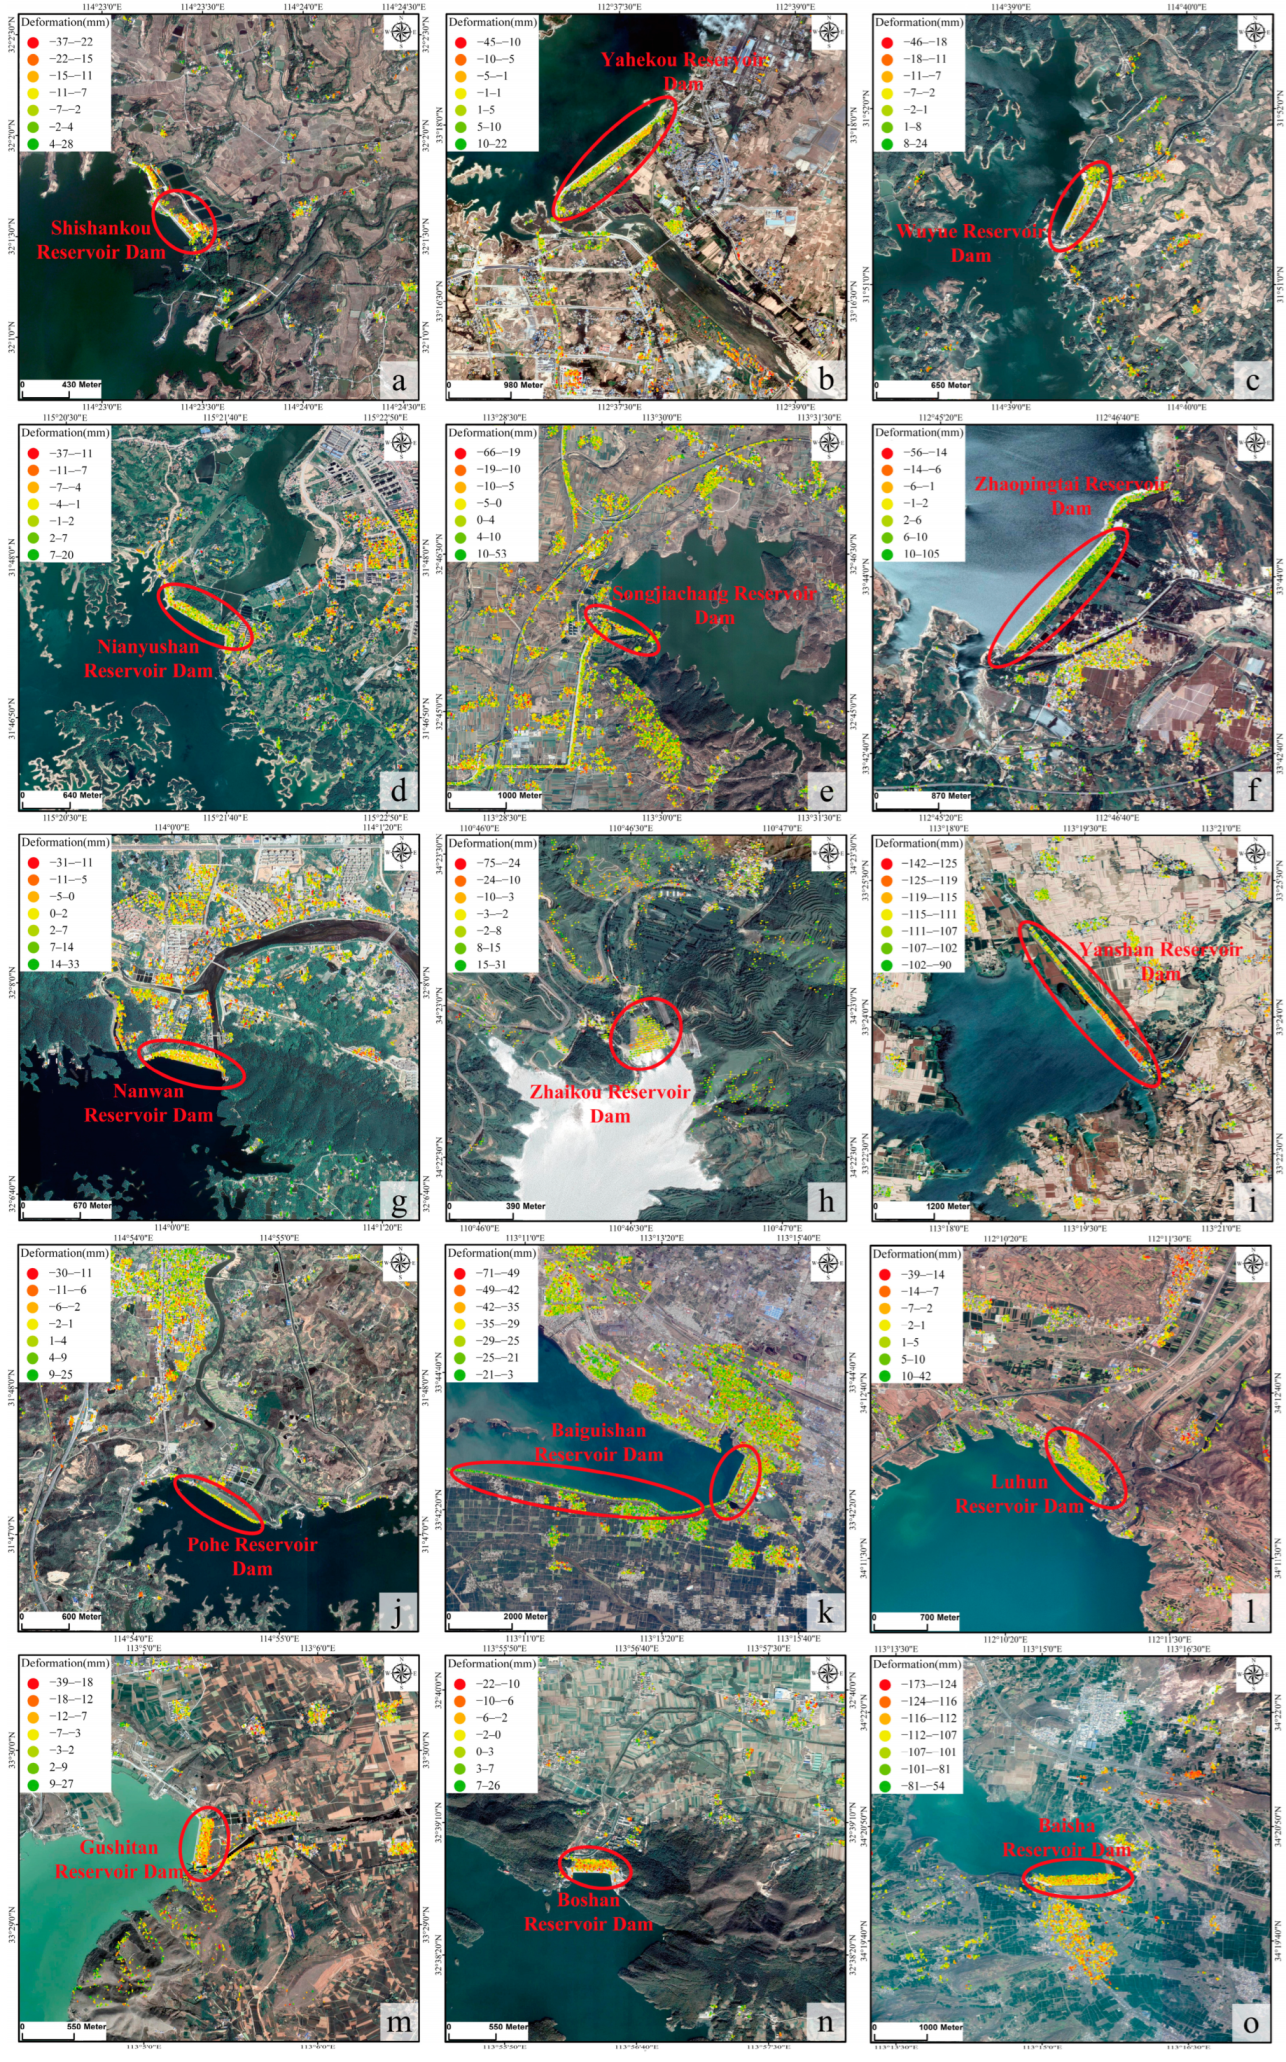
| Dam | Area | Dam Type |
|---|---|---|
| Xiaolangdi Reservoir Dam | Mengjin County | Clay-inclined core wall rockfill dam |
| Baisha Reservoir Dam | Yuzhou | Homogeneous soil dam |
| Luhun Reservoir Dam | Song County | Inclined wall soil and rockfill dam |
| Baiguishan Reservoir Dam | Lushan County | Homogeneous soil dam |
| Gusitan Reservoir Dam | Ye County | Clay core wall sand and pebble dam |
| Yanshan Reservoir Dam | Fangcheng County | Inclined wall soil and rockfill dam |
| Zhaopingtai Reservoir Dam | Lushan County | Thin clay sloping wall sand and cobble dam |
| Zhaikou Reservoir Dam | Lingbao City | Clay heart wall sand shell dam |
| Yahekou Reservoir Dam | Nanzhao County | Clay heart wall sand shell dam |
| Nanwan Reservoir Dam | Xinyang City | Clay heart wall sand shell dam |
| Shishankou Reservoir Dam | Luoshan County | Clay heart wall sand shell dam |
| Wuyue Reservoir Dam | Guangshan County | Clay heart wall sand shell dam |
| Pohe Reservoir Dam | Guangshan County | Clay heart wall sand shell dam |
| Nianyushan Reservoir Dam | Shangcheng County | Clay heart wall sand shell dam |
| Boshan Reservoir Dam | Queshan County | Clay heart wall sand shell dam |
| Songjiachang Reservoir Dam | Miyang County | Clay heart wall sand shell dam |
| Banqiao Reservoir Dam | Zhumadian City | Clay heart wall sand shell dam |
Disclaimer/Publisher’s Note: The statements, opinions and data contained in all publications are solely those of the individual author(s) and contributor(s) and not of MDPI and/or the editor(s). MDPI and/or the editor(s) disclaim responsibility for any injury to people or property resulting from any ideas, methods, instructions or products referred to in the content. |
© 2023 by the authors. Licensee MDPI, Basel, Switzerland. This article is an open access article distributed under the terms and conditions of the Creative Commons Attribution (CC BY) license (https://creativecommons.org/licenses/by/4.0/).
Share and Cite
Liu, H.; Zhu, M.; Zhu, W.; Zhao, W.; Bai, Z.; Zhou, B.; Li, G.; Wang, Y. Soil and Rockfill Dams Safety Assessment for Henan Province: Monitoring, Analysis and Prediction. Remote Sens. 2023, 15, 4293. https://doi.org/10.3390/rs15174293
Liu H, Zhu M, Zhu W, Zhao W, Bai Z, Zhou B, Li G, Wang Y. Soil and Rockfill Dams Safety Assessment for Henan Province: Monitoring, Analysis and Prediction. Remote Sensing. 2023; 15(17):4293. https://doi.org/10.3390/rs15174293
Chicago/Turabian StyleLiu, Hui, Mengyuan Zhu, Wu Zhu, Wenfei Zhao, Zechao Bai, Bochen Zhou, Geshuang Li, and Yuanxi Wang. 2023. "Soil and Rockfill Dams Safety Assessment for Henan Province: Monitoring, Analysis and Prediction" Remote Sensing 15, no. 17: 4293. https://doi.org/10.3390/rs15174293
APA StyleLiu, H., Zhu, M., Zhu, W., Zhao, W., Bai, Z., Zhou, B., Li, G., & Wang, Y. (2023). Soil and Rockfill Dams Safety Assessment for Henan Province: Monitoring, Analysis and Prediction. Remote Sensing, 15(17), 4293. https://doi.org/10.3390/rs15174293