Article

Investigating Deformation Mechanism of Earth-Rock Dams with InSaR and Numerical Simulation: Application to Liuduzhai Reservoir Dam, China

1
School of Geosciences and Info-Physics, Central South University, Changsha 410083, China
2
School of Civil Architectural Engineering, Shaoyang University, Shaoyang 422000, China
3
College of Geographic Science, Hunan Normal University, Changsha 410081, China
*
Author to whom correspondence should be addressed.
Remote Sens. 2023, 15(16), 4110; https://doi.org/10.3390/rs15164110
Submission received: 14 June 2023 / Revised: 9 August 2023 / Accepted: 17 August 2023 / Published: 21 August 2023
(This article belongs to the Special Issue Dam Stability Monitoring with Satellite Geodesy)

Abstract

:
Ground deformation is the direct manifestation of the earth-rock dam's hazard potential. Therefore, it is essential to monitor deformation for dam warning and security evaluation. The Liuduzhai Dam, a clay-core dam of a large reservoir in China, was reinforced with plastic concrete cut-off walls between 13 January 2009 and 29 May 2010, as it was subject to leakage and deformation. However, the deformation development and the mechanism of the dam are still unclear. In this study, the deformation fields before and after the reinforcement of the Liuduzhai Dam were yielded by using the Interferometric Synthetic Aperture Radar (InSAR) technique. Furthermore, a numerical simulation method was employed to obtain the dynamic seepage field of the dam during the InSAR observation period. The results indicated that the average deformation velocity and maximum deformation velocity are −11.7 mm/yr and −22.5 mm/yr, respectively, and the cumulative displacement exceeds 100 mm, which shows typical continuous growth characteristics in a time series. In contrast, the dam deformation tended to be stable after reinforcement, with the average deformation velocity and maximum deformation velocity being −0.4 mm/yr and −1.2 mm/yr, respectively, behaving as cyclical deformation time series. According to the results of InSAR and seepage analysis, it is shown that: (1) dynamic seepage was the main mechanism controlling dam deformation prior to reinforcement; (2) the concentrated load caused by construction and the rapid dissipation of pore water pressure caused by the sudden drop of the infiltration line were the reasons for the acceleration of deformation during and after construction; and (3) the plastic concrete cut-off walls effectively reduced the dynamic seepage field, while the water level fluctuations were the main driving factor of elastic deformation of the dam after reinforcement. This study provides a novel approach to investigating the deformation mechanism of earth-rock dams. Furthermore, it has been confirmed that InSAR can identify the seepage deformation of dams by detecting surface movements. It is recommended that InSAR deformation monitoring should be incorporated into future dam safety programs to provide detailed deformation signals. By analyzing the temporal and spatial characteristics of the deformation signal, we can identify areas where dam performance has degraded. This crucial information aids in conducting a comprehensive dam safety assessment.

1. Introduction

Dams with a runoff regulation function have produced significant social and economic benefits in terms of preventing floods, irrigation and power generation [1,2,3]. Due to the advantages of the easy-to-obtain materials and simple construction, earth-rock dams are the most widely used type of dams and have been widely constructed over the past few decades [4]. However, numerous earth-rock dams have suffered from serious hazard potential due to factors such as aging and construction conditions, etc. [5]. Deformation is the main direct manifestation of hazard potential for earth-rock dams [6]. Due to the general failure to effectively identify dam deformation and implement appropriate preventive measures, the tragedies of dam collapses have been frequently reported in recent years [7,8,9,10,11]. Therefore, performing a long time series for deformation monitoring is essential for the safety operation and management decisions of earth-rock dams [12,13]. The Interferometric Synthetic Aperture Radar (InSAR) technique, developed in recent decades, has the advantage of a high spatiotemporal resolution, compared to traditional methods such as leveling and GNSS [14,15,16]. The temporal resolution of GNSS measurements is higher, while the InSAR technique has the capability to track historical deformations using archived satellite images and can obtain ground deformation in areas that are difficult for humans to reach [17]. It has shown enormous potential in the field of dam deformation monitoring.
With the in-orbit operation of TerraSAR-X and Sentinel-1 A/B, the abundant SAR satellite data with high spatial and temporal resolution have enabled InSAR technology to be widely used in the monitoring of earth-rock dams deformation, such as La Pedrera dam in Spain [18], Conza della Campania dam in Italy [19], Mosul dam in Iraq [20], Masjed-Soleyman dam in Iran [21], and Xiaolangdi dam in China [22]. However, ground deformation is only a direct manifestation of the hazard potential. The deformation of earth-rock dams can be induced by many complex dynamics factors, such as a seismic dynamic response [23], rapid rise and drop of the reservoir water level [11,24], and dynamic seepage [11,25]. In order to better assess the safety of and focus on rehabilitation plans for dams, the deformation mechanism needs to be clarified [3,26]. As a result, many scholars have conducted extensive analysis and research based on the deformation characteristics of dams. Luo et al. concluded that the main causes of dam deformation were reservoir water level fluctuations, dynamic seepage, and differences in the infiltration line of the cut-off walls, based on an analysis of 18 years of displacement data and seepage monitoring data from the Chengbihe reservoir dam in Guangxi, China [27]. Xiao et al. analyzed the InSAR time series deformation characteristics prior to the failure of the Uzbekistan Sardoba dam, and combined field investigations to identify that leakage caused by seepage was the main reason for the dam’s deformation and collapse [10]. Based on the time series deformation characteristics prior to the dam collapse in the Xe Pian-Xe Namnoy hydropower project in southern Laos, Xie et al. revealed that hydrostatic pressure, gravity, temperature variations, soil consolidation, and seepage erosion are the main deformation mechanisms in earth-rock dams [11].
However, the aforementioned studies of deformation mechanisms mainly rely on historical retrospective analyses based on time series deformation monitoring combined with field investigations, neglecting another critical issue that affects the deformation and stability of earth-rock dams, namely, the seepage field [4,28]. The earth-rock dams are usually filled with high-permeability dam shell materials and high water-resistance core walls [4,29]. During the operation of an earth-rock dam, it is inevitable to encounter a reduction in the anti-seepage performance of the core wall. The dynamic seepage caused by water level fluctuations in the reservoir can easily lead to leakage due to soil erosion [30,31]. According to statistics, ten thousand of earth-rock dams in China have leakage problems [32]. To address this issue, over the past 20 years, various anti-seepage reinforcement measures have been implemented in tens of thousands of earth-rock dams with leakage problems in China. For the study of seepage fields in earth-rock dams, physical model tests can obtain reliable simulation results [33]. However, this method has the disadvantages of complicated modeling and weak reusability in multiple working conditions. In contrast, the numerical simulation technique is used to establish the differential equations of seepage flow and the corresponding boundary conditions, which can accurately and efficiently solve the steady-state and transient seepage fields under a variety of working conditions [30,34]. In recent years, it has become the main approach for studying seepage fields of earth-rock dams.
The Liuduzhai Dam, an earth-rock dam of a large reservoir in Hunan Province, China, has long been plagued by leakage and deformation. The presence of these potential dangers resembles the situations observed in the Chengbihe Reservoir Dam [27], Sardoba Dam [10], and Xe Pian-Xe Namnoy Dam [11], as mentioned above. To ensure the safety of the dam, the reservoir authority implemented dam reinforcement between 13 January 2009, and 29 May 2010. However, the complete understanding of the deformation development and the mechanism of the dams are still unclear. By exploiting the advantages of SAR data for historical analysis, this study aims to investigate the deformation mechanism of the Liuduzhai Dam based on the InSAR deformation field under multiple seepage conditions before and after reinforcement. To our knowledge, this study is one of the few applications that combined an InSAR deformation field and seepage analysis to study the deformation mechanism of earth-rock dams.
The rest of this paper is arranged as follows: In Section 2, we outline the geological background of the Liuduzhai reservoir, the basic conditions of the dam, and the SAR data used in this study. In Section 3, we describe the InSAR time series processing and the finite element numerical simulation methods of the seepage field. In Section 4, the InSAR deformation field and dynamic seepage results are presented. In Section 5, we will discuss the deformation mechanism of the dam. The conclusions are presented in Section 6.

2. Study Site and Dataset

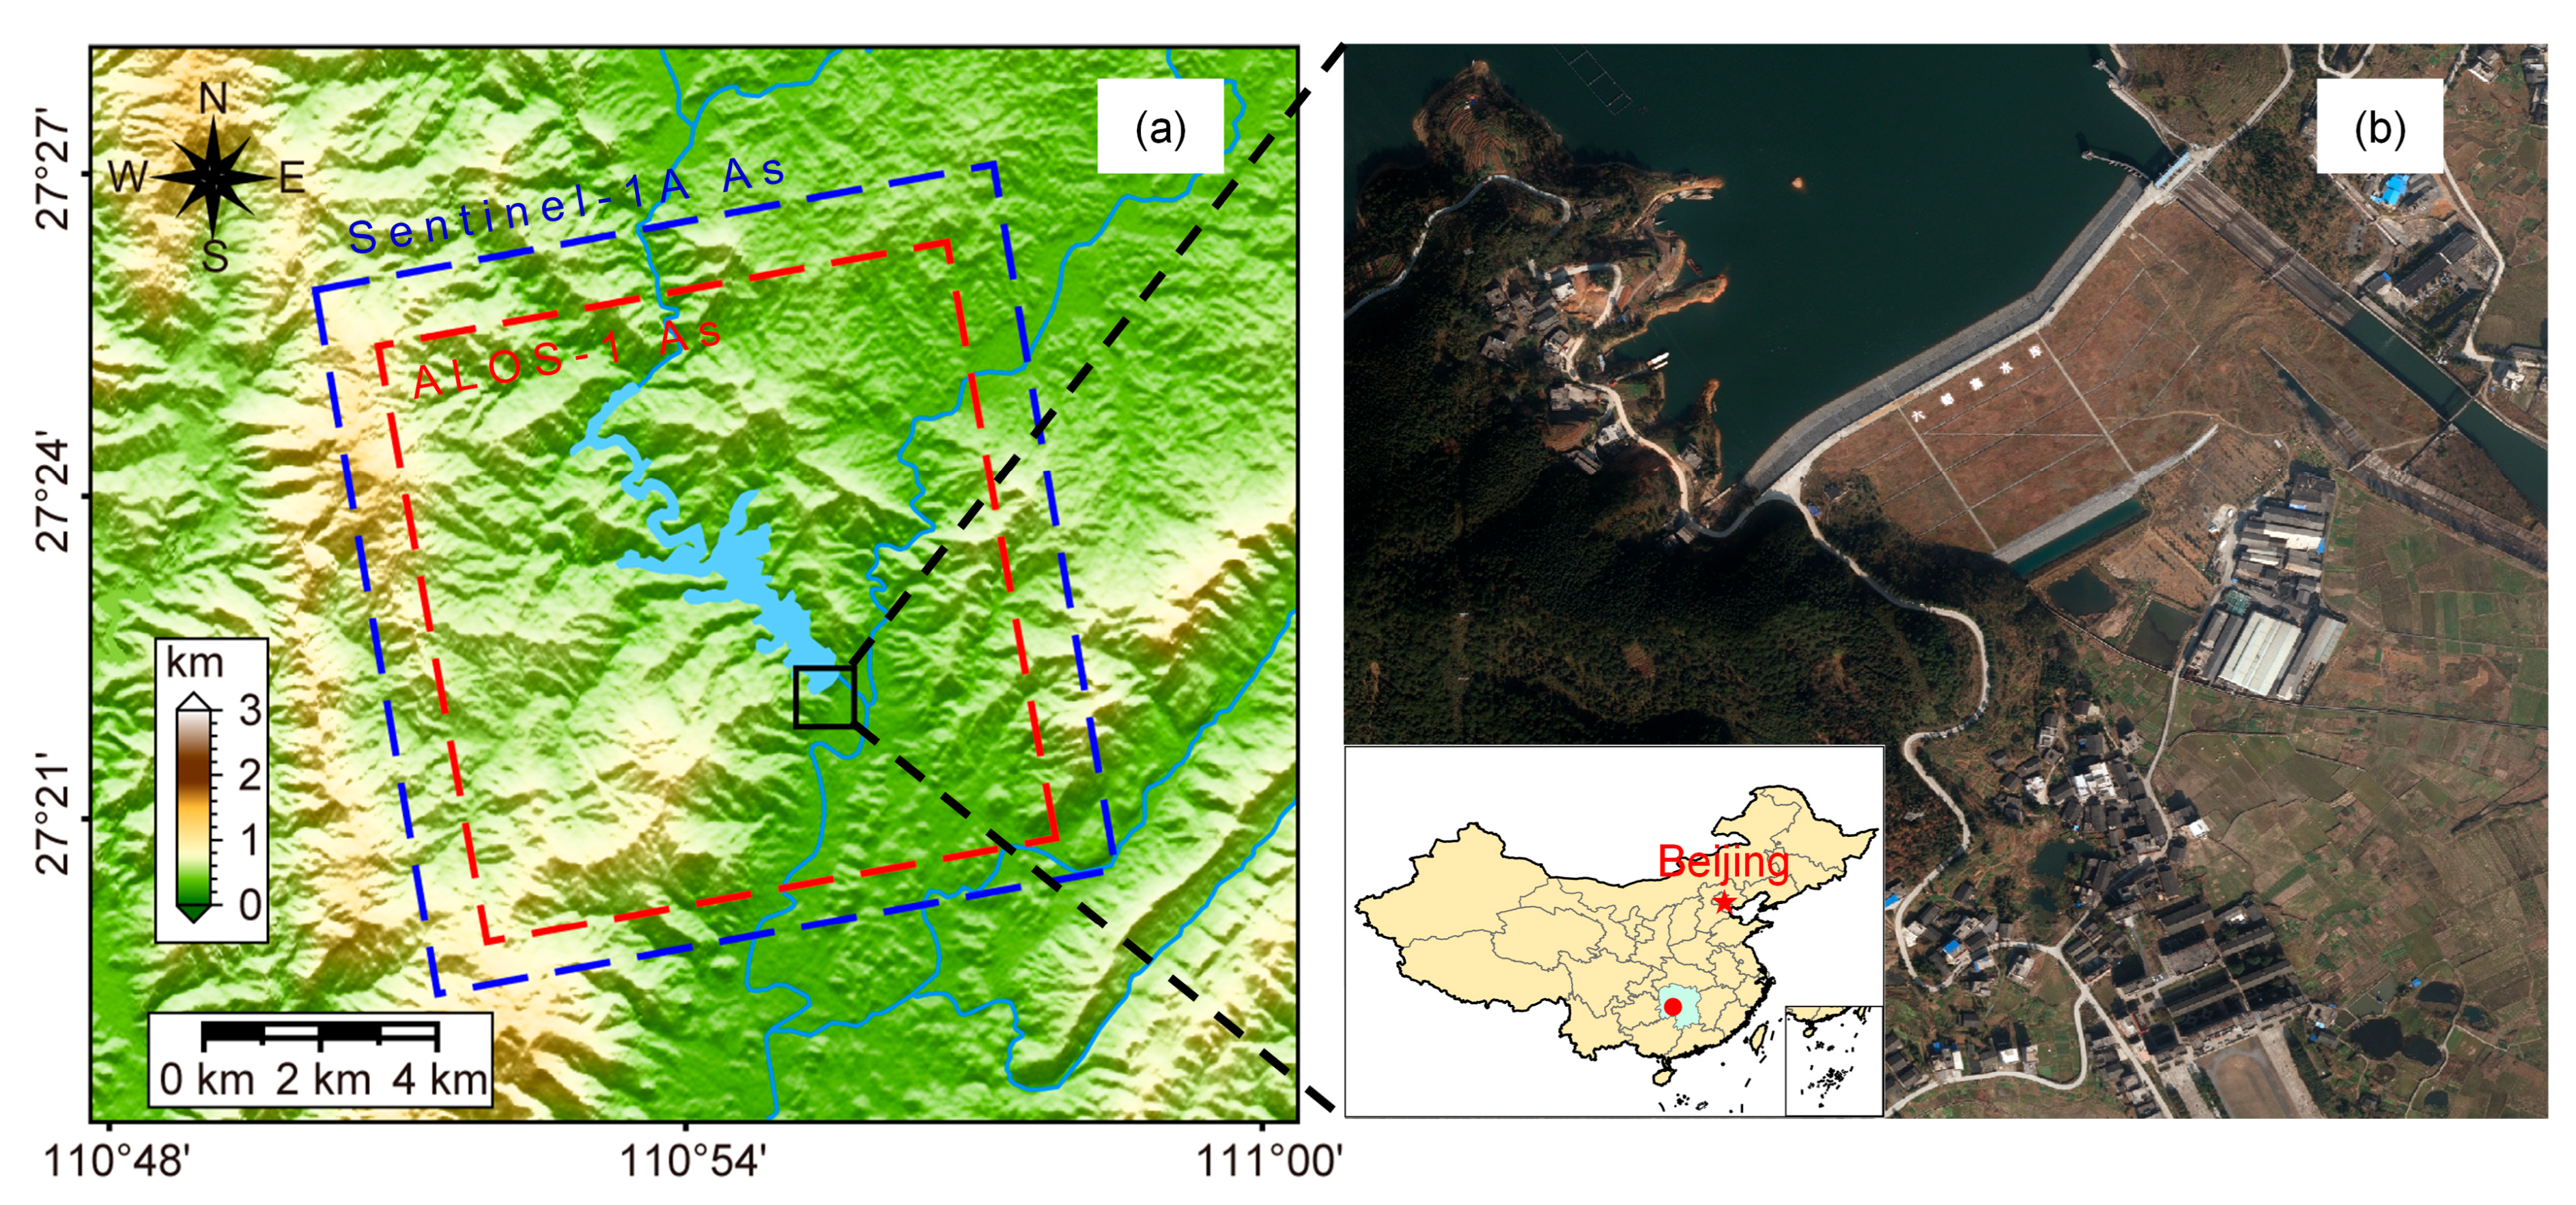
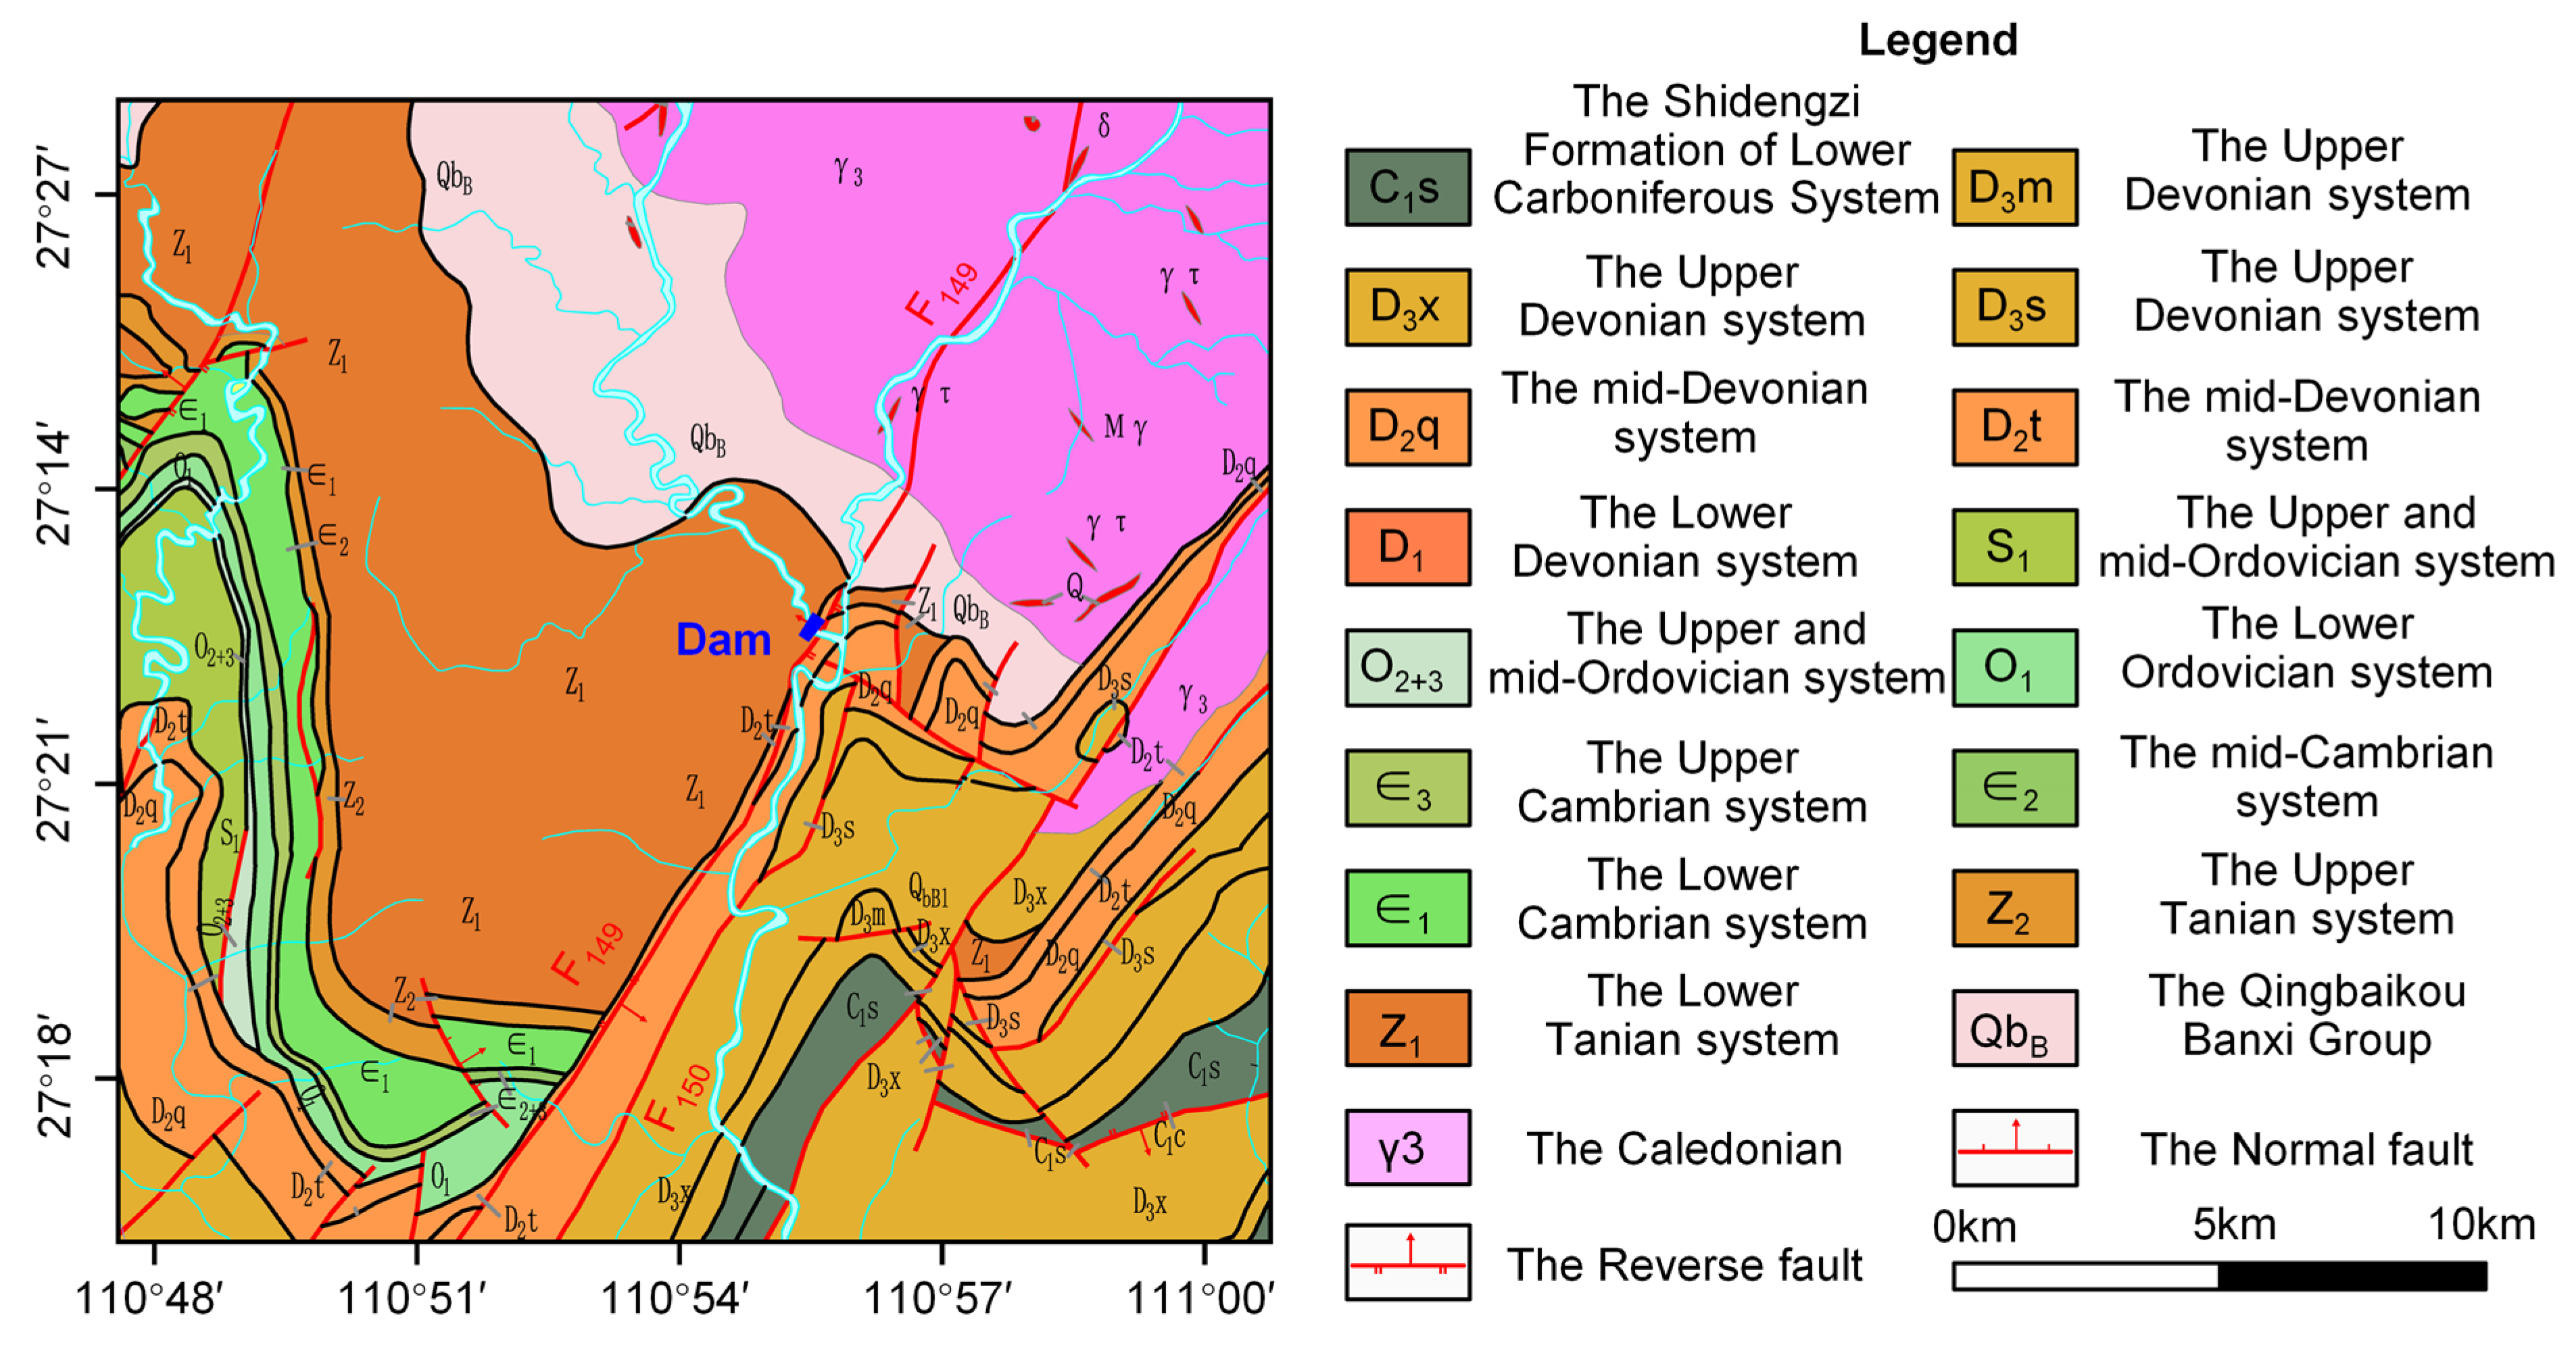
2.1. Geography and Geological Site Setting

The Liuduzhai reservoir is located upstream of the Chenshui River in the Dongting Lake water system, Longhui County, Hunan Province, China (Figure 1a,b). The reservoir is a large (II) water conservancy project for preventing floods and providing irrigation, power generation, and water supply, which has a catchment area of 338 square kilometers and a total capacity of 123.7 million cubic meters. One kilometer downstream of the dam is the town of Liuduzhai with a population of about 50,000. Additionally, within 80 km downstream of the Liuduzhai Dam, there are three cities with a total population of approximately 1 million. It is worth noting that the operating Huai Shao Heng high-speed railway is located 30 km downstream of the study site. Therefore, the stability of the dam directly affects the safety of downstream towns and critical infrastructure.
The geological strata exposed in the reservoir area, arranged chronologically from old to new, consist of the QingbaikouBanxi Group (QbB), followed by the Lower Tanian system (Z1) and Tiaomajian Formation of the Mid-Devonian System (D2t), as well as Qiziqiao Formation of the Mid-Devonian System (D2q) and Quaternary System deposits (Q) [35]. The geological strata exposed in the dam, ranging from ancient to modern, consist of the Lower Tanian system (Z1), Tiaomajian Formation of the Mid-Devonian System (D2t), Qiziqiao Formation of the Mid-Devonian System (D2q), residual slope deposit of the Quaternary System (Qel + dl), alluvial deposit (Qal), and artificial filling soil (Qml) [35]. The regional geological map of the Liuduzhai reservoir is illustrated in Figure 2. The reservoir region is characterized by a tight and closely folded NE trending linear zone and a dominant NE trending fault zone within the Xinhuaxia Formation [35]. The primary orientation of the structural line is towards the northeast. There are a total of 42 faults of varying sizes within the dam area, with the Liuduzhai–Qijiang fault (F149) being a significant regional fault spanning over 20 km in length, trending at an angle of 30°–40° while dipping to the northwest at an inclination between 75°–87°, and featuring a fracture zone width measuring up to 34 m [35]. The fault consists of a substantial amount of grey-black gouge and breccia, as well as a minor amount of unconsolidated compressional grey clumps that exhibit thrust fault characteristics [35]. It traverses the downstream area of the dam site and serves as a primary tectonic control of the reservoir area.

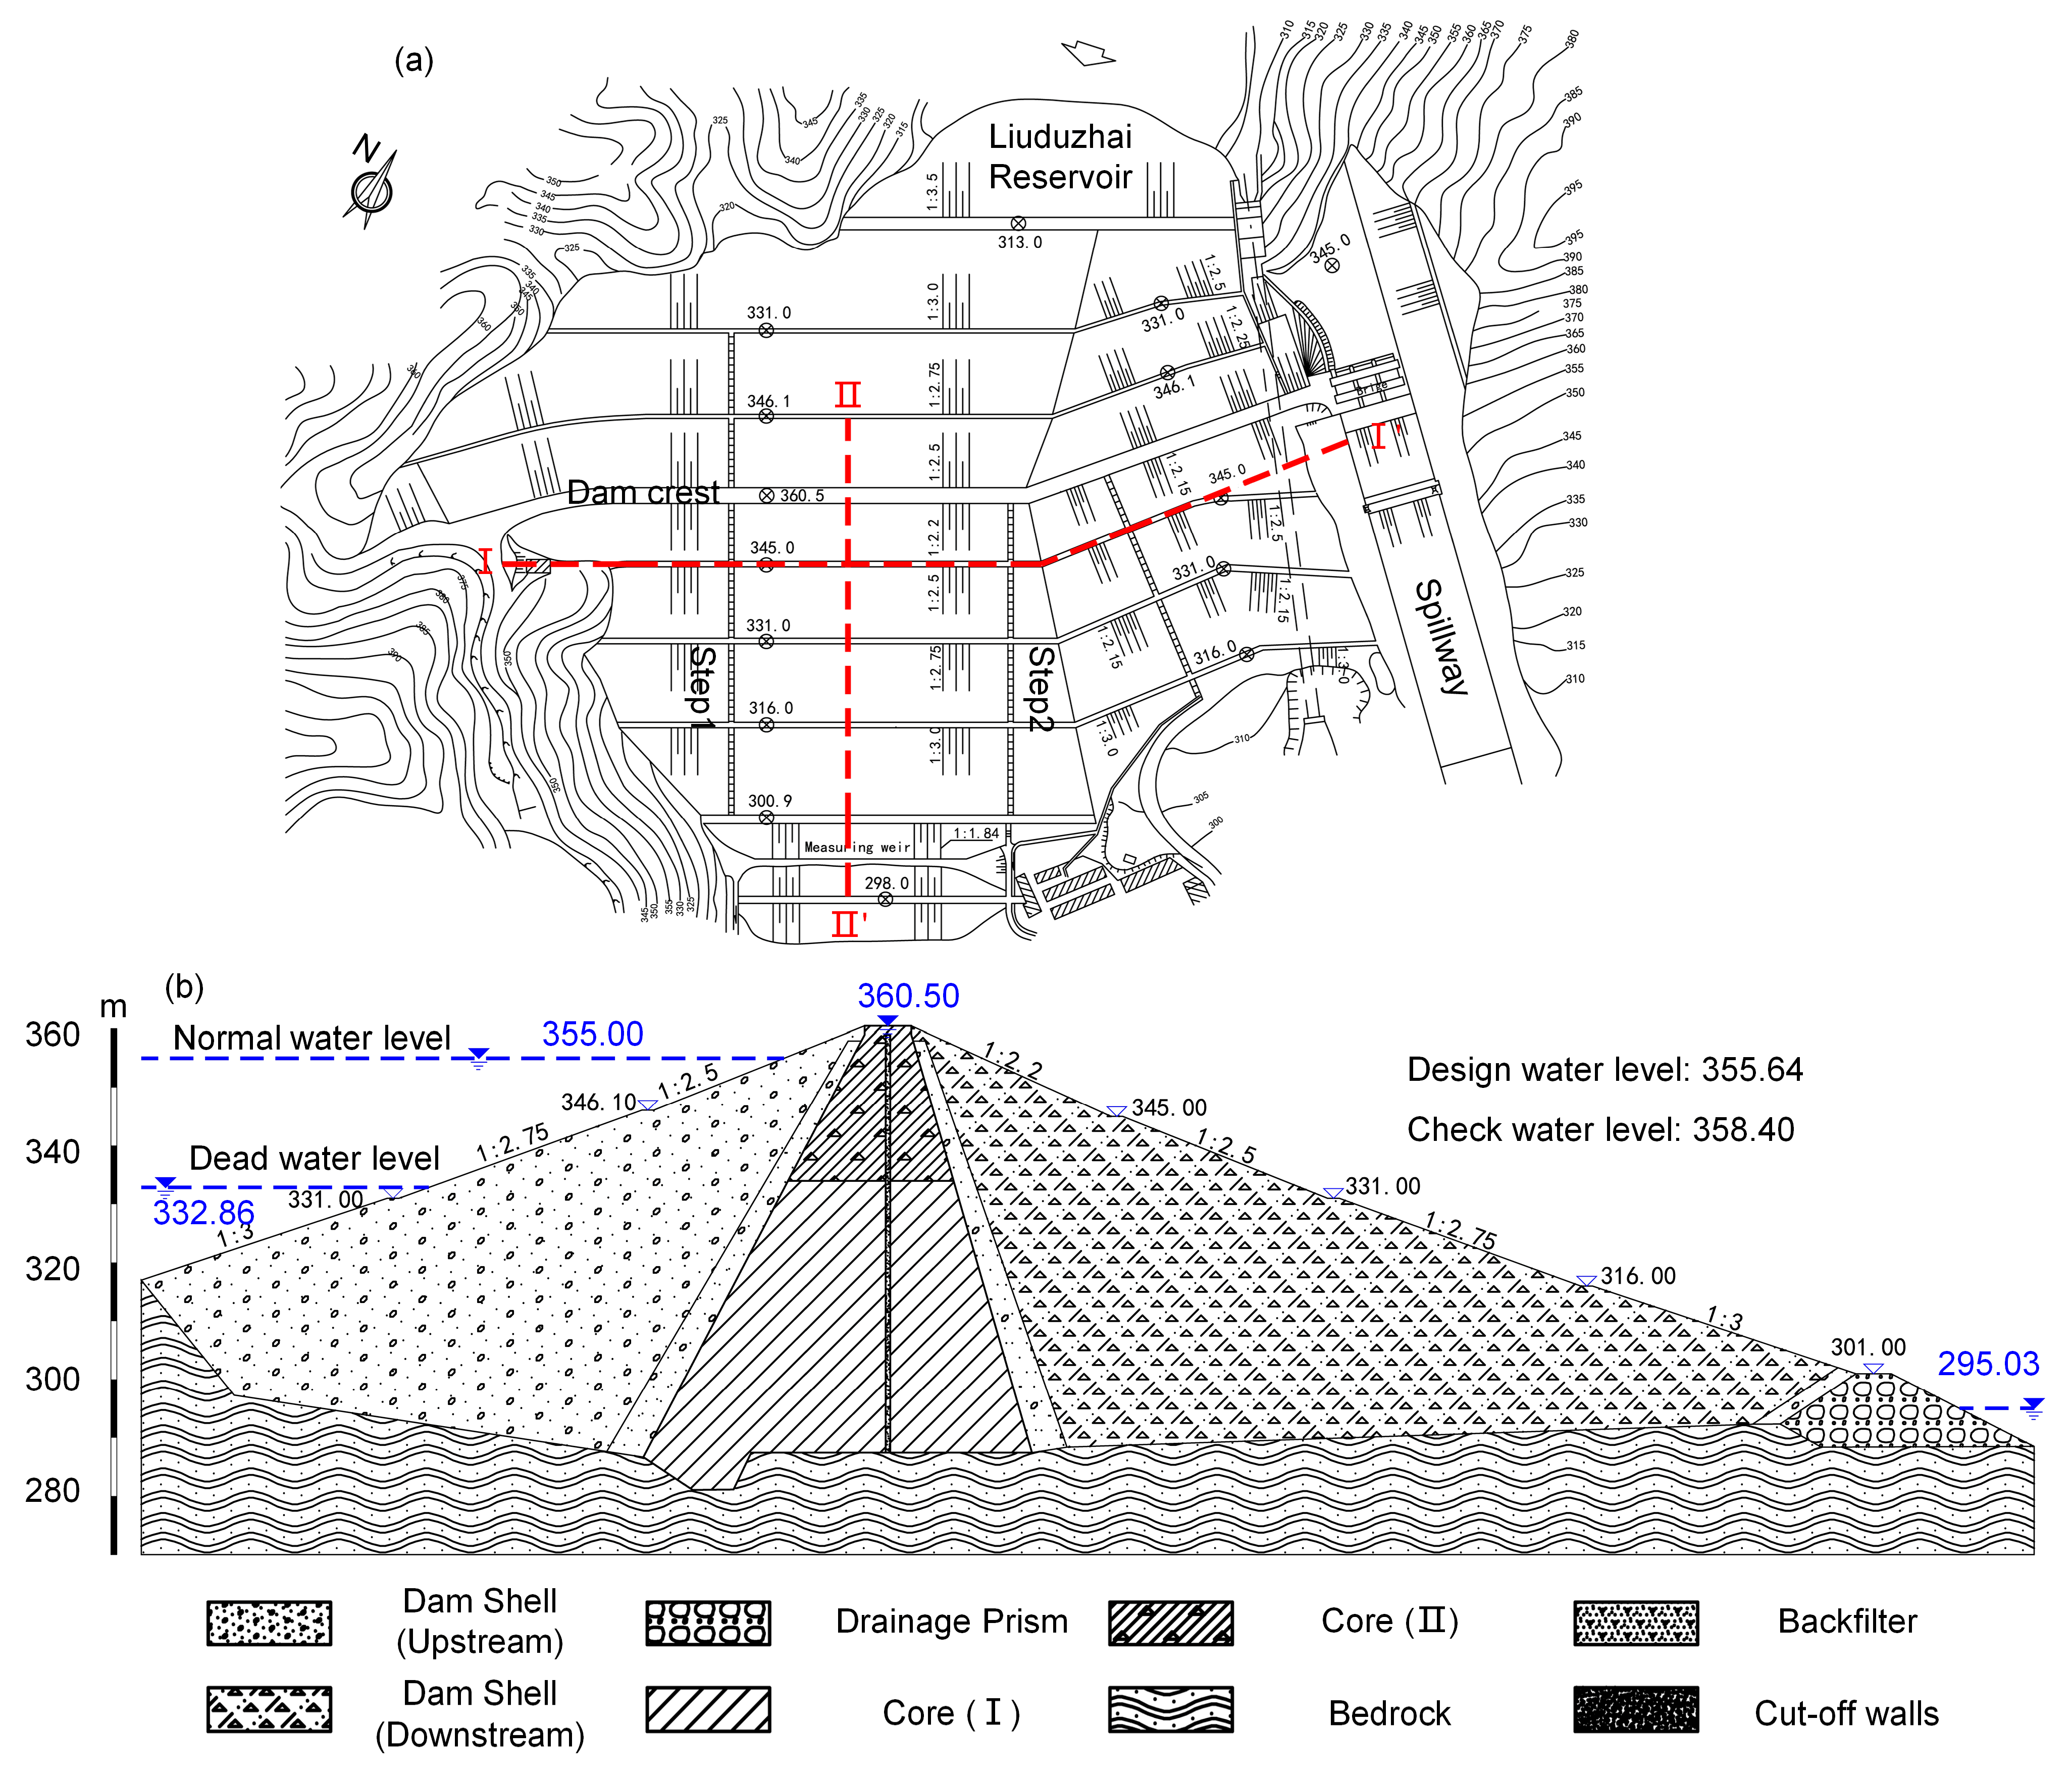
2.2. Dam Description

The Liuduzhai Dam is a clay-core earth-rock dam, which is the largest earth-rock dam in Hunan Province. It was built between 1978 and 1986, and began to impound water in 1991. The height of the Liudyzhai dam is 70.0 m, with a crest length of 480 m and a width of 8 m. The dam crest elevation is 360.5 m, and the normal water level is 355.0 m. The width-to-height ratio of the dam is 2.5 to 3.5 for upstream and 3.0 to 2.5 for downstream, as shown in Figure 3a,b. The initial stage of the dam construction was suspended for a period of two years due to issues such as excessive moisture and clay content in the core, resulting in multiple surface cracks below the standard water level. In the second stage, mechanical construction was adopted, and the unqualified core walls were treated by excavation and backfilling with qualified soil materials. However, the problem of seepage-related safety has been accompanying the operation of the dam. In 2000, the Hunan Province Water Resources and Hydropower Scientific Research Institute conducted a safety assessment of the dam, concluding that the seepage safety performance was unsatisfactory and classified as a third-class dam [36]. Based on field investigations and the test analysis of drilling sampling, the main problems of the dam that exist are:
(1)
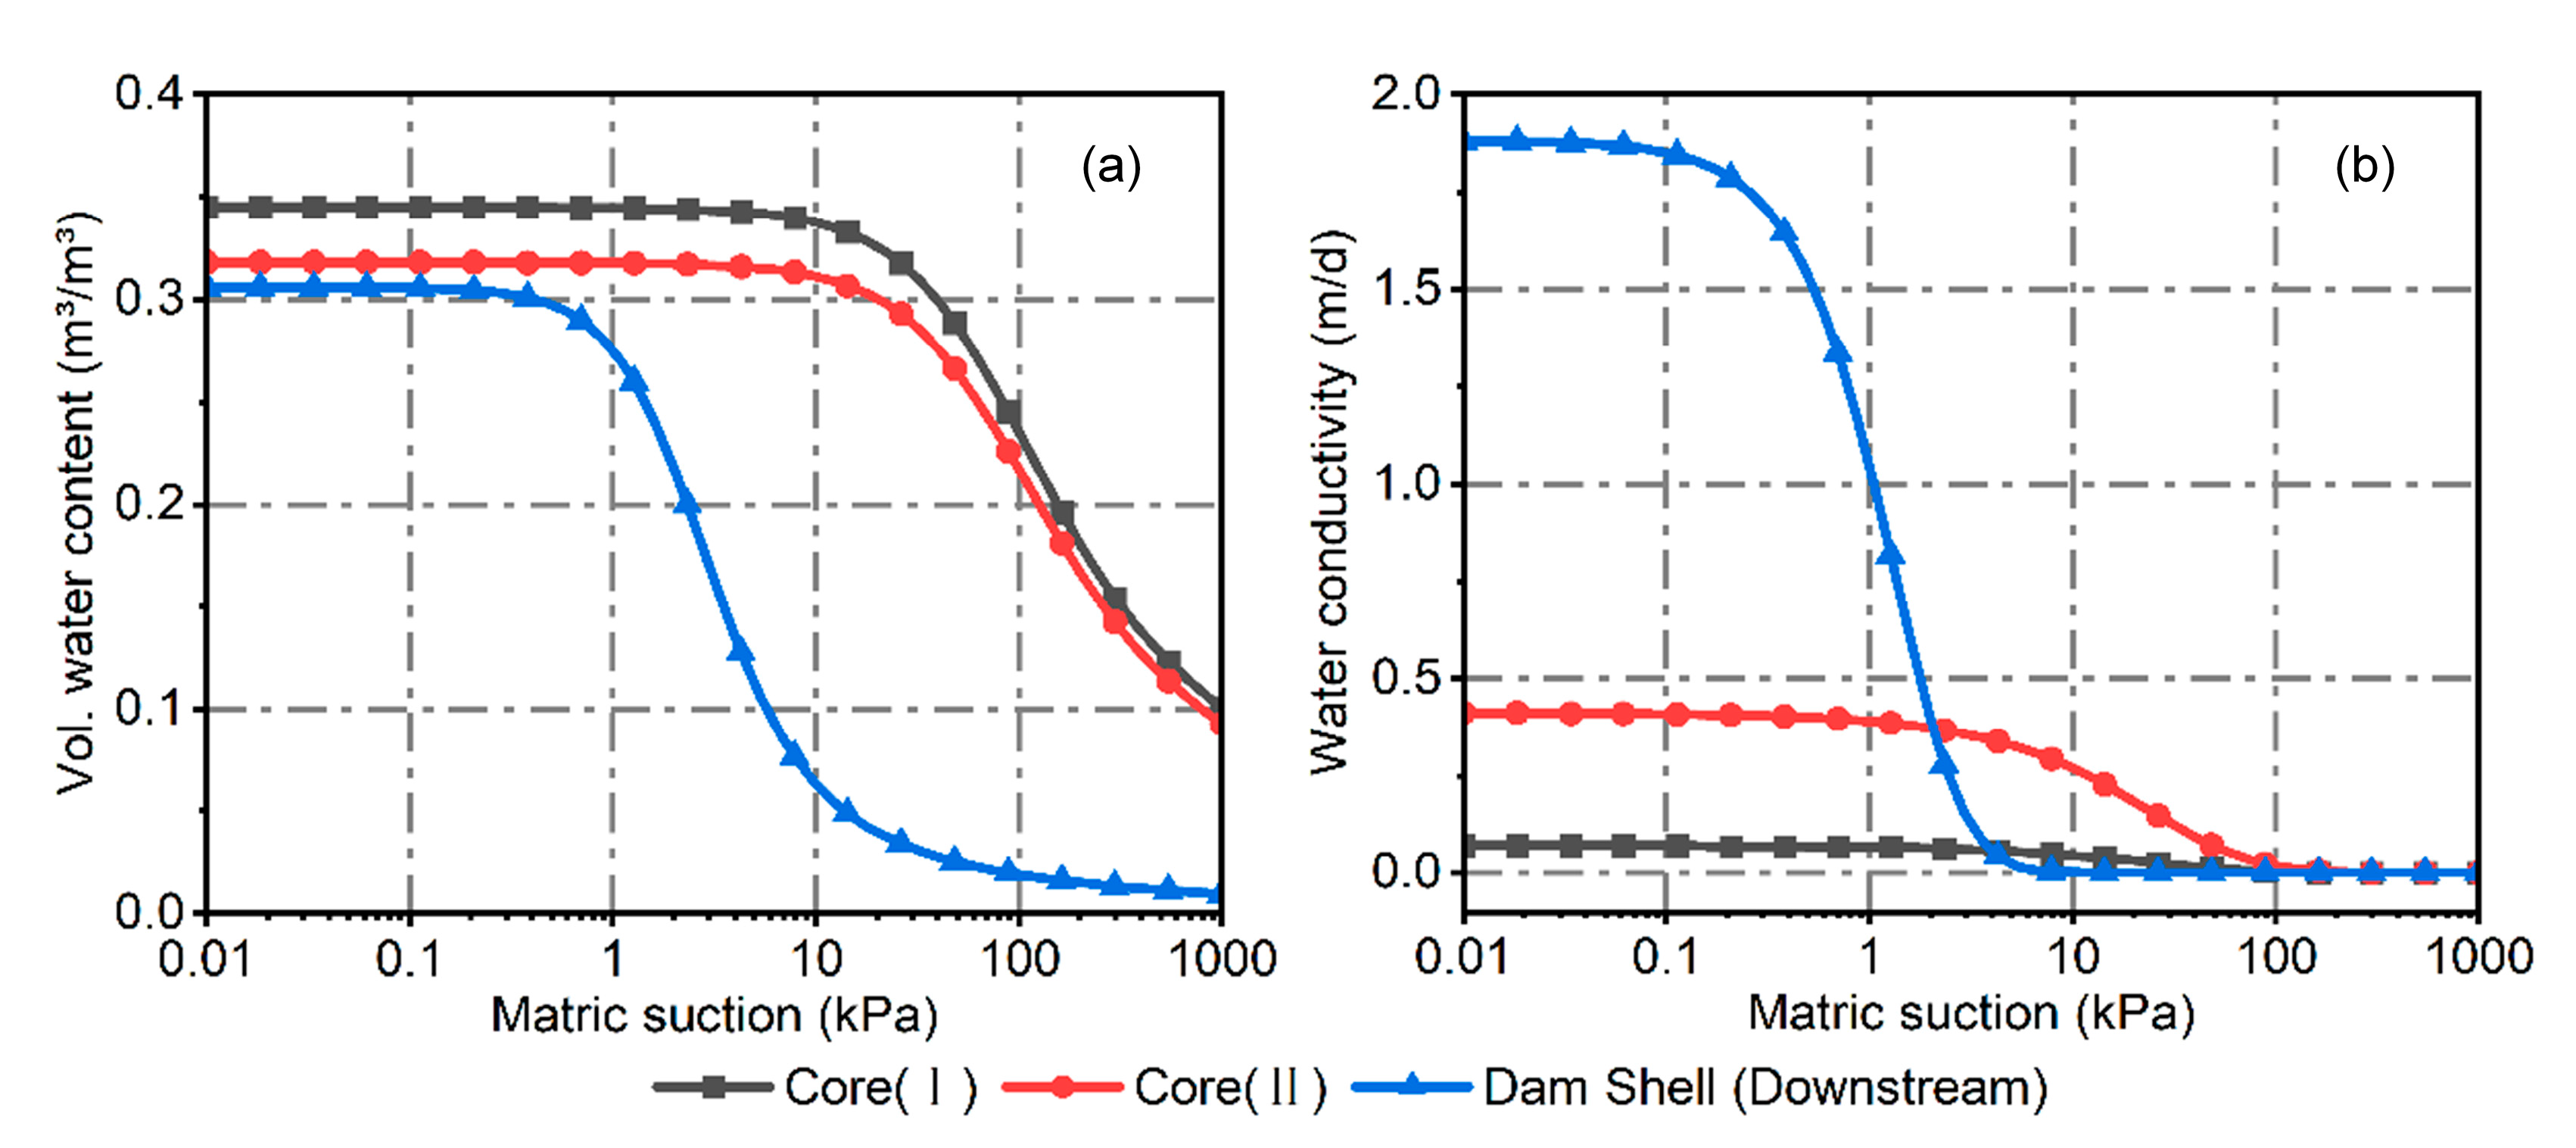
The filling material for the clay-core wall does not meet the standards, resulting in a relatively high permeability coefficient.
(2)
The downstream dam shell (gravel-clay mixture) is unevenly filled, resulting in a large difference in the permeability coefficient.
(3)
The concentrated leakage and humid zone detected at the berm at the elevation of 345.0 m in relation to the outer slope of the dam showed that the amount of leakage and the scope of the humid zone increased with the rise of the reservoir level.
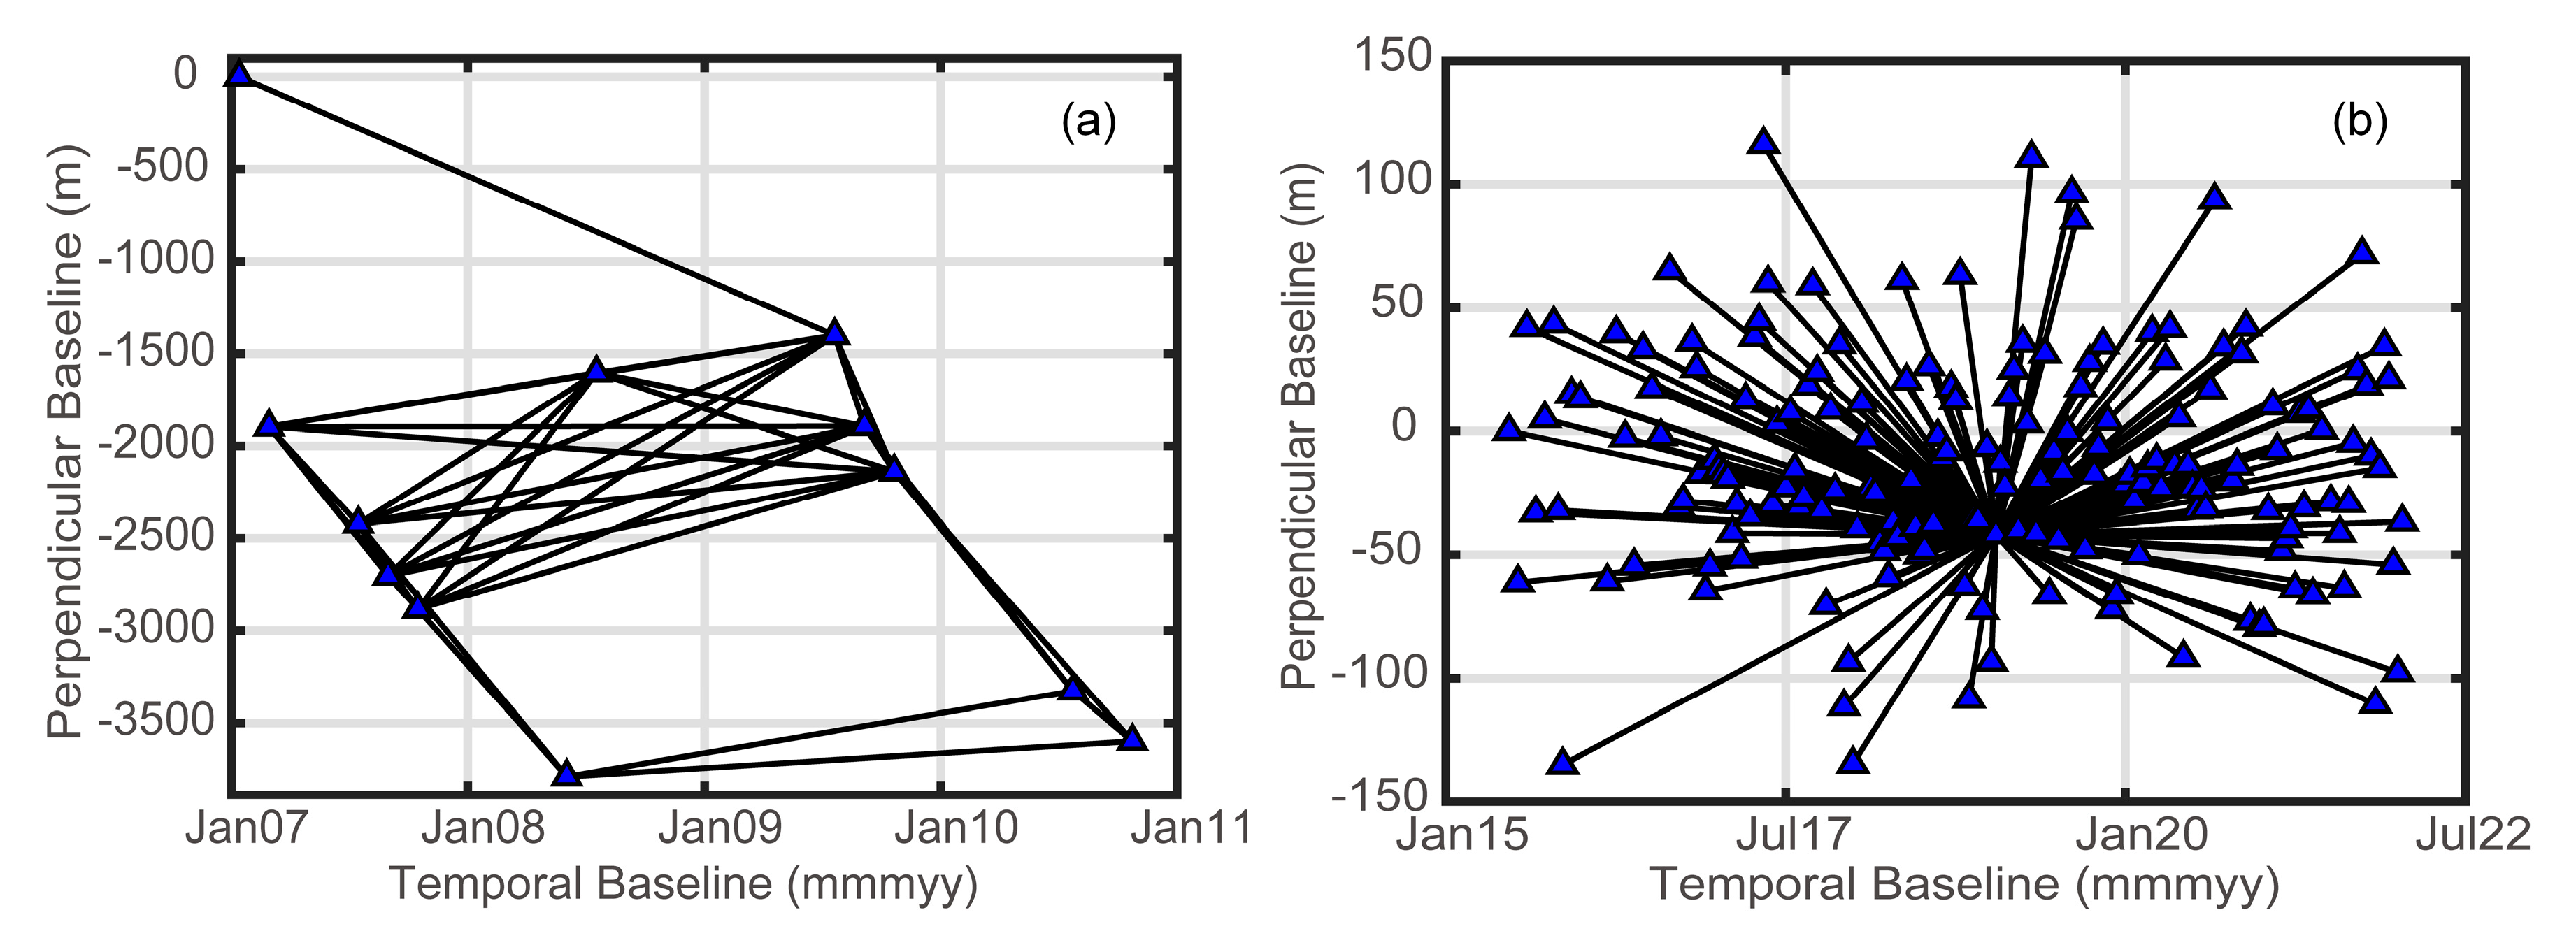
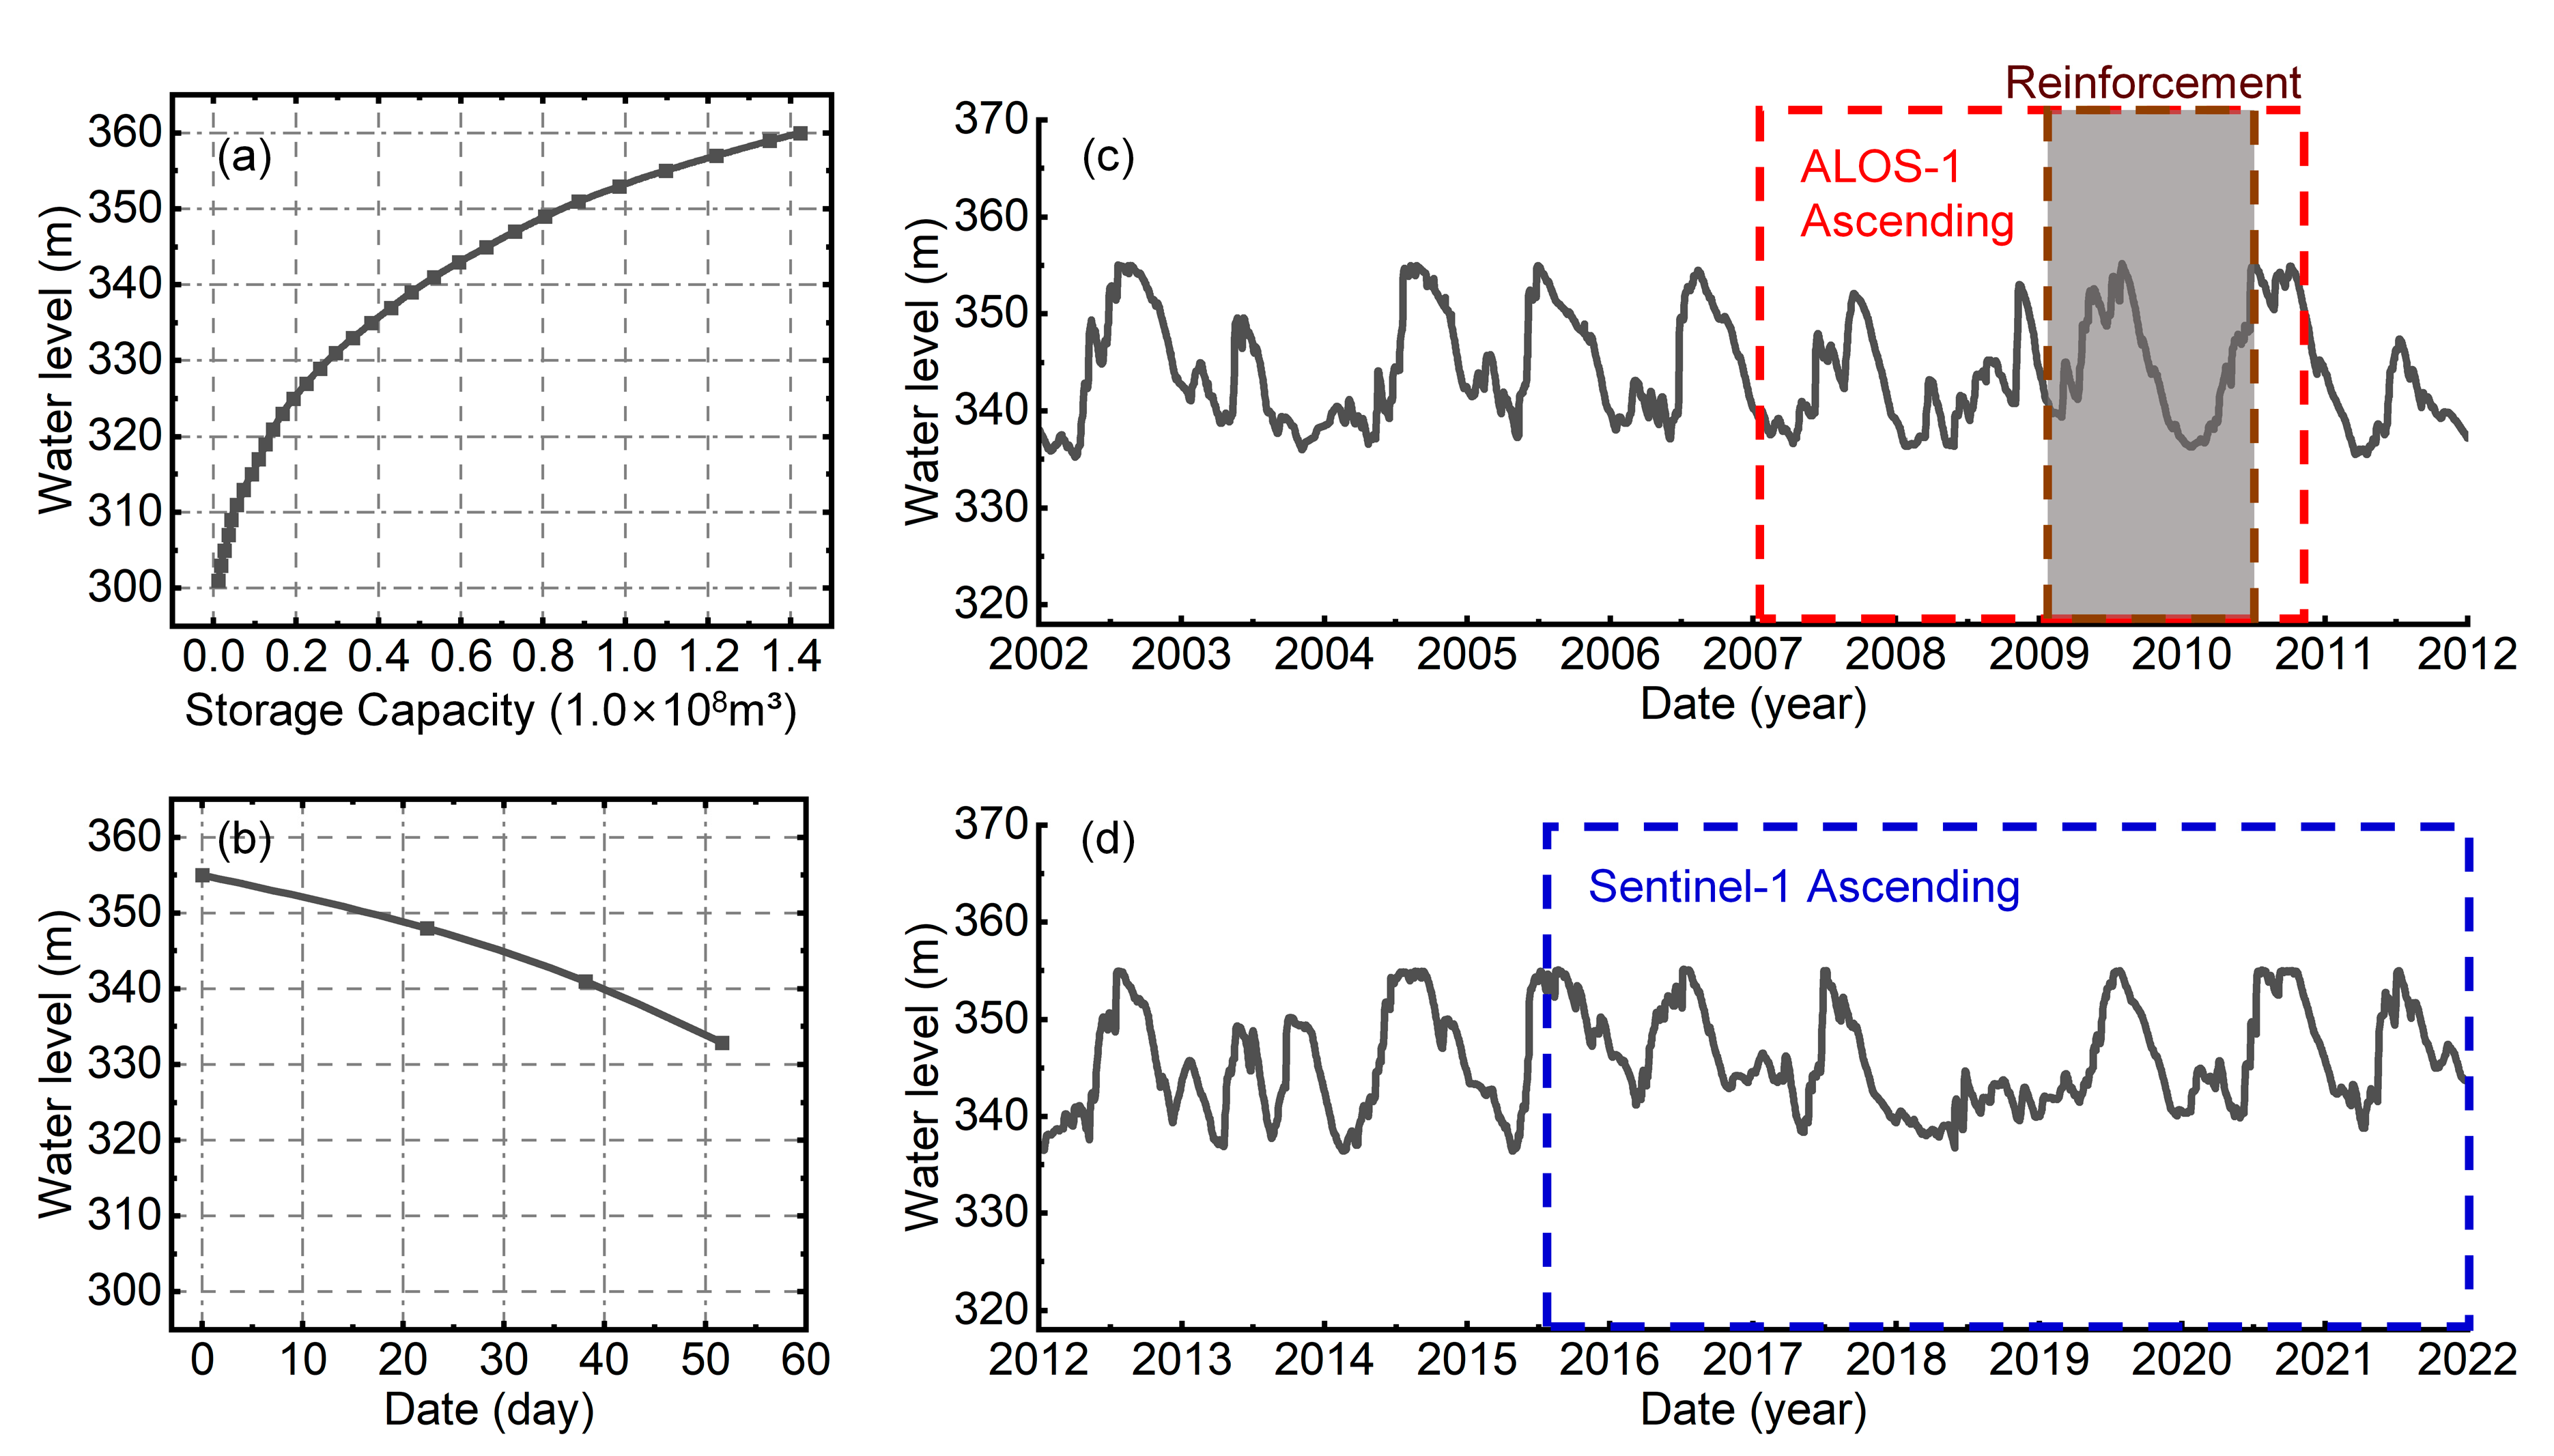
To ensure the safety of downstream towns and infrastructure, the reservoir authority implemented dam reinforcement between 13 January 2009, and 29 May 2010. A 0.6–0.8 m plastic concrete cut-off wall with an extremely low permeability coefficient was installed inside the clay-core, as shown in Figure 3b, to reduce the infiltration line and dynamic seepage of the downstream dam shell [5,37].

2.3. SAR Data

The ALOS-1 satellite from the Japan Aerospace Exploration Agency (JAXA) was launched in January 2006 and terminated operation in April 2011. In the Stripmap (SM) imaging mode, the range resolution is approximately 4.7 m, and the azimuth resolution is approximately 3.2 m. According to the investigation, 12 Ascending images from 13 January 2007 to 24 October 2010 can be obtained in the study area. Although the maximum time interval is 368 days, the data were acquired using L-band (~23.6 cm) to ensure coherence. Therefore, ALOS-1 PALSAR data can be used in this study to recover the deformation field of the Liuduzhai Dam before reinforcement.
The Sentinel-1 A/B satellites from European Space Agency’s Copernicus program (ESA) were launched in 2014 with a revisit period of 12 days. In Interferometric wide swath mode (IW), the range resolution of Sentinel-1 A/B images is about 2.33 m, and the azimuth resolution is about 13.97 m. As of 14 January 2022, a total of 174 C-band (~5.6 cm) Sentinel-1A Ascending images were archived in the study area from 20 June 2015 to 14 January 2020, which provides an excellent opportunity for our research. In this study, Sentinel-1A data can be used to recover the deformation field of the Luduzhai Dam after reinforcement. The parameters of the ALOS-1 PALSAR and Sentinel-1A datasets used in this study are shown in Table 1.

3. Methodology

3.1. MT-InSAR

According to the principle of D-InSAR, the interferometric phase can be decomposed into several components:
= t o p o + d e f + a t m + n o i s e
where t o p o represents the residual phase of the digital elevation model (DEM), d e f is the deformation phase, and a t m is the atmospheric phase. In addition, the interferometric phase also includes the random noise phase n o i s e . During the processing, in order to effectively overcome the influence of temporal and spatial decorrelation error, DEM error, and atmospheric delay in D-InSAR, the Permanent Scatterers InSAR (PS-InSAR) technique was proposed [38,39]. The PS-InSAR technique utilizes permanent scatterers as point targets, which exhibit higher temporal stability, enabling effective detection of small deformations in artificial structures such as cities, bridges, and dams [38,39]. However, to guarantee the accuracy of deformation solutions, the PS-InSAR technique necessitates a larger number of images [38,39]. Different from PS-InSAR, Small Baseline Subset InSAR (SBAS-InSAR) method proposed by Berardino uses the least squares method to solve deformation parameters by selecting image pairs with temporal and spatial baselines that meet the low threshold [40]. Nevertheless, the SBAS-InSAR method employs distributed scatterers as point targets, which may introduce atmospheric delay and noise, leading to inevitable impacts on dam deformation monitoring at the mm-level [41]. Moreover, the application of spatio-temporal filtering in the SBAS-InSAR method to estimate atmospheric phase screens may result in the loss of deformation details [42]. Consequently, the SBAS-InSAR method is not as effective as PS-InSAR in detecting small deformations in terms of phase decorrelation or low coherence. Both PS-InSAR and SBAS-InSAR have demonstrated successful applications in monitoring the deformation of earth-rock dams [10,18,21,22,23,43]. However, considering the specific characteristics of the SAR dataset before and after the reinforcement of the Liuduzhai Dam, it is more reasonable to employ the PS-InSAR and SBAS-InSAR methods at different stages. Specifically, for the 12 scenes of ALOS-1 ParSAR images, the SBAS-InSAR method can be utilized to recover the deformation field before the dam reinforcement. On the other hand, for the 174 scenes of Sentinel-1A images, the PS-InSAR method is more suitable for recovering the deformation field after the dam reinforcement. The image pairs with temporal and spatial baselines are shown in Figure 4a,b.

3.1.1. SBAS-InSAR

SBAS-InSAR technology is a method proposed by Berardino in 2002 for inverting surface time series deformation. This technique involves selecting appropriate image pairs with temporal and spatial baselines to invert the time series deformation [40]. According to the unwrapped interferometric phase δ j ( x ) of the j th interferogram at the x th coherent point, the following equation can be established:
δ j ( x ) = B j P ( x ) + δ N j ( x )
where P x = d L P x ,   E z x T is the parameter matrix to be estimated, with d L P x representing the low-pass deformation that can be modeled at the x th coherent point, such as linear and seasonal deformations, and E z x representing the residual of DEM at the x th coherent point; B j is the design matrix with its elements being coefficients related to the parameters to be estimated; δ N j ( x ) is the residual phase matrix, including the high-pass deformation, Gaussian noise, and atmospheric delay that cannot be modeled. Assuming there are M interferograms, Equation (2) forms a model with M equations and n + 1 unknowns (where n depends on the complexity of the model used for d L P x , e.g., n = 1 for a linear model). When M n + 1 , the model can be solved using the least squares method.
Subsequently, high-pass and low-pass filtering methods are applied to separate the residual phase into high-pass deformation phase δ N j d e f x based on the spatio-temporal correlation characteristics of atmospheric and noise effects, as proposed by [38,39]. Then, the low-pass deformation d L P x is added back to the interferogram. At this point, the interferometric phase at the x th coherent point on the j th interferogram is given by:
δ j x = k = I S j + 1 I E j 4 π λ t k t k 1 v k x + δ N j d e f x
j = 1 , , M
where v k x represents the average deformation velocity between adjacent SAR image acquisition epochs. Similarly, Equation (3) can also be formulated as a model with M equations and N 1 unknowns ( N being the number of SAR images). When M N 1 , parameter estimation can be performed using the least squares method. Finally, the estimated average deformation velocity v k x is integrated over time to obtain the time series of surface deformations.

3.1.2. PS-InSAR

PS-InSAR is a technique that employs differential interferometric SAR processing to measure and analyze the amplitude or phase information of multiple SAR images, in order to identify permanent scatterers (PS) that are insensitive to temporal and spatial effects. The selected PS points are then used to construct an arc and establish a functional model for deformation, topography, and the residue phase [38,39,44]. The differential interferometric phase between adjacent PS points can be expressed as:
d i f f = 4 π λ B R s i n θ h + 4 π λ T · v + r e s
where h represents the relative increment of DEM error, v represents the increment of deformation velocity, and r e s represents the residual phase term, including the atmospheric phase, non-linear deformation phase, and noise phase. Parameter estimation can be expressed as:
β = max 1 N 1 N ( c o s ω + j · s i n ω )
where β is the temporal coherence coefficient of the arc, where a higher value indicates a smaller model error. ω denotes the difference between the observed and fitted values. The residual phase of the time series can be obtained by subtracting the modeled phase from the original interferometric phase. A filtering approach can be employed to remove the atmospheric phase in both temporal and spatial domains, ultimately recovering the non-linear deformation [18,24].

3.2. Seepage Analysis

Seepage analysis is an important research topic in soil mechanics. Geostudio SEEP/W, as a popular numerical simulation software, has been widely used in steady-state and transient seepage analysis of dams [34,45] and slopes [46,47,48].

3.2.1. The Seepage Equation of Unsaturated Soil

According to Darcy’s law and the mass conservation equation, the difference between the inflow and outflow of fluid at a certain point of an element within a certain time period equals the change in the volumetric water content of the soil. The differential equations for two-dimensional seepage can be expressed as [49]:
x k x H x + y k y H y + Q = θ t
where H represents the total hydraulic head, k x , k y represent the hydraulic conductivity in the x and y directions, Q represents the applied boundary flux, θ represents the volume of water content, and t represents time. For steady-state seepage, the right-hand side of Equation (7) equals zero. For unsaturated soil problems, various empirical and semi-empirical equations have been used to define the soil-water characteristic curve (SWCC) [50,51,52] and hydraulic conductivity function (HCF) [53,54].
θ = θ r + θ s θ r l n e + Ψ / a n m
k = k s θ θ r θ s θ r p
where θ s , θ r are the saturated and residual volumetric water content, Ψ is the matrix suction, and a , n and m are the parameters of the fitted matrix suction function. k and k s are the hydraulic conductivity and saturated hydraulic conductivity, respectively, and p is a constant that depends on the soil material. According to the initial conditions and boundary conditions of the equation, the seepage field can be solved.
H x , y , 0 = H 0 x , y Ω
H x , y , t = H t x , y S 1
k H n | S 2 = q x , y , t x , y S 2
where H 0 is the initial total hydraulic head, Ω is the model calculation area, H t is the instantaneous nodal head that varies with time, S 1 , S 2 are the known total hydraulic head and flux boundary conditions, n is the normal direction of the seepage surface, and q x , y , t is the nodal flux that varies with time.
Currently, the finite element method has become the most efficient approach for solving the seepage equation. The basic principle is to discretize the research object into a finite number of elements and discretize the function to be solved, which can solve the difficulty of infinite degrees of freedom. Then, by interpolation, the elements are connected into a whole according to certain rules.

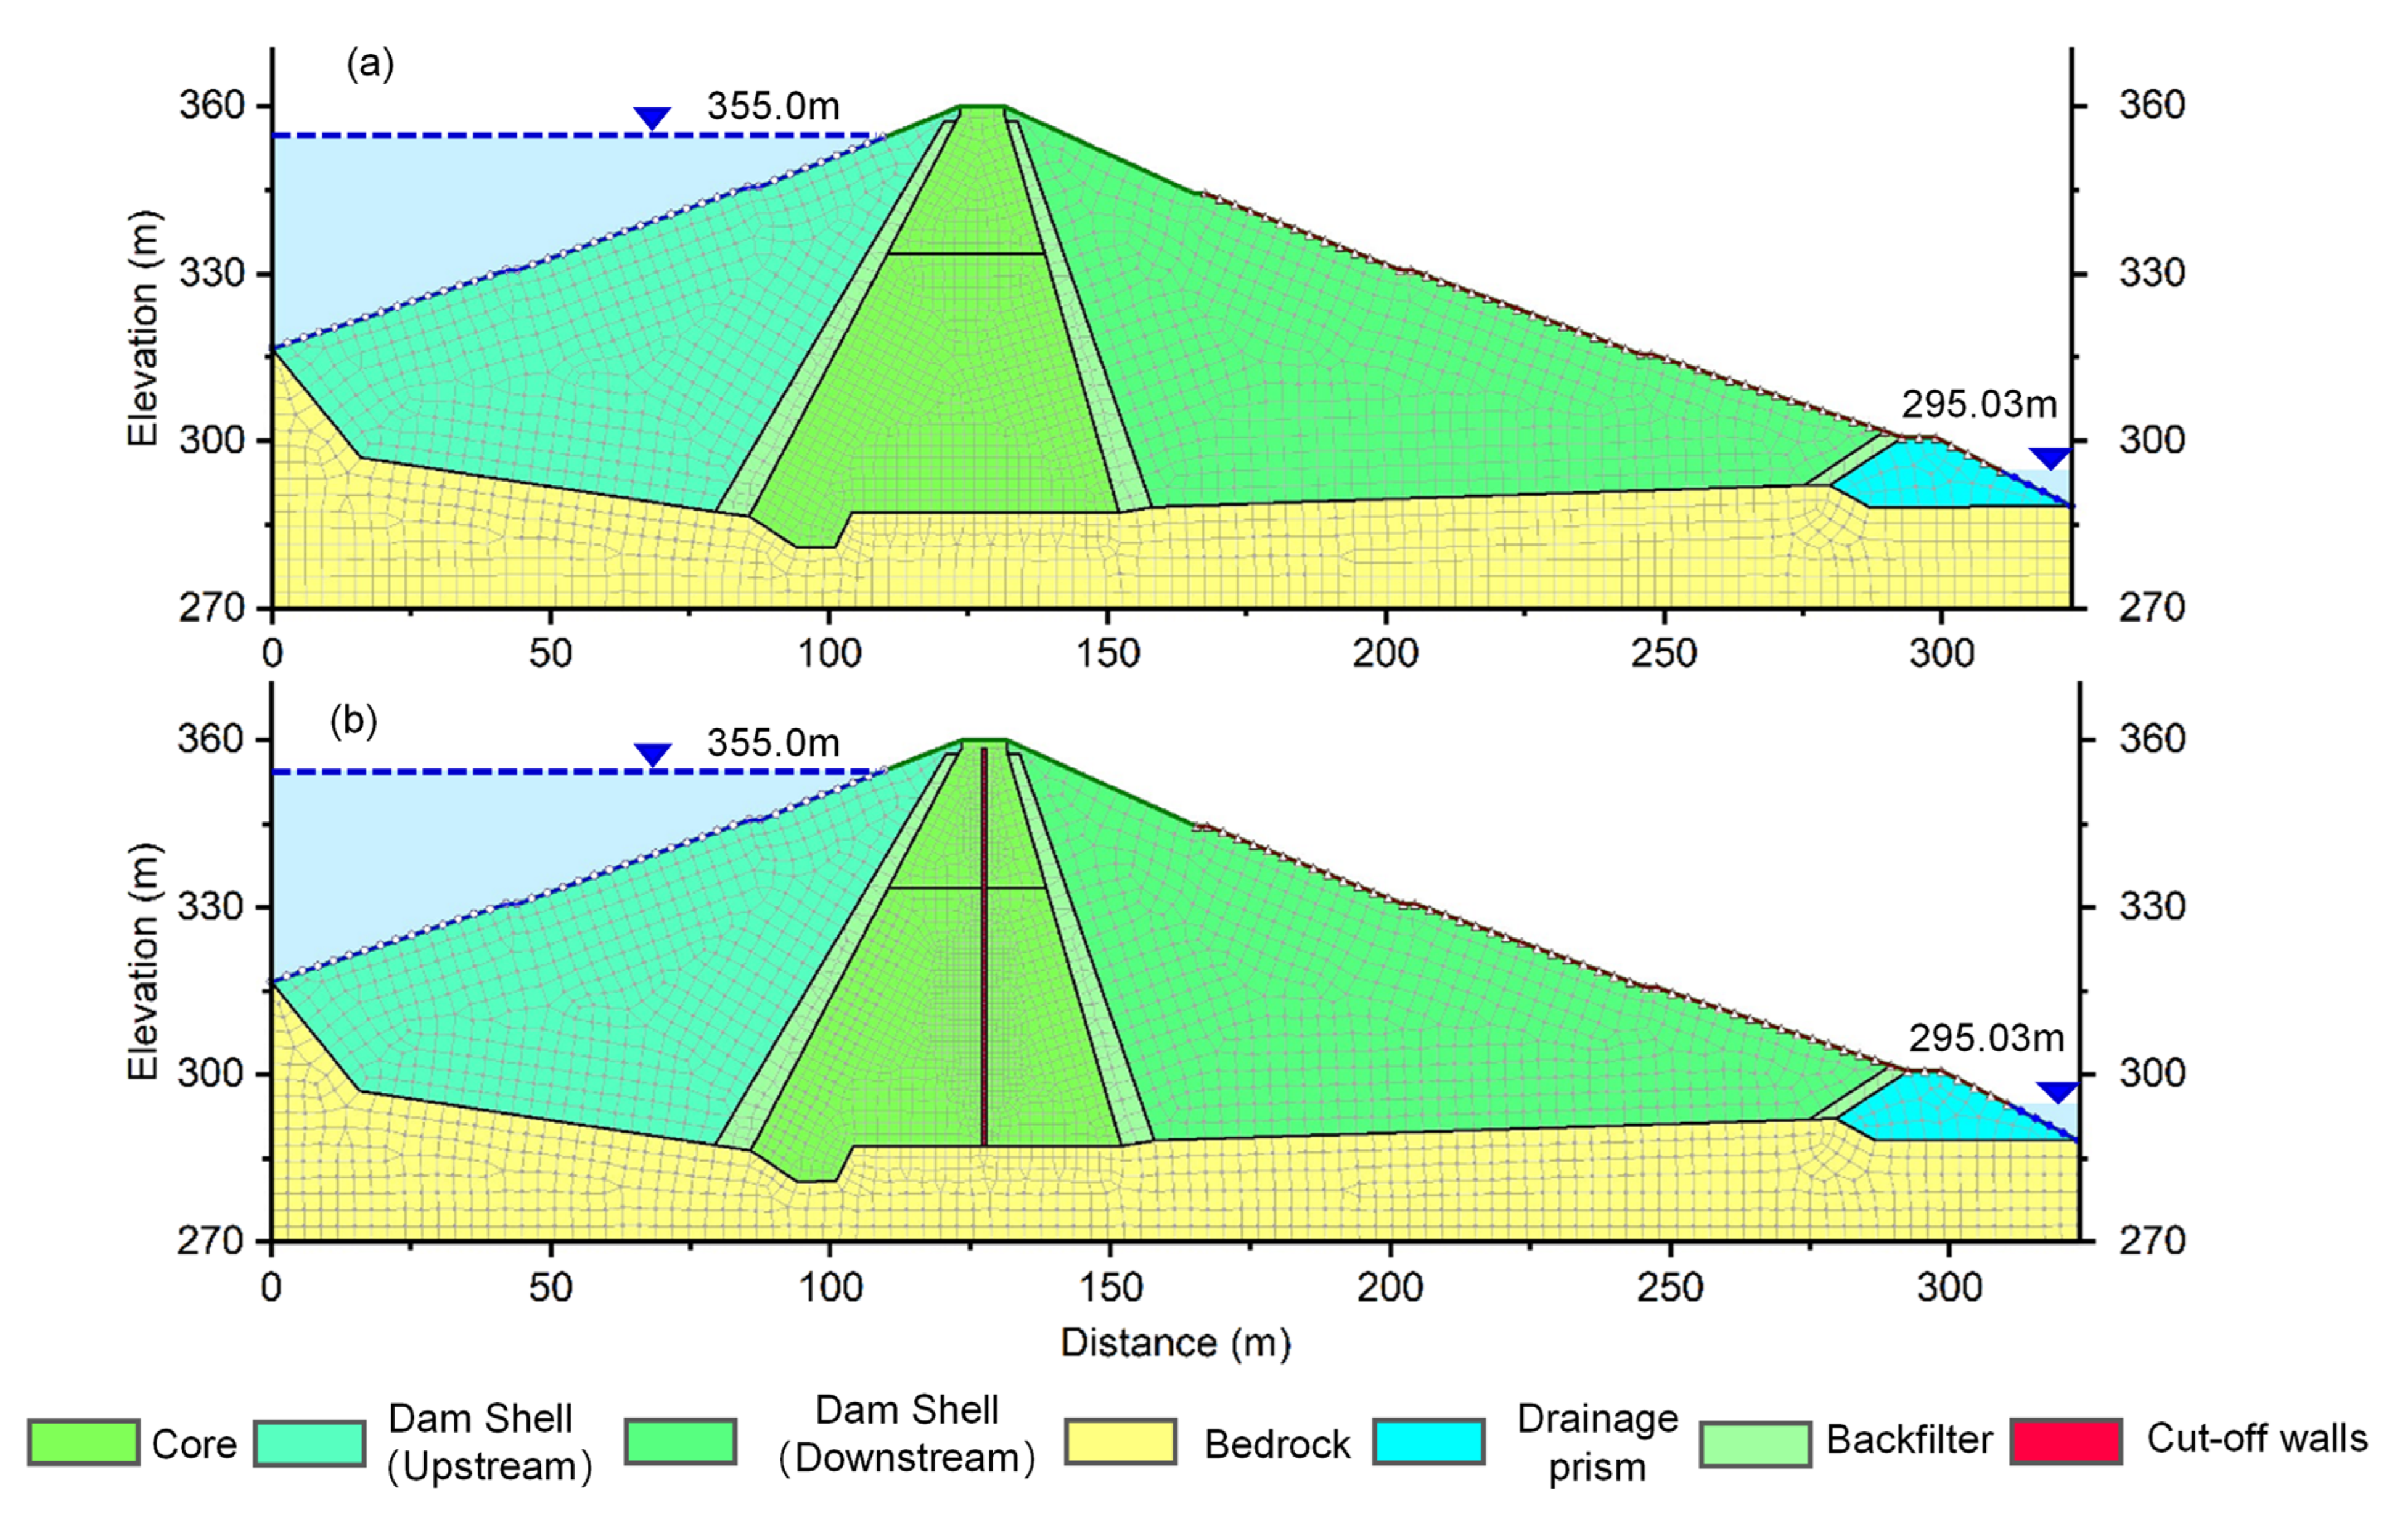
3.2.2. Numerical Model and Boundary Conditions

To obtain the dynamic seepage field of Liuduzhai Dam before and after the reinforcement, a finite element model of the dam was established based on the geological conditions and properties (Figure 5). Considering the geometric dimensions of the dam, the grid spacing of the plastic concrete cut-off walls and clay-core wall in the model were set to 1 m and 2 m, respectively, and the grid spacing of other materials was set to 3 m. The mesh model of the dam before reinforcement consisted of 2783 nodes and 2692 elements. The numerical model of the dam after reinforcement consisted of 3293 nodes and 3215 elements.
As shown in Equation (7), the permeability coefficient ( k ) is a key parameter for solving the seepage field. In this study, the parameters (Table 2) used for the seepage analysis were obtained from the engineering geological report and reinforcement design report of the Liuduzhai reservoir dam project. These results were compiled by the Changjiang Institute of Survey, Planning, Design and Research and are approved for use by the Liuduzhai Reservoir Authority [35]. The parameters in the report are obtained by situ water injection test, water pressure test and laboratory soil test of the undisturbed soil samples [35]. The unsaturated soil properties of the core-wall and downstream dam shell materials were considered in this study. The SWCC was estimated based on the material sample functions of the SEEP/W module using the saturated water content, and the HCF was estimated based on the Fredlund and Xing method using the SWCC [55], as shown in Figure 6.
Regardless of steady-state or transient seepage analysis, boundary conditions are essential for solving the seepage field. To analyze the seepage characteristics before and after reinforcement, three conditions were set to the fixed water level of the upstream dam for steady seepage analysis, namely the normal water level, design flood level, and check water level, as shown in Table 3. We plotted the hydrological parameters of the Liuduzhai reservoir, as shown in Figure 7. Unsteady seepage calculation was performed based on the water level drop duration curve (Figure 7b) calculated according to the reservoir capacity curve (Figure 7a) and the discharge mode. To reveal the response characteristics of dam deformation and dynamic seepage before and after reinforcement, unsteady seepage calculation was performed based on the water level fluctuations curve during the InSAR observation period (Figure 7c,d). The total head boundary of different conditions was set upstream of the dam (Figure 5); the bottom of the model was set as impermeable. The downstream of the dam boundary above the water level of the measuring weir is set as the drainage. Below the water level of the measuring weir, it was set as the fixed water head of 295.03 m.

4. Results

4.1. InSAR Mean Deformation Velocity

After over two decades of development, the MT-InSAR technique has evolved into a highly dependable method for monitoring deformation in regions with high coherence. The accuracy of InSAR results is contingent upon scatter coherence. The coherence thresholds utilized in the data processing of ALOS-1 and Sentinel-1A for this study are 0.4 and 0.6, respectively. According to the InSAR theoretical accuracy calculation method [56], the theoretical accuracy of InSAR results was calculated to be 6 mm and 1.8 mm, respectively. According to the ALOS-1 and Sentinel-1A datasets, the average Line Of Sight (LOS) deformation velocity was calculated using the SBAS-InSAR and PS-InSAR methods, shown in Figure 8, respectively. Negative values indicate movement away from the satellite direction, while positive values indicate movement towards the satellite direction. The ALOS-1 results (Figure 8a) show that the maximum deformation velocity of the dam before the reinforcement is −22.5 mm/yr, and the deformation zone is mainly concentrated in the middle of the dam body from the berm at an elevation of 331.0 m to the dam crest. The Sentinel-1A results (Figure 8b) show that after the reinforcement of the dam, the maximum deformation velocity is only −1.2 mm/yr, and the range of the deformation zone has significantly reduced compared to before. To quantitatively assess the deformation field before and after dam reinforcement, we calculated the average deformation velocity of the primary deformation zones, which were −11.7 mm/yr and −0.4 mm/yr, respectively. With the maximum deformation velocity of −1.2 mm/yr, our exhaustive survey of the existing literature has regrettably yielded no standardized methodology to quantify potential hazards for dams based on deformation velocity. However, in the case of earth-rock dams, greater emphasis is placed on determining whether the deformation pattern exhibits elastic or plastic behavior. The occurrence of plastic deformation can readily result in differential deformation, thereby exacerbating the leakage of the dam body due to cracks, as exemplified by the 2020 Sardoba dam failure [10]. The results of Sentinel-1 time series deformation show the significant periodic deformation signal characteristics after dam reinforcement, which will be presented in detail in Section 4.3. Occurrences of periodic deformation of this magnitude are commonly observed in dams affected by reservoir water fluctuations [2,57]. It is important to emphasize that the deformation velocity obtained in this study through fitting InSAR time series deformation results does not imply a direct multiplication with time to determine cumulative deformation. Due to the characteristics of side-view imaging in SAR satellites, InSAR technology is only capable of observing LOS deformation. The unavailability of descending SAR data within the study area precludes retrieval of the three-dimensional deformation field. The actual surface deformation may exceed the observed LOS deformation in magnitude [56]. However, this study exclusively focuses on characterizing the trend of before and after dam reinforcement in deformation. Since both datasets are from an ascending orbit, the SAR imaging geometry is nearly identical. Comparing Figure 8a,b, it can be concluded that the reinforcement of the dam significantly reduced the deformation magnitude and range of the dam, thus suppressing dam deformation effectively.
According to Figure 8, the deformation before and after the reinforcement is mainly located in the middle of the downstream dam with an elevation of 345.0 m in the berm, showing a spatial pattern of decreasing deformation towards the two dam abutments and the upstream and downstream sides. To reveal the detailed deformation pattern of the dam, deformation velocity profiles were plotted for two key cross-sections. Figure 9a shows that the InSAR deformation velocity observed by ALOS-1 generally decreases from the middle of the dam towards the two dam abutments. After the reinforcement, although the deformation velocity observed by Sentinel-1A has significantly reduced, the deformation trend is similar to that observed by ALOS-1. There is a jump in the deformation velocity observed by ALOS-1 at a distance of 260 m from the right dam abutment, which is not observed by Sentinel-1A. Figure 9b shows that the maximum deformation velocity on profile II-II’ with a dam height of 70 m is located near the berm of the downstream dam with an elevation of 345.0 m and gradually decreases towards the upstream and downstream sides. The explanation for why this deformation distribution pattern and maximum deformation velocity did not appear at the dam crest will be discussed in Section 5.1.

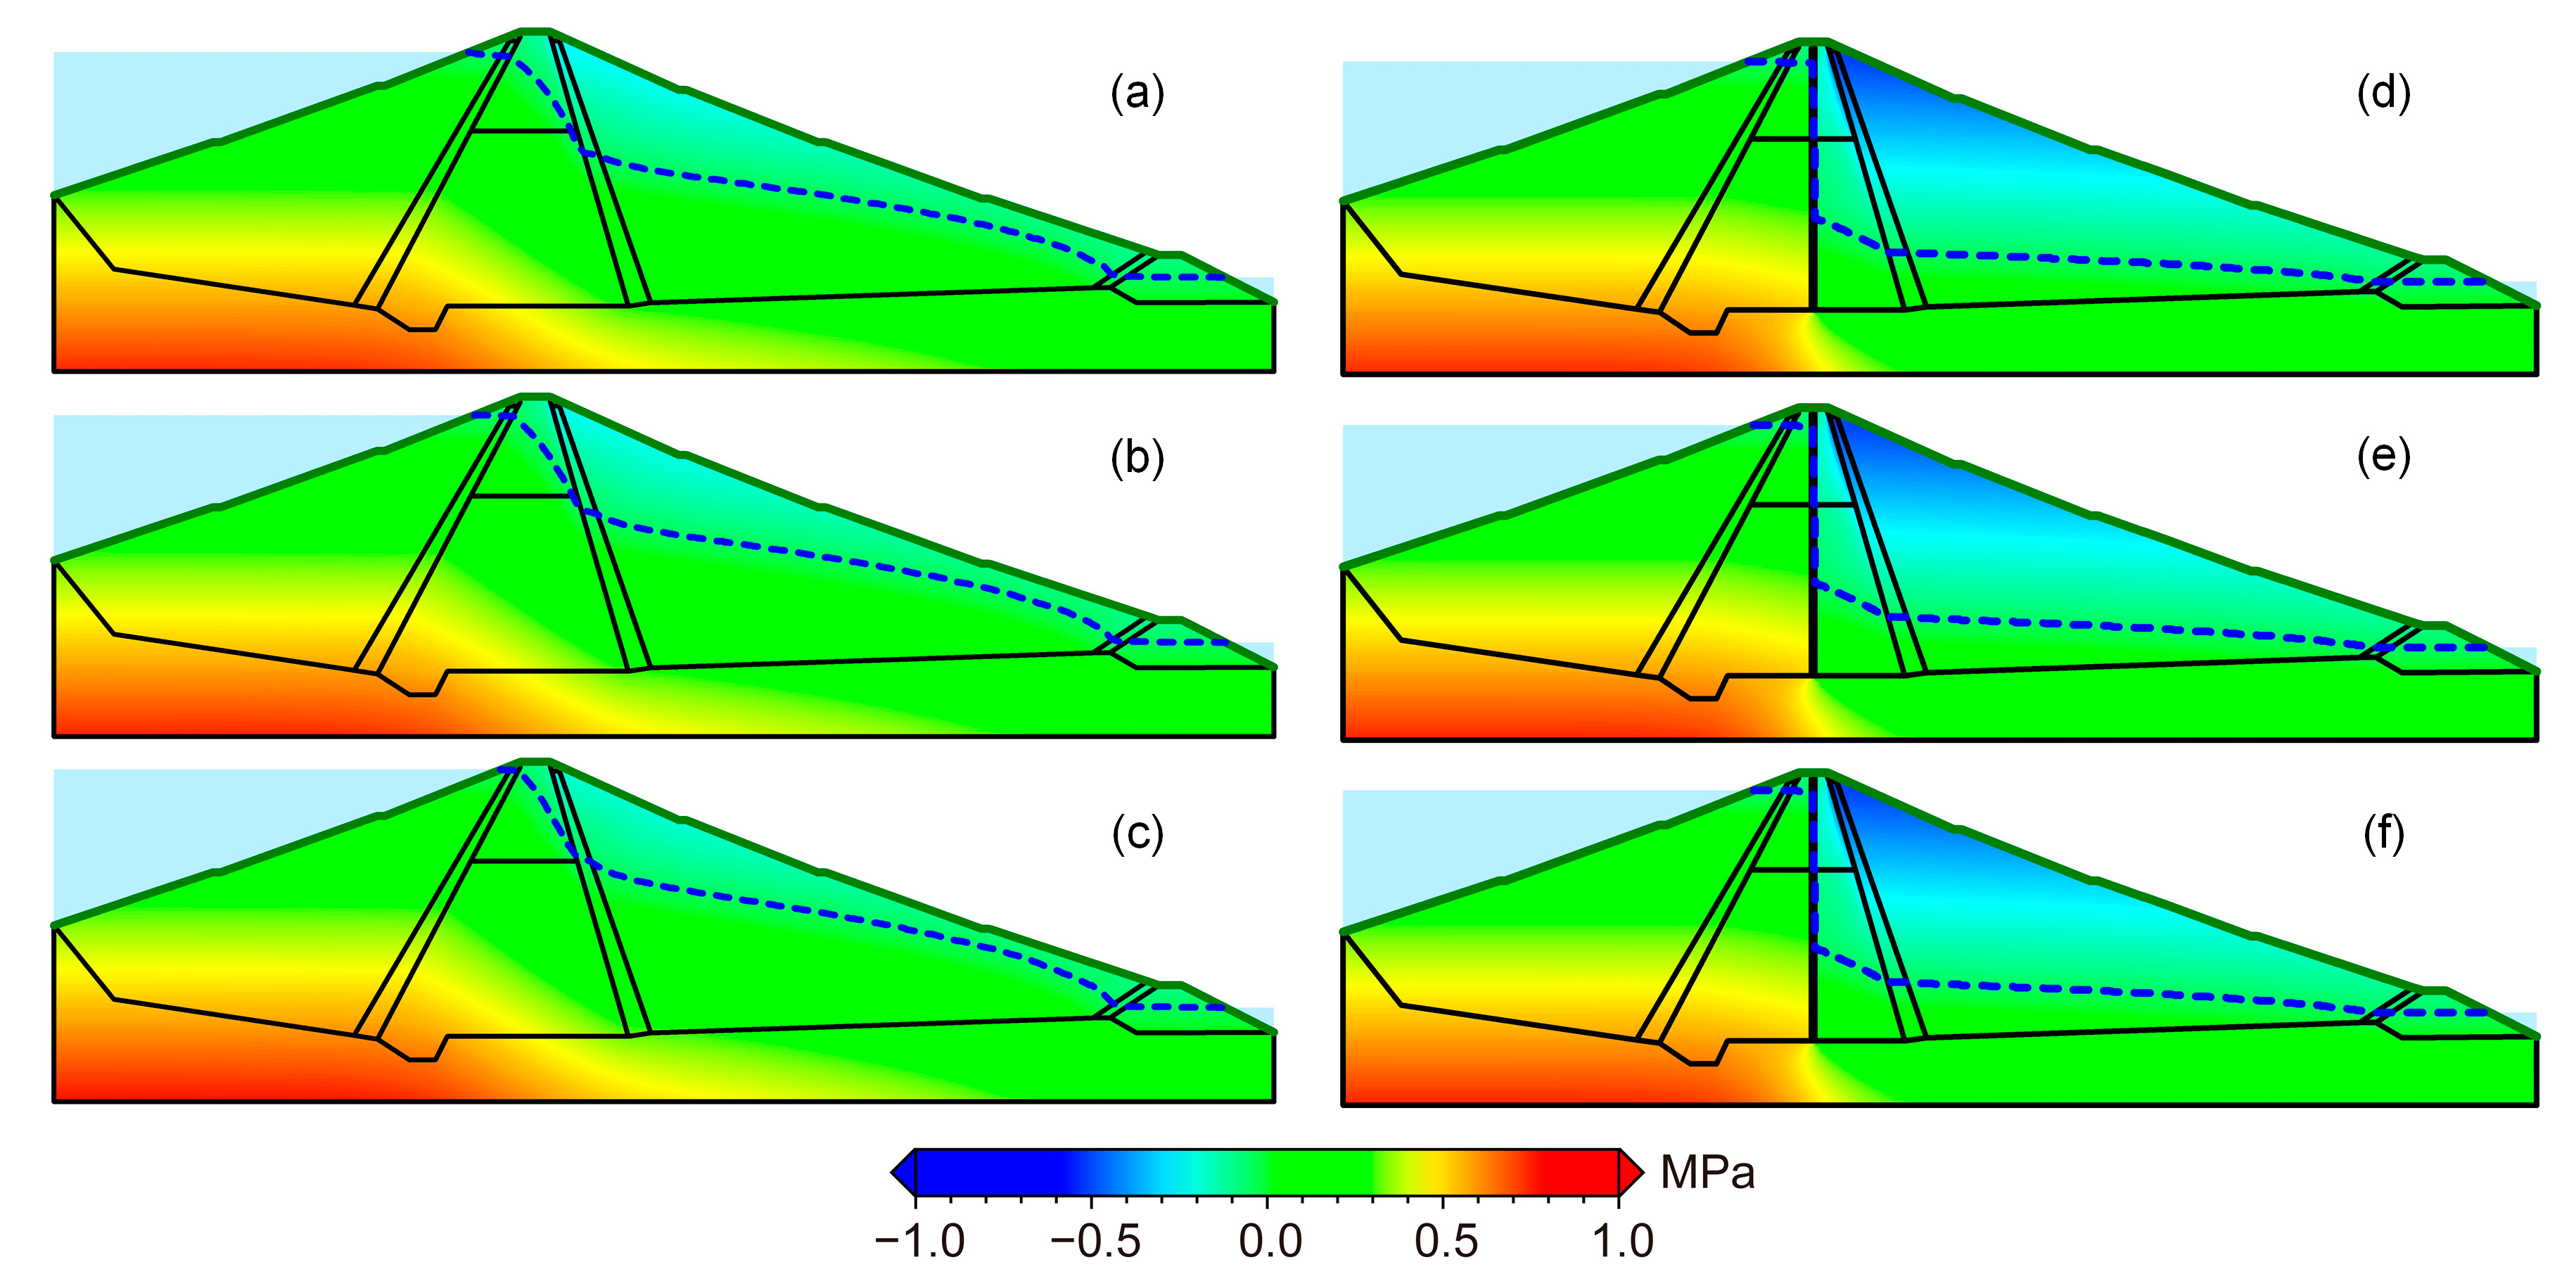
4.2. Numerical Simulation of the Seepage Field

Based on the established finite element numerical model (Figure 5a,b), the steady seepage fields under the normal water level, design flood level, and check water level conditions, as well as the unsteady seepage field under the rapid drawdown condition, were calculated (Table 3). Figure 10a–c show the pore pressure contour under normal water level, design flood level, and check water level conditions before the dam reinforcement, while Figure 10d–f show those after the reinforcement. By comparing Figure 10a–c with Figure 10d–f, it can be found that before the reinforcement of Liuduzhai Dam, the high permeability coefficient of the secondary clay-core wall resulted in a high infiltration line of the downstream dam and most of the fill materials were in a saturated state. After reinforcement, the infiltration line of the downstream dam was significantly reduced. Figure 11a,b reveals the distribution characteristics of the infiltration line of the downstream dam under the unstable seepage field caused by the rapid drawdown condition. Before the reinforcement, the infiltration line and effective stress above the 331.0 m elevation of the downstream dam were significantly affected by the fluctuation of the water level due to the relatively high permeability coefficient of the clay-core wall in the second phase. However, after reinforcement, the downstream infiltration line was significantly reduced, and the fluctuation range of the infiltration line due to the rapid drawdown of the reservoir was also significantly reduced. This resulted in the formation of a stable seepage channel and the effective stress of the downstream soil was basically in a stable state.

4.3. Time Series Deformation

To better understand the dynamic deformation characteristics of the dam, the deformation time series at point P located at the berm with an elevation of 345.0 m on the dam (Figure 8) were plotted, and the unsteady seepage results from Geostudio SEEP/W were used for analysis. As shown in Figure 12a, the time series deformation of point P observed by ALOS-1 exhibits a typically sustained growth trend, with cumulative deformation exceeding 100 mm. An obvious accelerating deformation trend began on 21 July 2009, while the infiltration line at point P fluctuated between elevations 315.0 m and 335.0 m with changes in the reservoir water level. According to the construction records, the construction of the cut-off walls began on 13 January 2009, and was completed on 29 May 2010. Based on the characteristics of each construction stage and the requirements of the site, it was mainly divided into four stages: 1. Preparation for construction (13 January 2009, to 15 July 2009); 2. Construction of the guide wall (15 July 2009, to 1 December 2009); 3. Trench and cast concrete (1 December 2009, to 1 March 2010); and 4. Removal of the guide wall and backfilling of the cutoff wall (1 March 2010, to 29 May 2010). As shown in Figure 12a, the deformation acceleration was concentrated during the guide wall construction, cast concrete, and continued until 24 October 2010 (no historical archive SAR data were available between 24 October 2010, to 20 June 2015). Starting from stage 3, with the pouring of the cut-off walls concrete, the infiltration line of P point dropped sharply to 301.0 m and remained between 301.0 m and 303.0 m with the fluctuation of the reservoir water level. Figure 12b shows that after reinforcement, the time series deformation of the P point observed by Sentinel-1A significantly decreased compared to that observed by ALOS-1, with a typical periodic feature ranging from −3 mm to 3 mm, and maintained a high correlation with reservoir water fluctuations. Meanwhile, a relatively stable dynamic seepage formed at the P point between 301.0 m and 303.0 m during the observation period of Sentinel-1A, as shown in Figure 12b. The detailed deformation analysis will be discussed in Section 5.3.

5. Discussion

After the reinforcement, Figure 8, Figure 9, Figure 10 and Figure 11 show that the deformation velocity, downstream dam infiltration line, and downstream dam dynamic seepage field are significantly reduced. Figure 12b shows that after reinforcement, the time series deformation of the P point observed by Sentinel-1A with a typical periodic feature ranging from −4 mm to 4 mm. With the exception of 2015–2016 and 2019–2020, the deformation trend exhibits a general consistency with the fluctuation characteristics observed in reservoir water levels. In order to elucidate the deformation characteristics of 2015–2016, we observed that the temporal resolution of the period from 20 June 2015 to 10 March 2016 was insufficient based on our analysis of Sentinel-1A SAR data. The longest time interval recorded was from 29 December 2015 to 10 March 2016, spanning a duration of approximately 72 days. The limited temporal resolution of the SAR data resulted in the loss of subtle temporal variations in deformation signals. The analysis of Figure 12 reveals an intriguing observation: the absence of a peak in reservoir water level during 2018. This discrepancy between InSAR deformation and reservoir water level fluctuations in 2019 may be attributed to this particular phenomenon. Taking into account the potential impact of time delay, we have calculated that the correlation between deformation and the reservoir water level is maximized at a delay coefficient of 48 days. This finding is close to the previous research on dam deformation driven by fluctuations in reservoir water levels [2]. Therefore, it is hypothesized that the deformation results from the Sentinel-1 time series exhibit a correlation with changes in reservoir water levels. To further explore the underlying factors that contribute to the deformation of earth-rock dams, we discuss the potential deformation modes of LiuduzhaiD, the reasons why the maximum deformation did not occur at the dam crest, and the deformation mechanisms before and after reinforcement.

5.1. Most Likely Deformation Pattern: Consolidation Settlement, Internal Erosion, or Elastic Deformation?

Figure 9a shows that the InSAR deformation velocity observed by ALOS-1 and Sentinel-1A decreased from the middle of the dam towards both sides of the dam abutment, which may be related to the differences in filling thickness caused by the dam being built in a “V”-shaped valley. On the same elevation platform, the thicker the filling thickness, the greater the deformation velocity. We note that in Figure 12a, the InSAR time series deformation observed by ALOS-1 shows a continuous growth trend during the observation period. Therefore, before the reinforcement, the most likely deformation pattern of the dam is consolidation settlement. However, the deformation velocity observed by ALOS-1 has a jump at a distance of 260 m from the right dam abutment, which was not observed by Sentinel-1A. The Liuduzhai Dam axis design is angular and protrudes towards the downstream side, perpendicular to two mountain slopes, in order to enhance the stability of the dam. However, this dam geometry is prone to inducing differential settlement in the core wall at its angularity, consequently leading to more significant leakage of the dam body. This could potentially explain the observed abrupt deformation results in the angularity as obtained from ALOS-1 data. The reason is that there was obvious concentrated leakage or seepage before reinforcement, which induced internal erosion and diffuse infiltration, consistent with the concentrated leakage point described in Section 2.2. In Figure 12b, unlike the ALOS-1 observation results, the InSAR time series deformation observed by Sentinel-1A after the reinforcement has typical periodic characteristics. However, consolidation settlement is the dense process of soil under the dissipation of pore water pressure. It shows linear, step or creep characteristics under the influence of dynamic water pressure, i.e., the continuous growth of accumulated displacement. Therefore, the periodic deformation observed in the flow direction during the Sentinel-1A observation period is most likely elastic deformation, which will be discussed in detail in Section 5.3.

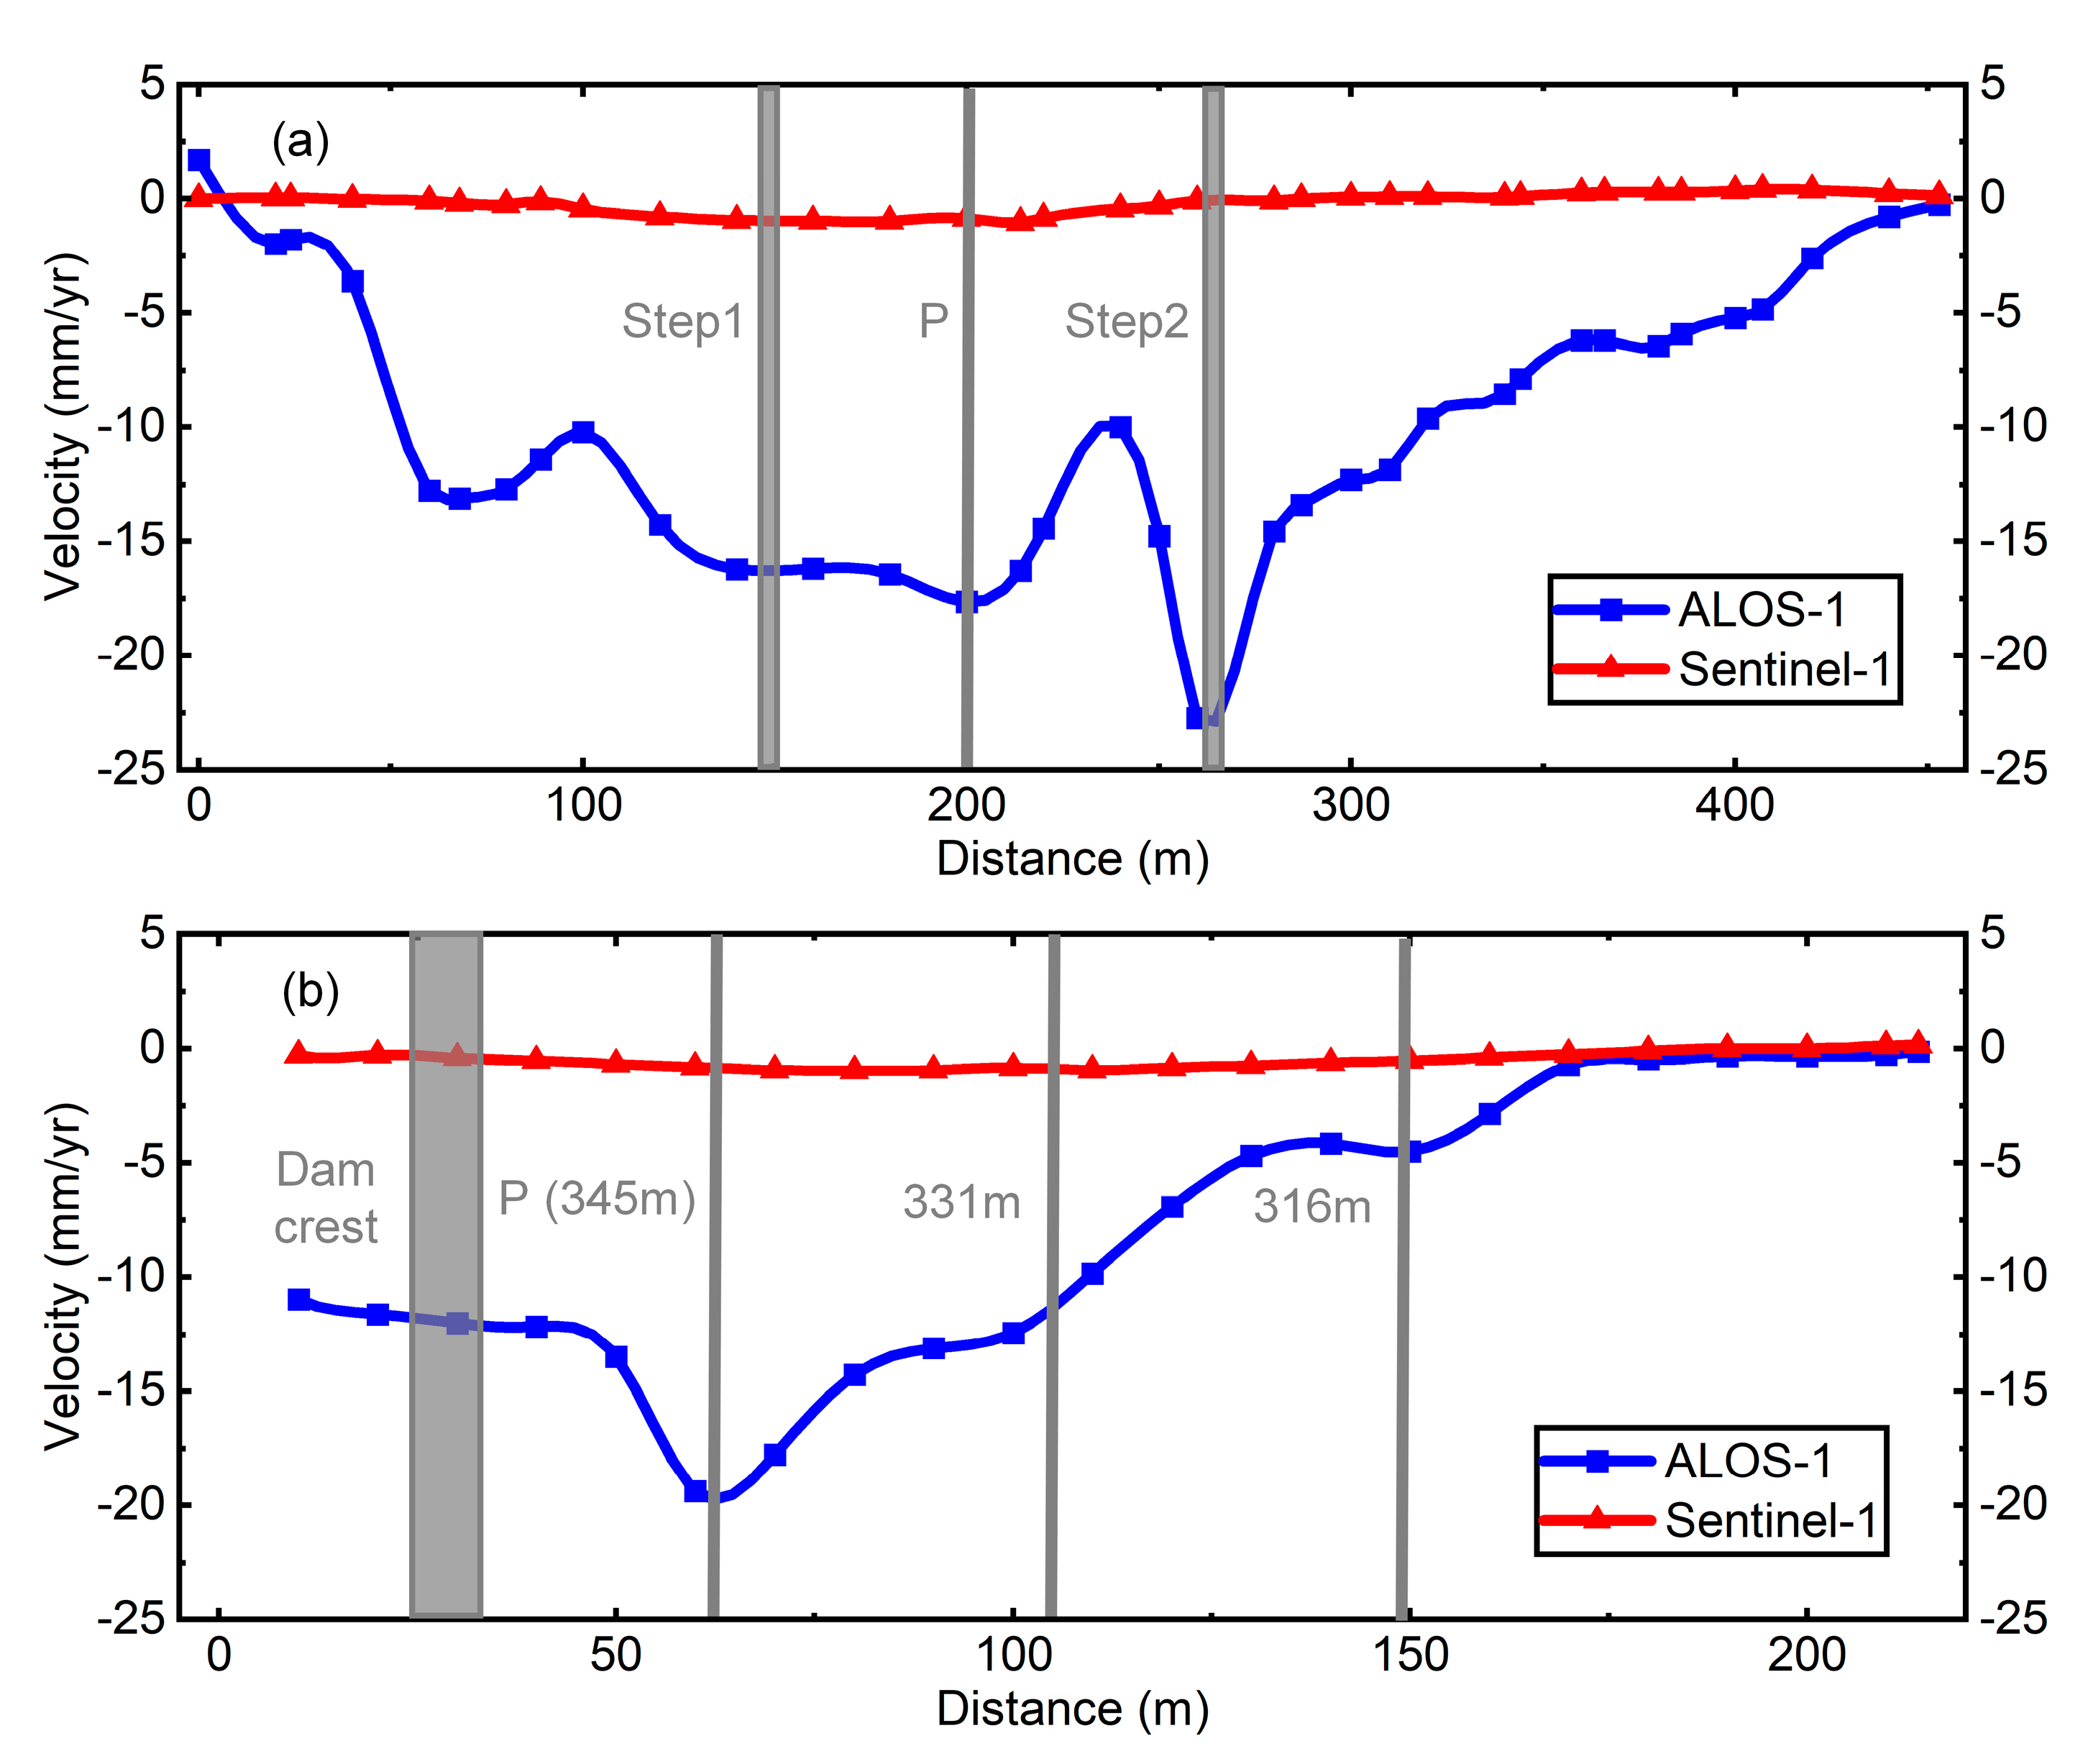
5.2. Location of the Maximum Deformation Velocity

The deformation patterns revealed in Section 5.1, indicate that the consolidation settlement is related to the filling thickness, and multiple similar research results have confirmed that the maximum deformation for earth-rock dams occurs at the crest [11,21,27]. However, as shown in Figure 8 and Figure 9b, both the ALOS-1 observations before reinforcement and the Sentinel-1A observations after reinforcement show that the maximum deformation velocity occurs near the berm at an elevation of 345.0 m downstream of the dam. Although the filling material thickness at the crest (Figure 3b) and the range of dynamic seepage (Figure 11a,b) are higher than those of the downstream dam shell, the possible reasons for the absence of maximum deformation at the crest are: (1) the high permeability coefficient of the downstream dam is prone to cause dam leakage and induce internal erosion; (2) the compaction degree and water content of the clay-core filling material during the filling process are significantly higher than those of the downstream dam shell weathered rock and soil; (3) due to the low permeability and high cohesive force of the clay-core filling material, the deformation sensitivity of dynamic seepage is significantly weaker than that of the downstream dam shell material.

5.3. Deformation Mechanism of Liuduzhai Dam

Based on the deformation and seepage analysis results before and after the reinforcement of the Liuduzhai Dam, this study reveals the deformation mechanism of the dam. Figure 13 illustrates the mechanical process of the dam.

5.3.1. Deformation Mechanism of the Clay-Core Dam

Before the reinforcement, the increase in the permeability coefficient due to non-standard materials of the clay-core wall, long-term operation, and partial damage resulted in the rising of the infiltration line (Figure 10a–c) and dynamic seepage field (Figure 11a). Based on Figure 12a, it can be observed that the P point infiltration line located at the downstream shell fluctuated synchronously when the reservoir water level was between 315.0 m and 335.0 m, while cumulative deformation showed a distinct continuous growth feature. This deformation pattern has been considered a consolidation settlement in Section 5.1. According to the Terzaghi effective stress principle, the total stress of soil is equal to the sum of the effective stress between soil particles and the pore water pressure. The dynamic fluctuation of the upstream water level causes the downstream shell to generate dynamic seepage, which directly changes the pore pressure distribution of soil, resulting in a periodic transition between the saturation and dissipation of pore water. This mechanical process induces significant dynamic water pressure and consolidation settlement. Therefore, the deformation mechanism of the dam before the reinforcement is mainly the continuous consolidation settlement induced by dynamic seepage, as shown in the mechanical schematic diagram in Figure 13a.

5.3.2. Deformation Mechanism during the Construction of Plastic Concrete Cut-Off Walls

According to Figure 12a, it can be observed that the time series deformation of point P, as observed by ALOS-1, has exhibited a significant acceleration trend since 21 July 2009. The construction log recorded that the construction preparation of the plastic concrete cut-off walls started on 13 January 2009, and continued until the end of the flood season (Figure 12a), which reasonably explains the reason for the lagging of the accelerated deformation after the construction of the cut-off walls. The concentrated load and disturbance generated during the construction of the impermeable wall in Stage 2 (Figure 12a) are the direct cause of the accelerated deformation, as illustrated in Figure 13b. The pouring of the concrete cut-off walls in Stage 3 greatly improved the water-resistance performance of the core wall, causing the infiltration line of the downstream dam to drop sharply (Figure 12a), which changed the mechanical state of the filling material in the downstream dam. The pore water pressure of the saturated soil, which was originally at a high infiltration line, dissipated rapidly, thereby accelerating the consolidation settlement until reaching a stable state, as illustrated in Figure 13c. However, soil consolidation usually has a creep characteristic, and its period often lasts for several years, which also explains the reason why the accelerated deformation was maintained for a period of time after the completion of the cut-off walls.

5.3.3. Deformation Mechanism of Dam after Reinforcement

After the application of plastic concrete cut-off walls, the infiltration line height and dynamic seepage of the seepage exit decreased significantly and formed a stable seepage channel, as demonstrated in Figure 10b and Figure 11b. The stable mechanical state is the main reason why the InSAR deformation results during this stage were significantly lower than the ALOS-1 observations before reinforcement. As the fill material of the dam has elastic characteristics, the periodic sharp rise and fall of the reservoir water level can also cause elastic deformation in the flow direction of the dam. Figure 8b shows that the maximum deformation velocity is −1.2 mm/yr, with the spatial deformation characteristics being similar to those before reinforcement; however, the range is significantly reduced. As illustrated in Figure 11b, it can be seen that the P point with the maximum deformation velocity exhibits a periodic characteristic consistent with the reservoir water level, and there is no continuous settlement signal. Therefore, after anti-seepage reinforcement, the dam deformation caused by the fluctuation of the reservoir water level is mainly horizontal periodic deformation in the flow direction, as shown in Figure 13d.

5.4. Lesson Learned: InSAR Monitoring to Assisted Dam Seepage Evaluation

Dam leakage is one of the main triggering factors for the deformation and failure of earth-rock dams [10,11,27]. In this regard, cut-off walls with extremely low permeability can significantly reduce the seepage line and dynamic seepage field of the downstream dam. However, with the passage of time, the stable seepage channel formed by long-term erosion of the clay-core wall and the cracks by the differential deformation of concrete cut-off walls due to the uneven distribution of pressure can lead to dam leakage [27]. A traditional piezometer tube can be used to monitor the dynamic pore pressure difference between upstream and downstream of the core-wall [27], but tends to overlook the concentrated leakage signal characteristics of the dam owing to the discrete differences of the measurement points. Ground-penetrating radar can accurately obtain the distribution of cut-off wall cracks [58]; however, they are limited by low temporal-resolution and their high cost when assisting in dynamic seepage evaluation. Although field investigations based on manual inspections can intuitively identify the concentrated seepage or diffuse infiltration distribution of the dam, they, unfortunately, produce a large workload.
Due to the advantages of dense points and the high spatiotemporal resolution of InSAR technology, the spatial distribution of an InSAR deformation field can provide a target area for seepage deformation in order to ensure an efficient dam safety assessment and early detection of differential settlement. In particular, the unique historical backtracking ability of InSAR can provide reliable historical deformation to analyze the kinetics mechanism of dam deformation and detect the accelerated deformation characteristics in time. It is worth noting that most of the research results of the earth-rock dams confirm that alterations in the seepage field provide sufficient conditions for dam deformation [10,11,25,27]. While the numerical simulation method employed in this study does not account for the calculation of the stress-strain field and dam stability due to the lack of accurate equivalent material mechanical parameters and strength parameters, the seepage analysis results also reveal that the change of permeability coefficient in the cut-off walls directly affects the InSAR observation results (Figure 8 and Figure 12). Consequently, future plans may consider using InSAR deformation fields to invert equivalent material parameters such as elastic modulus, Poisson’s ratio, cohesion, and friction angle in numerical models. Coupling InSAR and numerical modeling can be used to assist the safety assessment of dams, and then provide a scientific and effective auxiliary means for the performance detection of the dam cut-off walls and the formulation of the repair plan.

6. Conclusions

By integrating InSAR and numerical simulation techniques, this study investigated the deformation and seepage characteristics of Liuduzhai Dam before and after its reinforcement. The investigation revealed that dynamic seepage, construction loads, sudden drop of infiltration line, and reservoir water level fluctuations are the main mechanisms driving dam deformation. The conclusions are as follows:
(1)
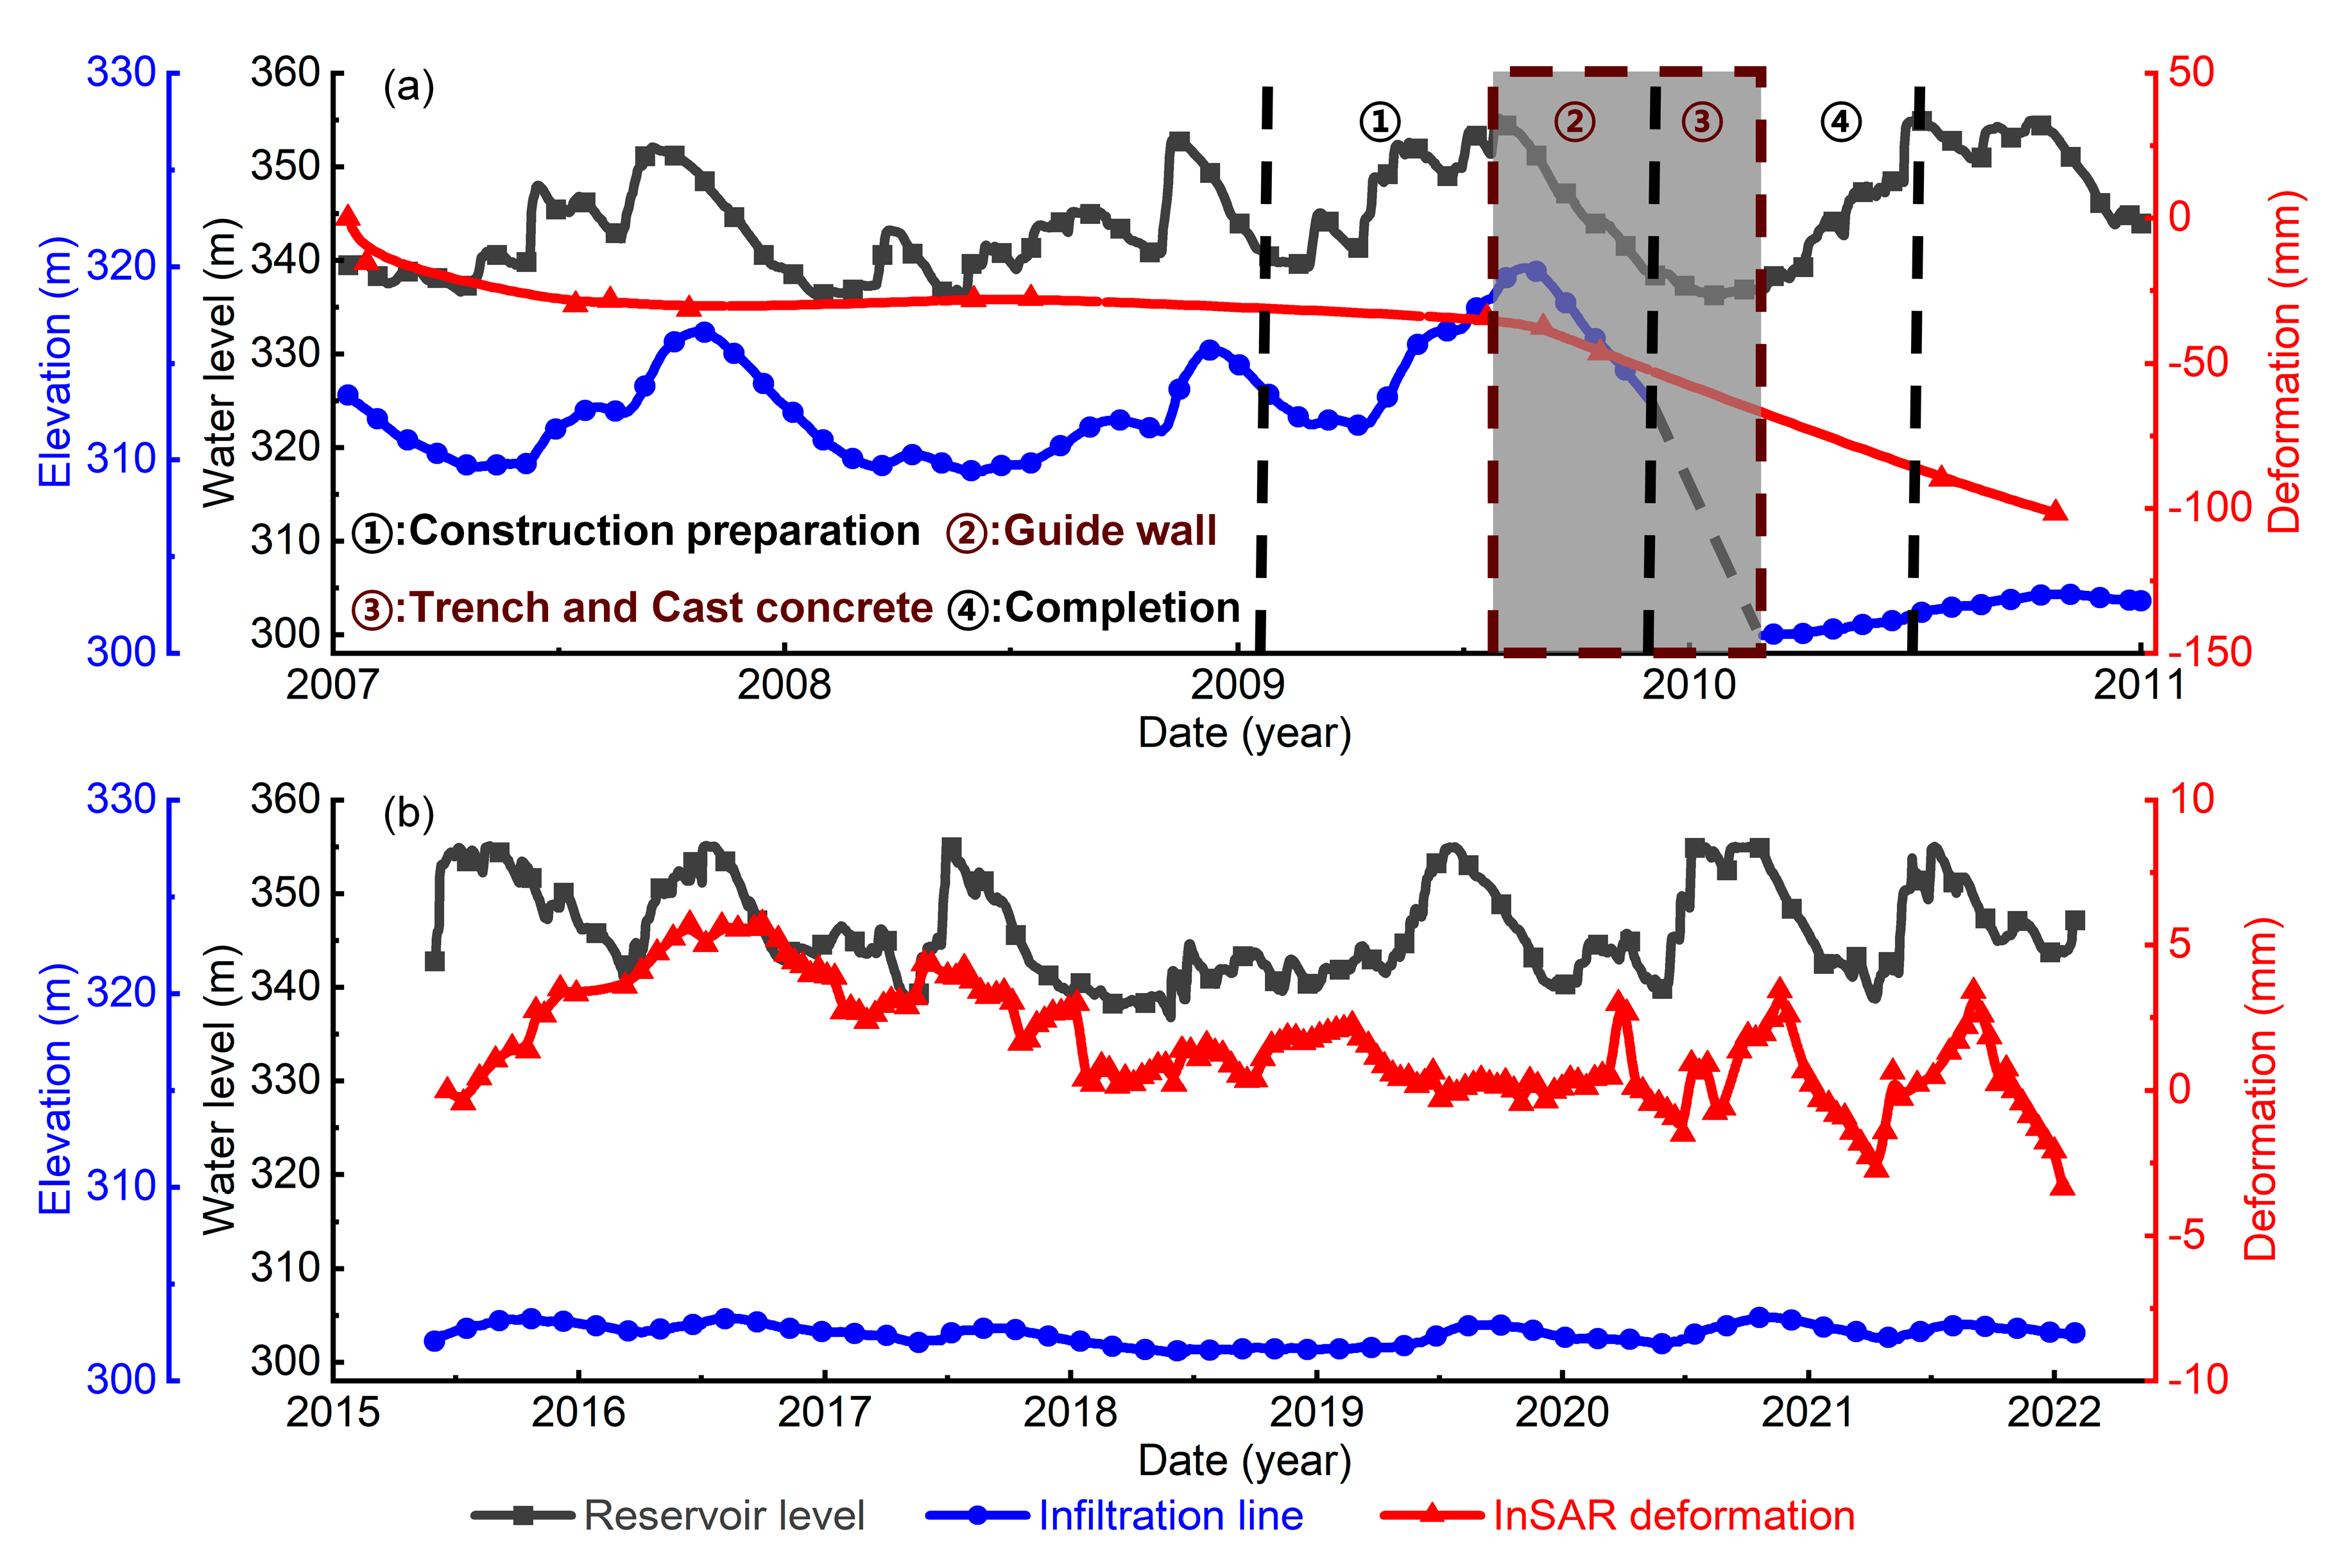
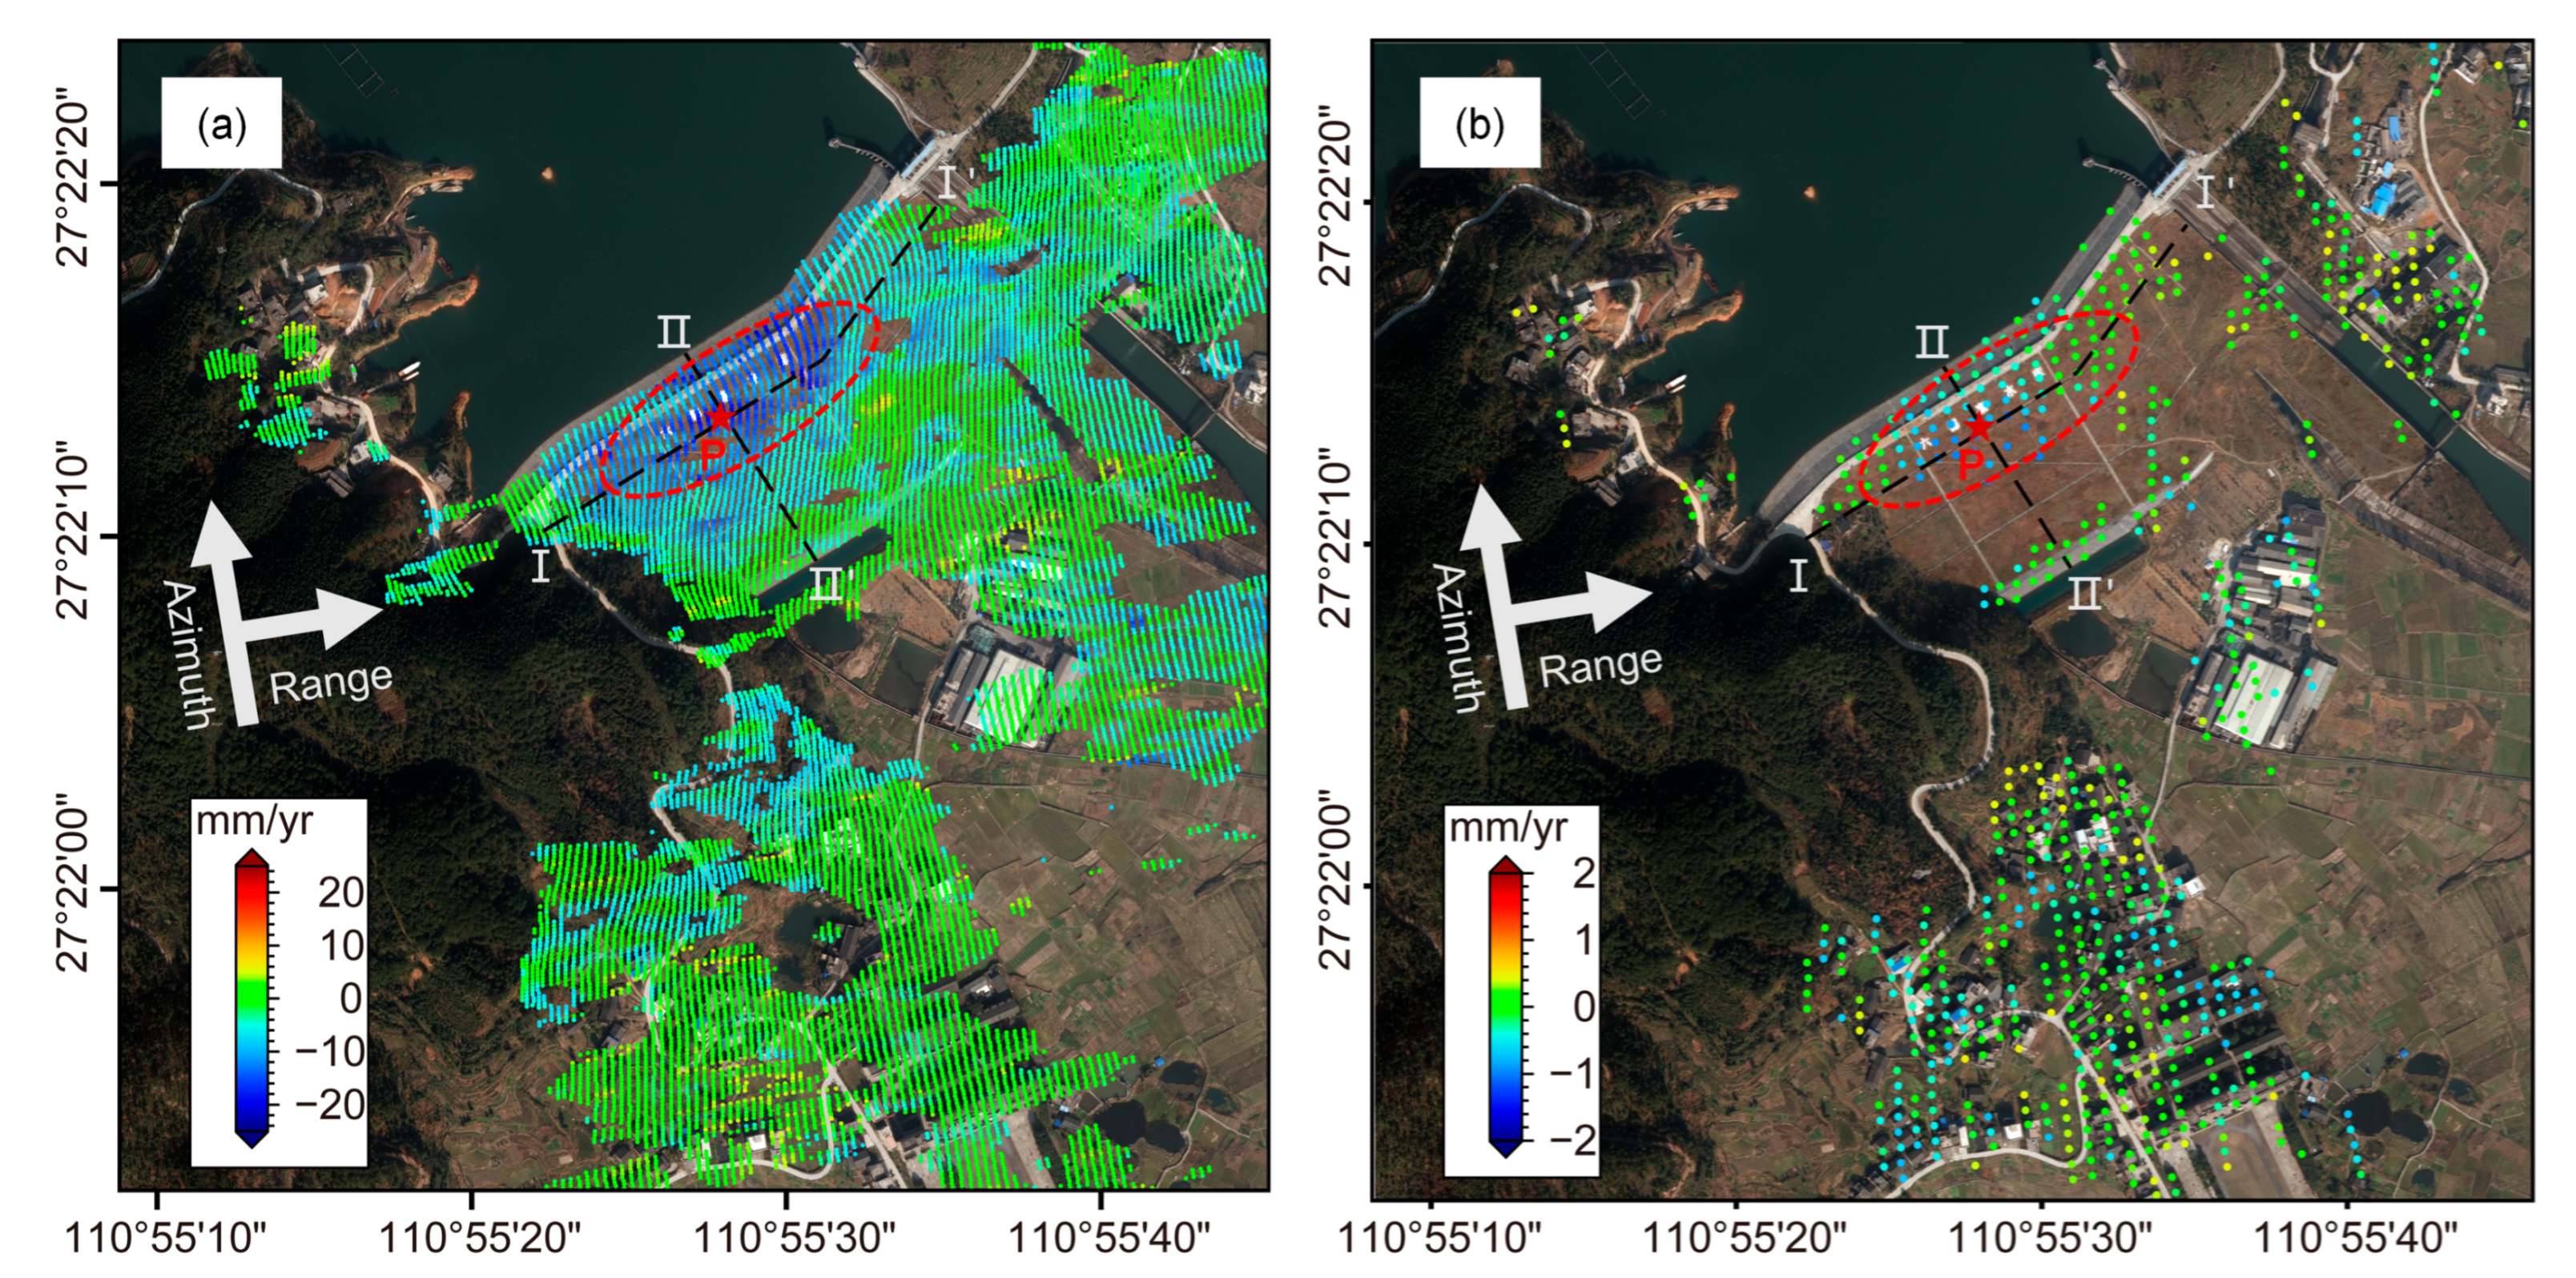
InSAR observations before and after the reinforcement revealed significant differences in the average deformation velocity values of the dam. Prior to reinforcement, the average deformation velocity was measured at −11.7 mm/yr, while after reinforcement, it reduced to −0.4 mm/yr. Similarly, the maximum deformation velocity values of the dam exhibited a noteworthy change, decreasing from −22.5 mm/yr before reinforcement to −1.2 mm/yr after reinforcement. In addition, the deformation of the dam both before and after reinforcement exhibited a spatial distribution characteristic that involved a decrease from the middle of the dam to both sides as well as upstream and downstream. The thicker the filling thickness on the same elevation platform, the greater the deformation velocity. Specifically, since the deformation sensitivity of the clay-core is significantly weaker than that of the downstream dam shell material, the maximum deformation velocity did not appear in the middle of the dam crest.
(2)
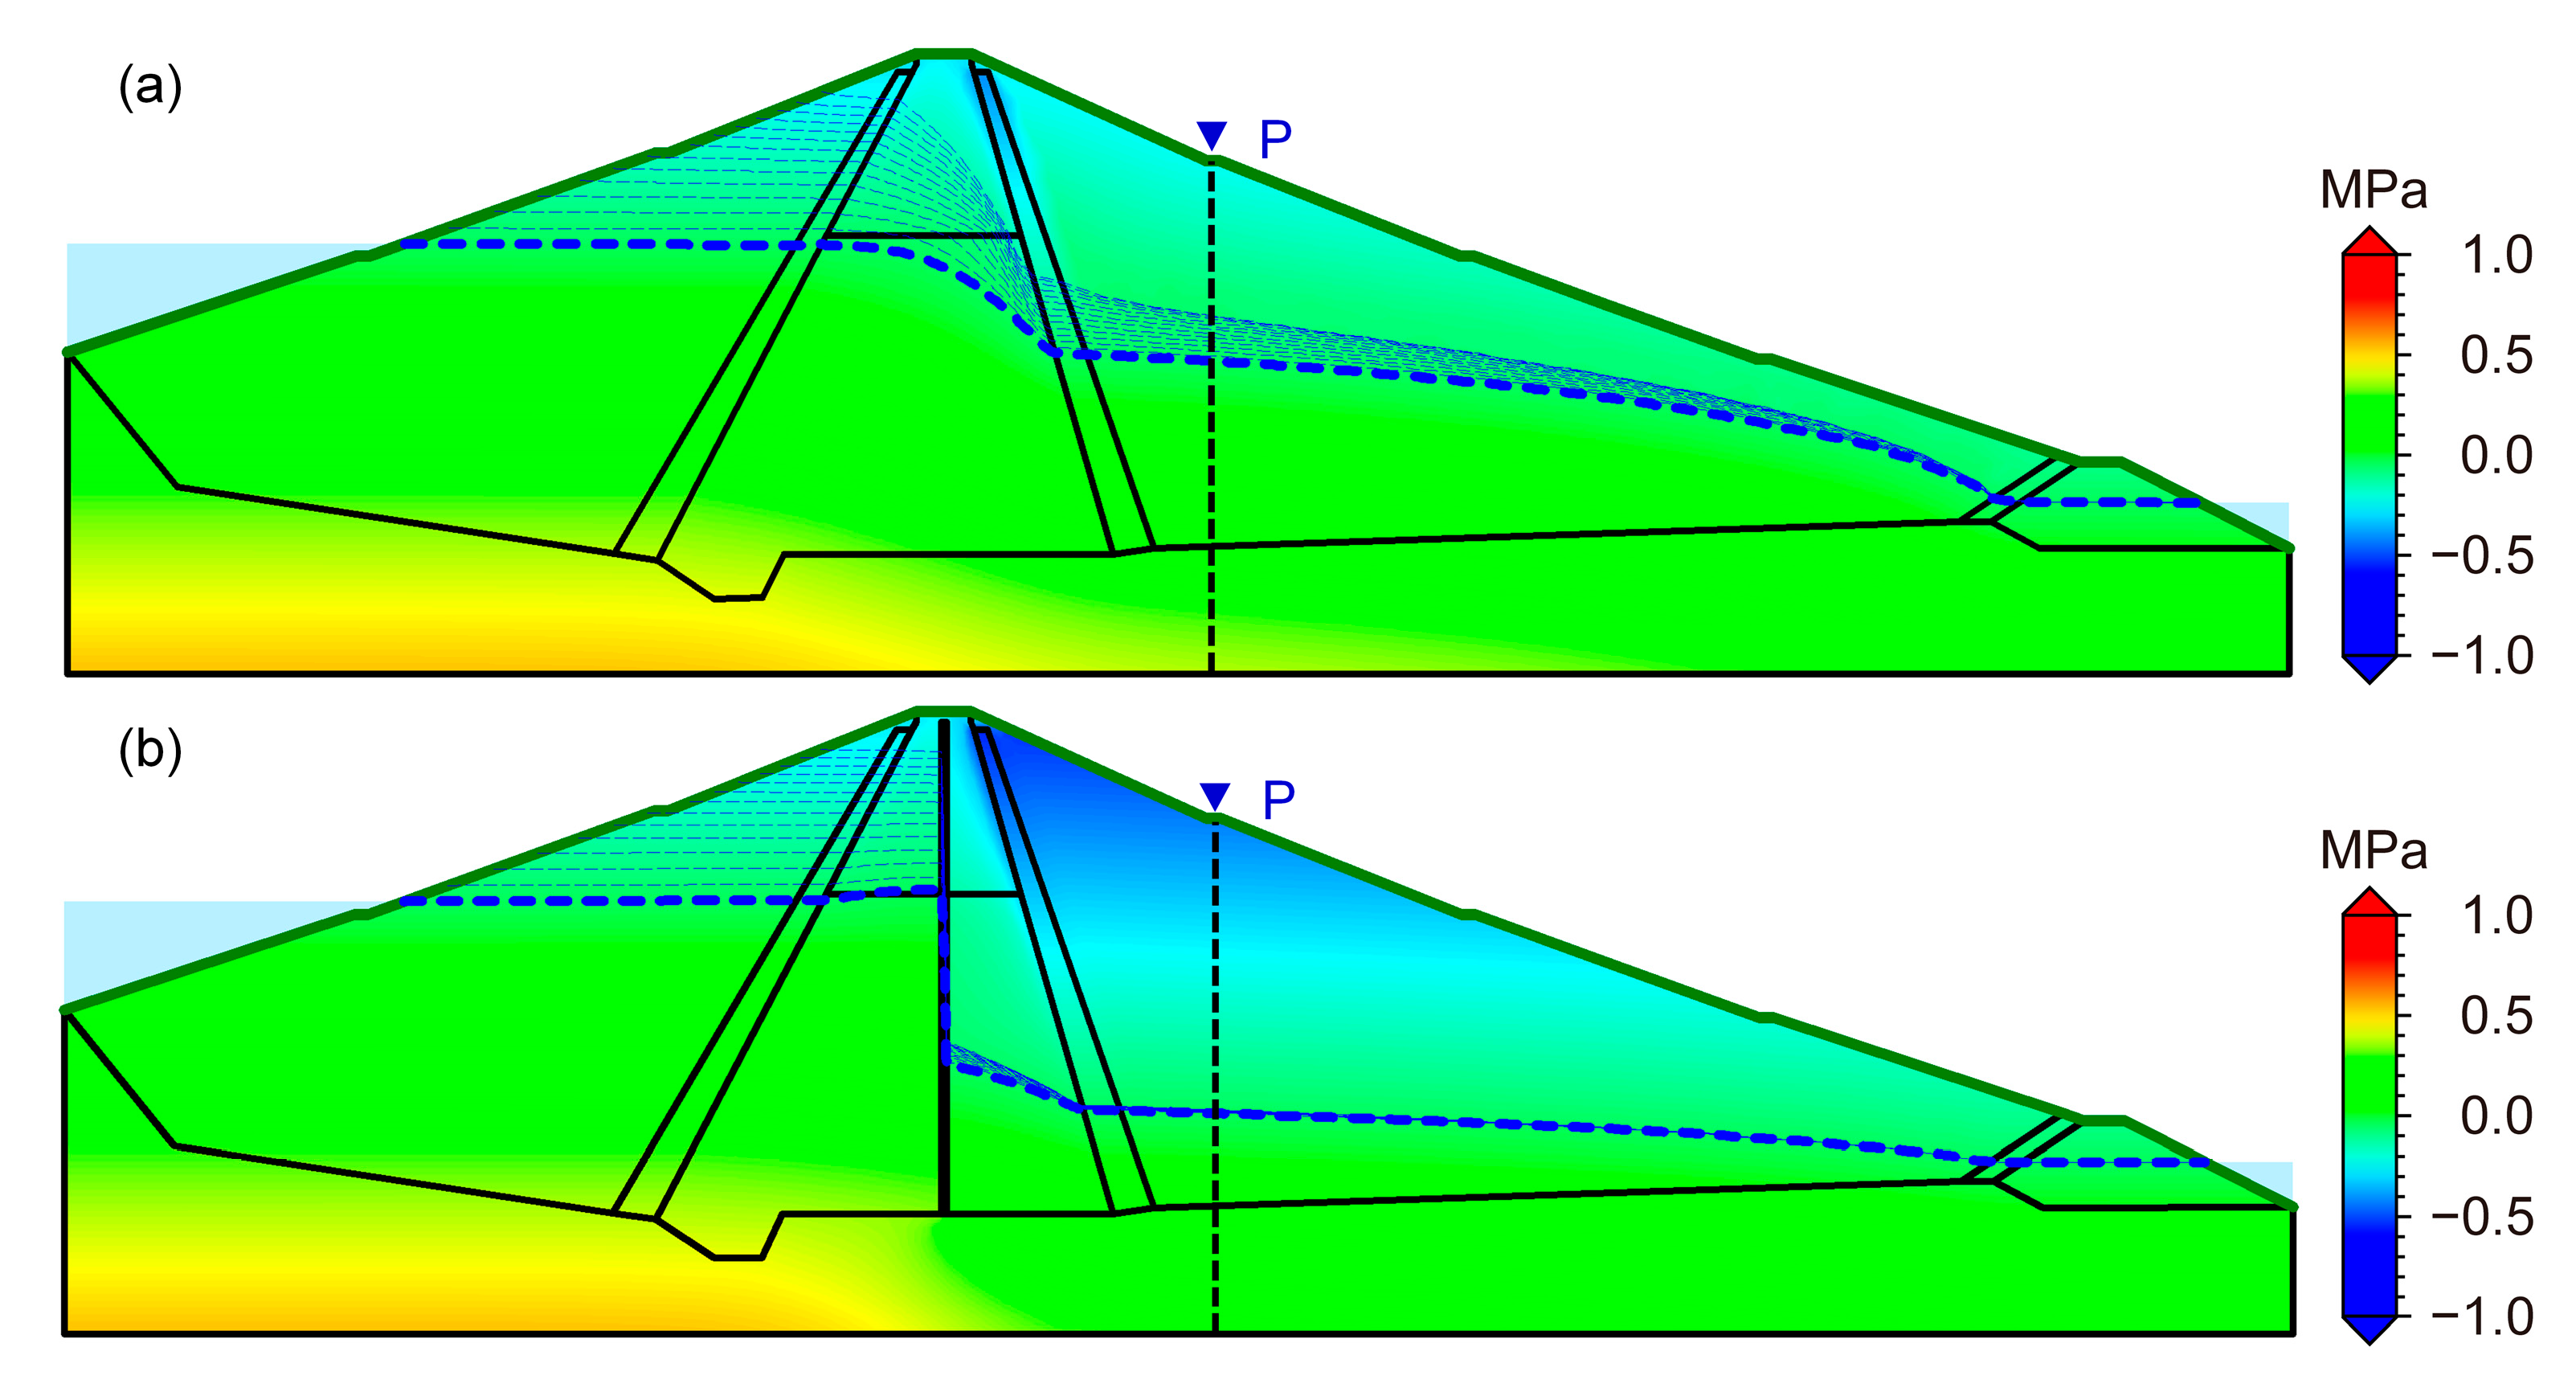
The InSAR observation results before and after the reinforcement showed that the temporal characteristics of dam deformation changed from sustained linear deformation to periodic elastic deformation. The results of unstable seepage showed that the plastic concrete cut-off walls significantly reduced the infiltration line and dynamic seepage of the downstream dam, turning the soil of the downstream dam into a stable mechanical state.
(3)
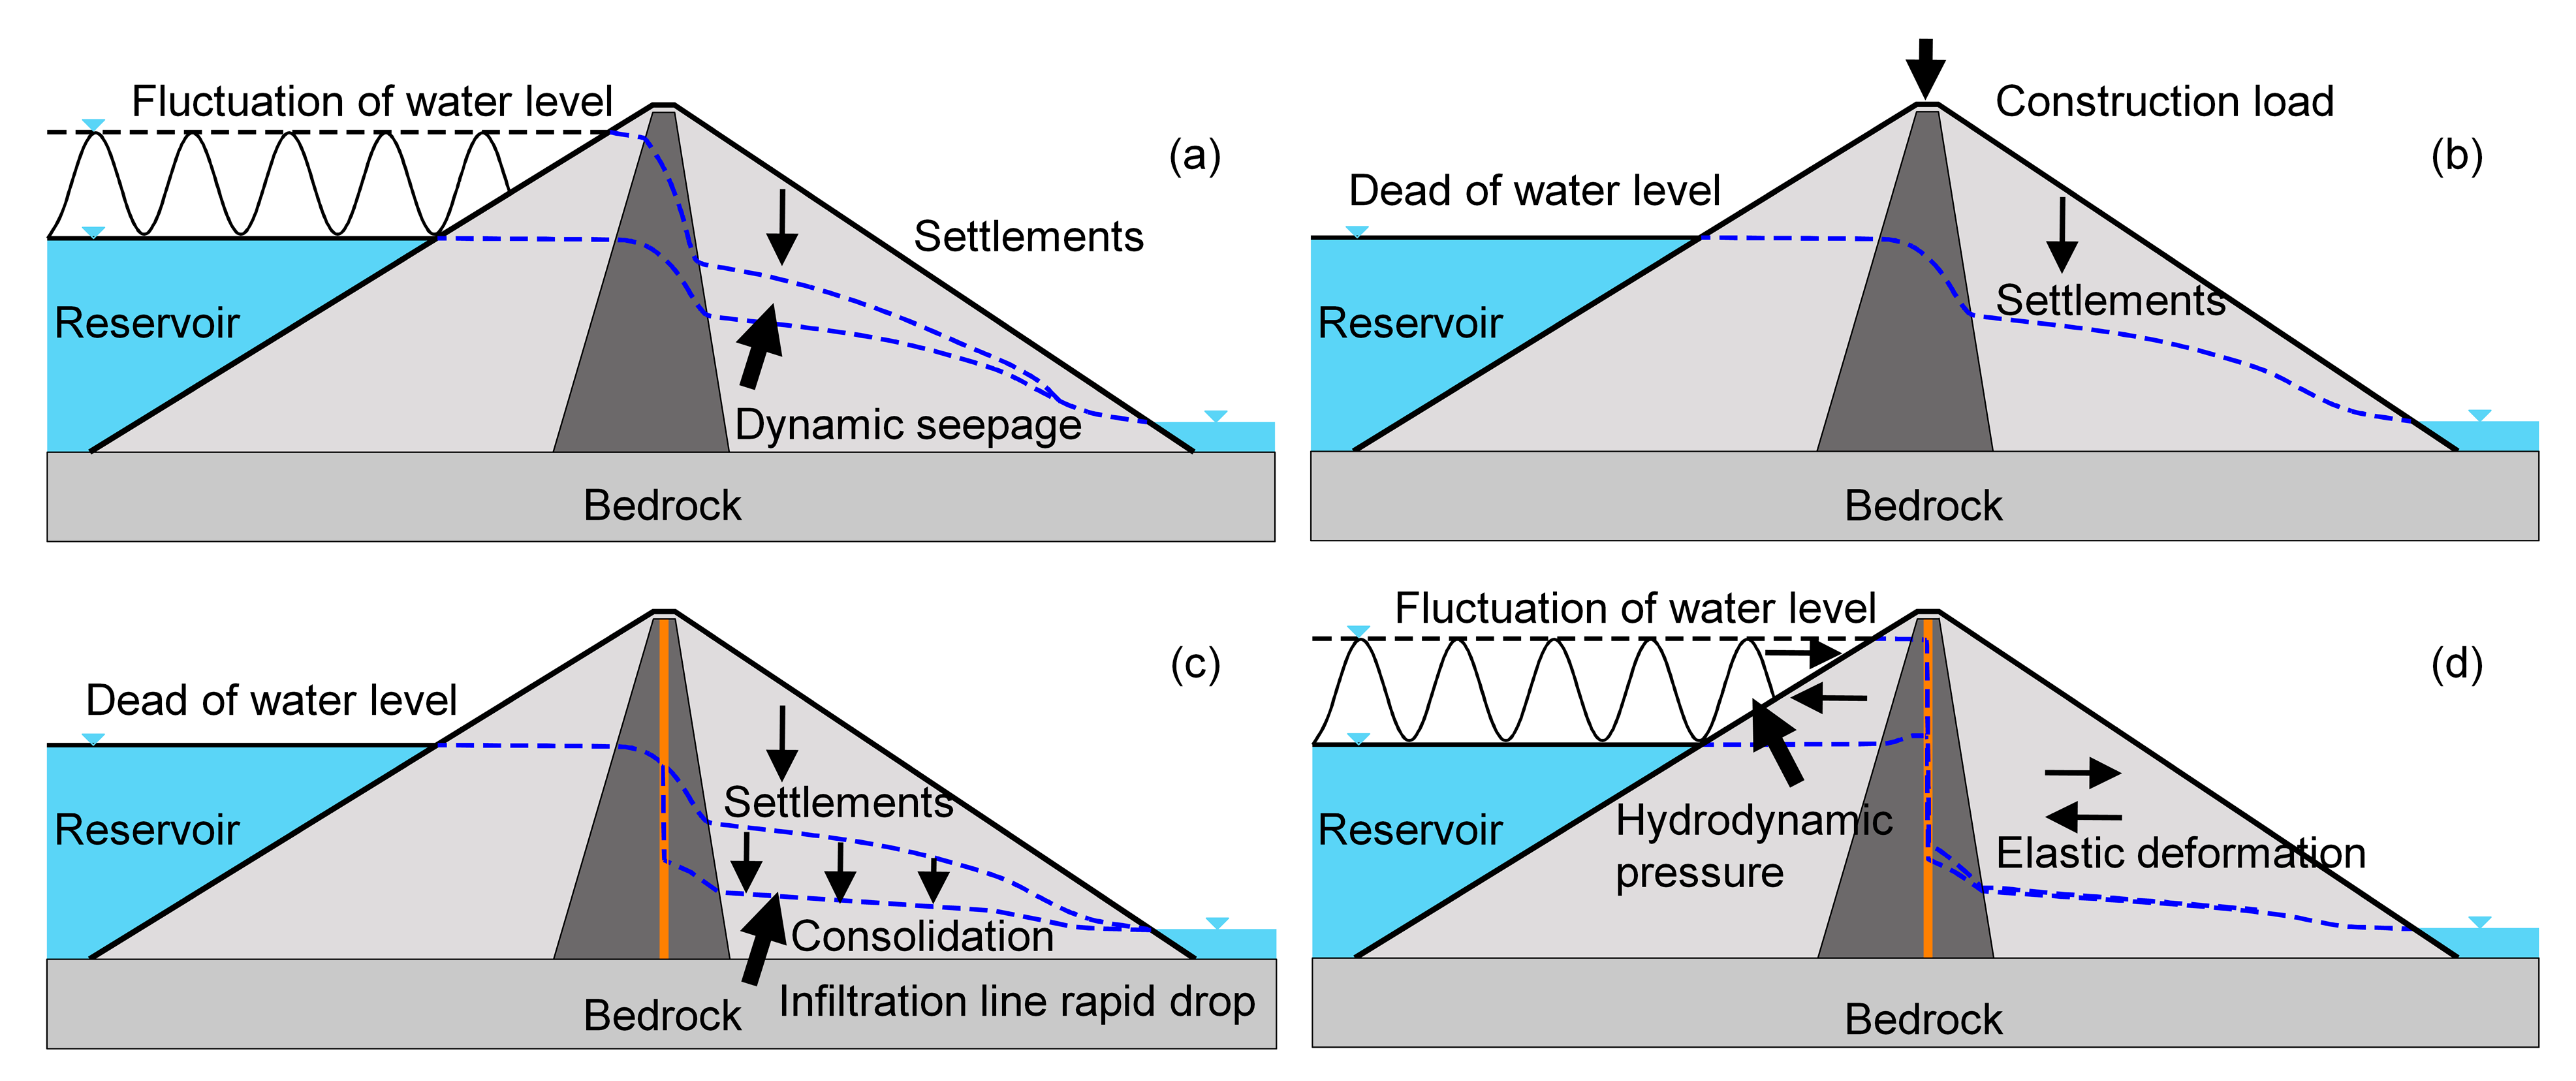
The comprehensive analysis of InSAR and unstable seepage results showed that dynamic seepage is the main mechanism affecting dam deformation before reinforcement; concentrated loads caused by construction and the rapid dissipation of pore water pressure caused by a sudden drop of the infiltration line are the reasons for accelerated deformation during and after construction; periodic reservoir water level fluctuations are the main driving force for the elastic deformation of the dam after anti-seepage reinforcement.
In summary, InSAR-assisted dam seepage evaluation provides a modern approach to analyzing the deformation mechanism of Liuduzhai Dam. This study reveals the detailed evolution process of dam deformation before and after reinforcement and provides an auxiliary tool for future dam seepage safety evaluations. Deformation prediction plays a pivotal role in dam warning and risk mitigation. Nevertheless, this study encounters certain challenges. Such as, the time resolution of SAR satellites is limited to 12 days and accurately predicting the performance of the dam remains elusive through modeling, etc. In our future research agenda, we intend to undertake this investigation.

Author Contributions

Conceptualization, G.L. and J.H.; methodology, G.L. and W.W.; investigation, G.L. and L.L.; writing—original draft preparation, G.L. and W.W.; writing—review and editing, G.L. and J.H.; Supervision, J.H. and Q.S. All authors have read and agreed to the published version of the manuscript.

Funding

This research has been supported by the National Natural Science Foundation of China (No. 42030112), the Science and Technology Innovation Program of Hunan Province (No. 2022RC3042), and the Nature Science Foundation of Hunan Province (No. 2022JJ30031).

Data Availability Statement

Data sharing not applicable.

Conflicts of Interest

The authors declare no conflict of interest.

References

  1. Jia, J.S.; Lino, M.; Jin, F.; Zheng, C.Y. The Cemented Material Dam: A New, Environmentally Friendly Type of Dam. Engineering 2016, 2, 490–497. [Google Scholar] [CrossRef]
  2. Milillo, P.; Perissin, D.; Salzer, J.T.; Lundgren, P.; Lacava, G.; Milillo, G.; Serio, C. Monitoring dam structural health from space: Insights from novel InSAR techniques and multi-parametric modeling applied to the Pertusillo dam Basilicata, Italy. Int. J. Appl. Earth Obs. Geoinf. 2016, 52, 221–229. [Google Scholar] [CrossRef]
  3. Chen, W.L.; Wang, X.L.; Wang, J.J.; Cai, Z.J.; Guo, H.; Ding, C.Y. Dynamic interpretation of the factors causing dam deformation with hybrid grey dynamic incidence model. Eng. Struct. 2021, 242, 15. [Google Scholar] [CrossRef]
  4. Ma, H.Q.; Chi, F.D. Major Technologies for Safe Construction of High Earth-Rockfill Dams. Engineering 2016, 2, 498–509. [Google Scholar] [CrossRef]
  5. Zhang, J.W.; Huang, C.H.; Li, J.; Liu, G.Z. A Study on the Interaction Behavior between an Earth-Rock Dam and a New-Typed Polymer Anti-Seepage Wall. Sustainability 2022, 14, 14357. [Google Scholar] [CrossRef]
  6. Wei, B.W.; Yuan, D.Y.; Xu, Z.K.; Li, L.H. Modified hybrid forecast model considering chaotic residual errors for dam deformation. Struct. Control. Health Monit. 2018, 25, 16. [Google Scholar] [CrossRef]
  7. Foster, M.; Fell, R.; Spannagle, M. The statistics of embankment dam failures and accidents. Can. Geotech. J. 2000, 37, 1000–1024. [Google Scholar] [CrossRef]
  8. Lemperiere, F. Dams and Floods. Engineering 2017, 3, 144–149. [Google Scholar] [CrossRef]
  9. Su, H.Z.; Li, X.; Yang, B.B.; Wen, Z.P. Wavelet support vector machine-based prediction model of dam deformation. Mech. Syst. Signal Process. 2018, 110, 412–427. [Google Scholar] [CrossRef]
  10. Xiao, R.Y.; Jiang, M.; Li, Z.H.; He, X.F. New insights into the 2020 Sardoba dam failure in Uzbekistan from Earth observation. Int. J. Appl. Earth Obs. Geoinf. 2022, 107, 102705. [Google Scholar] [CrossRef]
  11. Xie, L.; Xu, W.B.; Ding, X.L. Precursory motion and deformation mechanism of the 2018 Xe Pian-Xe Namnoy dam Collapse, Laos: Insights from satellite radar interferometry. Int. J. Appl. Earth Obs. Geoinf. 2022, 109, 13. [Google Scholar] [CrossRef]
  12. Shao, C.F.; Gu, C.S.; Yang, M.; Xu, Y.X.; Su, H.Z. A novel model of dam displacement based on panel data. Struct. Control. Health Monit. 2018, 25, 13. [Google Scholar] [CrossRef]
  13. Xu, X.Y.; Yang, J.; Ma, C.H.; Qu, X.D.; Chen, J.M.; Cheng, L. Segmented modeling method of dam displacement based on BEAST time series decomposition. Measurement 2022, 202, 17. [Google Scholar] [CrossRef]
  14. Guler, G.; Kilic, H.; Hosbas, G.; Ozaydin, K. Evaluation of the movements of the dam embankments by means of geodetic and geotechnical methods. J. Surv. Eng.-ASCE 2006, 132, 31–39. [Google Scholar] [CrossRef]
  15. Kalkan, Y. Geodetic deformation monitoring of Ataturk Dam in Turkey. Arab. J. Geosci. 2014, 7, 397–405. [Google Scholar] [CrossRef]
  16. Stewart, M.; Tsakiri, M. The status of the global positioning system for dam surface monitoring. Proc. Inst. Civ. Eng.-Geotech. Eng. 2001, 149, 249–252. [Google Scholar] [CrossRef]
  17. Intrieri, E.; Raspini, F.; Fumagalli, A.; Lu, P.; Del Conte, S.; Farina, P.; Allievi, J.; Ferretti, A.; Casagli, N. The Maoxian landslide as seen from space: Detecting precursors of failure with Sentinel-1 data. Landslides 2018, 15, 123–133. [Google Scholar] [CrossRef]
  18. Tomas, R.; Cano, M.; Garcia-Barba, J.; Vicente, F.; Herrera, G.; Lopez-Sanchez, J.M.; Mallorqui, J.J. Monitoring an earthfill dam using differential SAR interferometry: La Pedrera dam, Alicante, Spain. Eng. Geol. 2013, 157, 21–32. [Google Scholar] [CrossRef]
  19. Di Martire, D.; Iglesias, R.; Monells, D.; Centolanza, G.; Sica, S.; Ramondini, M.; Pagano, L.; Mallorqui, J.J.; Calcaterra, D. Comparison between Differential SAR interferometry and ground measurements data in the displacement monitoring of the earth-dam of Conza della Campania (Italy). Remote Sens. Environ. 2014, 148, 58–69. [Google Scholar] [CrossRef]
  20. Milillo, P.; Burgmann, R.; Lundgren, P.; Salzer, J.; Perissin, D.; Fielding, E.; Biondi, F.; Milillo, G. Space geodetic monitoring of engineered structures: The ongoing destabilization of the Mosul dam, Iraq. Sci. Rep. 2016, 6, 7. [Google Scholar] [CrossRef]
  21. Emadali, L.; Motagh, M.; Haghighi, M.H. Characterizing post-construction settlement of the Masjed-Soleyman embankment dam, Southwest Iran, using TerraSAR-X SpotLight radar imagery. Eng. Struct. 2017, 143, 261–273. [Google Scholar] [CrossRef]
  22. Liu, Y.F.; Fan, H.D.; Wang, L.; Zhuang, H.F. Monitoring of surface deformation in a low coherence area using distributed scatterers InSAR: Case study in the Xiaolangdi Basin of the Yellow River, China. Bull. Eng. Geol. Environ. 2021, 80, 25–39. [Google Scholar] [CrossRef]
  23. Al-Husseinawi, Y.; Li, Z.H.; Clarke, P.; Edwards, S. Evaluation of the Stability of the Darbandikhan Dam after the 12 November 2017 Mw 7.3 Sarpol-e Zahab (Iran-Iraq Border) Earthquake. Remote Sens. 2018, 10, 17. [Google Scholar] [CrossRef]
  24. Maltese, A.; Pipitone, C.; Dardanelli, G.; Capodici, F.; Muller, J.P. Toward a Comprehensive Dam Monitoring: On-Site and Remote-Retrieved Forcing Factors and Resulting Displacements (GNSS and PS-InSAR). Remote Sens. 2021, 13, 19. [Google Scholar] [CrossRef]
  25. Li, X.S.; Ming, H.Y. Seepage driving effect on deformations of San Fernando dams. Soil Dyn. Earthq. Eng. 2004, 24, 979–992. [Google Scholar] [CrossRef]
  26. Salazar, F.; Toledo, M.A.; Onate, E.; Moran, R. An empirical comparison of machine learning techniques for dam behaviour modelling. Struct. Saf. 2015, 56, 9–17. [Google Scholar] [CrossRef]
  27. Luo, J.; Zhang, Q.; Li, L.; Xiang, W. Monitoring and characterizing the deformation of an earth dam in Guangxi Province, China. Eng. Geol. 2019, 248, 50–60. [Google Scholar] [CrossRef]
  28. Su, Z.Y.; Zhang, K.; Liu, C.D. Dynamic risk assessment of slope stability of homogeneous earth-rock dam under action of multiple hazards. Simul.-Trans. Soc. Model. Simul. Int. 2022, 98, 699–710. [Google Scholar] [CrossRef]
  29. Loperte, A.; Soldovieri, F.; Lapenna, V. Monte Cotugno Dam Monitoring by the Electrical Resistivity Tomography. IEEE J. Sel. Top. Appl. Earth Observ. Remote Sens. 2015, 8, 5346–5351. [Google Scholar] [CrossRef]
  30. Al-Janabi, A.M.S.; Ghazali, A.H.; Ghazaw, Y.M.; Afan, H.A.; Al-Ansari, N.; Yaseen, Z.M. Experimental and Numerical Analysis for Earth-Fill Dam Seepage. Sustainability 2020, 12, 14. [Google Scholar] [CrossRef]
  31. Nan, S.H.; Ren, J.; Ni, F.; Zhang, L.; He, X.F. Heat tracing of embankment dam leakage: Laboratory experiments and 2D numerical modelling. J. Hydrol. 2022, 608, 16. [Google Scholar] [CrossRef]
  32. Zhang, H.X.; Li, Z.K.; Li, W.; Song, Z.Y.; Ge, W.; Han, R.F.; Wang, T. Risk Analysis of Instability Failure of Earth-Rock Dams Based on the Fuzzy Set Theory. Water 2021, 13, 13. [Google Scholar] [CrossRef]
  33. Zhu, Y.B.; Li, F.T.; Yang, F.F.; Zhang, Y.X.; Tian, W.H.; Lan, H.X. Experimental Investigation on Failure Modes and Progressive Failure Process of Earthen Check Dam Triggered by Upstream Flow. Front. Earth Sci. 2022, 10, 19. [Google Scholar] [CrossRef]
  34. Komasi, M.; Beiranvand, B. Seepage and Stability Analysis of the Eyvashan Earth Dam under Drawdown Conditions. Civ. Eng. Infrastruct. J.-CEIJ 2021, 54, 205–223. [Google Scholar] [CrossRef]
  35. Luan, Y.S.; Lian, C. Engineering Geological Investigation Report of the Preliminary Design Stage of Liuduzhai Reservoir Reinforcement Project in Longhui County, Hunan Province; Changjiang Institute of Survey, Planning, Design and Research: Wuhan, China, 2006. [Google Scholar]
  36. Liang, J.W. Safety Evaluation Report of Liuduzhai Reservoir Dam (Chinese); Hunan Water Resources and Hydropower Research Institute: Changsha, China, 2002. [Google Scholar]
  37. Turkmen, S. Treatment of the seepage problems at the Kalecik Dam (Turkey). Eng. Geol. 2003, 68, 159–169. [Google Scholar] [CrossRef]
  38. Ferretti, A.; Prati, C.; Rocca, F. Nonlinear subsidence rate estimation using permanent scatterers in differential SAR interferometry. IEEE Trans. Geosci. Remote Sens. 2000, 38, 2202–2212. [Google Scholar] [CrossRef]
  39. Ferretti, A.; Prati, C.; Rocca, F. Permanent scatterers in SAR interferometry. IEEE Trans. Geosci. Remote Sens. 2001, 39, 8–20. [Google Scholar] [CrossRef]
  40. Berardino, P.; Fornaro, G.; Lanari, R.; Sansosti, E. A new algorithm for surface deformation monitoring based on small baseline differential SAR interferograms. IEEE Trans. Geosci. Remote Sens. 2002, 40, 2375–2383. [Google Scholar] [CrossRef]
  41. Duan, M.; Xu, B.; Li, Z.W.; Wu, W.H.; Cao, Y.M.; Liu, J.H.; Wang, G.Y.; Hou, J.X. A New Weighting Method by Considering the Physical Characteristics of Atmospheric Turbulence and Decorrelation Noise in SBAS-InSAR. Remote Sens. 2020, 12, 21. [Google Scholar] [CrossRef]
  42. Dong, J.H.; Niu, R.Q.; Li, B.Q.; Xu, H.; Wang, S.Y. Potential landslides identification based on temporal and spatial filtering of SBAS-InSAR results. Geomat. Nat. Hazards Risk 2023, 14, 52–75. [Google Scholar] [CrossRef]
  43. Zhou, W.; Li, S.L.; Zhou, Z.W.; Chang, X.L. Remote Sensing of Deformation of a High Concrete-Faced Rockfill Dam Using InSAR: A Study of the Shuibuya Dam, China. Remote Sens. 2016, 8, 15. [Google Scholar] [CrossRef]
  44. Ferretti, A.; Fumagalli, A.; Novali, F.; Prati, C.; Rocca, F.; Rucci, A. A New Algorithm for Processing Interferometric Data-Stacks: SqueeSAR. IEEE Trans. Geosci. Remote Sens. 2011, 49, 3460–3470. [Google Scholar] [CrossRef]
  45. Terbouche, F.; Hamza, A.; Gabi, S. Analysis of pore water pressures in an earth dam under operating conditions (case of Taksebt Dam, Algeria). World J. Eng. 2022, 19, 480–490. [Google Scholar] [CrossRef]
  46. Han, B.; Tong, B.; Yan, J.K.; Yin, C.R.; Chen, L.; Li, D.Y. The Monitoring-Based Analysis on Deformation-Controlling Factors and Slope Stability of Reservoir Landslide: Hongyanzi Landslide in the Southwest of China. Geofluids 2018, 2018, 7391517. [Google Scholar] [CrossRef]
  47. Guo, Z.Z.; Chen, L.X.; Yin, K.L.; Shrestha, D.P.; Zhang, L. Quantitative risk assessment of slow-moving landslides from the viewpoint of decision-making: A case study of the Three Gorges Reservoir in China. Eng. Geol. 2020, 273, 19. [Google Scholar] [CrossRef]
  48. Sun, P.; Wang, H.J.; Wang, G.; Li, R.J.; Zhang, Z.; Huo, X.T. Field model experiments and numerical analysis of rainfall-induced shallow loess landslides. Eng. Geol. 2021, 295, 17. [Google Scholar] [CrossRef]
  49. Nirmala, J.; Dhanalakshmi, G. Influence of nano materials in the distressed retaining structure for crack filling. Constr. Build. Mater. 2015, 88, 225–231. [Google Scholar] [CrossRef]
  50. Sillers, W.S.; Fredlund, D.G. Statistical assessment of soil-water characteristic curve models for geotechnical engineering. Can. Geotech. J. 2001, 38, 1297–1313. [Google Scholar] [CrossRef]
  51. Pham, H.Q.; Fredlund, D.G. Equations for the entire soil-water characteristic curve of a volume change soil. Can. Geotech. J. 2008, 45, 443–453. [Google Scholar] [CrossRef]
  52. Fredlund, D.G.; Sheng, D.C.; Zhao, J.D. Estimation of soil suction from the soil-water characteristic curve. Can. Geotech. J. 2011, 48, 186–198. [Google Scholar] [CrossRef]
  53. Zhu, H.; Zhang, L.M.; Zhang, L.L.; Zhou, C.B. Two-dimensional probabilistic infiltration analysis with a spatially varying permeability function. Comput. Geotech. 2013, 48, 249–259. [Google Scholar] [CrossRef]
  54. Zhai, Q.; Rahardjo, H. Estimation of permeability function from the soil-water characteristic curve. Eng. Geol. 2015, 199, 148–156. [Google Scholar] [CrossRef]
  55. Nguyen, T.S.; Likitlersuang, S. Reliability analysis of unsaturated soil slope stability under infiltration considering hydraulic and shear strength parameters. Bull. Eng. Geol. Environ. 2019, 78, 5727–5743. [Google Scholar] [CrossRef]
  56. Zheng, W.J.; Hu, J.; Lu, Z.; Hu, X.; Sun, Q.; Liu, J.H.; Zhu, J.J.; Li, Z.W. Enhanced Kinematic Inversion of 3-D Displacements, Geometry, and Hydraulic Properties of a North-South Slow-Moving Landslide in Three Gorges Reservoir. J. Geophys. Res.-Solid Earth. 2023, 128, 21. [Google Scholar] [CrossRef]
  57. Gamse, S.; Oberguggenberger, M. Assessment of long-term coordinate time series using hydrostatic-season-time model for rock-fill embankment dam. Struct. Control. Health Monit. 2017, 24, 18. [Google Scholar] [CrossRef]
  58. Anchuela, O.P.; Frongia, P.; Di Gregorio, F.; Sainz, A.M.C.; Juan, A.P. Internal characterization of embankment dams using ground penetrating radar (GPR) and thermographic analysis: A case study of the Medau Zirimilis Dam (Sardinia, Italy). Eng. Geol. 2018, 237, 129–139. [Google Scholar] [CrossRef]
Figure 1. The location of the study area and the Liuduzhai reservoir. (a) DEM image of the Liuduzhai reservoir: black rectangle delineates the location of the Liuduzhai Dam, blue and red rectangles correspond to the frame covered by ascending Sentinel-1A and ALOS-1 data. (b) UAV image of the Liuduzhai Dam: the inset shows the location of the dam in China.
Remotesensing 15 04110 g001
Figure 2. The regional geological map of the Liuduzhai reservoir.
Remotesensing 15 04110 g002
Figure 3. (a) The plan view of the dam (I-I’: the profile line at the berm with an elevation of 345.0 m; II-II’: typical profile line with maximum dam height). (b) The typical geological profile of the Liuduzhai Dam.
Remotesensing 15 04110 g003
Figure 4. InSAR image pairs. (a) ALOS-1(Path: 463). (b) Sentinel-1A (Path: 84).
Remotesensing 15 04110 g004
Figure 5. Numerical model of the Liuduzhai Dam. (a) Clay-core wall. (b) Plastic concrete cut-off walls.
Remotesensing 15 04110 g005
Figure 6. Unsaturated characteristics of the Liuduzhai Dam. (a) SWCC. (b) HCF.
Remotesensing 15 04110 g006
Figure 7. Hydrological parameters of the Liuduzhai reservoir. (a) Reservoir capacity curve. (b) Rapid drawdown duration curve. (c) Water level from 2002 to 2012 (red dashed box indicates the observation period of ALOS-1, gray background box indicates the time span of dam reinforcement). (d) Water level from 2012 to 2022 (blue dashed box indicates the observation period of Sentinel-1A).
Remotesensing 15 04110 g007
Figure 8. LOS deformation velocity maps of the Liuduzhai Dam. (a) ALOS-1. (b) Sentinel-1A. The red dotted line represents the primary deformation zone of the dam.
Remotesensing 15 04110 g008
Figure 9. Deformation velocity profiles of the dam cross sections. (a) Cross section I-I’. (b) Cross section II-II’.
Remotesensing 15 04110 g009
Figure 10. The pore pressure contour of steady seepage analysis: the blue dotted line represents the saturation line. (ac) Seepage analysis results for the clay-core wall. (df) Seepage analysis results for the plastic concrete cut-off walls: (a,d) represent the normal water level condition, (b,e) represent the design flood condition, (c,f) represent the check water condition.
Remotesensing 15 04110 g010
Figure 11. Dynamics of seepage under the rapid drawdown condition of the reservoir level (pore pressure contour with the dead water level as the background). (a) Clay-core wall. (b) Plastic concrete cut-off walls.
Remotesensing 15 04110 g011
Figure 12. The time series deformation characteristics of the P point. (a) Before reinforcement. (b) After reinforcement.
Remotesensing 15 04110 g012
Figure 13. The schematic sketch for the deformation on the Liuduzhai Dam. (a) Dynamic seepage. (b) Construction load. (c) Consolidation. (d) Hydrodynamic pressure.
Remotesensing 15 04110 g013
Table 1. SAR data parameters.
SensorALOS-1Sentinel-1A
Orbit number46384
Orbit directionAscendingAscending
Heading angle (°)349.7349.9
Look angle (°)38.743.9
Pixel spacing(m; Range × Azimuth)4.7 × 3.22.3 × 13.9
Timespan13 January 2007–24 October 201020 June 2015–14 January 2022
Number of scenes12174
Table 2. The Saturation Hydraulic conductivity of the numerical model.
MaterialsCore (I)Core (II)Dam Shell (D)Dam Shell (U)Cut-Off WallsBackfilterBedrockDrainage Prism
m/d7.0 × 10−24.1 × 10−11.883.92.8 × 10−44.12.0 × 10−3100.0
Table 3. Computational conditions for seepage analysis.
ConditionsAnalysis TypeThe Upstream Boundary/m
Normal water levelsteady seepage355.0
Design flood levelsteady seepage355.64
Check water levelsteady seepage358.4
Rapid drawdownunsteady seepageRapid drawdown duration curve (Figure 7b)
Operation water levelunsteady seepageWater-level during InSAR observation period (Figure 7c,d)
Disclaimer/Publisher’s Note: The statements, opinions and data contained in all publications are solely those of the individual author(s) and contributor(s) and not of MDPI and/or the editor(s). MDPI and/or the editor(s) disclaim responsibility for any injury to people or property resulting from any ideas, methods, instructions or products referred to in the content.

