Article

YOLO-Lite: An Efficient Lightweight Network for SAR Ship Detection

1
School of Artificial Intelligence and Big Data, Henan University of Technology, Zhengzhou 450001, China
2
Key Laboratory of Grain Information Processing & Control, College of Information Science and Engineering, Ministry of Education, Henan University of Technology, Zhengzhou 450001, China
3
Aerospace Information Research Institute, Chinese Academy of Sciences, Beijing 100190, China
*
Author to whom correspondence should be addressed.
Remote Sens. 2023, 15(15), 3771; https://doi.org/10.3390/rs15153771
Submission received: 2 July 2023 / Revised: 23 July 2023 / Accepted: 27 July 2023 / Published: 29 July 2023
(This article belongs to the Special Issue Microwave Remote Sensing for Object Detection)

Abstract

:
Automatic ship detection in SAR images plays an essential role in both military and civilian fields. However, most of the existing deep learning detection methods introduce complex models and huge calculations while improving the detection accuracy, which is not conducive to the application of real-time ship detection. To solve this problem, an efficient lightweight network YOLO-Lite is proposed for SAR ship detection in this paper. First, a lightweight feature enhancement backbone (LFEBNet) is designed to reduce the amount of calculation. Additionally, a channel and position enhancement attention (CPEA) module is constructed and embedded into the backbone network to more accurately locate the target location by capturing the positional information. Second, an enhanced spatial pyramid pooling (EnSPP) module is customized to enhance the expression ability of features and address the position information loss of small SAR ships in high-level features. Third, we construct an effective multi-scale feature fusion network (MFFNet) with two feature fusion channels to obtain feature maps with more position and semantic information. Furthermore, a novel confidence loss function is proposed to effectively improve the SAR ship target detection accuracy. Extensive experiments on SSDD and SAR ship datasets verify the effectiveness of our YOLO-Lite, which can not only accurately detect SAR ships in different backgrounds but can also realize a lightweight architecture with low computation cost.

Graphical Abstract

1. Introduction

Synthetic aperture radar (SAR) is an active microwave imaging radar which can realize all-weather and all-day observation of the ground. Therefore, it has been widely used in the field of target reconstruction, target detection, and disaster and environmental monitoring [1,2,3,4]. Among these applications, automatic ship detection in SAR images plays an essential role in both military and civilian fields, such as national defense and security, fishing vessel monitoring, and maritime transport supervision and rescue [1,5,6,7]. However, compared with optical imagery, SAR images acquired from satellite and airborne platforms usually have lower resolutions and are more susceptible to background clutter and noise. In addition, ships of different sizes are displayed as objects with different pixels in SAR images. Therefore, it is still a significant challenge to accurately detect SAR ships with multi-scale features.
Traditional SAR ship detection methods usually rely on experience to manually select features, such as grayscale, texture, contrast, histogram statistics, and scattering properties [8,9,10]. Generally, they are only suitable for SAR ship detection with simple backgrounds. The constant false alarm rate (CFAR) detection method is widely utilized in SAR ship detection [11]. It sets the threshold according to the contrast between the target and the sea clutter background, which can achieve better detection performance in high-contrast scenes. However, when the surrounding environment is complex, it is difficult to use statistical data to describe the scattering mechanism of the ship target, and the detection performance will decline.
In recent years, deep learning methods have been widely used in target detection and recognition, target localization, image segmentation, and so on. They have the advantages of self-learning, self-improvement, and weight sharing. It is possible to realize automatic detection and recognition of ships in SAR images by using deep learning methods, which have become the new methods of choice to tackle the problem of SAR ship detection. Nie et al. [12] improved the accuracy of ship detection and segmentation by adding a bottom-up structure to the FPN model in Mask-RCNN and applying an attention mechanism to the network. Ke et al. [13] replaced conventional convolution kernels with deformable convolution in Faster RCNN to better model the geometric transformation of ships. In order to tackle the problem of multi-scale ship detection, You et al. [14] proposed a wide-area target search system to integrate different ship detection methods. Lv et al. [15] designed a two-step detector for ship detection, which utilized the complex information of a single-look SAR image to characterize the ship features. Li et al. [16] proposed a novel RADet algorithm to obtain the rotating boundary boxes of objects with shape masks. To solve the problem of multi-scale SAR ship detection in complex environments, Li et al. [17] proposed a multidimensional domain fusion network which fused low-level and high-level features to improve detection accuracy. Furthermore, to improve the accuracy of neural networks, attention mechanisms are widely used in target detection and recognition. A squeeze and excitation (SE) attention mechanism is proposed to focus on channel relationships, which recalibrates channel characteristic responses by simulating interdependencies between channels [18]. An attention receptive pyramid network embedded in a convolutional block attention module (CBAM) [19] is proposed to suppress the background interference in [20]. Zha et al. [21] proposed a ship detection method using multi-feature transformation and fusion to improve the detection accuracy for small targets in complex backgrounds. In the proposed ship detection model, a modified CBAM attention mechanism and SE attention mechanism are utilized to reduce the noise interference. Li et al. [22] proposed an SAR ship detection model, A-BFPN, based on attention-guided balanced feature pyramid networks, and constructed a channel attention fusion module to acquire the multiscale features. Zhang et al. [23] proposed a regional predictive perception network for SAR ship detection, which constructed a cross-scale self-attention module to restrain the background interference and improve the SAR ship target detection accuracy. All of these methods have achieved good results in SAR ship detection tasks. However, they mainly focus on the improvement of detection accuracy, ignoring that the complexity and computation of the model will increase with the deepening of the network. This issue can be a significant obstacle to deploying ship detection on aircraft or satellite platforms.
To achieve real-time ship detection in remote sensing images, many lightweight models based on one-stage detectors have been explored. The Single Shot MultiBox Detector (SSD) [24] model is a detection method that directly predicts target categories and bounding boxes and does not generate a proposal process. This makes SSD easy to train and integrate and suitable for fast SAR ship detection [25]. Zhou et al. [26] designed a lightweight SAR ship detection method based on anchor free networks, which utilized a single-stage model FCOS to reduce the model parameter and decrease the computational complexity. Miao et al. [27] designed an SAR ship detection model based on an improved RetinaNet network. The backbone of RetinaNet was replaced by a ghost module to decrease the number of convolutional layers, which could effectively reduce the model parameters and the floating-point operations. Guo et al. [28] proposed an improved YOLOv5 network for SAR ship detection. The proposed network used a CBAM module to extract features of the channel and spatial dimensions and employed a BiFPN module to fuse multi-scale features. Zhang et al. [29] designed a ShipDeNet-20 network for real-time SAR application by introducing a scale share feature pyramid module. Zhao et al. [30] constructed a single-stage model to detect arbitrarily oriented ships through stepwise regression from coarse-grained to fine-grained detection. Moreover, shallow texture features and deep semantic features are also fused in this model to improve the accuracy. Chang et al. [31] developed a new architecture with fewer layers based on You Only Look Once version 2 (YOLOv2) to reduce the computational time. An attention mechanism is imposed into YOLOv3 in [32]. Sun et al. [33] designed a YOLO-based arbitrary orientation SAR ship detector, which can detect multi-scale ships through bi-directional information interaction. Guo et al. [34] combined the adaptive activation function and convolutional block attention model in YOLOX-SAR to improve the feature extraction ability. Van Etten [35] proposed an end-to-end object detection framework You Only Look Twice (YOLT) for satellite imagery, which can rapidly detect objects with relatively little training data. Nina et al. [36] studied the ship detection performance of YOLOv3 and YOLT on satellite imagery. Although YOLO series can be regarded as the first choice for real-time ship detection, their detection accuracy still needs to be improved. Due to the imaging characteristics of SAR systems, the obtained SAR images are much different from the nature scenes, which are obviously influenced by background interference and the morphological changes of the targets. Especially in the nearshore area, some ships in SAR images have scattering mechanisms that are similar to the surrounding areas, or a large number of ships are densely distributed, which can easily cause missed detections and false detections. In addition, the existing methods of SAR ship detection often ignore the position information loss of small ships in high-level features, which limits the detection performance. Furthermore, most methods improve accuracy by adding modules or increasing the network depth, resulting in complex models and slow detection speeds, which are not conducive to the application of real-time ship detection.
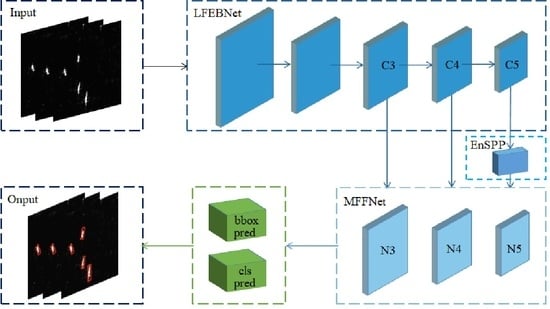
In order to better balance the accuracy and speed of SAR ship detection, we propose an efficient lightweight SAR ship detection model YOLO-Lite in this paper. The main contributions of the proposed model are as follows:
1. We design a lightweight feature enhancement backbone (LFEBNet) to reduce computational costs. Moreover, a channel and position enhancement attention (CPEA) module is constructed and integrated into the LFEBNet architecture to more accurately locate the target location by capturing the positional information.
2. To enhance the expression ability of features and address the position information loss of small SAR ships in high-level features, an enhanced spatial pyramid pooling (EnSPP) module is designed to aggregate the output feature more fully.
3. To overcome the multi-scale features of SAR ship targets, an effective multi-scale feature fusion network (MFFNet) is customized to obtain feature maps with more position and semantic information.
4. Considering the imbalance between negative and positive samples, we introduce weights to control negative and positive samples and the sample classification difficulty to obtain a novel confidence loss function, which can effectively improve the SAR ship target detection accuracy.
The remainder of this paper is organized as follows. The overall network structure and details are introduced in Section 2. In Section 3, the experiment results and performance analysis are presented. Ablation experiments are conducted in Section 4. Finally, Section 5 gives a brief conclusion.

2. Methodology

2.1. Overall Network Structure

The overall network structure of YOLO-Lite is shown in Figure 1. We choose YOLOv5 [37] as the basic framework. Compared to other YOLO series, YOLOv5 is currently the most mature version, which has stable detection precision, a simple structure, and fast detection speeds for various datasets, allowing it to realize lightweight SAR ship detection more easily. There are five versions of YOLOv5’s main network structure, namely YOLOv5s, YOLOv5m, YOLOv5l, YOLOv5n, and YOLOv5x. The key to SAR ship detection is to find a suitable lightweight detection model which can balance the accuracy and speed of SAR ship detection with limited computing resources. The YOLOv5l model combines the advantages of high detection precision and fast detection speed, making it suitable for SAR ship detection. Therefore, YOLOv5l is chosen as the baseline framework in this paper.
As shown in Figure 1, our YOLO-Lite mainly includes four parts: a lightweight feature enhancement backbone, an enhanced spatial pyramid pooling (EnSPP) module, a multi-scale feature fusion network, and a detection head. Firstly, a lightweight feature enhancement backbone (LFEBNet) is designed, which reduces the amount of calculation by introducing depth-wise separable convolution and novel residual structural construction. In order to highlight the target features and suppress background interference, the channel and position enhancement attention (CPEA) module is designed and embedded into the backbone network to improve the SAR ship targets localization accuracy. To enhance the expression ability of features and address the position information loss of small SAR ships in high level features, the last feature map C5 extracted by the backbone network passes though the EnSPP module before feature fusion. Then, we construct an effective multi-scale feature fusion network (MFFNet) with two feature fusion channels to improve the SAR ship target detection accuracy. Specifically, we apply an attention mechanism in the top-down feature fusion to improve useful features and suppress unimportant features. At the same time, we merge the original feature map and introduce weights to distinguish the importance of each input feature in the down-top feature fusion module. The MFFNet allows us to obtain fused feature maps with richer position and semantic information. After that, the fused feature maps are sent to the detection head to identify and locate the ship targets. The final detection results of YOLO-Lite are obtained by a non-maximum suppression (NMS) [38] operation.

2.2. Lightweight Feature Enhancement Backbone (LFEBNet)

Inspired by MobileNetv3 [39], we designed a lightweight network module (LFEBNet) as the backbone feature extraction network.
The network structure of LFEBNet is shown in Figure 2; it is mainly made up of a stack of lightweight feature extraction modules (LFEM). From Figure 2, it can be clearly seen that the LFEBNet compresses the feature layers by stacking LFEM modules to obtain five feature maps of different sizes and different perceptual fields.
The LFEM module is an important component of the LFEBNet network, and the overall structure of the LFEM module is shown in Figure 3. The LFEM module uses an inverted residual structure to map the input information to the high dimension for feature extraction, because the high dimension information loses less information after passing the activation function. Additionally, compared with natural images, the ship target in SAR images contains fewer pixels, while the background contains most of the pixels. Especially in complex scenes such as nearshore environment, the features extracted during SAR ship detection are not always obvious. Therefore, a channel and position enhancement attention (CPEA) module is designed and integrated into the LFEM module to improve the localization accuracy of SAR targets in complex backgrounds. The strategy of CPEA is to highlight the target features and suppress background interference by fusing position information.
The architecture of CPEA is presented in the dotted box in Figure 3. First, the input feature information, X, is decomposed along the vertical and horizontal directions, respectively, to obtain two parallel one dimensional (1D) feature codes. This operation can effectively avoid the position information loss caused by the introduction of two-dimensional (2D) global pooling. Specially, we utilize maximum pooling and average pooling operations in each direction. The maximum pooling operation is utilized to highlight the target features, and the average pooling operation is introduced to restrain background interference. After the pooling operations in horizontal and vertical directions, a multi-layer perceptron (MLP) is applied to achieve the output features Xh and Xw in two directions. To better utilize the captured positional information from the first stage, the concatenate operation is used on the processed features Xh and Xw to aggregate the global features in the spatial dimension. Then, a convolution transformation with a 1 × 1 convolution kernel is performed to generate the intermediate feature map encoding the spatial positional information of the two directions. The intermediate feature map can be expressed as
X I = H s [ Conv ( Concat ( X h , X w ) ) ]
where Concat ( , ) represent the concatenate operation and Conv ( ) denotes the convolution transformation. H s ( ) is the hard-swish function chosen as the activation function in the CPEA network structure, which is written as
H s ( x ) = x ReLU ( x + 3 ) 6
Then, the channel information is effectively captured in the next stage. The intermediate feature map, XI, is split into vertical and horizontal tensors, XIh and XIw. After that, the number of channels is rescaled using 1 × 1 convolution transformation, and the corresponding weights are obtained after the activation function. Then, the weights are multiplied with the input, X. Therefore, the output of the CPEA can be expressed as
F h = Conv ( X I h ) ReLU ( Conv ( X I h ) + 3 ) 6
F w = Conv ( X I w ) ReLU ( Conv ( X I w ) + 3 ) 6
X o u t = X × F h × F w
Furthermore, to reduce the model parameters and operational burden, the LFEM module utilizes depthwise separable convolutional blocks instead of the standard convolutional blocks. The depthwise separable convolution consists of two components, depthwise convolution and pointwise convolution, which are lower in terms of parameters and computational cost compared to standard convolution [40]. The difference between standard convolution and depthwise separable convolution is shown in Figure 4.
As shown in Figure 4, assuming the input image size is (12, 12, 3), 256 convolutional kernels of size (5, 5, 3) are used to produce the output feature map of size (8, 8, 256) in standard convolution. The computational cost of standard convolution is 256 × 5 × 5 × 3 × 8 × 8 = 1,228,800. However, depthwise separable convolution will first perform depthwise convolution. A convolutional kernel of depthwise convolution is responsible for a channel, so the number of feature map channels generated by this process is exactly the same as the number of input channels. Therefore, 3 convolutional kernels of size (5, 5, 1) are used to produce the output feature map of size (8, 8, 3). The computational cost of depthwise convolution is 3 × 5 × 5 × 1 × 8 × 8 = 4800. The depthwise convolution independently performs convolution operations on each channel of the input image. It does not effectively utilize the feature information of different channels at the same spatial position. Then, pointwise convolution is used to combine the previous feature map generated in the depth direction to generate a new feature map. The operation of pointwise convolution is similar to standard convolution. 256 convolutional kernels of size (1, 1, 3) are utilized to produce the output feature map of size (8, 8, 256), and the computational cost of pointwise convolution is 256 × 1 × 1 × 3 × 8 × 8 = 49,152. Therefore, the computational cost of depthwise separable convolution is 4800 + 49,152 = 53,952, which is much lower than standard convolution.

2.3. Enhanced Spatial Pyramid Pooling (EnSPP)

The original intention of spatial pyramid pooling (SPP) is to address the limitations of a convolutional neural network in terms of the size of input images [41]. When applied to target detection, SPP can expand the receptive field and separate the significant context features of a feature map. The structure of SPP is shown in Figure 5a.
Motivated by SPP, an enhanced SPP module (EnSPP) is proposed in this paper. The structure of EnSPP is presented in Figure 5b. As shown in Figure 5b, EnSPP first performs convolution and normalization activation on input features, followed by three serial maximum pooling operations with pooling kernels of 5, 7, and 9. Here small pooling kernels are utilized to more accurately obtain the position information of small ships in SAR images. Additionally, this multi-scale pooling operation can effectively improve the accuracy of SAR ship detection networks in extracting target positions. Moreover, compared with the parallel maximum pooling operation performed by SPP, the proposed EnSPP can also improve the speed of target feature extraction. Afterwards, the obtained features of different sizes are concatenated and convolved twice to achieve feature extraction and down-sampling. In addition, a residual branch is introduced in the output feature layer to optimize the feature extraction. As shown in Figure 5b, a 1 × 1 convolution is performed on the residual branch to directly connect the input original feature to the feature to be output, aggregating the output feature more fully.

2.4. Multi-Scale Feature Fusion Network (MFFNet)

In target detection, the low-level and high-level features are complementary. The low-level features contain stronger location information, while the high-level features include richer semantic information. To increase the target detection accuracy, the fusion of low-level and high-level features is usually used for the subsequent prediction. However, semantic information will be sparse in the top-down feature fusion process, and it is easy to cause small target position loss in the down-top feature fusion process. The path aggregation network for instance segmentation (PANet) combines the advantages of top-down paths and down-top paths to achieve bidirectional feature fusion [42]. However, due to the complex background of SAR ship images in the nearshore area, it is difficult for PANet to effectively distinguish positive and negative samples. Therefore, an effective multi-scale feature fusion network (MFFNet) is designed in this paper. It is composed of two feature fusion channels. An attention mechanism is applied in the top-down feature fusion process, which can effectively improve useful features and suppress unimportant features. Furthermore, a down-top path aggregation module is designed to transmit the position information to the predicted feature. At the same time, the original feature map of the same layer is input to fuse more features, and different weights are also introduced to distinguish the importance of each input feature. Thus, the predicted feature maps have rich position and semantic information at the same time, which could greatly improve the SAR ship detection accuracy.
The detailed structure of MFFNet is illustrated in Figure 6. The high-level feature P5 is first up-sampled to match the size of feature C4, and then the processed feature P5 can be fused with C4. Next, the global average pooling operation is used to compress the fused feature along the spatial dimension, which gives the high-level semantic feature a greater receptive field. After that, two fully connected layers are connected to fit the correlation between channels, and the weight of each feature channel can be automatically achieved by learning. This channel attention operation could effectively enhance useful features and restrain unimportant features. Then, the same feature enhancement process is implemented on feature map P4 to achieve feature map P3. The top-down feature fusion structure is limited by one-way information flow, so an additional down-top branch aggregation module is added here to transmit the information of the low-level feature to the high-level feature. In the process of feature fusion from down to top, in order to fuse more features of the original image, we not only input the intermediate feature fusion results, but also add the original feature of the same layer. Furthermore, the input features in different layers have different resolutions, and their contributions to the fused feature map are different. Therefore, weights are introduced in the feature fusion stage, and their values are learned by the network to distinguish the importance of different input features. The final outputs of MFFNet can be expressed as
N 3 = c o n v ( P 3 )
N 4 = c o n v ( w 41 C 4 + w 42 P 4 + w 43 r e s i z e ( N 3 ) w 41 + w 42 + w 43 + ε )
N 5 = c o n v ( w 51 P 5 + w 52 r e s i z e ( N 4 ) w 51 + w 52 + ε )
where wij denotes the contribution of each input feature, and its value ranges from 0 to 1. ε is a small positive value.

2.5. Loss Function

After the images are input into the model, the fused feature maps obtained by MFFNet are sent to the final classification and bounding box prediction part to identify and locate the ship targets. The losses in the model include classification loss, confidence loss, and regression loss.

2.5.1. Classification Loss

Classification loss is caused by target classification, which is calculated by cross entropy in this paper. The classification loss is expressed as
L o s s c l s = i = 0 K 2 j = 0 M I i j o b j c c l a s s [ p ¯ i j ( c ) log ( p i j ( c ) ) + ( 1 p ¯ i j ( c ) ) log ( 1 p i j ( c ) ) ]
where K denotes grid size, M represents the number of anchors in each grid, I i j o b j is the indicative function, indicating whether there is target in the box at (i, j). p ¯ and p denote the class probabilities of the real box and predicted box, respectively.

2.5.2. Confidence Loss

Confidence loss is utilized to determine the probability that the target exists in the bounding box. It is usually applied to dichotomous cross entropy to calculate the positive and negative sample loss. In practice, only a few prior boxes could match the real box, and most of them are negative samples; that is, the number of negative samples is far higher than that of positive samples. This imbalance between negative and positive samples will lead to a reduction in target detection accuracy. Therefore, a weight, α, is introduced into the standard cross-entropy to reduce the impact of negative samples. When the sample is a positive sample, we multiply the cross entropy with the weight, α. On the other hand, when the sample is a negative sample, the weight, 1 − α, is selected for the cross entropy. The weight, α, ranges from 0 to 1.
In addition, the imbalance between negative and positive samples will lead to fewer learning iterations of a certain category in the model, and the sample will gradually become a hard sample. Relevant research shows that samples that are easy to classify comprise the majority of the loss. Therefore, here we consider the influence of the classification difficulty of samples on the loss function and introduce a weight coefficient, p, into the cross-entropy to reduce the impact of easy samples. Weight coefficient p is selected as the probability so that the current network prediction sample is positive. For positive samples, the smaller the value of 1 − p, the more accurately predicted and easier to classify the sample is. Therefore, (1 − p)γ is used as the weight of the classification difficulty of positive samples. Similarly, pγ is utilized as the weight of the classification difficulty of negative samples, where γ is a tunable positive parameter.
In conclusion, we combine weight α, which controls the positive and negative samples, and weight p, which controls the classification difficulty of samples, into the cross entropy to obtain a novel confidence loss function. Then, the proposed confidence loss with dual control weights can be expressed as
L o s s o b j = i = 0 K 2 j = 0 M I i j o b j α ( 1 p ) γ [ C ¯ i j log ( C i j ) + ( 1 C ¯ i j ) log ( 1 C i j ) ] i = 0 K 2 j = 0 M I i j n o o b j ( 1 α ) p γ [ C ¯ i j log ( C i j ) + ( 1 C ¯ i j ) log ( 1 C i j ) ]
where C ¯ i j and C i j denote the confidence of the real target and the predicted target in the jth box of the ith grid, respectively.

2.5.3. Regression Loss

A good bounding box regression loss should consider the overlap area between the predicted box and the real box, as well as the center point distance and aspect ratio [43]. The common loss function, DIoU, only utilizes the overlap area and center point distance [44]. Compared with DIoU, CIoU increases the influence of the aspect ratio, which could better adapt to the features of ship targets. Therefore, CIoU is chosen to calculate the regression loss here. The CIoU is expressed as follows [45]
C I o U = I o U ρ 2 ( b , b g t ) c 2 a ν
I o U = | B B g t | | B B g t |
ν = 4 π 2 ( arctan w g t h g t arctan w h ) 2
a = ν ( 1 I o U ) + ν
where B is the predicted box and Bgt is the real box, v is utilized to indicate the similarity of aspect ratio, a denotes the weight coefficient, c represents the diagonal length of the minimum bounding box, b and bgt represent center coordinates of the predicted box and real box, and ρ denotes the Euclidean distance between the two centroids. w and h represent the width and height of the predicted box, while wgt and hgt are the width and height of the real box.
Then, the final regression loss function can be expressed by
L o s s C I o U = i = 0 K 2 j = 0 M I i j o b j ( 2 w g t × h g t ) [ 1 I o U + ρ 2 ( b , b g t ) c 2 + a ν ]
Therefore, the overall loss of the model is written as
L o s s = L o s s c l s + L o s s o b j + L o s s C I o U

3. Experiments

In this section, the performance of the proposed YOLO-Lite model is demonstrated through some experiments.

3.1. Datasets

Two datasets of SSDD [46] and an SAR ship dataset [47] are used to evaluate the detection performance of the proposed model.
The SSDD dataset is the first publicly available dataset in the field of SAR ship detection. It contains 1160 images derived from Sentinel-1, TerraSAR, and RadarSat-2, and there are 2456 ships labeled in the PASCAL VOC format. The dataset contains a variety of scenes. The images in the dataset have resolutions ranging from 1 m to 15 m. The ratio of the training set and test set is set to 8:2 according to the official version [46].
The SAR ship dataset was presented in 2019. It consists of 43,819 images, derived from the Sentinel-1 satellite and Gaofen-3 satellite. There are 59,535 ships in the dataset. The images in the dataset have resolutions ranging from 1.7 m to 25 m. The dataset scenes include offshore, nearshore, island, and port scenes. Due to hardware limitations, 10,000 images are randomly selected for the experiment. We randomly divide the training set, verification set, and test set, and set their ratio to 7:1:2.

3.2. Experimental Details

All experiments are performed on a personal computer with an Intel(R) Core (TM) i5-12600KF and an NVIDIA GeForce RTX 2060 12g graphics card. The batch size is set to 4, and the initial learning rate is set to 0.01. A total of 1000 epochs is set up for the SSDD dataset and 300 epochs for the SAR ship dataset. We use the stochastic gradient descent (SGD) optimizer with weight decay of 0.0005 and an optimizer momentum of 0.937. The threshold of NMS is set to 0.5.

3.3. Evaluation Criteria

To quantitatively evaluate the detection performance of the proposed model, precision (P), recall (R), mean average precision (mAP), and F-measure (F1) are selected as the evaluation metrics [48]. Furthermore, the number of parameters and frames per second (FPS) are also adopted to evaluate the detection efficiency of the model.
Precision (P) and recall (R) are calculated as follows:
P = N T P N T P + N F P
R = N T P N T P + N F N
where NTP and NFP denote the number of true positives and false positives and NFN stands for the number of false negatives.
For each target category presented in the dataset, a precision-recall curve can be drawn with recall and precision as horizontal and vertical coordinates. The area enclosed by the precision-recall curve is the average precision (AP). Each class j corresponds to an APj and their mean value is mAP. The AP and mAP are defined by
A P = 0 1 P ( R ) d R
m A P = 1 N j = 1 N A P j
where j represents the jth category and N denotes the total number of categories. Moreover, in order to calculate the AP and mAP, the IoU threshold should be set. When performing the SAR ship detection models in the paper, the IoU threshold is set to 0.5 for mAP.
F1 denotes the weighted harmonic average of precision and recall, which is calculated as follows:
F 1 = 2 × P × R P + R

3.4. Experiments on SSDD Dataset

Table 1 presents the detection performance comparison of our YOLO-Lite with the raw YOLOv5l on the SSDD dataset, and the relationship between the mAP and epoch is presented in Figure 7 for a more intuitive comparison. As can be seen from Table 1, compared with YOLOv5l, the proposed YOLO-Lite makes a 2.67% precision improvement of the model (from 93.61% to 96.28%), a 2.31% mAP improvement (from 92.05% to 94.36%), a 1.49% recall improvement (from 89.18% to 90.67%), and a 2.05% F1 improvement (from 91.34% to 93.39%). Furthermore, the proposed YOLO-Lite has great improvements in the number of model parameters and FPS, presenting a lightweight network architecture. The number of model parameters is decreased from 47.1 M to 7.64 M, and the FPS is increased from 62.9 to 103.5. The above results show that the proposed YOLO-Lite not only improves the ship detection accuracy but also improves the detection speed. This fully shows that YOLO-Lite exceeds the YOLO5l baseline in all metrics.
Figure 8 presents the heatmap visualization results of the proposed model on the SSDD dataset. The green boxes represent the ground truths, the yellow boxes indicate the false detections, and the red boxes indicate the missed detections. In order to better demonstrate the detection performance, four images with complex backgrounds are selected for comparison in the experiment. As can be seen from Figure 8, it is difficult for YOLOv5l to correctly detect the ships in the nearshore scenes, and there are many missed detections. Comparing Figure 8b,c, it can be clearly seen that YOLOv5l has three missed detections marked in the red boxes, while our proposed method has no missed detections. This is because the nearshore background is complex and the interference is serious, resulting in the performance degradation of YOLOv5l. Compared with YOLOv5l, the proposed YOLO-Lite has a stronger capture capability for small ships and densely overlapping ships. This is mainly because the CPEA module and multi-scale features enhancement module could highlight positive sample features while restraining the background interference. The EnSPP module expands the receptive field and extracts the significant context features of the feature map to improve the detection performance. At the same time, additional weights are introduced into the loss function of YOLO-Lite to overcome the imbalance between negative and positive samples. This operation could control the classification difficulty of samples and thus improve the detection accuracy.
To further verify the effectiveness of the proposed YOLO-Lite, we compared it with other excellent detection models, including YOLOv4 [49], YOLOX [50], YOLOv5s [37], YOLOv7 [51], SSD [24], RetinaNet [52], CenterNet [53], Quad-FPN [54], FEFPN [55], and FBR-Net [56]. Table 2 gives the performance comparison results. It can be seen that our model has the highest precision, 96.28%, which is 1.24% higher than the second highest precision model, the YOLOv7 algorithm. The F1 of our model is 93.39%, which is a little lower than the highest F1 model, FBR-Net. However, our precision is 3.49% higher than FBR-Net. The Quad-FPN has the higest mAP, but its precision and F1 are 6.76% and 0.85% lower than our model, respectively. Furthermore, the number of parameters of our model is 7.64M, which is a little larger than YOLOv5s. However, the FPS of our proposed model is 103.5, which is the highest among the compared algorithms. These results fully demonstrate the feasibility of our proposed method with excellent detection performance.

3.5. Experiments on the SAR Ship Dataset

The detection performance comparison of our YOLO-Lite with the raw YOLOv5l on the SAR ship dataset is given in Table 3, and the corresponding mAP-epoch curves are presented in Figure 9 for a more intuitive comparison. Compared with YOLOv5l, the proposed YOLO-Lite improves the precision, mAP, recall, and F1 by 2.65%, 1.59%, 2.55%, and 2.6%, respectively. Moreover, in the comparison of other evaluation metrics for model detection efficiency, the proposed YOLO-Lite has significantly fewer parameters and higher FPS. The comparison results have verified that the proposed YOLO-Lite can effectively improve ship detection accuracy and detection speed.
Figure 10 shows the heatmap visualization results of the proposed model on the SAR ship dataset. The green boxes represent the ground truths, the yellow boxes indicate the false detections, and the red boxes indicate the missed detections. We selected four different imaging scenes to evaluate the SAR ship detection performance. It can be seen from Figure 10 that YOLOv5l do not perform well. It is difficult for YOLOv5l to accurately identify ships in nearshore areas, which have a large number of missed detections (red boxes) and false detections (yellow boxes) in complex environments. However, the proposed YOLO-Lite can basically correctly detect SAR ships in different complex backgrounds. Although YOLO-Lite also has false detection in the nearshore area, the overall detection performance of YOLO-Lite is still much better than YOLOv5l, which verifies the effectiveness of the proposed model.
Table 4 presents the performance comparisons of the proposed YOLO-Lite with other excellent detection models on the SAR ship dataset. In Table 4, YOLOv4, YOLOX, YOLOv5s, YOLOv7, SSD, RetinaNet, CenterNet, Quad-FPN [54], SAR-ShipNet [6], and FIERNet [57] are selected for comparison. As shown in Table 4, the proposed YOLO-Lite achieves the highest performance in the metrics of precision and F1, with improvements of 0.01% and 1.61% compared to the highest performance of the comparison methods, respectively. The Quad-FPN has the highest mAP, but its FPS is relatively small, at 22.96. In addition, our YOLO-Lite has the second lowest number of parameters and the highest FPS. The number of parameters of the proposed YOLO-Lite is slightly larger than the smallest YOLOv5s method. However, from an overall performance perspective, the proposed model has significant advantages in SAR ship detection, meaning it could better locate the positions of ships.

4. Discussion

In this section, ablation experiments are conducted on the SSDD dataset to evaluate the advantage of each innovation in the proposed model.
We first analyze the overall effectiveness of the proposed modules. Table 5 presents the overall quantitative comparison results. We utilize the YOLOv5l as the baseline network. From Table 5, it can be clearly seen that with the accumulation of the modules, the precision of the proposed model increases from 93.61% to 96.28%, the mAP increases from 92.05% to 94.36%, the recall increases from 89.18% to 90.67%, and the F1 increases from 91.34% to 93.39%. The experimental results demonstrate the effectiveness of our overall network structure design.

4.1. Influence of the LFEBNet Backbone Network on the Experimental Results

In this ablation experiment, we replaced the backbone CSPDarknet53 in YOLOv5l with our lightweight backbone, LFEBNet, and kept other modules unchanged. Table 6 presents the experimental results. In Table 6, “—” indicates that the network does not contain the corresponding module, while “√” indicates that the network contains the corresponding module. As can be seen from Table 6, the proposed backbone LFEBNet improves the precision, mAP, and recall by 1.21%, 1.22%, and 0.65%, respectively. Furthermore, we can find that the proposed LFEBNet can reduce the number of model parameters from 47.1 M to 7.64 M. The FPS is increased from 62.9 to 102.8, which shows that the proposed backbone LFEBNet can provide a model with greatly reduced computation. The experimental results show that our designed LFEBNet not only improves the accuracy of SAR ship detection, but also decreases the model complexity, making the model more lightweight and more suitable for application.

4.2. Influence of EnSPP on the Experimental Results

To verify the effectiveness of EnSPP, we replaced the SPP module in YOLOv5l with our proposed EnSPP and kept other modules unchanged. Table 7 presents the ablation experiment results of the EnSPP module. From Table 7, we can see that adding the EnSPP into YOLOv5l offers 0.85% precision improvement (93.61% vs. 94.46%), 0.72% mAP improvement (92.05% vs. 92.79%), 0.47% recall improvement (89.18% vs. 89.65%), and 0.65% F1 improvement (91.34% vs. 91.99%). The experimental results imply that our EnSPP can address the position information loss of small SAR ships in high level features and effectively improve the accuracy of SAR ship detection.

4.3. Influence of MFFNet on the Experimental Results

To verify the effectiveness of our proposed MFFNet, we conducted ablation experiments with the original feature fusion network and the proposed MFFNet, respectively. Table 8 shows the ablation experiment results. As shown in Table 8, the improvements of precision and mAP are 1.97% and 2.16%, respectively. Note that the 1.28% improvement in recall and 1.61% improvement in F1 reveal that MFFNet can suppress more false samples and improve the missing detection problem of small targets in SAR ship detection. Moreover, to further confirm the performance of the proposed MFFNet, we also conducted experiments to compare the detection metrics of the proposed MFFNet and the classical feature fusion network, PANet. The comparison results are shown in Table 9. From Table 9, we can find that the proposed MFFNet has significant advantages over PANet and can achieve better detection performance.

4.4. Influence of Loss Function on the Experimental Results

Table 10 presents the influence of the proposed loss function on the experiment results. In the experiment, we replace the raw loss function in YOLOv5l with our proposed one and keep other modules unchanged. From Table 10 we can observe that the proposed loss function can improve the detection accuracy effectively, which offers 2.27% improvement in precision, 1.77% improvement in mAP, 1.06% improvement in recall, and 1.63% improvement in F1. The results confirm the superiority of the proposed loss function in improving the accuracy of SAR ship detection.

5. Conclusions

Aiming at the problem of inaccurate target location and complex background interference in SAR ship detection, an efficient lightweight network YOLO-Lite is proposed in this paper. It can better balance the accuracy and speed of SAR ship detection. Specifically, a lightweight feature enhancement backbone (LFEBNet) is designed to reduce the computational costs. Additionally, a CPEA module is constructed to help the backbone network obtain more accurate position information. An EnSPP module is designed to enhance the expression ability of features and address the position information loss of small SAR ships in high level features. Moreover, an effective MFFNet network is customized to overcome the multi-scale features of SAR ship targets. In addition, a novel confidence loss function is proposed to effectively improve the SAR ship target detection accuracy. The experimental results on the SSDD dataset show that the precision, mAP, and F1 of our YOLO-Lite reach 96.28%, 94.36%, and 93.39%, respectively. Meanwhile, the number of model parameters and FPS are 7.64 M and 103.5, respectively. With respect to the SAR ship dataset, our model is still stable, and the precision, mAP, and F1 are 94.86%, 92.13%, and 91.39%, respectively, which is superior to other detection methods. The quantitative and visualization results confirm the effectiveness of the proposed YOLO-Lite.

Author Contributions

Conceptualization, X.R. and G.L.; Data curation, Y.B. and P.Z.; Formal analysis, Y.B., G.L. and P.Z.; Funding acquisition, X.R. and G.L.; Investigation, X.R., Y.B. and P.Z.; Methodology, X.R. and G.L.; Project administration, X.R. and G.L.; Resources, X.R. and G.L.; Software, Y.B. and P.Z.; Validation, Y.B., G.L. and P.Z.; Writing—original draft, X.R. and Y.B.; Writing—review & editing, Y.B. and G.L. All authors have read and agreed to the published version of the manuscript.

Funding

This research was funded by the National Natural Science Foundation of China, grant number U1904120, Henan Science and Technology Department Science and Technology Research Program, grant number 182102310759, and the Fundamental Research Funds for the Henan Provincial Colleges and Universities, grant number 2018RCJH09.

Data Availability Statement

Not applicable.

Conflicts of Interest

The authors declare no conflict of interest.

References

  1. Xiong, G.; Wang, F.; Yu, W.D.; Truong, T.K. Spatial singularity-exponent-domain multiresolution imaging-based SAR ship target detection method. IEEE Trans. Geosci. Remote Sens. 2022, 60, 5215212. [Google Scholar] [CrossRef]
  2. Sun, G.C.; Liu, Y.; Xiang, J.; Liu, W.; Xing, M.; Chen, J. Spaceborne synthetic aperture radar imaging algorithms: An overview. IEEE Geosci. Remote Sens. Mag. 2022, 10, 161–184. [Google Scholar] [CrossRef]
  3. Liu, Q.; Liu, A.; Wang, Y.; Li, H. A super-resolution sparse aperture ISAR sensors imaging algorithm via the MUSIC technique. IEEE Trans. Geosci. Remote Sens. 2019, 57, 7119–7134. [Google Scholar] [CrossRef]
  4. Dong, Q.; Sun, G.C.; Yang, Z.; Guo, L.; Xing, M. Cartesian factorized backprojection algorithm for high-resolution spotlight SAR imaging. IEEE Sens. J. 2018, 18, 1160–1168. [Google Scholar] [CrossRef]
  5. Chen, S.; Zhan, R.; Wang, W.; Zhang, J. Learning slimming SAR ship object detector through network pruning and knowledge distillation. IEEE J. Sel. Top. Appl. Earth Obs. Remote Sens. 2020, 14, 1267–1282. [Google Scholar] [CrossRef]
  6. Deng, Y.; Guan, D.; Chen, Y.; Yuan, W.; Ji, J.; Wei, M. Sar-shipnet: SAR ship detection neural network via bidirectional coordinate attention and multi-resolution feature fusion. In Proceedings of the IEEE International Conference on Acoustics, Speech and Signal Processing (ICASSP), Singapore, 22–27 May 2022; pp. 3973–3977. [Google Scholar]
  7. Bao, W.; Huang, M.; Zhang, Y.; Xu, Y.; Liu, X.; Xiang, X. Boosting ship detection in SAR images with complementary pretraining techniques. IEEE J. Sel. Top. Appl. Earth Obs. Remote Sens. 2021, 14, 8941–8954. [Google Scholar] [CrossRef]
  8. Xu, F.; Liu, H.J. Ship detection and extraction using visual saliency and histogram of oriented gradient. Optoelectron. Lett. 2016, 12, 473–477. [Google Scholar] [CrossRef]
  9. Yang, S.; An, W.; Li, S.; Wei, G.; Zou, B. An improved FCOS method for ship detection in SAR images. IEEE J. Sel. Top. Appl. Earth Obs. Remote Sens. 2022, 15, 8910–8927. [Google Scholar] [CrossRef]
  10. Wang, Z.; Wang, R.; Ai, J.; Zou, H.; Li, J. Global and local context-aware ship detector for high-resolution SAR images. IEEE Trans. Aerosp. Electron. Syst. 2023. [Google Scholar] [CrossRef]
  11. Pappas, O.; Achim, A.; Bull, D. Superpixel-level CFAR detectors for ship detection in SAR imagery. IEEE Geosci. Remote Sens. Lett. 2018, 15, 1397–1401. [Google Scholar] [CrossRef] [Green Version]
  12. Nie, X.; Duan, M.; Ding, H.; Hu, B.; Wong, E.-K. Attention mask R-CNN for ship detection and segmentation from remote sensing images. IEEE Access 2020, 8, 9325–9334. [Google Scholar] [CrossRef]
  13. Ke, X.; Zhang, X.; Zhang, T.; Shi, J.; Wei, S. SAR ship detection based on an improved Faster R-CNN using deformable convolution. In Proceedings of the 2021 IEEE International Geoscience and Remote Sensing Symposium, Brussels, Belgium, 11–16 July 2021; pp. 3565–3568. [Google Scholar]
  14. You, Y.; Li, Z.; Ran, B.; Cao, J.; Lv, S.; Liu, F. Broad area target search system for ship detection via deep convolutional neural network. Remote Sens. 2019, 11, 1965. [Google Scholar] [CrossRef] [Green Version]
  15. Lv, Z.; Lu, J.; Wang, Q.; Guo, Z.; Li, N. ESP-LRSMD: A two-step detector for ship detection using SLC SAR imagery. IEEE Trans. Geosci. Remote Sens. 2022, 60, 5233516. [Google Scholar] [CrossRef]
  16. Li, Y.; Huang, Q.; Pei, X.; Jiao, L.; Shang, R. RADet: Refine feature pyramid network and multi-layer attention network for arbitrary-oriented object detection of remote sensing images. Remote Sens. 2020, 12, 389. [Google Scholar] [CrossRef] [Green Version]
  17. Li, D.; Liang, Q.; Liu, H.; Liu, Q.; Liao, G. A novel multidimensional domain deep learning network for SAR ship detection. IEEE Trans. Geosci. Remote Sens. 2021, 60, 5203213. [Google Scholar] [CrossRef]
  18. Hu, J.; Shen, L.; Albanie, S.; Sun, G.; Wu, E. Squeeze-and-excitation networks. IEEE Trans. Pattern Anal. Mach. Intell. 2020, 42, 2011–2023. [Google Scholar] [CrossRef] [Green Version]
  19. Zhao, Y.; Zhao, L.; Xiong, B.; Kuang, G. Attention Receptive Pyramid Network for Ship Detection in SAR Images. IEEE J. Sel. Top. Appl. Earth Obs. Remote Sens. 2020, 13, 2738–2756. [Google Scholar] [CrossRef]
  20. Woo, S.; Park, J.; Lee, J.-Y.; Kweon, I.-S. CBAM: Convolutional block attention module. In Proceedings of the European Conference on Computer Vision (ECCV), Munich, Germany, 8–14 September 2018. [Google Scholar]
  21. Zha, M.; Qian, W.; Yang, W.; Xu, Y. Multi-feature transformation and fusion-based ship detection with small targets and complex backgrounds. IEEE Geosci. Remote Sens. Lett. 2022, 19, 4511405. [Google Scholar] [CrossRef]
  22. Li, X.; Li, D.; Liu, H.; Wan, J.; Chen, Z.; Liu, Q. A-BFPN: An attention-guided balanced feature pyramid network for SAR ship detection. Remote Sens. 2022, 14, 3829. [Google Scholar] [CrossRef]
  23. Zhang, L.; Liu, Y.; Huang, Y.; Qu, L. Regional prediction-aware network with cross-scale self-attention for ship detection in SAR images. IEEE Geosci. Remote Sens. Lett. 2022, 19, 4514605. [Google Scholar] [CrossRef]
  24. Liu, W.; Anguelov, D.; Erhan, D.; Szegedy, C.; Reed, S.; Fu, C.Y.; Berg, A.C. SSD: Single shot multibox detector. In Proceedings of the European Conference on Computer Vision, Amsterdam, The Netherlands, 11–14 October 2016; Springer International Publishing: Cham, Switzerland, 2016; pp. 21–37. [Google Scholar]
  25. Miao, T.; Zeng, H.; Wang, H.; Yang, W. Inshore ship ddetection in SAR images via an improved SSD model with wavelet decomposition. In Proceedings of the 2021 7th Asia-Pacific Conference on Synthetic Aperture Radar (APSAR), Bali, Indonesia, 1–5 November 2021; pp. 1–5. [Google Scholar]
  26. Zhou, L.; Yu, H.; Wang, Y.; Xu, S.; Gong, S.; Xing, M. LASDNet: A lightweight anchor-free ship detection network for SAR images. In Proceedings of the IEEE International Geoscience and Remote Sensing Symposium, Kuala Lumpur, Malaysia, 17–22 July 2022; pp. 2630–2633. [Google Scholar]
  27. Miao, T.; Zeng, H.; Yang, W.; Chu, B.; Zou, F.; Ren, W.; Chen, J. An improved lightweight RetinaNet for ship detection in SAR images. IEEE J. Sel. Top. Appl. Earth Obs. Remote Sens. 2022, 15, 4667–4679. [Google Scholar] [CrossRef]
  28. Guo, Y.; Chen, S.; Zhan, R.; Wang, W.; Zhang, J. SAR ship detection based on YOLOv5 using CBAM and BiFPN. In Proceedings of the IEEE International Geoscience and Remote Sensing Symposium, Kuala Lumpur, Malaysia, 17–22 July 2022; pp. 2147–2150. [Google Scholar]
  29. Zhang, T.; Zhang, X.-L. ShipDeNet-20: An only 20 convolution layers and <1-MB lightweight SAR ship detector. IEEE Geosci. Remote Sens. Lett. 2021, 18, 1234–1238. [Google Scholar]
  30. Zhao, S.; Liu, Q.; Yu, W.; Lv, J. A single-stage arbitrary-oriented detector based on multiscale feature fusion and calibration for SAR ship detection. IEEE J. Sel. Top. Appl. Earth Obs. Remote Sens. 2022, 15, 8179–8198. [Google Scholar] [CrossRef]
  31. Chang, Y.-L.; Anagaw, A.; Chang, L.; Wang, Y.-C.; Hsiao, C.-Y.; Lee, W.-H. Ship detection based on YOLOv2 for SAR imagery. Remote Sens. 2019, 11, 786. [Google Scholar] [CrossRef] [Green Version]
  32. Chen, L.; Shi, W.; Deng, D. Improved YOLOv3 based on attention mechanism for fast and accurate ship detection in optical remote sensing images. Remote Sens. 2021, 13, 660. [Google Scholar] [CrossRef]
  33. Sun, Z.; Leng, X.; Lei, Y.; Xiong, B.; Ji, K.; Kuang, G. BiFA-YOLO: A novel YOLO-based method for arbitrary-oriented ship detection in high-resolution SAR images. Remote Sens. 2021, 13, 4209. [Google Scholar] [CrossRef]
  34. Guo, Q.; Liu, J.; Kaliuzhnyi, M. YOLOX-SAR: High-precision object detection system based on visible and infrared sensors for SAR remote sensing. IEEE Sens. J. 2022, 22, 17243–17253. [Google Scholar] [CrossRef]
  35. Van Etten, A. You only look twice: Rapid multi-scale object detection in satellite imagery. In Proceedings of the Computer Vision and Pattern Recognition, Salt Lake City, UT, USA, 18–22 June 2018. [Google Scholar]
  36. Nina, W.; Condori, W.; Machaca, V.; Villegas, J.; Castro, E. Small ship detection on optical satellite imagery with YOLO and YOLT. In Proceedings of the Future of Information and Communication Conference, San Francisco, CA, USA, 5–6 March 2020. [Google Scholar]
  37. Ultralytics. YOLOv5. Available online: https://github.com/ultralytics/yolov5 (accessed on 8 October 2022).
  38. Hosang, J.; Benenson, R.; Schiele, B. Learning non-maximum suppression. arXiv 2017, arXiv:1705.02950. [Google Scholar]
  39. Howard, A.; Sandler, M.; Chu, G.; Chen, L.; Chen, B.; Tan, M.; Wang, W.; Zhu, Y.; Pang, R.; Vasudevan, V.; et al. Searching for MobileNetV3. In Proceedings of the IEEE/CVF International Conference on Computer Vision (ICCV), Seoul, Korea, 27 October–2 November 2019; pp. 314–1324. [Google Scholar]
  40. Andrew, G.; Zhu, M.L.; Chen, B.; Kalenichenko, D.; Wang, W.J.; Weyand, T.; Andreetto, M.; Adam, H. MobileNets: Efficient convolutional neural networks for mobile vision applications. arXiv 2017, arXiv:1704.04861. [Google Scholar]
  41. He, K.; Zhang, X.; Ren, S.; Sun, J. Spatial pyramid pooling in deep convolutional networks for visual recognition. IEEE Trans. Pattern Anal. Mach. Intell. 2015, 37, 1904–1916. [Google Scholar] [CrossRef] [Green Version]
  42. Mei, Y.; Fan, Y.; Zhang, Y.; Yu, J.; Zhou, Y.; Liu, D.; Fu, Y.; Huang, T.; Shi, H. Pyramid attention networks for image restoration. arXiv 2020, arXiv:2004.13824. [Google Scholar]
  43. Shen, Y.; Zhang, F.; Liu, D.; Pu, W.; Zhang, Q. Manhattan-distance IOU loss for fast and accurate bounding box regression and object detection. Neurocomputing 2022, 500, 99–114. [Google Scholar] [CrossRef]
  44. Rezatofighi, H.; Tsoi, N.; Gwak, J.; Sadeghian, A.; Reid, I.; Savarese, S. Generalized intersection over union: A metric and a loss for bounding box regression. In Proceedings of the 2019 IEEE/CVF Conference on Computer Vision and Pattern Recognition (CVPR), Los Angeles, CA, USA, 15–20 June 2019. [Google Scholar]
  45. Zhou, L.-M.; Li, Y.H.; Rao, X.H.; Liu, C.; Zuo, X.Y.; Liu, Y. Ship target detection in optical remote sensing images based on multiscale feature enhancement. Comput. Intell. Neurosci. 2022, 2022, 2605140. [Google Scholar] [CrossRef]
  46. Zhang, T.; Zhang, X.; Li, J.; Xu, X.; Wang, B.; Zhan, X.; Xu, Y.; Ke, X.; Zeng, T.; Su, H.; et al. SAR ship detection dataset (SSDD): Official release and comprehensive data analysis. Remote Sens. 2021, 13, 3690. [Google Scholar] [CrossRef]
  47. Wang, Y.; Wang, C.; Zhang, H.; Dong, Y.; Wei, S. A SAR dataset of ship detection for deep learning under complex backgrounds. Remote Sens. 2019, 11, 65. [Google Scholar] [CrossRef] [Green Version]
  48. Everingham, M.; Van Gool, L.; Williams, C.K.; Winn, J.; Zisserman, A. The pascal visual object classes (voc) challenge. Int. J. Comput. Vis. 2010, 88, 303–338. [Google Scholar] [CrossRef] [Green Version]
  49. Bochkovskiy, A.; Wang, C.Y.; Mark Liao, H.Y. YOLOv4: Optimal speed and accuracy of object detection. arXiv 2020, arXiv:2004.10934. [Google Scholar]
  50. Ge, Z.; Liu, S.T.; Wang, F.; Li, Z.; Sun, J. YOLOX: Exceeding YOLO Series in 2021. In Proceedings of the Computer Vision and Pattern Recognition, Nashville, TN, USA, 20–25 June 2021. [Google Scholar]
  51. Wang, C.-Y.; Bochkovskiy, A.; Liao, H.-Y. YOLOv7: Trainable bag-of-freebies sets new state-of-the-art for real-time object detectors. arXiv 2022, arXiv:2207.02696. [Google Scholar]
  52. Lin, T.Y.; Goyal, P.; Girshick, R.; He, K.; Dollár, P. Focal loss for dense object detection. In Proceedings of the IEEE International Conference on Computer Vision, Venice, Italy, 22–29 October 2017; pp. 2980–2988. [Google Scholar]
  53. Duan, K.; Bai, S.; Xie, L.; Qi, H.; Huang, Q.; Tian, Q. Centernet: Keypoint triplets for object detection. In Proceedings of the IEEE/CVF International Conference on Computer Vision, Seoul, Republic of Korea, 27 October–2 November 2019; pp. 6569–6578. [Google Scholar]
  54. Zhang, T.; Zhang, X.; Ke, X. Quad-FPN: A novel quad feature pyramid network for SAR ship detection. Remote Sens. 2021, 13, 2771. [Google Scholar] [CrossRef]
  55. Ke, X.; Zhang, X.; Zhang, T.; Shi, J.; Wei, S. Sar ship detection based on swin transformer and feature enhancement feature pyramid network. In Proceedings of the 2022 IEEE International Geoscience and Remote Sensing Symposium, Kuala Lumpur, Malaysia, 17–22 July 2022; pp. 2163–2166. [Google Scholar]
  56. Fu, J.; Sun, X.; Wang, Z.; Fu, K. An anchor-free method based on feature balancing and refinement network for multiscale ship detection in SAR images. IEEE Trans. Geosci. Remote Sens. 2021, 59, 1331–1344. [Google Scholar] [CrossRef]
  57. Yu, J.; Wu, T.; Zhou, S.; Pan, H.; Zhang, X.; Zhang, W. An sAR ship object detection algorithm based on feature information efficient representation network. Remote Sens. 2022, 14, 3489. [Google Scholar] [CrossRef]
Figure 1. Overall network structure of YOLO-Lite.
Remotesensing 15 03771 g001
Figure 2. The LFEBNet structure.
Remotesensing 15 03771 g002
Figure 3. The structure of the LFEM module.
Remotesensing 15 03771 g003
Figure 4. The structure of depthwise separable convolution.
Remotesensing 15 03771 g004
Figure 5. The structures of SPP and EnSPP: (a) the structure of SPP and (b) the structure of EnSPP.
Remotesensing 15 03771 g005
Figure 6. The structure of MFFNet module.
Remotesensing 15 03771 g006
Figure 7. The relationship between the mAP and epoch on the SSDD dataset.
Remotesensing 15 03771 g007
Figure 8. SAR ship detection results on the SSDD dataset: (a) ground truth, (b) detection results of YOLOv5l, (c) detection results of YOLO-Lite.
Remotesensing 15 03771 g008
Figure 9. The relationship between the mAP and epoch on the SAR ship dataset.
Remotesensing 15 03771 g009
Figure 10. SAR ship detection results on the SAR ship dataset: (a) ground truth, (b) detection results of YOLOv5l, (c) detection results of YOLO-Lite.
Remotesensing 15 03771 g010
Table 1. The performance comparison with raw YOLOv5l on the SSDD dataset.
MethodP (%)mAP (%)R (%)F1 (%)Params (M)FPS
YOLOv5l93.6192.0589.1891.3447.162.9
YOLO-Lite96.2894.3690.6793.397.64103.5
Table 2. Comparison of the performance metrics of different models based on SSDD.
MethodBackboneP (%)mAP (%)F1 (%)Params (M)FPS
YOLOv4Darknet5392.7890.5687.0264.425.5
YOLOXCSPDarknet5390.8186.3288.699.9018.3
YOLOv5sCSPDarknet5389.5787.2185.537.2898.8
YOLOv7ELANCSP95.0492.7391.5339.251.6
SSDVGG-1691.0787.1487.3623.842.7
RetinaNetResNet-5093.3492.1390.2937.723.8
CenterNetResNet-5092.5290.8691.6134.645.3
Quad-FPN *ResNet-5089.5295.2992.54-11.37
FEFPN *Swin-T-93.08---
FBR-Net *ResNet-5092.79-93.4032.5-
OursLFEBNet96.2894.3693.397.64103.5
Note: Since the source codes of some references are unavailable, the performance metrics of these detection models with * are derived from these references.
Table 3. The performance comparison with raw YOLOv5l on the SAR ship dataset.
MethodP (%)mAP (%)R (%)F1 (%)Params (M)FPS
YOLOv5l92.2190.5485.6288.7947.163.4
YOLO-Lite94.8692.1388.1791.397.64103.8
Table 4. Comparison of the performance metrics of different models based on the SAR ship dataset.
MethodBackboneP (%)mAP (%)F1 (%)Params (M)FPS
YOLOv4Darknet5391.8089.2387.0864.425.9
YOLOXCSPDarknet5390.1585.4384.069.9018.4
YOLOv5sCSPDarknet5388.0485.6184.367.2898.9
YOLOv7ELANCSP93.1691.2589.7839.251.8
SSDVGG-1691.4684.6285.5423.843.2
RetinaNetResNet-5092.5288.3787.6237.723.9
CenterNetResNet-5090.6189.0888.4934.645.7
Quad-FPN *ResNet-5077.5594.3985.83-22.96
SAR-ShipNet *ResNet-5094.85 81.0013482
FIERNet *CTFENet-92.0187.00--
OursLFEBNet94.8692.1391.397.64103.8
Note: Since the source codes of some references are unavailable, the performance metrics of these detection models with * are derived from these references.
Table 5. Overall effectiveness of the modules.
LFEBNetEnSPPMFFNetLoss FuncP (%)mAP (%)R (%)F1 (%)
93.6192.0589.1891.34
94.8293.2789.8392.26
95.1493.4289.7892.38
95.8794.1190.3693.03
96.2894.3690.6793.39
Table 6. The ablation experiment results of LFEBNet.
LFEBNetP (%)mAP (%)R (%)F1 (%)Params (M)FPS
93.6192.0589.1891.3447.162.9
94.8293.2789.8392.267.64102.8
Table 7. The ablation experiment results of EnSPP.
EnSPPP (%)mAP (%)R (%)F1 (%)Params (M)FPS
93.6192.0589.1891.3447.162.9
94.4692.7989.6591.9947.164.7
Table 8. The ablation experiment results of MFFNet.
MFFNetP (%)mAP (%)R (%)F1 (%)Params (M)FPS
93.6192.0589.1891.3447.162.9
95.5894.2190.4692.9547.162.6
Table 9. The performance comparison of PANet and MFFNet.
ModuleP (%)mAP (%)R (%)F1 (%)Params (M)FPS
PANet94.7193.3889.5292.0447.162.9
MFFNet95.5894.2190.4692.9547.162.6
Table 10. The ablation experiment results for loss function.
Loss FuncP (%)mAP (%)R (%)F1 (%)Params (M)FPS
93.6192.0589.1891.3447.162.9
95.8893.8290.2492.9747.163.3
Disclaimer/Publisher’s Note: The statements, opinions and data contained in all publications are solely those of the individual author(s) and contributor(s) and not of MDPI and/or the editor(s). MDPI and/or the editor(s) disclaim responsibility for any injury to people or property resulting from any ideas, methods, instructions or products referred to in the content.

