Article

The Influence of Soil Salt Stress on Modified Photochemical Reflectance Indices in Pea Plants

Department of Biophysics, N.I. Lobachevsky State University of Nizhny Novgorod, 603950 Nizhny Novgorod, Russia
*
Author to whom correspondence should be addressed.
Remote Sens. 2023, 15(15), 3772; https://doi.org/10.3390/rs15153772
Submission received: 26 May 2023 / Revised: 17 July 2023 / Accepted: 27 July 2023 / Published: 29 July 2023
(This article belongs to the Section Remote Sensing in Agriculture and Vegetation)

Abstract

:
Salinization is a significant adverse factor that suppresses productivity of agricultural plants. Multispectral imaging and calculation of reflectance indices, including the typical photochemical reflectance index (PRI), can be used for early revealing of changes in plants under salinization. However, the direction of change in typical PRI is dependent on the type of stressor and the experimental conditions. Earlier, we proposed modified PRIs with shifted measuring wavelengths and analyzed their changes under excess light, water deficit, and heating. In the current work, we investigated the sensitivity of these indices to changes in pea plants under salinization (100, 200, and 400 mM NaCl treatment). It was shown that short-wavelength PRIs were increased under this treatment; in contrast, long-wavelength PRIs were decreased. Most of the modified PRIs were strongly related to the maximal yield of photosystem II and the normalized difference vegetation index. Long-wavelength PRIs were more sensitive to plant changes than short-wavelength PRIs, typical PRI, and the normalized difference vegetation index because their stable decrease under moderate salinization (the 200 mM NaCl treatment) was initiated earlier. Our results show that long-wavelength PRIs, which also decreased under the action of the excess light, water deficit, and heating, can be potentially used as a universal tool for early revealing of stress changes in plants.

Graphical Abstract

1. Introduction

Salinization is an important problem of plant cultivation under open ground conditions, which limits using agricultural grounds. It is known that irrigation and disturbance of drainage caused by human activity lead to an increase in salt concentration in soil [1]. Global climate change intensifying evaporation additionally stimulates soil salinization [1,2,3]. High salinity negatively influences plant growth, decreasing the weight of plant shoots [4,5]. The growth of roots can often be suppressed by salinization [4,6,7]; however, a stimulation of this growth to compensate for the water deficit has also been observed [8,9,10].
Growth suppression can be particularly caused by photosynthesis inhibition and decreasing plant productivity. It is known that salinization decreases photosynthetic activity through suppression of the activity of the electron transport chain and the Calvin cycle [11,12], decreasing the content of chlorophylls and carotenoids [4,12,13], disruption of the synthesis of proteins of reaction centers [11,12], decreasing the density and conductance of stomata [5,14], etc. In addition, salinization induces oxidative stress [4,15] which causes photosynthetic damage and suppresses productivity. As a result, the development of methods of early and high-throughput revealing of salinization-induced changes in plants, including photosynthetic damage, is an important agricultural problem.
Optical methods of remote sensing can be used for high-throughput monitoring of responses of plants to negative factors in the environment [16,17], including the action of high salinity. A multispectral imaging based on measurements of light reflectance within narrow spectral bands is a widely used method of plant remote sensing and early detection of the influence of stressors [18,19]. Using reflectance indices, which are mostly calculated on the basis of reflectance at two or three wavelengths and related to specific plant parameters, strongly simplifies interpretation of the results of multispectral imaging [17,20]. It is known that reflectance indices can be used for the estimation of the leaf area index (LAI) and other parameters of plant growth [21,22], photosynthetic activity [23,24,25], conductivity of stomata [26,27], pigment content [28,29,30], development of water and azote stresses [23,26,31,32], etc.
A typical photochemical reflectance index (PRI(531, 570)) calculated on the basis of reflectance at 531 and 570 nm was proposed by Gamon et al. [31,33]. In accordance with the classical hypothesis, stressors induce a fast negative shift of PRI(531, 570), which is related to changes in the absorbance of light at 531 nm through the de-epoxidation of violaxanthin to zeaxanthin in the xanthophyll cycle [28,31]. Changes in a wavelength of 570 nm are weak; therefore, it is used as a reference wavelength [31]. It is known that changes in the xanthophyll cycle regulate pH-dependent nonphotochemical quenching of the fluorescence of chlorophyll a, which is an important protective mechanism of the photosynthetic apparatus [34], i.e., changes in PRI(531, 570) should show photosynthetic stress changes. In addition, fast changes in PRI(531, 570) can also be related to pH-dependent chloroplast shrinkage [33,35,36,37]; this means that PRI(531, 570) can additionally show changes in pH-dependent nonphotochemical quenching because these changes can also be activated by acidification of the chloroplast lumen without changes in the xanthophyll cycle [34].
It has been shown that salinization can induce changes in PRI(531, 570) [38,39]. In particular, PRI(531, 570) is sensitive to the content of chlorides in plant tissues [40,41] and correlated to the quantum yield of photosystem II [14,40], stomatal conductance, and transpiration [38] under salinization. Thus, PRI(531, 570) can potentially be used for detection of the influence of high salinity on plants.
However, there are works that show that changes in PRI(531, 570) induced by the action of stressors can have both positive and negative directions under different experimental conditions [37,38], e.g., a short-term water shortage increases the photochemical reflectance index (PRI) but long-term soil drought decreases this index [42]. This variability of the direction of PRI(531, 570) changes obstructs the application and interpretation of this index and requires further development of methods of plant remote sensing on the basis of the photochemical reflectance index. In particular, the variability can be the reason for the relatively low relations of the typical PRI to photosynthetic parameters, which has been shown in some meta-analyses [43,44].
Gamon et al. [33] proposed that shifts in reflectance with a maximum of 545 nm are related to pH-induced changes in chloroplast conformation and that shifts in reflectance with a maximum of 526 nm are caused by pH-dependent activation of the xanthophyll cycle; both processes contribute to changes in PRI(531, 570). Thus, changes in the measuring wavelength can improve or disrupt the sensitivity of the photochemical reflectance index to the action of stressors and its relations to photosynthetic processes. Based on this hypothesis, we previously investigated modified PRIs that used 515 and 525 nm wavelengths (short-wavelength indices) or 535, 545, and 555 nm wavelengths (long-wavelength indices) as the measuring wavelengths [42,45]; a reflectance of 570 nm was used as the reference reflectance. We showed that changes in long-wavelength photochemical reflectance indices, which mainly include fast-relaxing components of change, are more strongly related to photosynthetic parameters than short-wavelength indices, which mainly include slow-relaxing components [45]. Considering the high rate of change caused by the pH-induced chloroplast shrinkage in comparison to the relatively slow rate of change in the xanthophyll cycle [35], we hypothesized different mechanisms of change in short- and long-wavelength photochemical reflectance indices [45]. The direction of change in short-wavelength photochemical reflectance indices was dependent on the type of stressors (decreasing under excess light [45] and increasing under drought and heating [42]); in contrast, all investigated stressors (excess light, water deficit, and heating) induced a negative shift in long-wavelength photochemical reflectance indices. Thus, our previous results show that long-wavelength PRIs are potentially more effective for revealing the action of different stressors on plants.
However, these results were shown for excess light, drought, and heating; other stressors were not investigated. The aim of the current work was the analysis of the sensitivity of modified photochemical reflectance indices to the action of salinization, which is a significant stressor for agriculture plants. This analysis included an investigation of the changes in these indices under NaCl treatment, studies of the dependence of direction and the magnitude of these changes on the measuring wavelength, and an estimation of the relation between the values of the modified photochemical reflectance indices and the damage to the photosynthetic machinery under salt stress. Typical PRI(531, 570) was also investigated to compare with modified indices.

2. Materials and Methods

2.1. Plant Cultivation and Induction of Salt Stress

Experiments were performed with 2–4-week-old pea seedlings (Pisum sativum L., variety “Albumen”). Plants were cultivated under open ground conditions and natural illumination (July, Nizhny Novgorod). The photoperiod was about 18 h; average day and night temperatures were about 25 and 16 °C, respectively. Uncontrollable watering by rain was prevented.
Pea was planted in pots with a standard soil; each pot contained 9 plants. Experimental pots were placed in 8 pallets (Figure 1); 2 pallets were used for each variant of treatment, including irrigation by 100, 200, and 400 mM NaCl solutions and by water (control). Each pallet contained 15 pots; distances between neighboring pots were no more than a few cm.
The control group was irrigated by water every two days. Salt stress was induced by irrigation with 50 mL of NaCl solution with a concentration of 100, 200, or 400 mM every 2 days (in accordance with [46]). The water or NaCl solution was homogeneously sprayed over the surface of soil in the pot. This treatment caused a gradually increasing concentration of NaCl in the soil. Using three variants of NaCl concentrations provided different rates of soil salinization; considering equal volumes of NaCl solutions, which were added at each irrigation, we assumed that the increasing NaCl concentration was approximately linear for each variant of the salt treatment. The total duration of the salt treatment was 17 days. The duration of the measurements of reflectance and photosynthetic parameters was mainly 17 days (every 2 days); however, the duration was 11 days for plants cultivated under 400 mM NaCl solution because these plants were strongly damaged after that point.

2.2. Measurements of Fresh Wight, Dry Weight, and Relative Plant Water Content in Plants

Fresh weight (FW), dry weight (DW), and relative water content in plants were measured after termination of the experiment (17 days). Plants were dried in a TV-20-PZ-K thermostat (Kasimov Instrument Plant, Kasimov, Russia) for 2 h at 100 °C. The fresh and dry weights of the plants were measured using analytical scales. The relative water contents in the plants were calculated as the water content (FW-DW) normalized on FW [47,48] and on DW [49].

2.3. Measurements of Maximal Quantum Yield of Photosystem II

The fluorescence parameters of photosystem II (dark fluorescence yield, F0, and maximal fluorescence yield, Fm) were measured in the leaves every two days using a PAM-fluorometer FluorPen (PAR-FluorPen FP 110-LM/D, Photon Systems Instruments, Drásov, Czech Republic). These fluorescence parameters were measured in control and experimental plants under conditions with low light intensity. The intensity of the saturation pulses was 2400 µmol m−2 s−1; the intensity of the measuring pulses was 0.027 m−2 s−1. The maximal quantum yield of photosystem II (Fv/Fm) was calculated in accordance with Equation (1) [50,51]:
Fv / Fm = Fm F 0 Fm ,  

2.4. Measurements of Reflectance and Calculation of Reflectance Indices

The reflectance of the plant canopy was measured using a hyperspectral camera Specim IQ (400–1000 nm spectral range, 204 spectral bands, 3 nm sampling interval, 0.2 megapixels matrix; Specim, Spectral Imaging Ltd., Oulu, Finland) every 2 days during the experiment. The pallets with the treated plants and the pallets with the control plants were placed close to each other and simultaneously measured (Figure S1a). Each control pallet was used in three different hyperspectral images (with the plants treated with the 100, 200, or 400 mM NaCl solution).
Measurements were performed under open ground conditions at a 45° angle to the ground plane; the distance between the canopy and the camera was about 1.5 m. The white reference panel for the hyperspectral camera Specim IQ (Specim, Spectral Imaging Ltd., Oulu, Finland) was used as the reflectance standard for the calibration of each measurement (Figure S1a). Figure S1b shows typical reflectance spectrum in the control plants.
Hyperspectral images were analyzed on the basis of earlier developed programs (Python coding language, Spectral and Numpy libraries) in accordance with our previous work [52]. First, the spatial distributions of the reflectance indices (the typical and modified photochemical reflectance indices and the normalized difference vegetation index (NDVI), see below) were calculated. Second, the images of the reflectance indices were masked to exclude the background on the basis of reflectance at 543 and 661 nm. Third, the images, which included control and experimental plants, were divided into 10 ROIs for the experimental pallet and 10 ROIs for the control pallet. The values of the indices in each ROI were averaged. These average indices were used in further analysis.
In accordance with our previous work [42], the typical and modified photochemical reflectance indices were calculated as:
PRI λ ,   570 = R λ R 570 R λ + R 570 ,  
where Rλ is the reflectance at λ = 505, 510, 515, 525, 535, 545, and 555 nm for the modified PRIs and at λ = 531 nm for the typical photochemical reflectance index; and R570 is the reflectance at 570 nm.
The values of the changes in the photochemical reflectance indices, which were induced by action of salinization (ΔPRI(λ, 570)), were calculated as:
Δ PRI λ ,   570 = PRI λ ,   570 salt PRI λ ,   570 control ,
where PRI(λ, 570)salt and PRI(λ, 570)control are the values of the reflectance indices in plants under salinization and control plants, respectively; and λ = 505, 515, 525, 531, 535, 545, and 555 nm.
We also investigated the normalized difference vegetation index (NDVI), which is a widely used indicator for plant remote sensing and can show the total content of chlorophylls in leaves [17]. It was calculated as [53]:
NDVI = R 780 R 670 R 780 + R 670 ,
where R780 and R670 are the reflectance in the NIR (780 nm) and the red (670 nm) spectral region, respectively.
Additionally, we calculated the percentage of change for the typical and modified photochemical reflectance indices and the NDVI on the last day of the investigation of the influence of salinity on reflectance in plants:
RI salt RI control | RI control | · 100 %
where RIcontrol and RIsalt are the reflectance index in control plants and plants under salinity on the last day of the investigation of the influence of salinity, respectively.

2.5. Statistics

The significance of the differences between experimental and control plants was estimated on the basis of Student’s t-test. The relationship between plant parameters was calculated using the coefficient of correlation (R) and regression (R2). The number of repetitions is shown in the figures.

3. Results

3.1. Changes in Fresh and Dry Weights and Relative Water Content in Plants under Salinization

The fresh and dry weights of the shoots and roots of pea were measured after the termination of the experiment (17 days of the NaCl treatment). It was shown that the growth of shoots was suppressed under salinization; particularly, FW and DW were significantly decreased in plants that were treated by 200 and 400 mM NaCl solutions (Table 1). The FW of roots was not significantly changed. In contrast, the DW of roots was increased in comparison to the DW in control plants. The ratios of FW and DW in shoots to similar values in roots were significantly decreased under the NaCl treatment. The relative water content in plants was not significantly changed regardless of the method of normalization (Table 1).
Thus, morphometric measurements showed that using variants of the NaCl treatment negatively influenced the growth processes in pea; however, a water deficit was not induced under these experimental conditions. This means that these variants could be used for further investigation.

3.2. Changes in Fv/Fm and Modified Photochemical Reflectance Indices under the NaCl Treatment

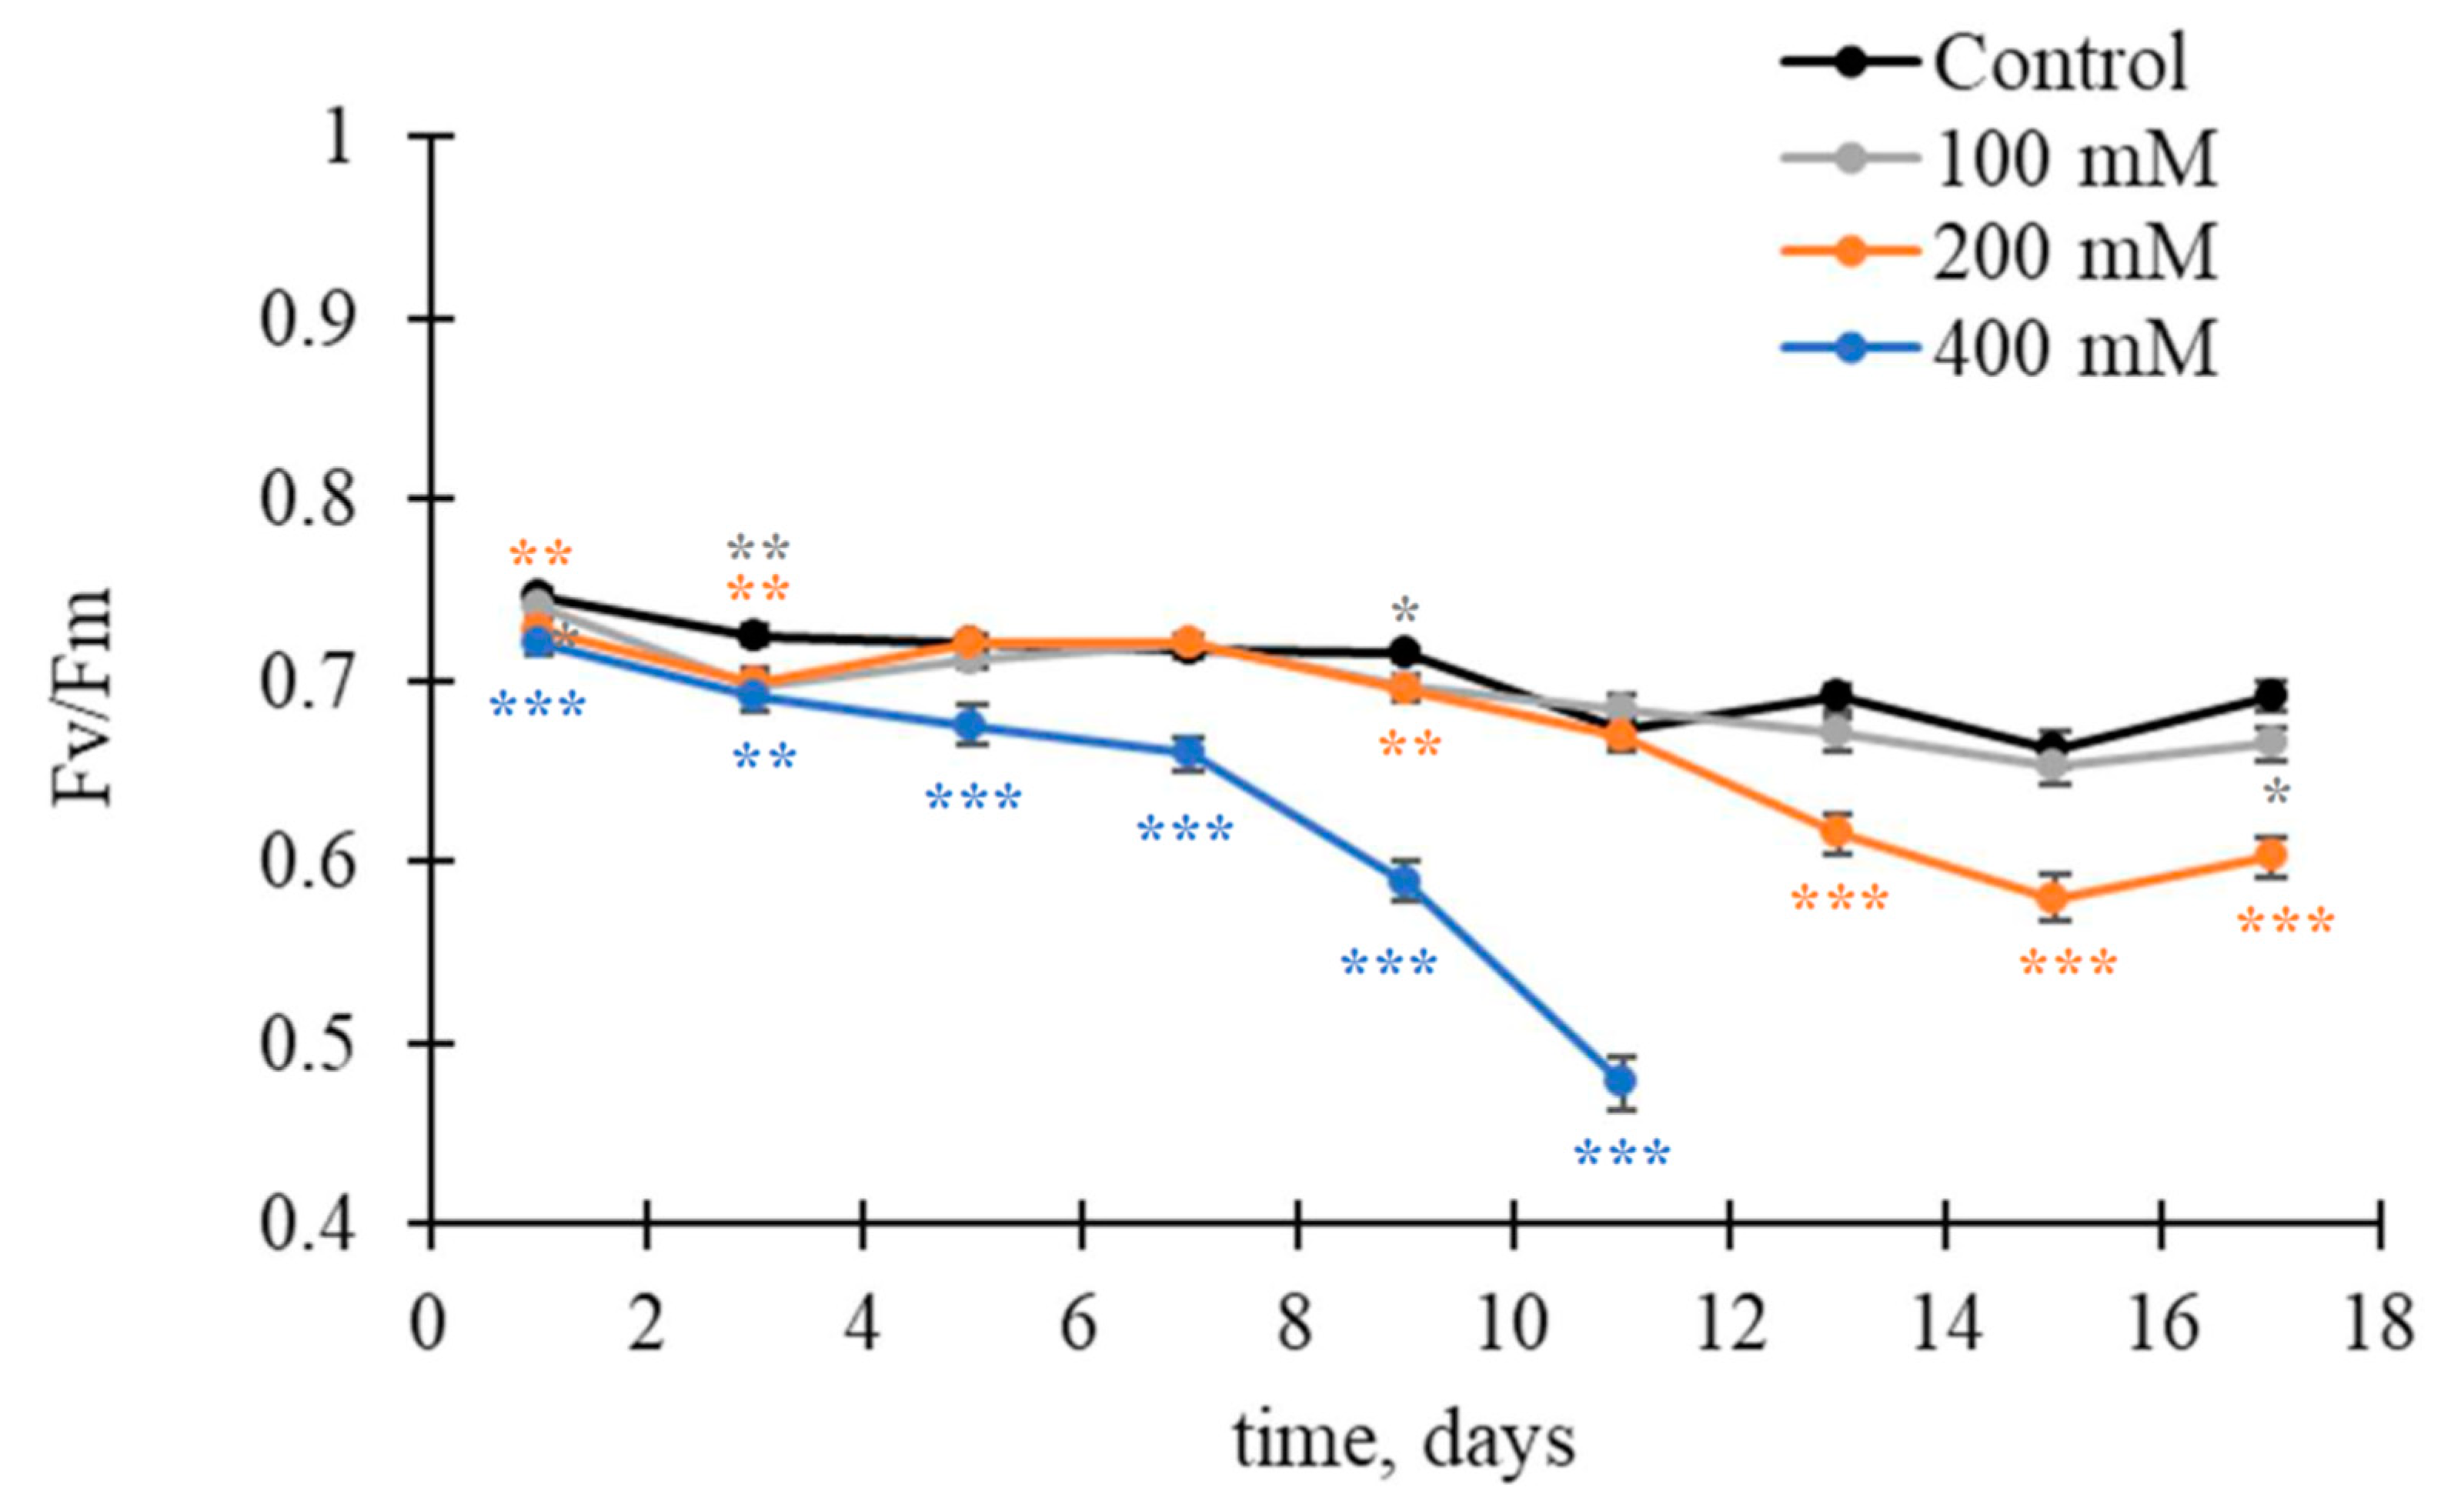
It was shown that the dynamics of change in Fv/Fm were strongly dependent on the NaCl concentration in the solutions that were used for irrigation (Figure 2). A significant and stable decrease in Fv/Fm was observed from the first day of the 400 mM NaCl treatment. A large change developed on the 9th and 11th days of the 400 mM NaCl treatment. Under the 200 mM NaCl treatment, a stable and significant decrease in Fv/Fm was observed from the 13th day of salinization. Under the 100 mM NaCl treatment, a decrease in Fv/Fm in comparison to control values was not stable for the entirety of the experiment.
The dynamics of change in short-wavelength photochemical reflectance indices (PRI(505, 570), PRI(515, 570), and PRI(525, 570)) and typical PRI(531, 570) under the NaCl treatment are shown in Figure 3. It was shown that the control dynamics of PRI(505, 570) and PRI(515, 570) (Figure 3a,b) were more stable than the control dynamics of PRI(525, 570), and typical PRI(531, 570) (Figure 3c,d). A significant increase in PRI(505, 570) and PRI(515, 570) was observed from the 3rd day of the 400 mM NaCl treatment; under the 100 and 200 mM NaCl treatments, this increase was significant from the 15th day of salinization (Figure 3a,b). The dynamics of change in PRI(525, 570) was not stable in control plants and plants under salinization (Figure 3c). A significant and stable decrease in PRI(531, 570) was observed from the 5th day of the 400 mM NaCl treatment; changes in this index were small and unstable under other salt concentrations (Figure 3d).
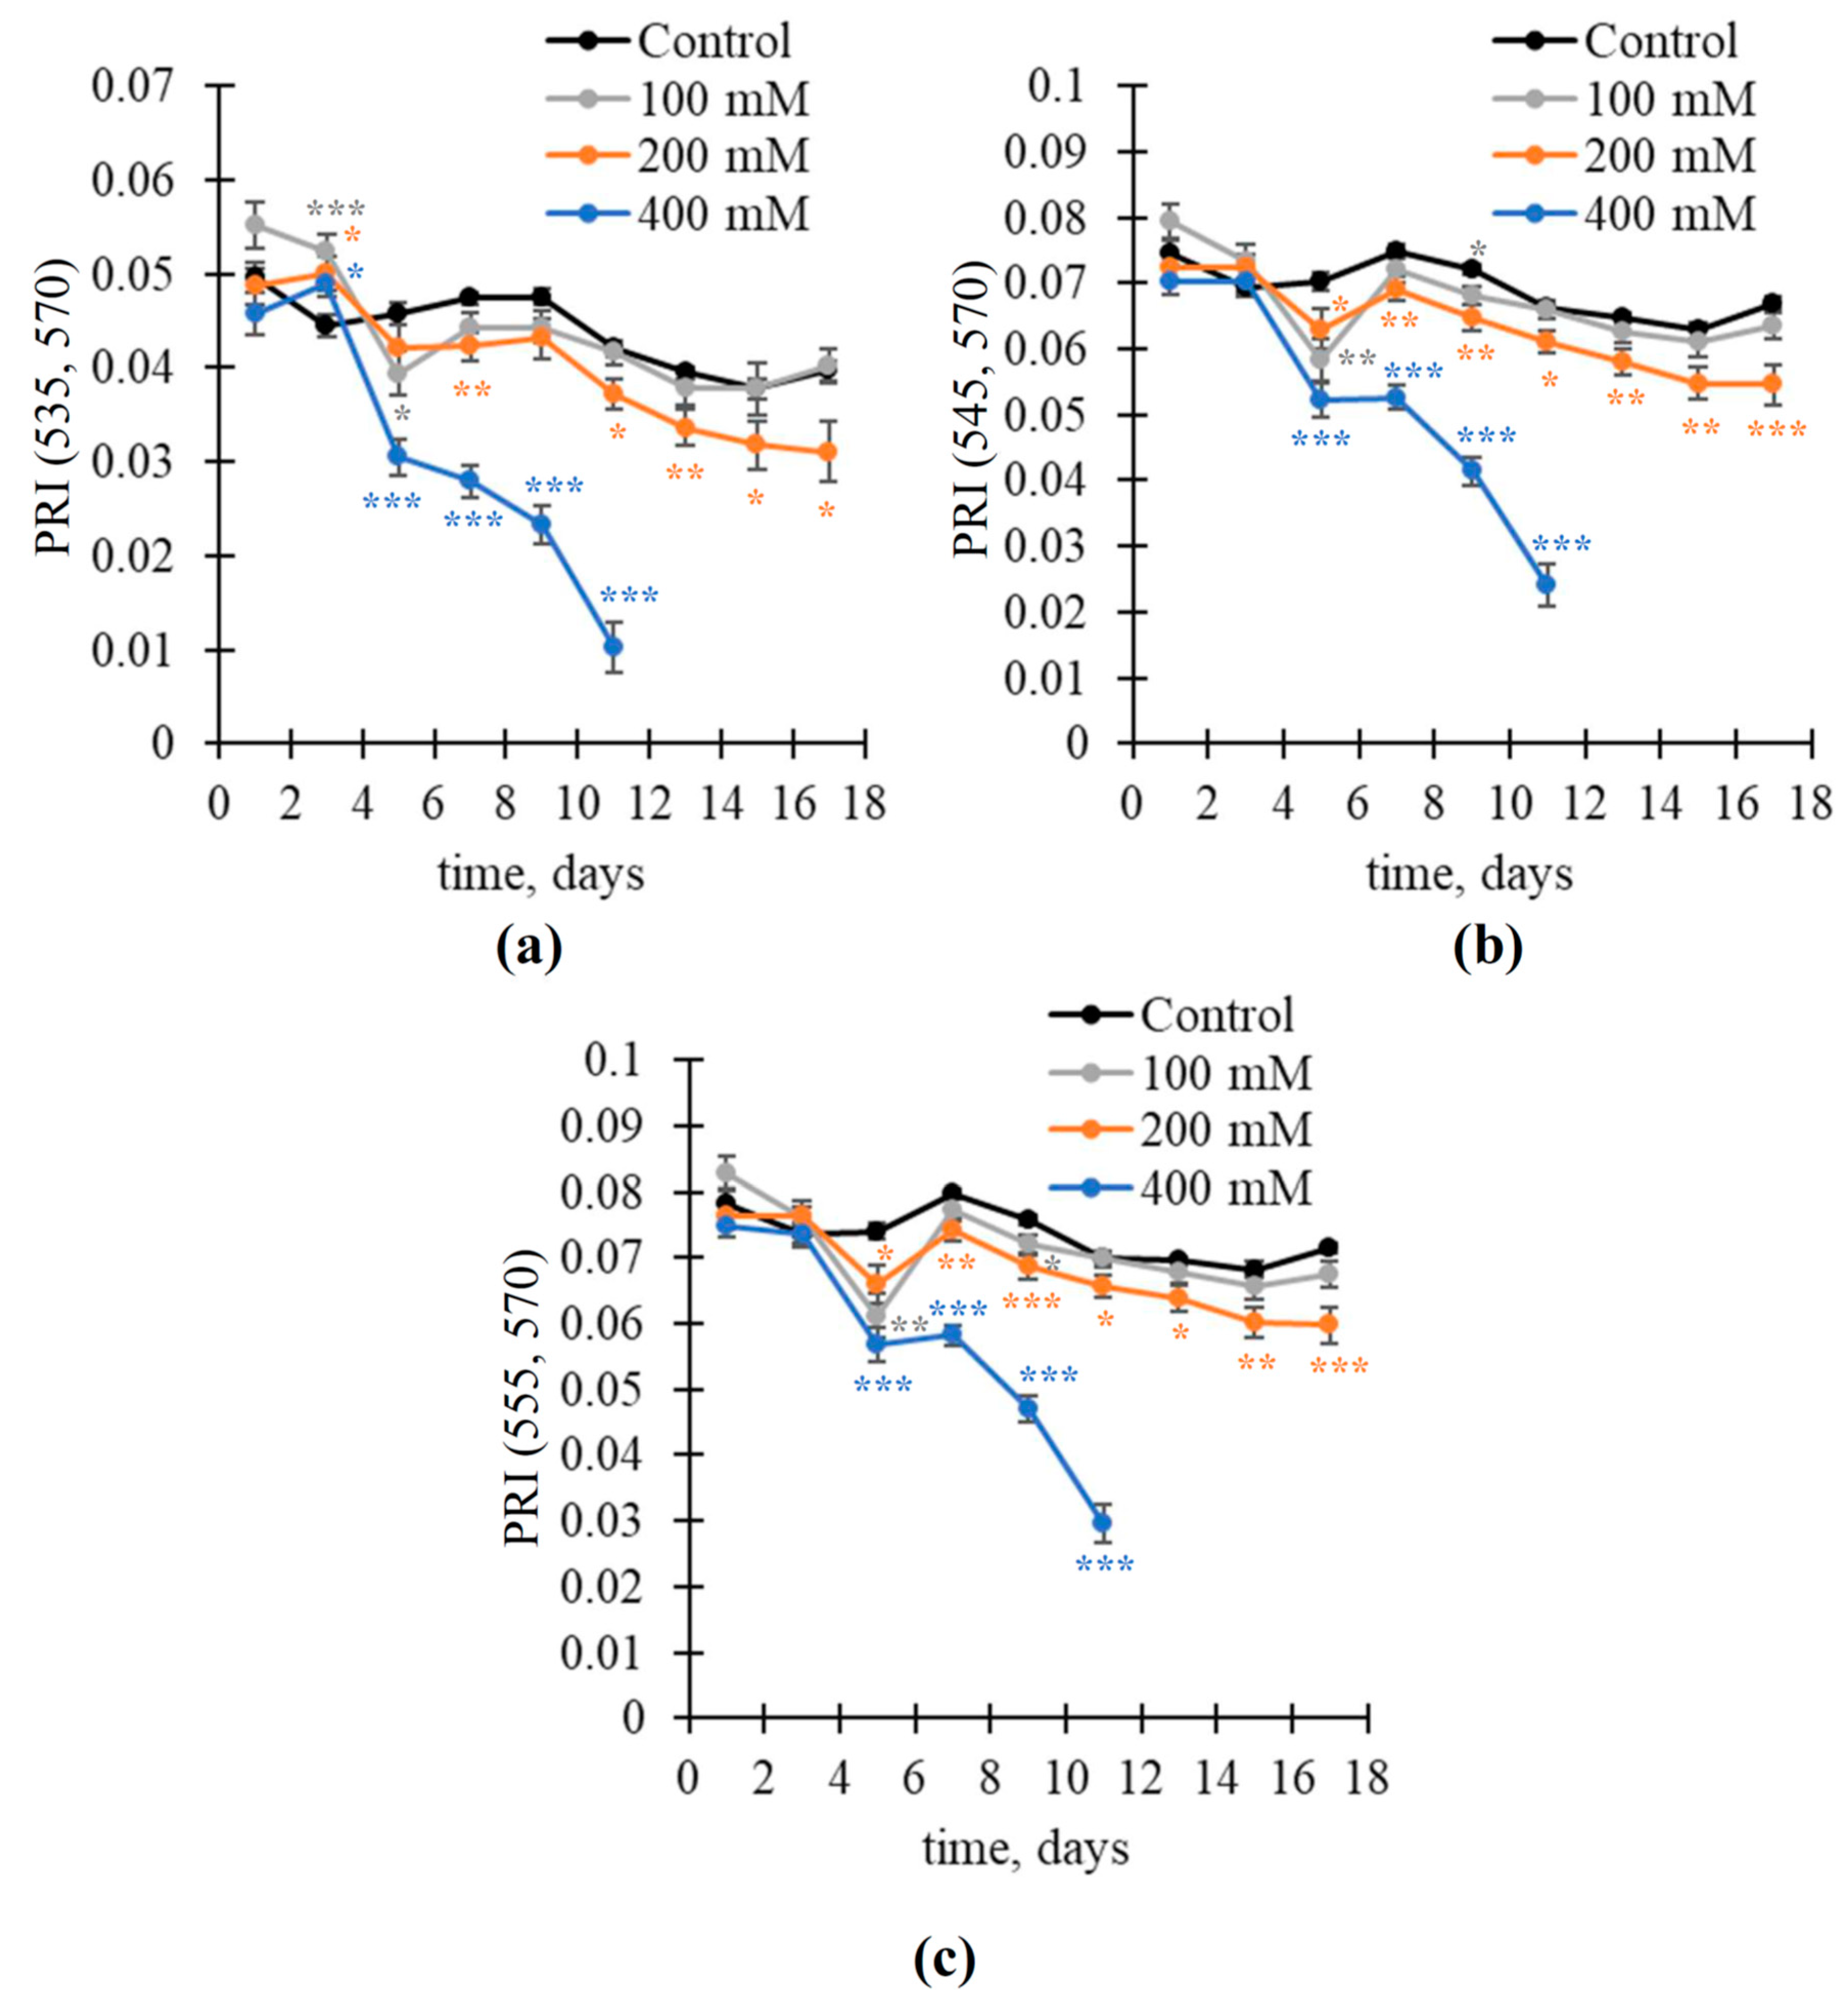
It was shown that long-wavelength photochemical reflectance indices (PRI(535, 570), PRI(545, 570), and PRI(555, 570)) were significantly decreased under the 200 and 400 mM NaCl treatments (Figure 4). The control dynamics of long-wavelength indices were more stable than the control dynamics of typical PRI(531, 570) (Figure 3d and Figure 4). A significant decrease in PRI(535, 570) was observed from the 5th day under the 400 mM NaCl treatment and from the 11th day under the 200 mM treatment (Figure 4a). PRI(545, 570) and PRI(555, 570) were significantly decreased from the 5th day under the 200 and 400 mM NaCl treatments (Figure 4b,c). The 100 mM NaCl treatment weakly influenced all investigated long-wavelength photochemical reflectance indices.
Further, we analyzed relations of typical and modified photochemical reflectance indices to maximal quantum yield of photosystem II (Fv/Fm). It was shown that these parameters were linearly related for the most reflectance indices (Figure 5). The determination coefficients (R2) were high for PRI(505, 570) (about 0.72), PRI(531, 570) (about 0.70), PRI(535, 570), PRI(545, 570), and PRI(555, 570) (about 0.78–0.80) (Figure 5a,d–g). PRI(525, 570) was weakly related to Fv/Fm (Figure 5c) (R2 was 0.0026). The determination coefficient of the linear regression describing PRI(515, 570) was moderate (about 0.59) (Figure 5b).
It was shown that the correlation coefficients (R) between Fv/Fm and photochemical reflectance indices were high and negative for short-wavelength PRI(505, 570) (R was about −0.76) and PRI(515, 570) (R was about −0.84) (Figure 5h). In contrast, the correlations were high and positive for the typical PRI(531, 570) and long-wavelength PRI(535, 570), PRI(545, 570), and PRI(555, 570) (R were about 0.88–0.89). The correlation coefficient of PRI(525, 570) was low and insignificant.
It should be additionally noted that most of the investigated photochemical reflectance indices (Figure 3 and Figure 4) were significantly changed on 5th day of the 100 and 200 mM NaCl treatments; however, this effect was decreased or absent on 7th day of this treatment. Considering the fast changes in typical and modified photochemical reflectance indices under the action of stressors (minutes and seconds [35,37,45]) and the sensitivity of these indices to photosynthetic processes [35,36,37], it can be speculated that these dynamics of change were related to the non-linear response of photosynthesis on the action of stressors: the suppression of photosynthetic processes at the initial action of the stressor, the subsequent reactivation of these processes for a moderate duration of this action (through adaptive changes), and their damages under the long-term action of stressors. This non-linear response could be reason for the variability in the changes in the photochemical reflectance indices; however, this hypothesis requires future investigation.

3.3. Analysis of Direction of Change of Modified Photochemical Reflectance Indices during the NaCl Treatment

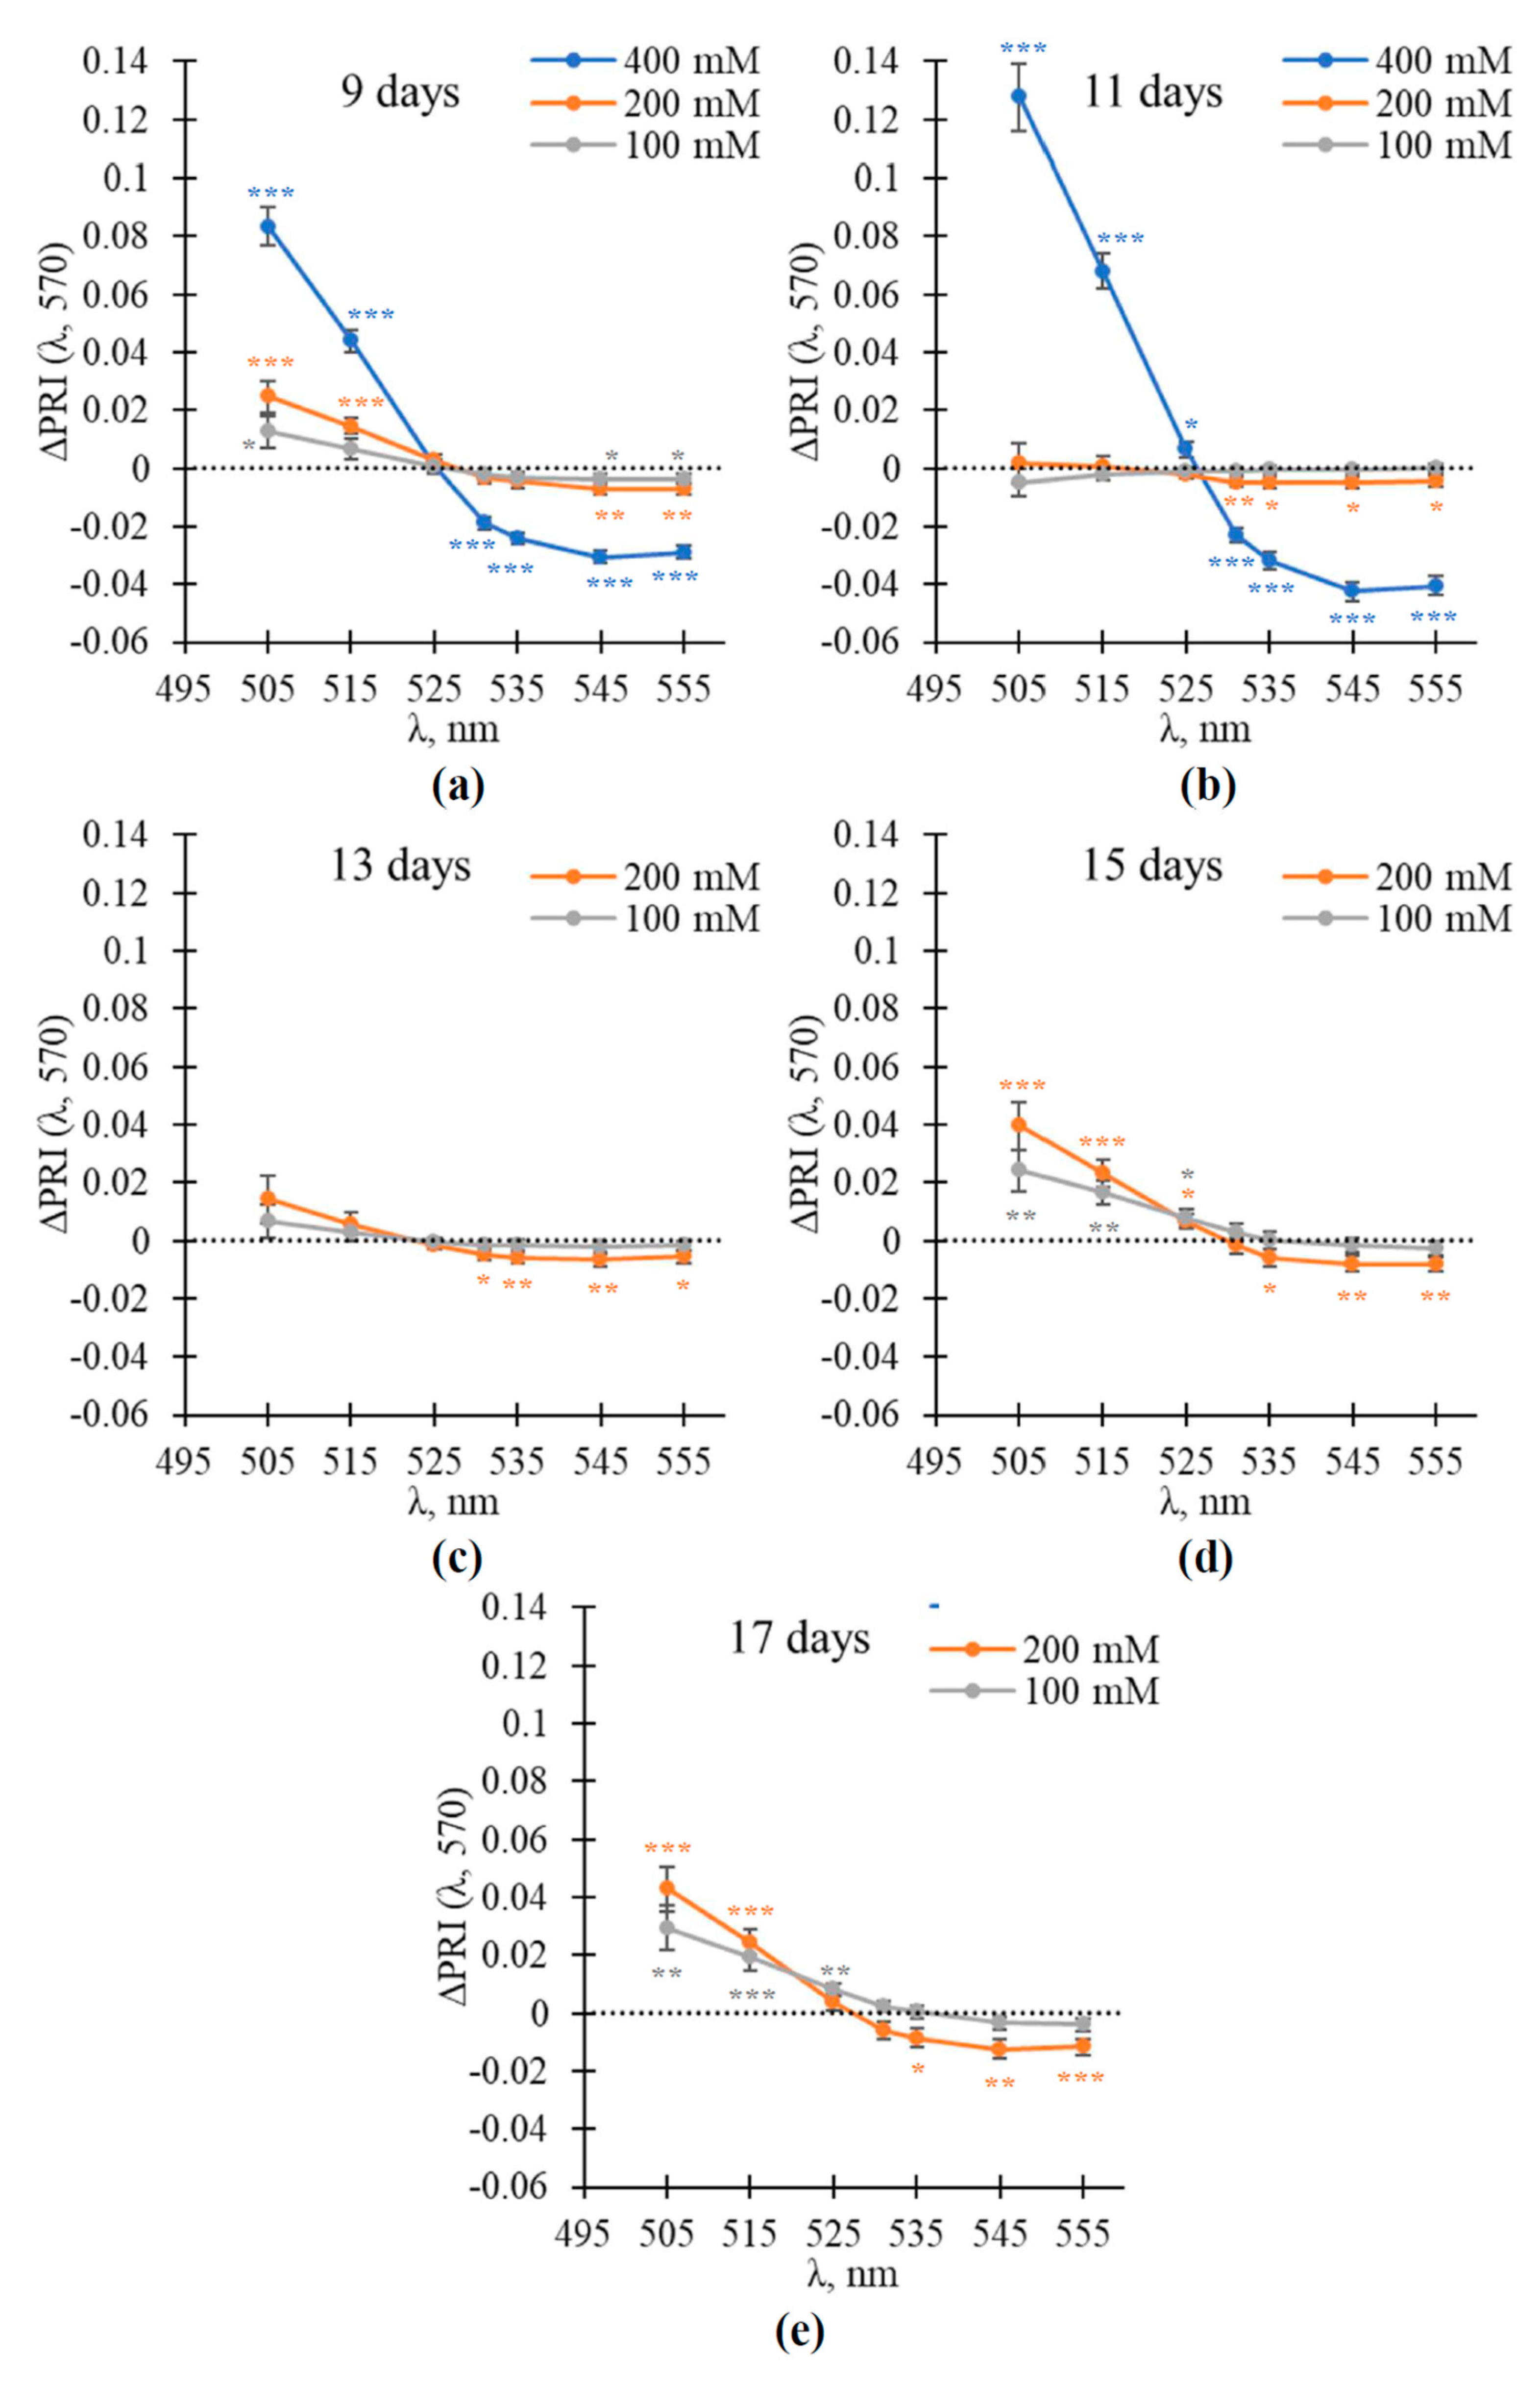
Figure 6 and Figure 7 show the ΔPRI(λ, 570) dependences on λ after different durations of the NaCl treatment. It was shown that the absolute values of short-wavelength ΔPRI(505, 570) and ΔPRI(515, 570) were larger than these values for the typical ΔPRI(531, 570) and long-wavelength ΔPRI(535, 570), ΔPRI(545, 570), and ΔPRI(555, 570). However, the magnitudes of ΔPRI(505, 570) and ΔPRI(515, 570) under the 100 and 200 mM NaCl treatments were varied after different durations of the NaCl treatment. The directions of these changes were also unstable, e.g., ΔPRI(505, 570) and ΔPRI(515, 570) were increased after 9 days of the 100 mM NaCl treatment and weakly decreased after 11 days (Figure 7a,b).
The magnitudes of long-wavelength ΔPRI(535, 570), ΔPRI(545, 570), and ΔPRI(555, 570) were more stable under the 200 mM NaCl treatment; however, they were also varied under the 100 mM NaCl treatment. Changes in both the short- and long-wavelength reflectance indices induced by the 400 mM NaCl treatment were stable.
The magnitudes of ΔPRI(525, 570) and typical ΔPRI(531, 570) were not stable after different durations of the NaCl treatment (especially the 100 and 200 mM NaCl treatments); the directions of change were also varied. This changeability is probably related to the dependence of PRI(525, 570) and PRI(531, 570) on two mechanisms (changes in the xanthophyll cycle and pH-dependent chloroplast shrinkage [33,35,36,37]); the contribution of these mechanisms to changes in PRI(525, 570) and PRI(531, 570) could be dependent on weak fluctuation of measurements conditions and physiological processes in plants.

3.4. The Comparison of Changes in Typical and Modified Photochemical Reflectance Indices and NDVI under the NaCl Treatment

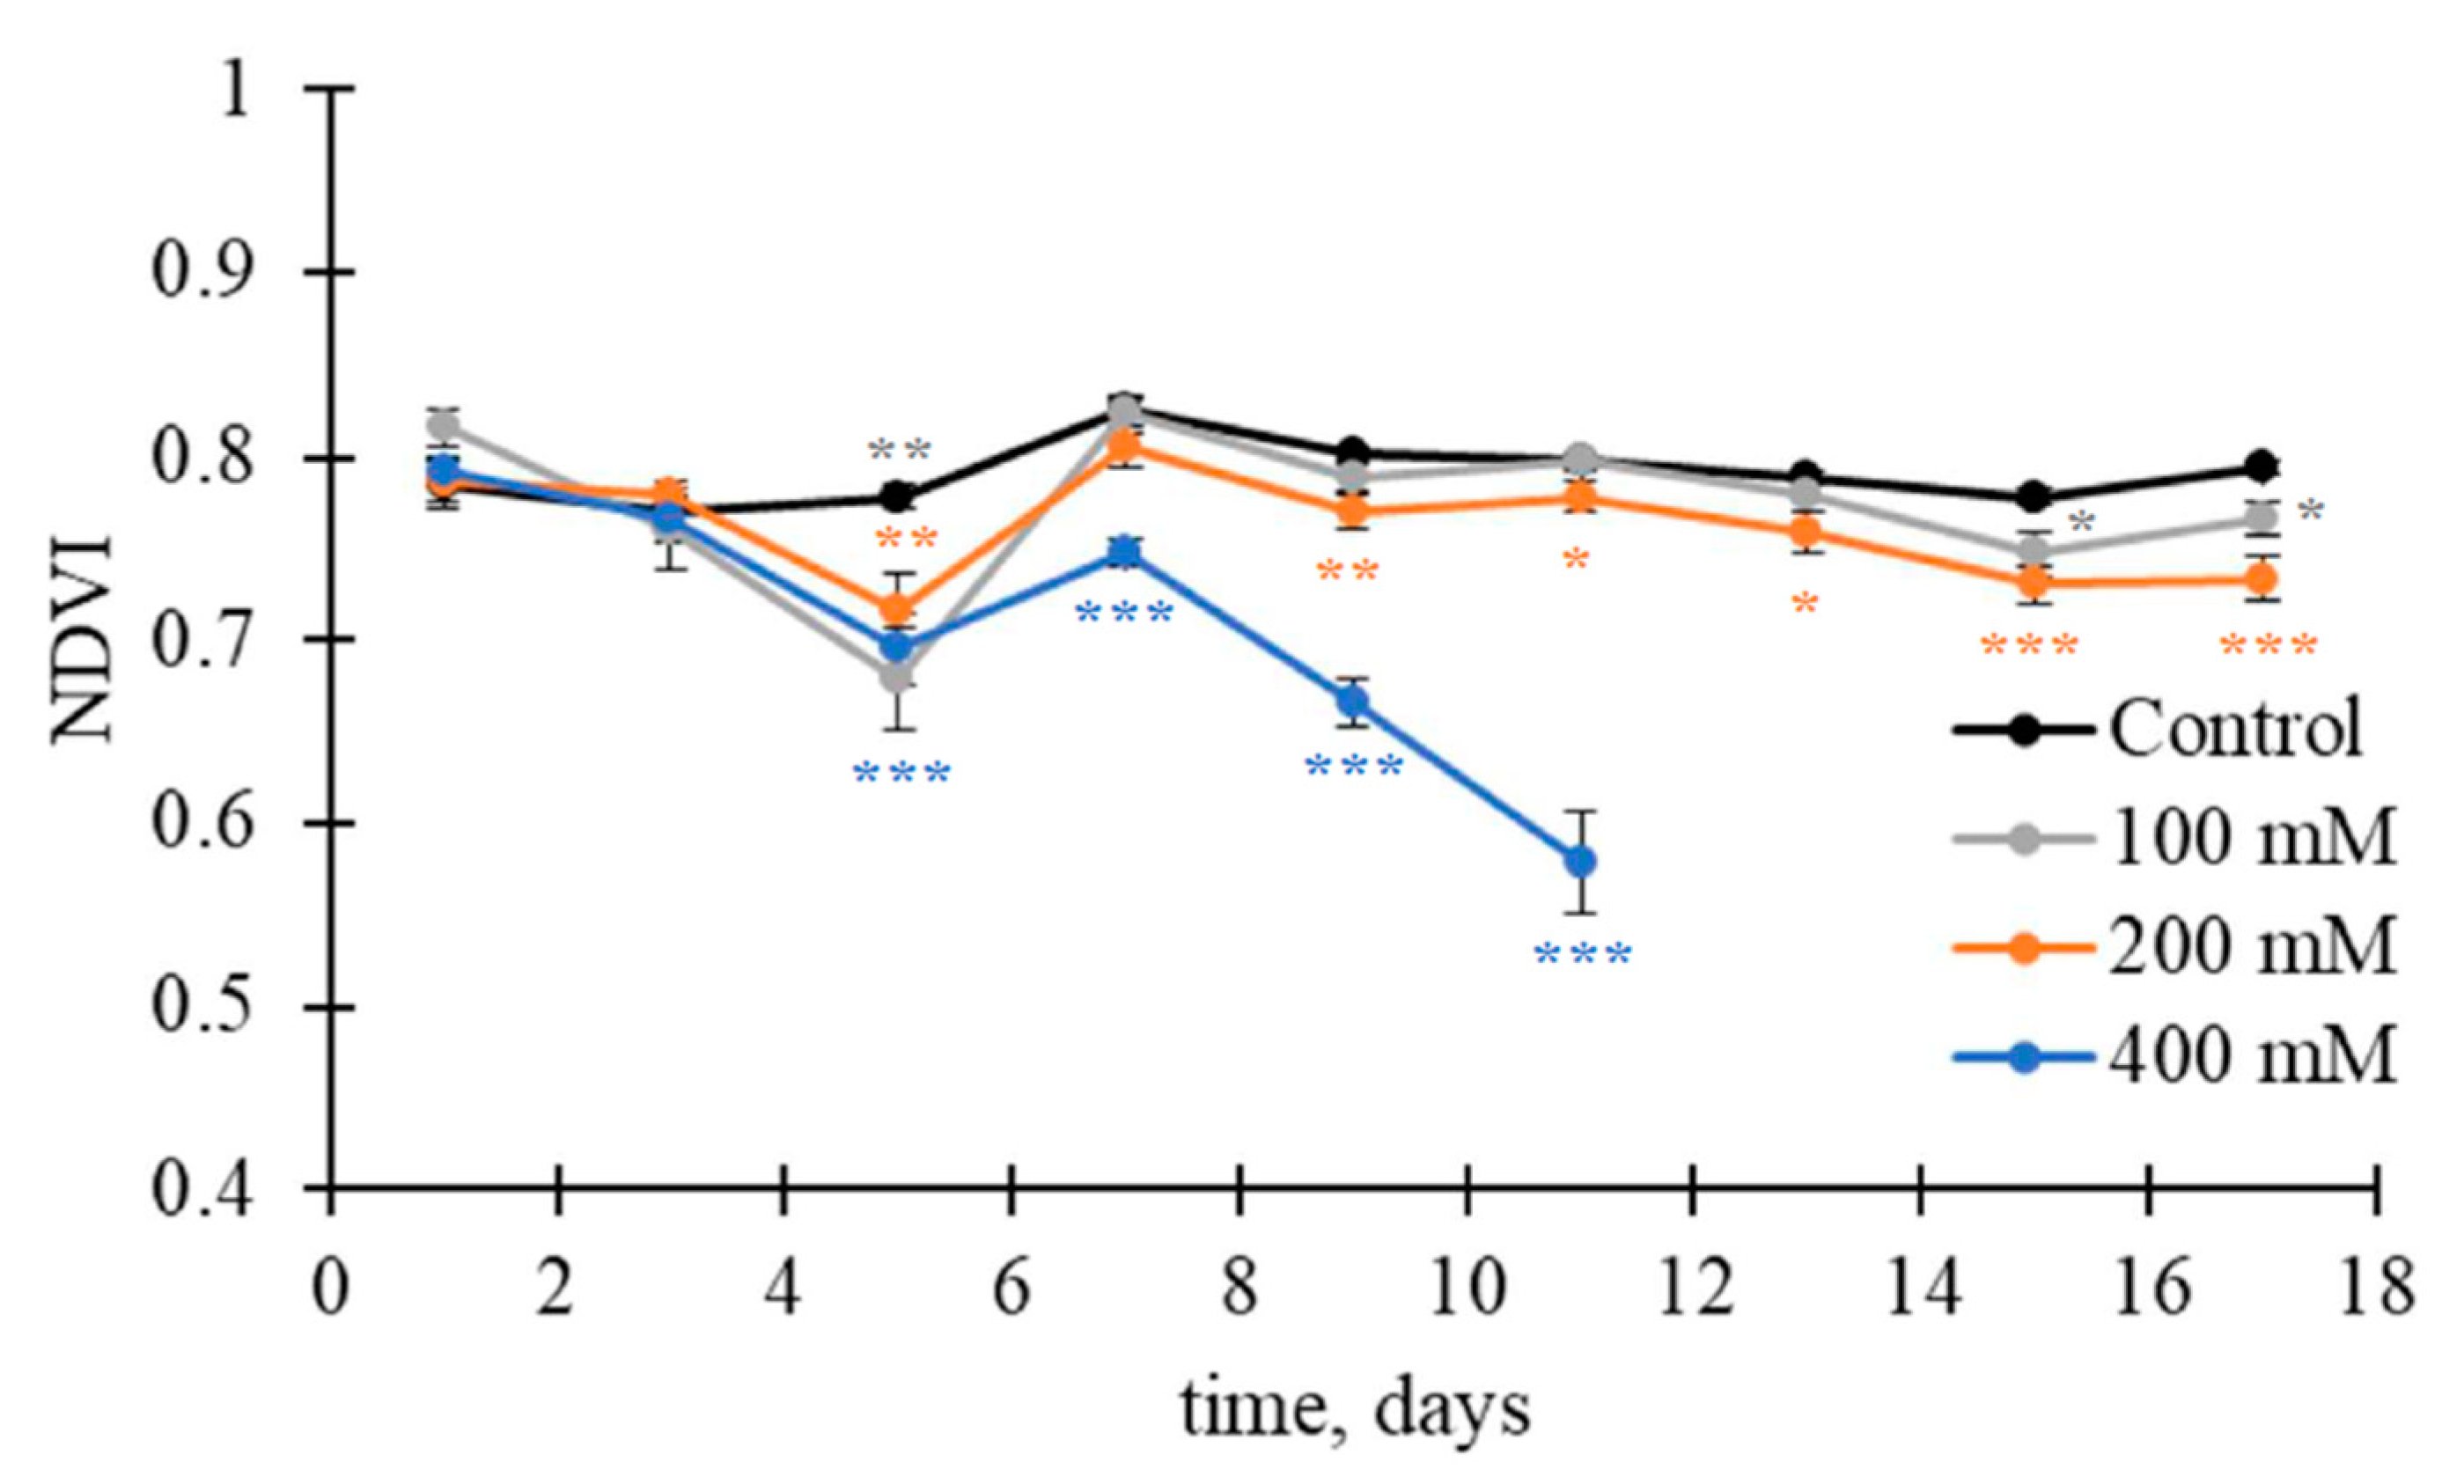
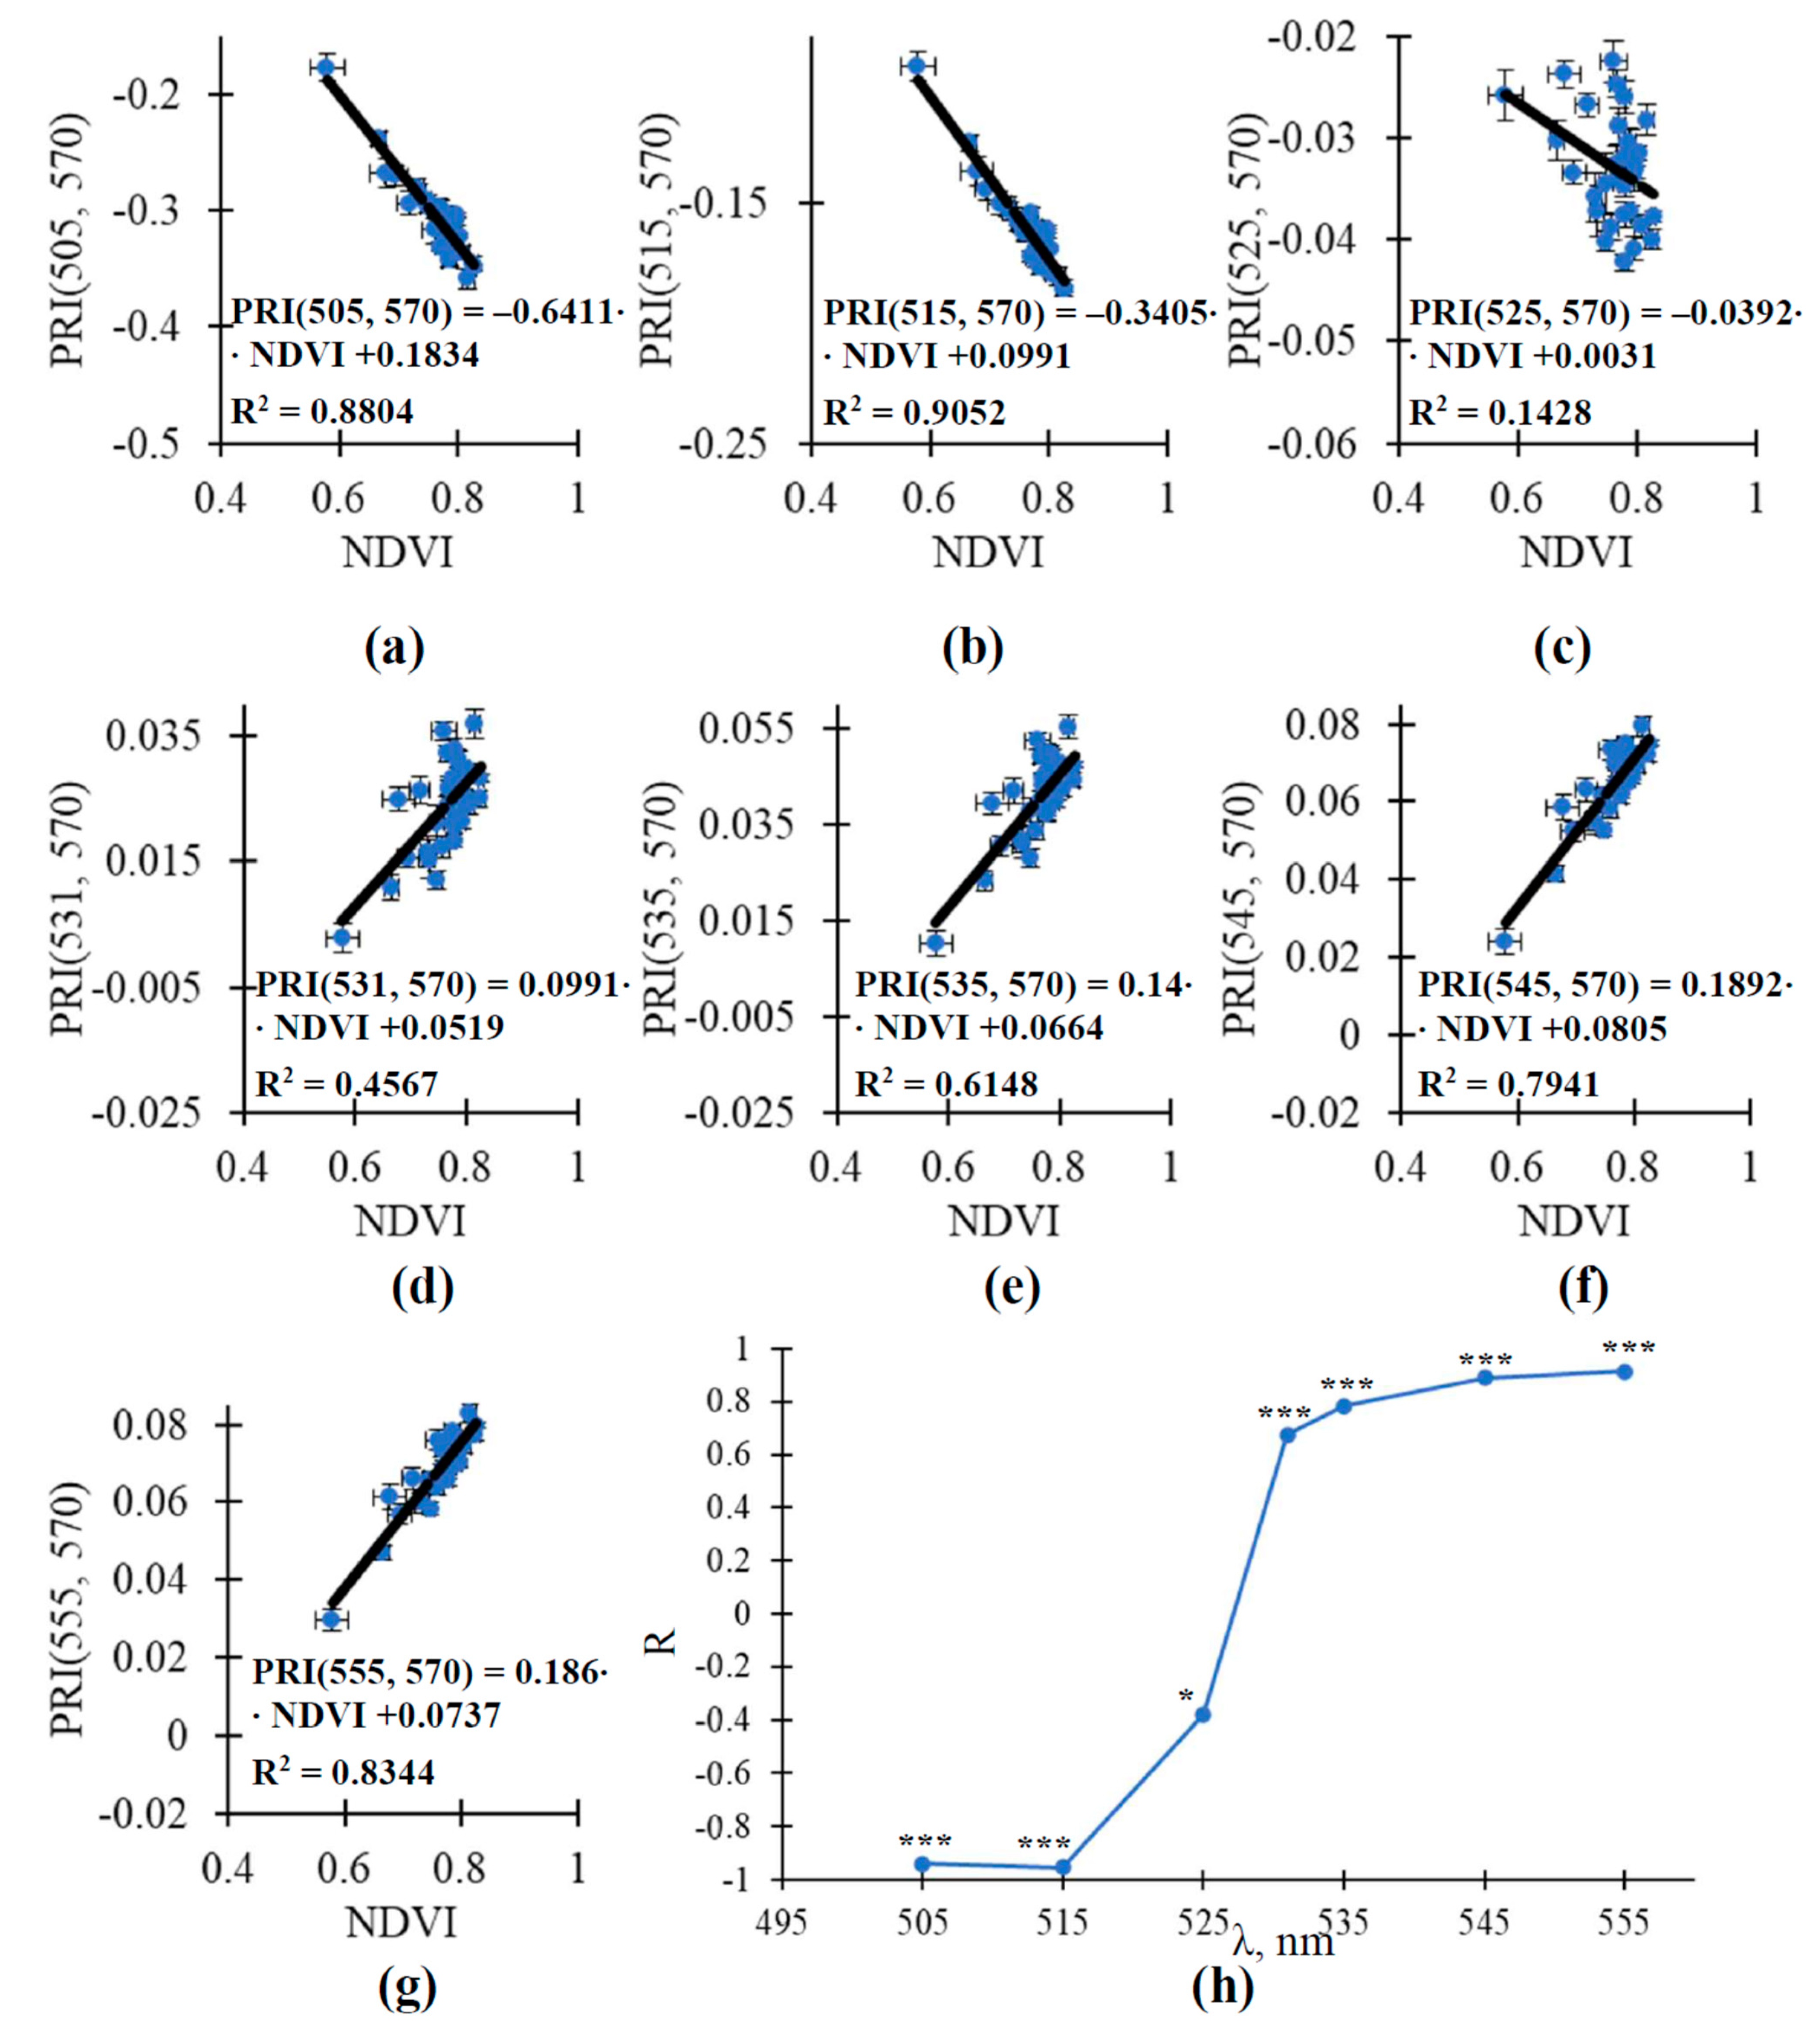
Finally, we compared changes in the typical and modified photochemical reflectance indices and changes in the NDVI. It was shown that significant changes in the NDVI were observed from the 5th day under the 400 mM NaCl treatment, from the 9th day under the 200 mM NaCl treatment, and from the 15th day under the 100 mM NaCl treatment (Figure 8). It should be noted that the absolute value changes in the NDVI were larger (Figure 8) than the values of changes in the modified photochemical reflectance indices (Figure 3 and Figure 4). However, the relative magnitudes of change in most of the modified photochemical reflectance indices on the last day of measurements were higher than those for the NDVI (Table 2). The relations between the change in the typical and modified photochemical reflectance indices and the change in the NDVI were analyzed (Figure 9).
It was shown that the NDVI was linearly related to the most of the modified photochemical reflectance indices (Figure 9a–g). The determination coefficients of linear regressions were high for PRI(505, 570), PRI(515, 570), PRI(545, 570), and PRI(555, 570) (about 0.79–0.9). PRI(535, 570) and typical PRI(531, 570) were moderately related to the NDVI (R2 of about 0.45 and 0.61, respectively). The determination coefficients of linear regressions were low for the NDVI and PRI(525, 570) (about 0.14) (Figure 9c). The correlations between the photochemical reflectance indices and the NDVI were strong for all reflectance indices except PRI(525, 570) (Figure 9h). It should be noted that the correlation coefficients were negative for short-wavelength PRIs and positive for long-wavelength PRIs.

4. Discussion

Soil salinization, which is caused by global changes in climate and wrongful use agricultural lands [1], is a significant problem in plant cultivation. It is known that salinization disrupts the transport of nutrients and water from soil [54]. Excess absorption of Na+ under high-salinity conditions shifts the osmotic balance and electrical gradient across the plasma membrane; these effects disrupt transport processes and electrical activity in tissue and organs [55]. The generation of ROS under salinization causes oxidative damage of membranes and cell death [10,12,15]. Finally, the suppression of photosynthetic processes [56,57] and decreasing plant growth and productivity [58,59,60] are dangerous results of salinization.
Thus, salinization is a significant agricultural problem that requires complex solutions, including the development of remote sensing of plant changes under the action of increased salinity. Using reflectance indices is an effective method for the remote sensing of plant stress changes [17,20]. Different reflectance indices can be sensitive to drought [61,62], changes in temperature [25,63], diseases [16], and salinization [14,41] because their values are dependent on the volume of green biomass [21], the concentration of photosynthetic pigments [28,29,64], water content [49], photosynthetic activity [17,43], LAI [38,65] and many other plant characteristics that can be influenced by the action of stressors. In particular, the photochemical reflectance index is an important tool for plant remote sensing because it is sensitive to changes in photosynthetic activity in plants [43,44,66], including fast changes (hours, minutes, and even seconds) [31,35,37]. It is known that the typical PRI(531, 570) can be very sensitive to soil and water salinization [14,39,41].
However, the directions of change in typical PRI(531, 570) can be dependent on the type and intensity of stressors (e.g., increasing under short-term water shortage and decreasing under long-term soil drought) [37,38,42,45,67]; this variability in the direction of change limits the use of typical PRI(531, 570) in plant remote sensing. Earlier, we proposed a series of modified reflectance indices [42,45] that are based on different measuring wavelengths and showed that these indices are sensitive to the action of excess light, water deficit, and heating.
In the current work, we show that the most of these indices (PRI(505, 570), PRI(515, 570), PRI(535, 570), PRI(545, 570), and PRI(555, 570)) are also sensitive to the action of salinization (irrigation by 200 and 400 mM NaCl solutions) (Figure 3, Figure 4, Figure 6 and Figure 7) and strongly related to the maximal quantum yield of photosystem II (Figure 5). It is significant that the short-wavelength photochemical reflectance indices (PRI(505, 570) and PRI(515, 570)) shifted in the positive direction under salinization (Figure 3); in contrast, the long-wavelength indices (PRI(535, 570), PRI(545, 570), and PRI(555, 570)) shifted in the negative direction (Figure 4). These results are in a good accordance with changes in these indices under the action of short-term water shortage, soil drought, and heating: The short-wavelength photochemical reflectance indices increased, and the long-wavelength indices decreased [42]; in contrast, excess light decreased all investigated modified photochemical reflectance indices [45].
From an applied point of view, these results show that a decrease is the universal response of PRI(535, 570), PRI(545, 570), and PRI(555, 570) on the action of all investigated stressors, including soil salinization (the current work), water deficit [42], heating [42], and excess light [45]. This means that these long-wavelength indices can be used for earlier revealing of stress changes in plants. PRI(545, 570) and PRI(555, 570), which were stably decreased from the 5th day of the 200 mM NaCl treatment (Figure 4b,c), seemed to be more sensitive to the action of salinization than the NDVI, which was stably decreased from the 9th day of the 200 mM NaCl treatment (Figure 8). The relative magnitudes of change in PRI(535, 570), PRI(545, 570), and PRI(555, 570) were higher than those in the NDVI (Table 2). The values of PRI(535, 570), PRI(545, 570), and PRI(555, 570) were strongly linearly related to the values of Fv/Fm (Figure 5); the results show that these indices can be used for estimation of the maximal quantum yield of photosystem II.
In contrast, short-wavelength indices can potentially be used for discrimination of fast and slow changes because they are decreased for minutes under the action of excess light [45] and increased for hours and days under the action of soil salinization, water deficit, and heating [42]. Large magnitudes of change in short-wavelength photochemical reflectance indices (Figure 6 and Figure 7) are additional advantages of using these indices; however, their relative changes are lower than the changes in long-wavelength photochemical reflectance indices (Table 2).
The different directions of change in short- and long-wavelength photochemical reflectance indices can be caused different mechanisms of change in reflectance at the measuring wavelength [42]. It is known [33] that pH-induced transitions in the xanthophyll cycle induce a reflectance decrease with a spectral maximum of 526 nm; in contrast, the pH-induced changes in chloroplast confirmations (probably chloroplast shrinkage [35]) induce a reflectance decrease with a spectral maximum of 545 nm. It can be proposed [42,45] that short-wavelength photochemical reflectance indices are mainly related to the xanthophyll cycle and long-wavelength photochemical reflectance indices are mainly related to chloroplast shrinkage. Previously, we revealed two components of change in modified PRIs [45]: the fast-relaxing component (mainly, long-wavelength photochemical reflectance indices) and the slow-relaxing component (mainly, short-wavelength photochemical reflectance indices). This result supports different mechanisms of in short- and long-wavelength photochemical reflectance indices.
The relation of typical [31,33] and, probably, short-wavelength [42,45] photochemical reflectance indices to xanthophylls can explain the increase in these indices under the prolonged action of stressors (at least water deficit and salinization). It is known that long-term salinization and drought stress cause the degradation of carotenoids [4,13,68]. The decrease in the content of xanthophyll pigment can decrease the absorption of light and increase reflectance, increasing short-wavelength and, probably, typical photochemical reflectance indices [42]; in contrast, long-wavelength photochemical reflectance indices, which are weakly related to the xanthophyll cycle, should not be dependent on the concentration of carotenoids.
The similarity of salinization- and drought-induced changes in modified PRIs ([42] and the current work) stresses an additional important question: Can this similarity be based on induction of a water deficit in plants? It is known that both drought and salinization can cause a water deficit, which is one of the damaging factors of action of increased salinity [15]. However, our previous work [42,52] showed that large change in modified PRIs accompany a significant decrease in water content in plants. In contrast, the current work does not show a significant influence of salinization on the relative water content in pea plants; only a weak and insignificant decrease was observed (Table 1). This means that the water loss is not likely to be a mechanism of change in modified PRIs under both soil drought and salinization. However, it cannot be excluded that decreasing the water flux into roots caused by soil drought or salinization can induce hydraulic signals through plants (without significant water loss in the plants) and stimulate the production of abscisic acid [69], which suppresses photosynthetic dark reactions through stomata closure [70] and/or decreasing the mesophyll CO2 conductance [71]; the suppression of photosynthetic dark reactions increases the pH gradient across the thylakoid membrane [72] and should change typical and modified PRIs.
Finally, we revealed the linear relations between changes in most of the modified photochemical reflectance indices and the NDVI (Figure 9). The NDVI is a widely known reflectance index that is related to biomass [21], LAI [65], the content of chlorophylls [64], and other slow-changing parameters in plants. These linear relations support the influence of chlorophyll concentration on modified photochemical reflectance indices, which can be caused by changes in the ratio between concentrations of carotenoids and chlorophylls because this ratio influences typical PRI(531, 570) [73,74].
As a whole, in the current work, we show that previously proposed modified photochemical reflectance indices are also sensitive to plant changes induced by salinization. This results supports perspectives of application of modified PRIs for remote sensing of plant stress changes; at that, long-wavelength photochemical reflectance indices seem to be a more universal indicator of plant stress changes, because PRI(535, 570), PRI(545, 570), and PRI(555, 570) were decreased under all investigated stressors (excess light [45], drought [42], heating [42], and salinization).
However, sensitivity of long-wavelength photochemical reflectance indices to the action of stressors was shown in spatially fixed leaves measured by spectrometer [42,45] or in imitation of the plant canopy measured by hyperspectral camera approximately 1.5 m in distance from the canopy ([42,52], the current work). These experimental schemes provide complete excluding background (in particular, the soil background). However, mobile platforms (e.g., unmanned aircraft systems or satellites) equipped with hyper- or multispectral cameras are the fastest and most effective tools for the remote sensing of agricultural plants in fields [17]. This means that distances between the plant canopy and the sensor can be large when using mobile platforms; these distances can equal at least meters or tens of meters with copter-based measurements or can be significantly larger with drone- or satellite-based ones. As a result, excluding the soil background can be restricted under these conditions.
Air purity can be an additional factor influencing the efficiency of using reflectance indices for plant remote sensing using flying mobile platforms [17]. This means that the influence of the soil background and air purity on the sensitivity of modified photochemical reflectance indices requires future investigations. Considering widely used modifications of the NDVI (e.g., optimization of the soil-adjusted vegetation index [75] or the atmospherically resistant vegetation index [76]), it can be speculated that the influence of the soil background and air purity on modified photochemical reflectance indices can also be minimized by using correction factors.

5. Conclusions

In the current work, we investigated the sensitivity of modified photochemical reflectance indices to the action of salinization, which is a significant stressor that decreases the productivity of agricultural plants. It was shown that short-wavelength PRIs (PRI(505, 570) and PRI(515, 570)), long-wavelength PRIs (PRI(535, 570), PRI(545, 570), and PRI(555, 570)), and typical PRI(531, 570) were sensitive to treatment by NaCl and were strongly related to photosynthetic damage; in contrast, PRI(525, 570) was weakly sensitive to salinization. However, the directions of change were differed because salinization increased PRI(505, 570) and PRI(515, 570) and decreased PRI(531, 570), PRI(535, 570), PRI(545, 570), and PRI(555, 570).
This means that long-wavelength photochemical reflectance indices, which are decreased under excess light [45], drought [42], heating [42], and salinization (the current work), may be the most universal tool for remote sensing of plant stress changes compared to short-wavelength photochemical reflectance indices and typical PRI(531, 570), because the directions of change of these indices may be dependent on the parameters of stressors (see [42,45] and the current work).
Finally, it should be noted that our results are based on analysis of the model system (imitation of the plant canopy) at moderate distances between the plants and the hyperspectral camera (about 1.5 m). Using the experimental scheme provides controlled salinization and clear exclusion of the soil background in the results analysis. However, remote sensing of agricultural plants is often based on mobile platforms (e.g., unmanned aircraft systems or satellites) [17]. This method restricts exclusion of the background; this restriction may have influenced the sensitivity of the investigated reflectance indices. Potentially, the air purity may also have influenced the sensitivity of the modified PRIs in this case. Thus, analysis of the efficiency of modified PRIs using mobile platforms is an important future task.

Supplementary Materials

The following are available online at https://www.mdpi.com/article/10.3390/rs15153772/s1; Figure S1: (a) localization of pallets with control and treated plants, which was used for hyperspectral imaging; (b) the typical reflectance spectrum of pea leaves.

Author Contributions

Conceptualization, E.S. and V.S.; methodology, L.Y., Y.Z. and A.P.; software, E.S.; formal analysis, E.S.; investigation, Y.Z. and A.P.; writing—original draft preparation, E.S.; writing—review and editing, V.S.; supervision, V.S.; project administration, E.S. and L.Y.; funding acquisition, V.S. All authors have read and agreed to the published version of the manuscript.

Funding

Analysis of typical and modified photochemical reflectance indices was funded by the Russian Science Foundation, project number 23-14-00127.

Data Availability Statement

The data presented in this study are available upon request from the corresponding author.

Conflicts of Interest

The authors declare no conflict of interest. The funders had no role in the design of the study; in the collection, analyses, or interpretation of data; in the writing of the manuscript, or in the decision to publish the results.

References

  1. Stavi, I.; Thevs, N.; Priori, S. Soil salinity and sodicity in drylands: A review of causes, effects, monitoring, and restoration measures. Front. Environ. Sci. 2021, 9, 712831. [Google Scholar]
  2. Gornall, J.; Betts, R.; Burke, E.; Clark, R.; Camp, J.; Willett, K.; Wiltshire, A. Implications of climate change for agricultural productivity in the early twenty-first century. Philos. Trans. R. Soc. Lond. B Biol. Sci. 2010, 365, 2973–2989. [Google Scholar] [CrossRef]
  3. Hassani, A.; Azapagic, A.; Shokri, N. Global predictions of primary soil salinization under changing climate in the 21st century. Nat. Commun. 2021, 12, 6663. [Google Scholar]
  4. Taïbi, K.; Taïbi, F.; Abderrahim, L.A.; Ennajah, A.; Belkhodja, M.; Mulet, J.M. Effect of salt stress on growth, chlorophyll content, lipid peroxidation and antioxidant defence systems in Phaseolus vulgaris L. S. Afr. J. Bot. 2016, 105, 306–312. [Google Scholar] [CrossRef]
  5. Saddiq, M.S.; Iqbal, S.; Hafeez, M.B.; Ibrahim, A.M.H.; Raza, A.; Fatima, E.M.; Baloch, H.; Jahanzaib; Woodrow, P.; Ciarmiello, L.F. Effect of salinity stress on physiological changes in winter and spring wheat. Agronomy 2021, 11, 1193. [Google Scholar] [CrossRef]
  6. Kafi, M.; Rahimi, Z. Effect of salinity and silicon on root characteristics, growth, water status, proline content and ion accumulation of purslane (Portulaca oleracea L.). Soil Sci. Plant Nutr. 2011, 57, 341–347. [Google Scholar]
  7. Zou, Y.; Zhang, Y.; Testerink, C. Root dynamic growth strategies in response to salinity. Plant Cell Environ. 2022, 45, 695–704. [Google Scholar] [CrossRef]
  8. Youngner, V.B.; Lunt, O.R. Salinity effects on roots and tops of bermudagrass. Grass Forage Sci. 1967, 22, 257–259. [Google Scholar] [CrossRef]
  9. Qian, Y.L.; Engelke, M.C.; Foster, M.J.V. Salinity effects on zoysiagrass cultivars and experimental lines. Crop Sci. 2000, 40, 488–492. [Google Scholar] [CrossRef]
  10. Hu, L.; Huang, Z.; Liu, S.; Fu, J. Growth response and gene expression in antioxidant-related enzymes in two bermudagrass genotypes differing in salt tolerance. J. Am. Soc. Hort. Sci. 2012, 137, 134–143. [Google Scholar]
  11. Dhokne, K.; Pandey, J.; Yadav, R.M.; Ramachandran, P.; Rath, J.R.; Subramanyam, R. Change in the photochemical and structural organization of thylakoids from pea (Pisum sativum) under salt stress. Plant Physiol. Biochem. 2022, 177, 46–60. [Google Scholar] [CrossRef] [PubMed]
  12. Zahra, N.; Al Hinai, M.S.; Hafeez, M.B.; Rehman, A.; Wahid, A.; Siddique, K.H.M.; Farooq, M. Regulation of photosynthesis under salt stress and associated tolerance mechanisms. Plant Physiol. Biochem. 2022, 178, 55–69. [Google Scholar] [CrossRef]
  13. Trifunović-Momčilov, M.; Milošević, S.; Marković, M.; Ðurić, M.; Jevremović, S.; Dragićević, I.Č.; Subotić, A.R. Changes in photosynthetic pigments content in non-transformed and AtCKX transgenic centaury (Centaurium erythraea Rafn) shoots grown under salt stress in vitro. Agronomy 2021, 11, 2056. [Google Scholar] [CrossRef]
  14. Naumann, J.C.; Young, D.R.; Anderson, J.E. Leaf chlorophyll fluorescence, reflectance, and physiological response to freshwater and saltwater flooding in the evergreen shrub, Myrica cerifera. Environ. Exp. Bot. 2008, 63, 402–409. [Google Scholar] [CrossRef]
  15. Liang, W.; Ma, X.; Wan, P.; Liu, L. Plant salt-tolerance mechanism: A review. Biochem. Biophys. Res. Commun. 2018, 495, 286–291. [Google Scholar] [CrossRef] [PubMed]
  16. Mahlein, A.-K. Plant disease detection by imaging sensors—Parallels and specific demands for precision agriculture and plant phenotyping. Plant Dis. 2016, 100, 241–251. [Google Scholar]
  17. Kior, A.; Sukhov, V.; Sukhova, E. Application of reflectance indices for remote sensing of plants and revealing actions of stressors. Photonics 2021, 8, 582. [Google Scholar] [CrossRef]
  18. Zhao, X.; Zhou, D.; Fang, J. Satellite-based Studies on Large-Scale Vegetation Changes in China. J. Integr. Plant Biol. 2012, 54, 713–728. [Google Scholar] [CrossRef]
  19. Jang, G.; Kim, J.; Yu, J.-K.; Kim, H.-J.; Kim, Y.; Kim, D.-W.; Kim, K.-H.; Lee, C.W.; Chung, Y.S. Review: Cost-effective unmanned aerial vehicle (UAV) platform for field plant breeding application. Remote Sens. 2020, 12, 998. [Google Scholar]
  20. Xue, J.; Su, B. Significant remote sensing vegetation indices: A review of developments and applications. J. Sens. 2017, 2017, 2–17. [Google Scholar]
  21. Zhu, X.; Liu, D. Improving forest aboveground biomass estimation using seasonal Landsat NDVI time-series. ISPRS J. Photogram. Remote Sens. 2015, 102, 222–231. [Google Scholar] [CrossRef]
  22. Xing, N.; Huang, W.; Xie, Q.; Shi, Y.; Ye, H.; Dong, Y.; Wu, M.; Sun, G.; Jiao, Q.A. Transformed triangular vegetation index for estimating winter wheat leaf area index. Remote Sens. 2020, 12, 16. [Google Scholar] [CrossRef] [Green Version]
  23. Peñuelas, J.; Gamon, J.A.; Fredeen, A.L.; Merino, J.; Field, C.B. Reflectance indices associated with physiological changes in nitrogen- and water-limited sunflower leaves. Remote Sens. Environ. 1994, 48, 135–146. [Google Scholar] [CrossRef]
  24. Filella, I.; Peñuelas, J.; Llorens, L.; Estiarte, M. Reflectance assessment of seasonal and annual changes in biomass and CO2 uptake of a Mediterranean shrubland submitted to experimental warming and drought. Remote Sens. Environ. 2004, 90, 308–318. [Google Scholar] [CrossRef]
  25. Osório, J.; Osório, M.L.; Romano, A. Reflectance indices as nondestructive indicators of the physiological status of Ceratonia siliqua seedlings under varying moisture and temperature regimes. Funct. Plant Biol. 2012, 39, 588–597. [Google Scholar]
  26. Sarlikioti, V.; Driever, S.M.; Marcelis, L.F.M. Photochemical reflectance index as a mean of monitoring early water stress. Ann. Appl. Biol. 2010, 157, 81–89. [Google Scholar] [CrossRef]
  27. Hernández-Clemente, R.; Navarro-Cerrillo, R.M.; Suárez, L.; Morales, F.; Zarco-Tejada, P.J. Assessing structural effects on PRI for stress detection in conifer forests. Remote Sens. Environ. 2011, 115, 2360–2375. [Google Scholar] [CrossRef]
  28. Filella, I.; Porcar-Castell, A.; Munné-Bosch, S.; Bäck, J.; Garbulsky, M.F.; Peñuelas, J. PRI assessment of long-term changes in carotenoids/chlorophyll ratio and short-term changes in de-epoxidation state of the xanthophyll cycle. Int. J. Remote Sens. 2009, 30, 4443–4455. [Google Scholar] [CrossRef]
  29. Gitelson, A.A.; Chivkunova, O.B.; Merzlyak, M.N. Nondestructive estimation of anthocyanins and chlorophylls in anthocyanic leaves. Am. J. Bot. 2009, 96, 1861–1868. [Google Scholar] [CrossRef] [Green Version]
  30. Harris, A.; Owen, S.M.; Sleep, D.; Pereira, M.D. Constitutive changes in pigment concentrations: Implications for estimating isoprene emissions using the photochemical reflectance index. Physiol. Plant. 2016, 156, 190–200. [Google Scholar]
  31. Gamon, J.A.; Peñuelas, J.; Field, C.B. A narrow-waveband spectral index that tracks diurnal changes in photosynthetic efficiency. Remote Sens. Environ. 1992, 41, 35–44. [Google Scholar] [CrossRef]
  32. Shrestha, S.; Brueck, H.; Asch, F. Chlorophyll index, photochemical reflectance index and chlorophyll fluorescence measurements of rice leaves supplied with different N levels. J. Photochem. Photobiol. B Biol. 2012, 113, 7–13. [Google Scholar] [CrossRef] [PubMed]
  33. Gamon, J.A.; Serrano, L.; Surfus, J.S. The photochemical reflectance index: An optical indicator of photosynthetic radiation use efficiency across species, functional types, and nutrient levels. Oecologia 1997, 112, 492–501. [Google Scholar] [PubMed]
  34. Ruban, A.V. Evolution under the sun: Optimizing light harvesting in photosynthesis. J. Exp. Bot. 2015, 66, 7–23. [Google Scholar] [CrossRef] [PubMed]
  35. Evain, S.; Flexas, J.; Moya, I. A new instrument for passive remote sensing: 2. Measurement of leaf and canopy reflectance changes at 531 nm and their relationship with photosynthesis and chlorophyll fluorescence. Remote Sens. Environ. 2004, 91, 175–185. [Google Scholar]
  36. Sukhova, E.M.; Yudina, L.M.; Vodeneev, V.A.; Sukhov, V.S. Analysis of changes in photochemical reflectance index (PRI) in relation to the acidification of the lumen of the chloroplasts of pea and geranium leaves under a short-term illumination. Biochem. Moscow Suppl. Ser. A 2019, 13, 243–252. [Google Scholar] [CrossRef]
  37. Sukhov, V.; Sukhova, E.; Khlopkov, A.; Yudina, L.; Ryabkova, A.; Telnykh, A.; Sergeeva, E.; Vodeneev, V.; Turchin, I. Proximal imaging of changes in photochemical reflectance index in leaves based on using pulses of green-yellow light. Remote Sens. 2021, 13, 1762. [Google Scholar] [CrossRef]
  38. Gutierrez-Rodriguez, M.; Escalante-Estrada, J.A.; Rodriguez-Gonzalez, M.T. Canopy reflectance, stomatal conductance, and yield of Phaseolus vulgaris L. and Phaseolus coccinues L. under saline field conditions. Int. J. Agric. Biol. 2005, 7, 491–494. [Google Scholar]
  39. Song, C.; White, B.L. Heumann. B.W. Hyperspectral remote sensing of salinity stress on red (Rhizophora mangle) and white (Laguncularia racemosa) mangroves on Galapagos Islands. Remote Sens. Lett. 2011, 2, 221–230. [Google Scholar]
  40. Naumann, J.C.; Young, D.R.; Anderson, J.E. Spatial variations in salinity stress across a coastal landscape using vegetation indices derived from hyperspectral imagery. Plant Ecol. 2009, 202, 285–297. [Google Scholar]
  41. Zinnert, J.C.; Nelson, J.D.; Hoffman, A.M. Effects of salinity on physiological responses and the photochemical reflectance index in two co-occurring coastal shrubs. Plant Soil 2012, 354, 45–55. [Google Scholar] [CrossRef]
  42. Sukhova, E.; Yudina, L.; Kior, A.; Kior, D.; Popova, A.; Zolin, Y.; Gromova, E.; Sukhov, V. Modified photochemical reflectance indices as new tool for revealing influence of drought and heat on pea and wheat plants. Plants 2022, 11, 1308. [Google Scholar] [CrossRef] [PubMed]
  43. Zhang, C.; Filella, I.; Garbulsky, M.F.; Peñuelas, J. affecting factors and recent improvements of the photochemical reflectance index (PRI) for remotely sensing foliar, canopy and ecosystemic radiation-use efficiencies. Remote Sens. 2016, 8, 677. [Google Scholar]
  44. Sukhova, E.; Sukhov, V. Connection of the photochemical reflectance index (PRI) with the photosystem II quantum yield and nonphotochemical quenching can be dependent on variations of photosynthetic parameters among investigated plants: A meta-analysis. Remote Sens. 2018, 10, 771. [Google Scholar]
  45. Sukhova, E.; Sukhov, V. Relation of photochemical reflectance indices based on different wavelengths to the parameters of light reactions in photosystems I and II in pea plants. Remote Sens. 2020, 12, 1312. [Google Scholar] [CrossRef] [Green Version]
  46. Qin, J.; Dong, W.Y.; He1, K.N.; Yu, Y.; Tan, G.D.; Han, L.; Dong, M.; Zhang, Y.Y.; Zhang, D.; Li, A.Z.; et al. NaCl salinity-induced changes in water status, ion contents and photosynthetic properties of Shepherdia argentea (Pursh) Nutt. Seedlings. Plant Soil Environ. 2010, 56, 325–332. [Google Scholar] [CrossRef] [Green Version]
  47. Zahid, A.; Abbas, H.T.; Imran, M.A.; Qaraqe, K.A.; Alomainy, A.; Cumming, D.R.S.; Abbasi, Q.H. Characterization and water content estimation method of living plant leaves using terahertz waves. Appl. Sci. 2019, 9, 2781. [Google Scholar] [CrossRef] [Green Version]
  48. Meguekam, T.L.; Moualeu, D.P.; Taffouo, V.D.; Stützel, H. Changes in plant growth, leaf relative water content and physiological traits in response to salt stress in peanut (Arachis hypogaea L.) varieties. Not. Bot. Horti Agrobot. Cluj-Napoca 2021, 49, 12049. [Google Scholar] [CrossRef]
  49. Peňuelas, J.; Piňol, J.; Ogaya, R.; Filella, I. Estimation of plant water concentration by the reflectance Water Index WI (R900/R970). Int. J. Remote Sens. 1997, 18, 2869–2875. [Google Scholar] [CrossRef]
  50. Maxwell, K.; Johnson, G.N. Chlorophyll fluorescence—A practical guide. J. Exp. Bot. 2000, 51, 659–668. [Google Scholar] [CrossRef]
  51. Kalaji, H.M.; Schansker, G.; Ladle, R.J.; Goltsev, V.; Bosa, K.; Allakhverdiev, S.I.; Brestic, M.; Bussotti, F.; Calatayud, A.; Dabrowski, P.; et al. Frequently asked questions about in vivo chlorophyll fluorescence: Practical issues. Photosynth. Res. 2014, 122, 121–158. [Google Scholar]
  52. Sukhova, E.; Kior, D.; Kior, A.; Yudina, L.; Zolin, Y.; Gromova, E.; Sukhov, V. New normalized difference reflectance indices for estimation of soil drought influence on pea and wheat. Remote Sens. 2022, 14, 1731. [Google Scholar] [CrossRef]
  53. Eitel, J.U.H.; Long, D.S.; Gessler, P.E.; Hunt, E.R. Combined spectral index to improve ground-based estimates of nitrogen status in dryland wheat. Agron. J. 2008, 100, 1694–1702. [Google Scholar] [CrossRef] [Green Version]
  54. Shrivastava, P.; Kumar, R. Soil salinity: A serious environmental issue and plant growth promoting bacteria as one of the tools for its alleviation. Saudi J. Biol. Sci. 2015, 22, 123–131. [Google Scholar] [PubMed] [Green Version]
  55. Volkov, V. Salinity tolerance in plants. Quantitative approach to ion transport starting from halophytes and stepping to genetic and protein engineering for manipulating ion fluxes. Front. Plant Sci. 2015, 6, 873. [Google Scholar] [PubMed]
  56. Pan, T.; Liu, M.; Kreslavski, V.D.; Zharmukhamedov, S.K.; Nie, C.; Yu, M.; Kuznetsov, V.V.; Allakhverdiev, S.I.; Shabala, S. Non-stomatal limitation of photosynthesis by soil salinity. Crit. Rev. Environ. Sci. Technol. 2021, 51, 791–825. [Google Scholar] [CrossRef]
  57. Tokarz, K.M.; Wesołowski, W.; Tokarz, B.; Makowski, W.; Wysocka, A.; Jędrzejczyk, R.J.; Chrabaszcz, K.; Malek, K.; Kostecka-Gugała, A. Stem photosynthesis—A key element of grass pea (Lathyrus sativus L.) acclimatisation to salinity. Int. J. Mol. Sci. 2021, 22, 685. [Google Scholar] [CrossRef] [PubMed]
  58. Farooq, M.; Hussain, M.; Wakeel, A.; Siddique, K.H.M. Salt stress in maize effects resistance mechanisms and management: A review. Agron. Sustain. Dev. 2015, 35, 461–481. [Google Scholar]
  59. Kromdijk, J.; Głowacka, K.; Leonelli, L.; Gabilly, S.T.; Iwai, M.; Niyogi, K.K.; Long, S.P. Improving photosynthesis and crop productivity by accelerating recovery from photoprotection. Science 2016, 354, 857–861. [Google Scholar] [CrossRef] [Green Version]
  60. Ahmed, S.; Ahmed, S.; Roy, S.K.; Woo, S.H.; Sonawane, K.D.; Shohael, A.M. Effect of salinity on the morphological, physiological and biochemical properties of lettuce (Lactuca sativa L.) in Bangladesh. Open Agric. 2019, 4, 361–373. [Google Scholar]
  61. Wang, L.; Qu, J. NMDI: A normalized multi-band drought index for monitoring soil and vegetation moisture with satellite remote sensing. Geophys. Res. Lett. 2007, 34, L20405. [Google Scholar] [CrossRef]
  62. Nyongesah, M.J.; Wang, Q.; Li, P. Effectiveness of photochemical reflectance index to trace vertical and seasonal chlorophyll a/b ratio in Haloxylon ammodendron. Acta Physiol. Plant. 2015, 37, 2. [Google Scholar] [CrossRef]
  63. Šebela, D.; Quiñones, C.; Olejníčková, J.; Jagadish, K.S.V. Temporal chlorophyll fluorescence signals to track changes in optical properties of maturing rice panicles exposed to high night temperature. Field Crop. Res. 2015, 177, 75–85. [Google Scholar] [CrossRef]
  64. Pastor-Guzman, J.; Atkinson, P.; Dash, J.; Rioja-Nieto, R. Spatiotemporal variation in mangrove chlorophyll concentration using Landsat 8. Remote Sens. 2015, 7, 14530–14558. [Google Scholar] [CrossRef] [Green Version]
  65. Tian, J.; Wang, L.; Li, X.; Gong, H.; Shi, C.; Zhong, R.; Liu, X. Comparison of UAV and WorldView-2 imagery for mapping leaf area index of mangrove forest. Int. J. Appl. Earth Obs. Geoinform. 2017, 61, 22–31. [Google Scholar]
  66. Garbulsky, M.F.; Peñuelas, J.; Gamon, J.; Inoue, Y.; Filella, I. The photochemical reflectance index (PRI) and the remote sensing of leaf, canopy and ecosystem radiation use efficiencies. A review and meta-analysis. Remote Sens. Environ. 2011, 115, 281–297. [Google Scholar] [CrossRef]
  67. Yudina, L.; Sukhova, E.; Gromova, E.; Nerush, V.; Vodeneev, V.; Sukhov, V. A light-induced decrease in the photochemical reflectance index (PRI) can be used to estimate the energy-dependent component of non-photochemical quenching under heat stress and soil drought in pea, wheat, and pumpkin. Photosynth. Res. 2020, 146, 175–187. [Google Scholar] [CrossRef]
  68. Liu, C.; Liu, Y.; Guo, K.; Fan, D.; Li, G.; Zheng, Y.; Yu, L.; Yang, R. Effect of drought on pigments, osmotic adjustment and antioxidant enzymes in six woody plant species in karst habitats of southwestern China. Environ. Exp. Bot. 2011, 71, 174–183. [Google Scholar] [CrossRef]
  69. Christmann, A.; Grill, E.; Huang, J. Hydraulic signals in long-distance signaling. Curr. Opin. Plant Biol. 2013, 16, 293–300. [Google Scholar] [CrossRef]
  70. Mott, K.A. Effects of patchy stomatal closure on gas exchange measurements following abscisic acid treatment. Plant Cell Environ. 1995, 18, 1291–1300. [Google Scholar] [CrossRef]
  71. Yudina, L.; Sukhova, E.; Sherstneva, O.; Grinberg, M.; Ladeynova, M.; Vodeneev, V.; Sukhov, V. Exogenous abscisic acid can influence photosynthetic processes in peas through a decrease in activity of H+-ATP-ase in the plasma membrane. Biology 2020, 9, 324. [Google Scholar] [CrossRef] [PubMed]
  72. Sukhov, V.; Surova, L.; Morozova, E.; Sherstneva, O.; Vodeneev, V. Changes in H+-ATP synthase activity, proton electrochemical gradient, and pH in pea chloroplast can be connected with variation potential. Front. Plant Sci. 2016, 7, 1092. [Google Scholar] [CrossRef] [PubMed] [Green Version]
  73. Porcar-Castell, A.; Garcia-Plazaola, J.I.; Nichol, C.J.; Kolari, P.; Olascoaga, B.; Kuusinen, N.; Fernández-Marín, B.; Pulkkinen, M.; Juurola, E.; Nikinmaa, E. Physiology of the seasonal relationship between the photochemical reflectance index and photosynthetic light use efficiency. Oecologia 2012, 170, 313–323. [Google Scholar] [CrossRef] [PubMed]
  74. Wong, C.Y.S.; Gamon, J.A. Three causes of variation in the photochemical reflectance index (PRI) in evergreen conifers. New Phytol. 2015, 206, 187–195. [Google Scholar] [CrossRef] [PubMed]
  75. Rondeaux, G.; Steven, M.; Baret, F. Optimization of soil-adjusted vegetation indices. Remote Sens. Environ. 1996, 55, 95–107. [Google Scholar] [CrossRef]
  76. Kaufman, Y.J.; Tanré, D. Atmospherically resistant vegetation index (ARVI) for EOS-MODIS. IEEE Transact. Geosci. Remote Sens. 1992, 30, 261–270. [Google Scholar] [CrossRef]
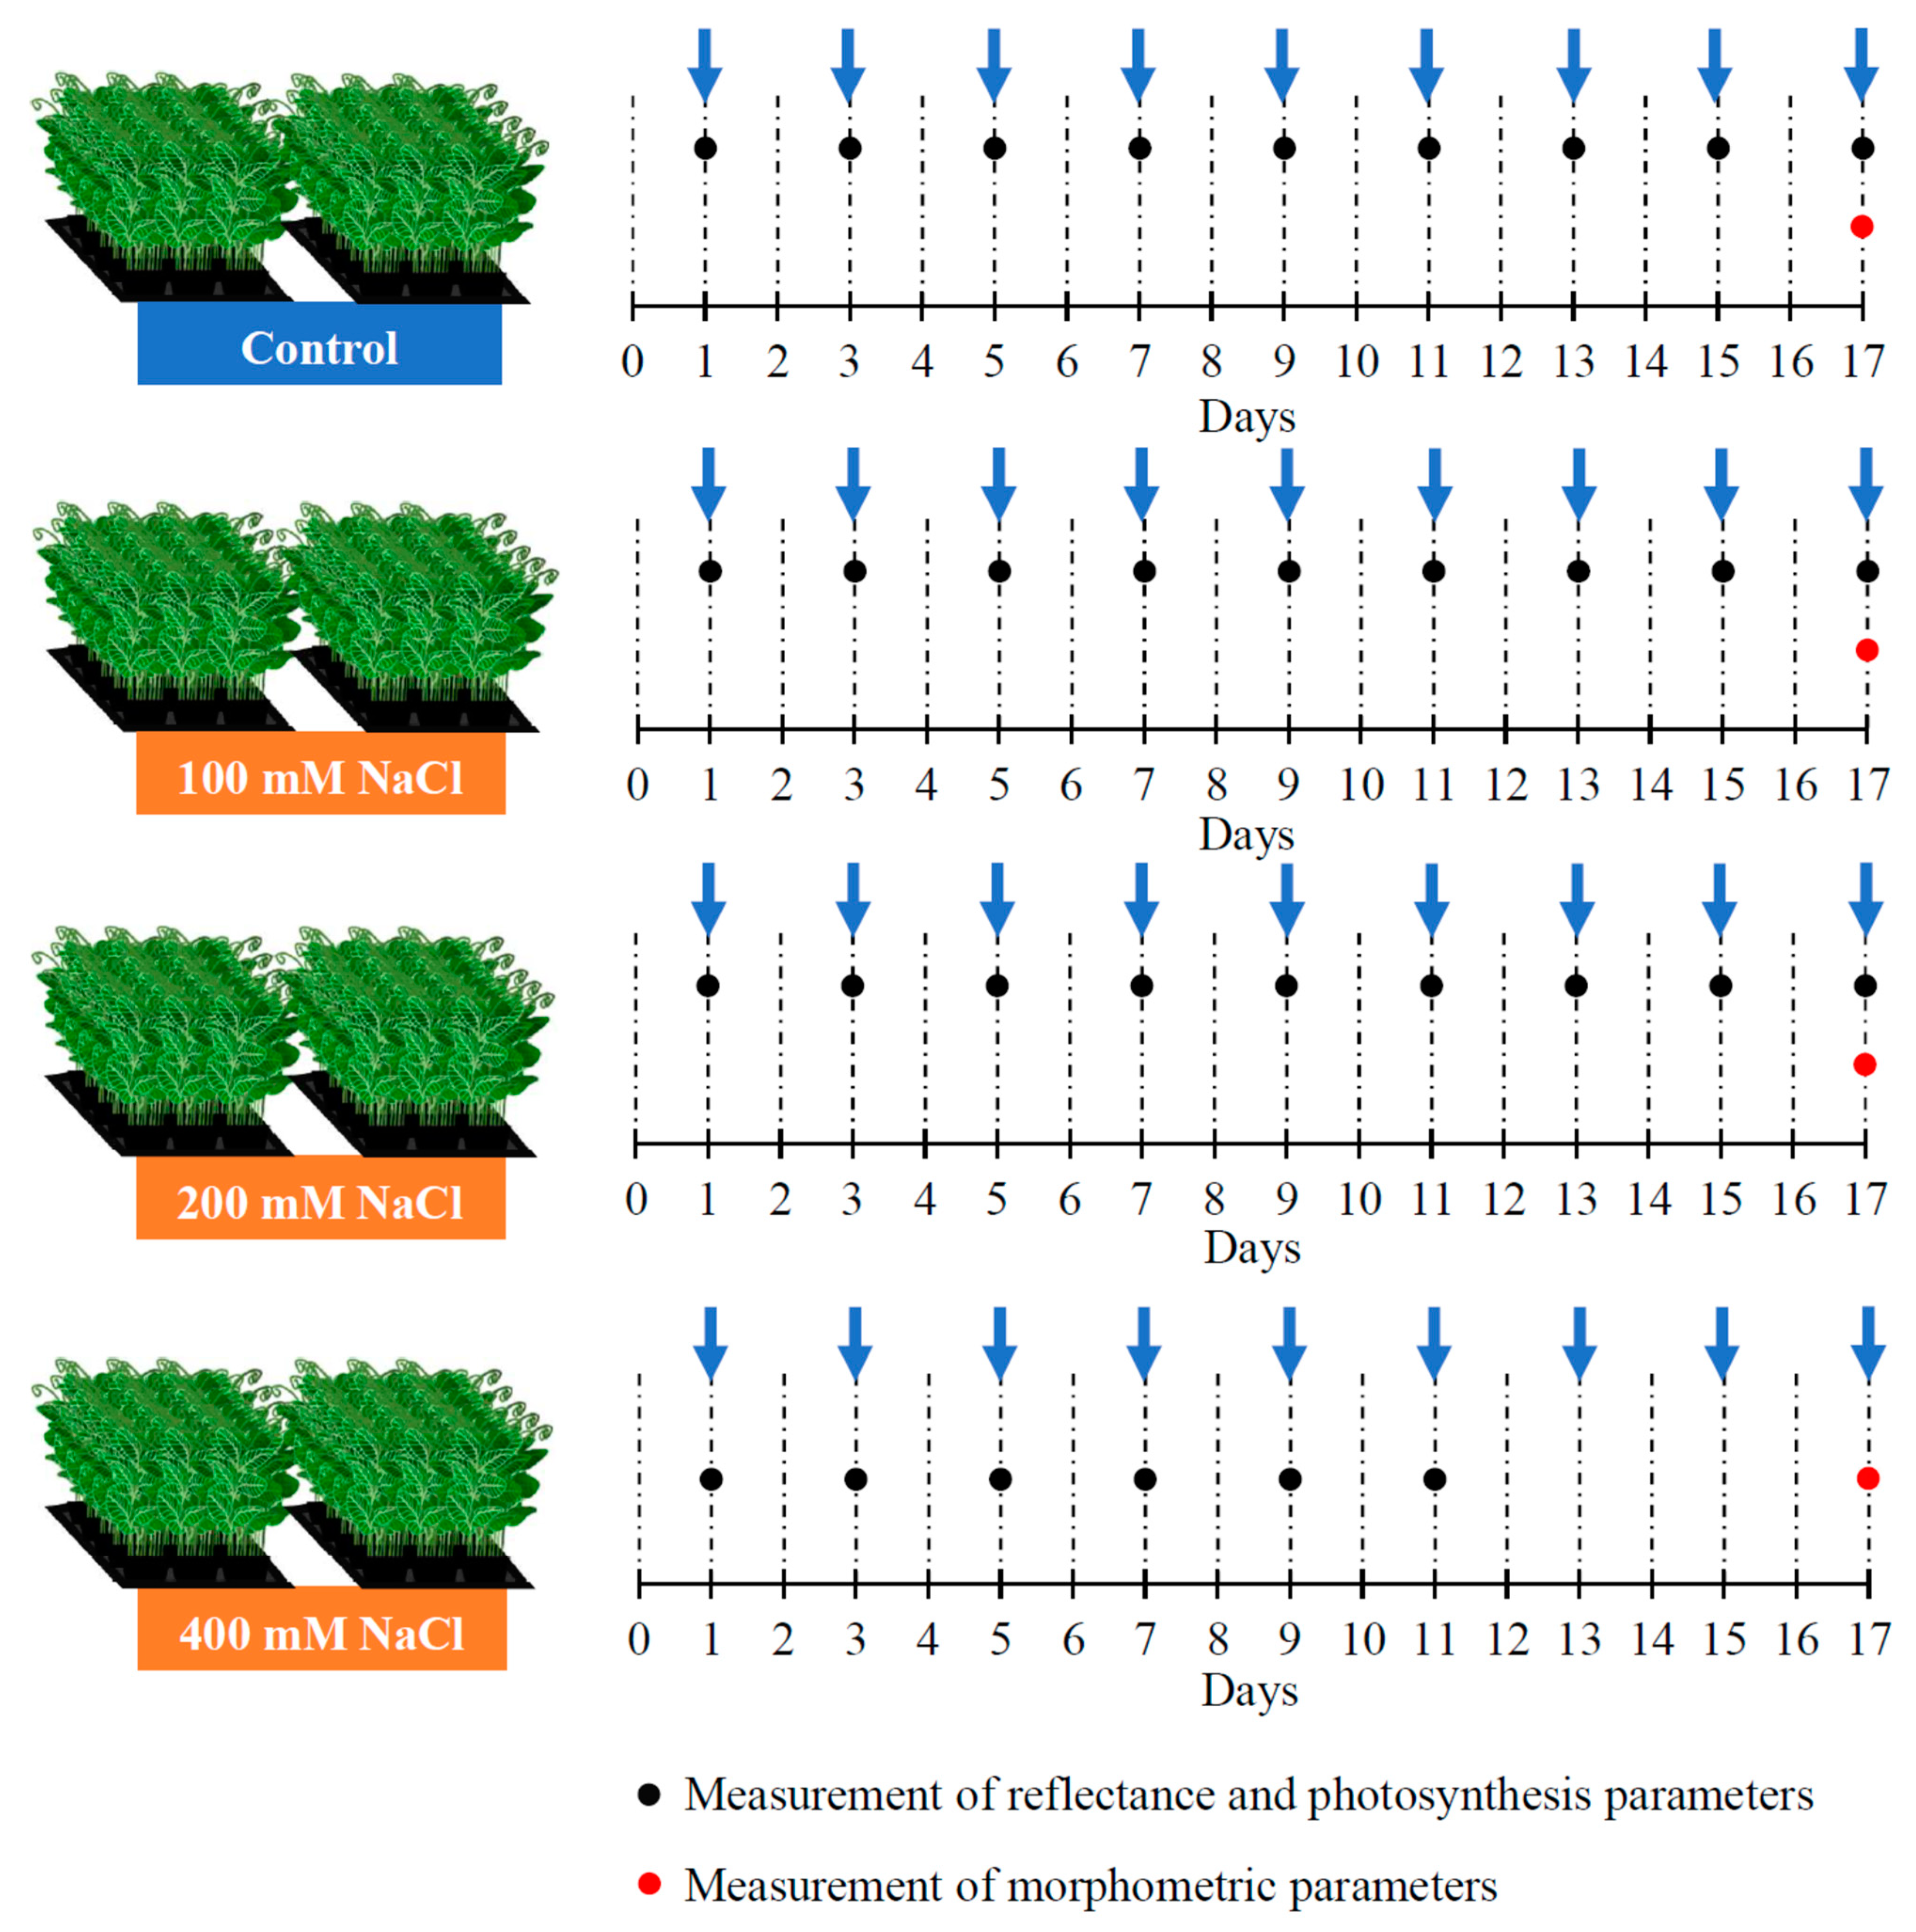
Figure 1. General scheme of experimental investigation of NaCl influence on plant reflectance indices, photosynthetic parameters, and morphometric parameters. Arrows shows days of irrigation.
Remotesensing 15 03772 g001
Figure 2. Dynamic of maximal quantum yield of photosystem II Fv/Fm in pea plants under control conditions and under the 100 mM, 200 mM, and 400 mM NaCl treatments (n = 90). Colored asterisks show differences between control values and values under the NaCl treatment (* p < 0.05; ** p < 0.01; *** p < 0.001).
Remotesensing 15 03772 g002
Figure 3. Dynamics of short-wavelength photochemical reflectance indices and typical photochemical reflectance index in pea plants under control conditions and under the 100 mM, 200 mM, and 400 mM salt treatments (n = 20). The dynamic of PRI(505, 570) (a), PRI(515, 570) (b), PRI(525, 570) (c), and PRI(531, 570) (d) are shown. Colored asterisks show differences between control values and values under the NaCl treatment (* p < 0.05; ** p < 0.01; *** p < 0.001).
Remotesensing 15 03772 g003
Figure 4. Dynamics of long-wavelength photochemical reflectance indices in pea plants under control conditions and under the 100 mM, 200 mM, and 400 mM salt treatments (n = 20). Dynamics of PRI(535, 570) (a), PRI(545, 570) (b), and PRI(555, 570) (c) are shown. Colored asterisks show differences between control values and values under the NaCl treatment (* p < 0.05; ** p < 0.01; *** p < 0.001).
Remotesensing 15 03772 g004
Figure 5. Scatter plots between the maximal quantum yield of photosystem II (Fv/Fm) and PRI(505, 570) (a), PRI(515, 570) (b), PRI(525, 570) (c), PRI(531, 570) (d), PRI(535, 570) (e), PRI(545, 570) (f), and PRI(555, 570) (g), and the dependence of the correlation coefficient between Fv/Fm and PRI(λ, 570) on λ (h). Values from Figure 2, Figure 3 and Figure 4 were used. *** p < 0.001 (n = 33).
Remotesensing 15 03772 g005
Figure 6. Dependences of ΔPRI(λ, 570) on λ in pea plants after 1 (a), 3 (b), 5 (c), and 7 (d) days of the NaCl treatment (n = 20). λ = 505, 515, 525, 531, 535, 545, and 555 nm. Colored asterisks show significant ΔPRI(λ, 570) in comparison to the zero value (* p < 0.05; ** p < 0.01; *** p < 0.001). The dotted line shows the zero value.
Remotesensing 15 03772 g006
Figure 7. Dependences of ΔPRI(λ, 570) on λ in pea plants after 9 (a), 11 (b), 13 (c), 15 (d), and 17 (e) days of the NaCl treatment (n = 20). λ = 505, 515, 525, 531, 535, 545, and 555 nm. Colored asterisks show significant ΔPRI(λ, 570) in comparison to the zero value (* p < 0.05; ** p < 0.01; *** p < 0.001). The dotted line shows the zero value.
Remotesensing 15 03772 g007
Figure 8. Dynamic of the NDVI in pea plant under control conditions and under the 100 mM, 200 mM, and 400 mM salt treatments (n = 20). Colored asterisks show differences between control values and values under the NaCl treatment (* p < 0.05; ** p < 0.01; *** p < 0.001).
Remotesensing 15 03772 g008
Figure 9. Scatter plots between the NDVI and PRI(505, 570) (a), PRI(515, 570) (b), PRI(525, 570) (c), PRI(531, 570) (d), PRI(535, 570) (e), PRI(545, 570) (f), and PRI(555, 570) (g) and the dependence of the correlation coefficient between the NDVI and PRI(λ, 570) on λ (h). Values from Figure 3, Figure 4 and Figure 8 were used. * p < 0.05; *** p < 0.001 (n = 33).
Remotesensing 15 03772 g009
Table 1. Influence of NaCl treatment on the fresh weight, dry weight, and relative water content in plants. Parameters were measured at the end of the experiment (n = 4–6). * p < 0.05; ** p < 0.01.
Control100 mM200 mM400 mM
Fresh weight, g/plant
Shoot8.9667 ± 0.65258.7225 ± 0.59735.46 ± 0.9186 *5.9175 ± 0.7951 *
Root1.558 ± 0.10812.685 ± 0.48492.1625 ± 0.21692.23 ± 0.2888
Shoot/root6.107 ± 0.48693.5693 ± 0.6498 *2.708 ± 0.6791 **2.8848 ± 0.6617 **
Dry weight, g/plant
Shoot1.554 ± 0.11501.3325 ± 0.12090.94 ± 0.1674 *0.9925 ± 0.1364 *
Root0.5183 ± 0.07990.9725 ± 0.1492 *0.7525 ± 0.09780.7950 ± 0.0733 *
Shoot/root2.8381 ± 0.43151.4626 ± 0.2583 *1.3333 ± 0.3073 *1.3076 ± 0.2622 *
100∙(FW − DW)/FW, %
Shoot84.0521 ± 0.803384.7797 ± 0.591782.4469 ± 2.318183.1452 ± 0.7204
Root63.2051 ± 2.563562.9846 ± 3.418965.4701 ± 1.496463.7730 ± 1.5847
Shoot/Root1.3297 ± 0.06031.3595 ± 0.08301.2589 ± 0.00971.3061 ± 0.0336
100∙(FW − DW)/DW, %
Shoot535.3393 ± 33.3253560.1756 ± 27.0936499.2681 ± 75.1091496.6323 ± 25.9917
Root176.8536 ± 18.3383176.1283 ± 21.5510191.2402 ± 12.5895177.5940 ± 11.8821
Shoot/root3.0207 ± 0.38803.3757 ± 0.55162.5668 ± 0.23322.8328 ± 0.2307
Table 2. The percentage of change in the modified and typical photochemical reflectance indices and the NDVI in comparison to control values on the 11th day for plants that were treated with the 400 mM NaCl solution, and on 17th day for plants that were treated with the 100 and 200 mM NaCl solutions (n = 20).
Reflectance Index100 mM200 mM400 mM
PRI(505, 570)9.6113.5642.45
PRI(515, 570)10.8413.7142.36
PRI(525, 570)20.128.9119.94
PRI(531, 570)10.66−28.24−89.39
PRI(535, 570)1.06−21.75−75.72
PRI(545, 570)−5.19−18.47−63.82
PRI(555, 570)−5.49−16.36−57.79
NDVI−3.55−7.65−27.48
Disclaimer/Publisher’s Note: The statements, opinions and data contained in all publications are solely those of the individual author(s) and contributor(s) and not of MDPI and/or the editor(s). MDPI and/or the editor(s) disclaim responsibility for any injury to people or property resulting from any ideas, methods, instructions or products referred to in the content.