Article

Scattering-Point-Guided RPN for Oriented Ship Detection in SAR Images

1
Suzhou Key Laboratory of Microwave Imaging, Processing and Application Technology, Suzhou 215128, China
2
Suzhou Aerospace Information Research Institute, Chinese Academy of Sciences, Suzhou 215128, China
3
Aerospace Information Research Institute, Chinese Academy of Sciences, Beijing 100094, China
4
School of Electronic, Electrical and Communication Engineering, University of Chinese Academy of Sciences, Beijing 100049, China
5
National Key Laboratory of Microwave Imaging Technology, Chinese Academy of Sciences, Beijing 100190, China
*
Author to whom correspondence should be addressed.
Remote Sens. 2023, 15(5), 1411; https://doi.org/10.3390/rs15051411
Submission received: 16 January 2023 / Revised: 26 February 2023 / Accepted: 28 February 2023 / Published: 2 March 2023
(This article belongs to the Special Issue Microwave Remote Sensing for Object Detection)

Abstract

:
Ship detection in synthetic aperture radar (SAR) images has attracted widespread attention due to its significance and challenges. In recent years, numerous detectors based on deep learning have achieved good performance in the field of SAR ship detection. However, ship targets of the same type always have various representations in SAR images under different imaging conditions, while different types of ships may have a high degree of similarity, which considerably complicates SAR target recognition. Meanwhile, the ship target in the SAR image is also obscured by background and noise. To address these issues, this paper proposes a novel oriented ship detection method in SAR images named SPG-OSD. First, we propose an oriented two-stage detection module based on the scattering characteristics. Second, to reduce false alarms and missing ships, we improve the performance of the network by incorporating SAR scattering characteristics in the first stage of the detector. A scattering-point-guided region proposal network (RPN) is designed to predict possible key scattering points and make the regression and classification stages of RPN increase attention to the vicinity of key scattering points and reduce attention to background and noise. Third, supervised contrastive learning is introduced to alleviate the problem of minute discrepancies among SAR object classes. Region-of-Interest (RoI) contrastive loss is proposed to enhance inter-class distinction and diminish intra-class variance. Extensive experiments are conducted on the SAR ship detection dataset from the Gaofen-3 satellite, and the experimental results demonstrate the effectiveness of SPG-OSD and show that our method achieves state-of-the-art performance.

Graphical Abstract

1. Introduction

Synthetic Aperture Radar (SAR) is a microwave imaging sensor with the ability to operate all day and is merely affected by weather conditions. Therefore, the SAR system has unique advantages in the application of various fields, and can play an essential role in high resolution earth observation [1]. With the development of SAR system techniques, a rising number of high-resolution images have been acquired, hence increasing the requirement for SAR image interpretation. Ship detection of SAR images is one of the important tasks and has great value for commercial and societal applications [2,3].
In conventional algorithms, detection and classification steps are separated into two independent and unrelated processes. Constant false alarm ratio (CFAR) is one of the most popular ship detectors and has been extensively studied [4]. It conducts statistical modeling of background clutter and detects anomalies that do not conform to the clutter distribution [5]. Meanwhile, ship classification is mostly based on feature extraction and matching technologies [6]. Bag of words (BOW)-based methods [7,8] and local feature descriptors [9] have been widely used for SAR image scene classification. There are also some studies that have used machine learning methods for classification, such as SVM [10] and KNN [11]. The hand-designed features extracted by these traditional algorithms rely on prior knowledge, and its performance can be affected by different sensors and complex environments.
With the development of deep learning, increasingly more end-to-end methods have been proposed and applied in different kinds of domains. The methods based on deep CNNs have also been introduced to the SAR field and have demonstrated excellent performance [12]. Compared with traditional ship detection methods represented by CFAR, CNN-based approaches have strong representation and automatic feature extraction capabilities under complex background conditions, which can produce more accurate results. Although these methods improve SAR detection performance, applying CNN-based algorithms to the field of SAR presents certain problems. In both near-shore and off-shore scenarios, ships in SAR images frequently have arbitrary orientations as a result of the SAR geometry acquisition [13]. In the field of computer vision, most methods employ the horizontal bounding box (HBB) to represent the location of objects. However, the HBBs introduce a large amount of background when detecting ships, which increases the difficulty of the algorithm in distinguishing the target from the background. Especially when detecting near-shore targets, the results of detection tend to be closer to other near-shore facilities due to the complex background. Ships are often densely docked in ports, resulting in severe target scattering interference and blurred target edges, as well as a great deal of overlap between HBBs, which interfere with each other in non-maximum suppression (NMS) processing, hence lowering the accuracy of detection [14]. To address these issues, oriented bounding box (OBB)-based methods indicate accurate orientation and effectively improve the performance of the object detection algorithm in the field of remote sensing [15,16,17].
Moreover, SAR images are different from optical images because of their different imaging mechanisms. Due to the huge domain differences between natural images and SAR images, the development of deep learning for object detection in SAR images has been limited. A single target in an SAR image is presented as a collection of discrete or isolated strong backscattering points. The ship targets typically have strong backscattering intensity, and show highlighting characteristics in SAR images [18]. Small differences between classes in SAR images lead to intractable difficulty in identifying different classes. These lead to the failure of some algorithms in detection by extracting optical features. Furthermore, the imaging characteristics of a target are related to parameters such as resolution, azimuth angle, and incident angle. The same target exhibits different characteristics under different conditions. On the one hand, ship targets are very similar to port facilities or disturbing noise under certain imaging conditions. On the other hand, the visual features learned by the convolutional neural network cannot adapt to the scattering changes of the target when the SAR imaging conditions, such as radar parameters, target characteristics and marine environment, change [19]. Both reasons result in missing ships and false alarms, as shown by the yellow ellipses and the blue ellipses in Figure 1. Therefore, it is necessary to reasonably utilize the scattering mechanism of the target to guide network adaptive feature learning.
To overcome the aforementioned difficulties, a new network (SPG-OSD) is proposed in this article for oriented ship detection in SAR images. We propose a unified detection algorithm for the characteristics of SAR images. Although anchor-free methods usually have simple pipelines and produce final detection results within a single stage, they are incapable of handling complicated scenes and situations without anchors and additional anchor-based refinement [20]. Consequently, our baseline is built on a two-stage detector with a series of improvements. The RPN of the baseline employs six parameters to regress the anchors and directly generates high-quality-oriented proposals in a nearly cost-free manner. The key scattering point is introduced into a region proposal network (RPN) to improve the performance of anchor boxes. As can be seen in Figure 1, the background noise is forecast to be the container ship, while the ship is predicted to be the background. One of the key factors is that RPN finds it challenging to effectively differentiate between foreground and background when using the two-stage target detection algorithm in first-stage prediction due to the characteristics of SAR imaging and complex environmental characteristics. Therefore, we use the key scattering points to guide the RPN network to extract the features near these points, achieving a better performance in foreground and background classification and anchor regression. Additionally, we apply supervised contrastive learning loss to the network to ease ship misclassification issues in SAR images. The loss can make RoI embeddings of the same category come as close together as possible, and embeddings of different categories as far apart as possible.
The main contributions of our work can be summarized as follows:
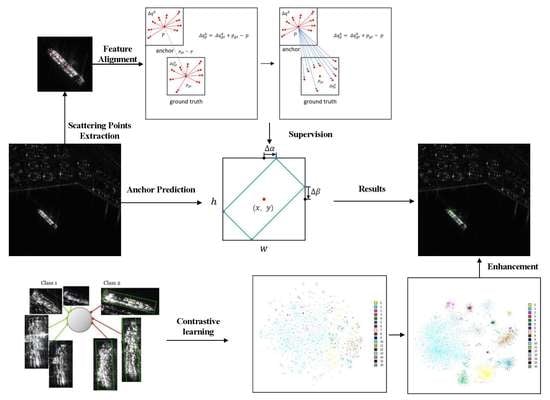
  • In this article, a novel method of ship detection named SPG-OSD in SAR images is proposed. According to the characteristics of SAR images, this method combines the features and distribution information of key scattering points to guide the network. The experiments with the dataset demonstrate the superiority of our methodology;
  • Key scattering points are innovatively used to guide RPN to solve the problem of foreground and background misclassification, which effectively alleviates the false alarm and missing ship. The Scattering-Point-Guided RPN (SPG RPN) can predict the position of key scattering points and apply location information to the deformable convolution module to better extract the features near the key scattering points;
  • In order to ease ship misclassification issues in SAR images, we augment a Region-of-Interest (RoI) head with a contrast branch where proposals are encoded as contrast features. RoI contrastive (RIC) loss is introduced into the ship detection network, which can enhance instance-level intra-class compactness and inter-class variance.

2. Related Works

2.1. Deep-Learning-Based Object Detection in SAR Images

Recently, deep convolutional neural networks (CNN) [21,22] have led to a series of breakthroughs in image classification [21] and object detection [23]. Deep-learning-based object detection frameworks can be primarily divided into two main streams: two-stage detectors and one-stage detectors. Two-stage detectors generally have great performance and stability by producing accurate bounding boxes, where region proposals are generated in the first stage and bounding box location regression and classification are completed in the second stage, such as R-CNN [23], Fast R-CNN [24], Faster R-CNN [25], and Cascade R-CNN [26]. Meanwhile, one-stage detectors have higher computational efficiency, such as SSD [27], YOLO [28,29,30], RetinaNet [31], and CornerNet [32]. Due to its potent capacity to automatically extract features, deep learning plays an increasingly significant role in the field of SAR object detection. Li et al. [33] utilized transfer learning, feature fusion, and hard negative mining to implement Faster RCNN on SAR images. Kang et al. [34] combined traditional and deep learning methods and used CFAR as the post-processing component of Faster RCNN to recalculate low-scoring bounding boxes in order to improve detection results. The framework proposed by Qian et al. [35] is based on Mask R-CNN and employs both Single-Mask and Multiple-Masks. Considering the speed and efficiency of a one-stage detector, there have also been studies [36,37,38] based on YOLO. Zhou et al. [38] proposed a lightweight YOLOv4 ship detection method that could significantly reduce the number of parameters while maintaining high precision. Zheng et al. [39] proposed a multi-features method with two parallel channels to extract, respectively, deep learning features and handcrafted features.
With advances in deep learning, some new techniques have been deployed in SAR object detection. Song et al. [40] used deformable convolutional networks (DCNs) [41] to extract features and introduce contrastive learning to compare the RoI features of original and augmented targets, which improved the robustness of the network to the change in target shape. Scattering points have recently been used in various studies [42,43,44] to guide networks in SAR object detection. Fu et al. [42] proposed an anchor-free network that applies key scattering points to guide network training and uses predicted key scattering point locations as offsets for deformable convolution modules. To prevent the discreteness of objects, Kang et al. [43] designed a framework composed of a scattering point relation module. Sun et al. [44] extracted strong scattering points by CFAR and utilized the scattering points to classify ships by a ship classification encoder module.

2.2. Oriented Object Detection

With the rapid development of deep learning networks in the field of remote sensing, many detectors based on oriented bounding box (OBB) have been proposed. RoI Transformer [45] spatially deforms the RoI and learns deformation parameters under the supervision of oriented-bounding-box (OBB) annotations. Gliding Vertex [46] initially identifies the horizontal box and then executes sliding (Gliding) on the horizontal box’s four fixed points to acquire the oriented box. CSL [47] converts the angle prediction assignment of regression into a classification task and provides a circular smooth labeling strategy for dealing with the periodicity of angles. R3Det [48] uses horizontal anchors in the first stage to increase speed and the number of proposals, then refines rotated anchors in the refinement stage to accommodate dense sceneries. S2ANet [49] employs an active rotation filter to encode orientation information and subsequently generates orientation-sensitive and orientation-invariant features to reduce the disparity between classification scores and localization precision. Oriented RepPoints [50] provides an effective adaptive point learning algorithm capable of capturing the geometric information of instances with various orientations for the detection of aerial objects. The first stage of Oriented R-CNN [51] adopts a simple oriented RPN structure, which is a lightweight, fully convolutional network with few parameters, and modifies the RPN regression branch output parameters from 4 to 6. To overcome the mismatch between the metric and the loss function, KFIoU [52] presents a skewed Intersection-over-Union (IoU) based on the Kalman filter.
Oriented object detection in SAR images has various applications, such as the detection of ships for maritime surveillance [53], the detection of bridges [54] and vehicles [55] for infrastructure inspection, and the detection of buildings for urban planning and disaster management [56]. The availability of new datasets, such as RSDD-SAR [57], has facilitated the development of rotated target detection algorithms with state-of-the-art performance. Recent studies [53,58,59] have demonstrated that polar encoding and multi-scale CNNs are examples of deep learning techniques that can be used to enhance the performance of oriented ship detection algorithms.

2.3. Improved RPN

In the present era of object detection, especially for complicated scenes, two-stage approaches have dominated the paradigm. In numerous anchor-based detectors, the method of generating anchors with a sliding window on feature maps is commonly utilized. A Region Proposal Network (RPN) was proposed by Faster RCNN to create object proposals, and a tiny fully convolutional network was utilized to map each sliding window anchor to a low-dimensional feature. Numerous studies have attempted to enhance the performance of RPN, a crucial component of two-stage detectors. In general, the result of one stage is used as the input for the subsequent stage, and a multi-step refinement is iteratively performed until a precise localization is achieved [60]. Zhong et al. [61] sequentially stacked two RPN sub-networks, with RPN 2 modified to take output proposals from RPN 1 as a reference. Siamese Cascaded RPN [62] employs a new feature transfer block based on deformable convolution to maximize the utilization of multilevel features for each RPN. Wang et al. [63] proposed a guided anchoring for RPN to build an adaptive shape bounding box via deformable convolution that could adapt to the changes in anchor geometry. Vu et al. [20] advocated the use of adaptive convolution to guide anchors and deploy a single anchor per place.

2.4. Contrastive Learning

Contrastive Learning (CL) is a discriminative method that seeks to learn an embedding space in which comparable sample pairs are close together and dissimilar sample pairs are far apart; it can be used in both supervised and unsupervised settings. To achieve this, the approach calculates the similarity of two embeddings using a loss function [64]. For computer vision applications, picture feature representations retrieved from the encoder are used to measure contrastive loss. Wang et al. [65] presented Dense Contrast Learning (DenseCL), an algorithm that enables self-supervised learning by maximizing the pixel-level pairwise contrast loss between two views of the input image. Momentum Contrast (MoCo) establishes a dynamic dictionary that keeps the sample properties in the queue as consistent as feasible. Chen et al. [66] recently developed self-supervised contrastive learning methods without the need for specialized architectures or memory banks. Instead of focusing on pixel-level information, the algorithm learns to construct representations that encode high-level properties that effectively differentiate across images. Khosla et al. [67] offered a new supervised loss, the optimization goal of which is to make the normalized embedding of the same label as close as possible, and the embedding of distinct labels as far away as possible.

3. Material and Methodology

3.1. Dataset

The dataset includes 30 panoramic SAR tiles of port areas from the Chinese Gaofen-3, which is a civilian SAR satellite. It is an extension of the dataset SRSDD-v1.0 [68] from 6 to 16 classes. Table 1 lists the details of the number of various ship types in the training dataset and test dataset. The dataset contains nearly identical data for six types of ships, such as the SRSDD-v1, namely ore-oil, Container, Fishing, LawEnforce, Dredger, and Cell-Container. Additionally, the original construction method of the dataset was used to include ten new types of ships. These original SAR images are in spotlight (SL) mode with a resolution of 1 m in range direction and azimuth, which provides 4632 SAR ships and consists of two different polarization methods (HH and VV), and have been cropped to 1024 × 1024 pixels slices. The annotation format refers to the format of the DOTA dataset [69]. The annotation uses a rotatable box for labeling through the coordinates of the four vertices of the box and cover sixteen different classes of ships. In addition, most of the images in the dataset contain nearshore areas with complex background interference, which greatly increases the challenge of ship detection.

3.2. Overview Network Structure

Our proposed method SPG-OSD is built on the two-stage detector, where the first stage generates high-quality oriented proposals, while the second stage refines the detections; the overall framework is shown in Figure 2. We establish our baseline and propose scattering-point-guided RPN and RoI contrastive loss for the network. ResNet50 is employed as the backbone to extract image features, whereas DCNv2 [70] is applied in the latter two stages to better extract the geometric features of ships and to expand the receptive field of convolution. The outputs of the backbone of the last four stages are denoted as { C 2 , C 3 , C 4 , C 5 }, and their relative downsampling ratios to the input image are {4, 8, 16, 32}. Our feature pyramid network (FPN) follows PANet [71], which can confuse multiscale information by combining high-level features of deep convolutional layers with low-level features of shallow convolutional layers and increase the capacity to localize small objects in SAR images. Specifically, after the downsampling process, the network upsamples the feature map of the convolutional layer and obtains the downsampled information of the same level through horizontal connections, which transfers the high-level semantic information to the low-level layer and utilizes the high-level semantic information to improve the detection effect of the low-level layer. The Bottom-up Path Augmentation module then transmits the low-level information upward, retaining the shallow-level feature information more effectively. The four levels of features { P 2 , P 3 , P 4 , P 5 } are obtained by FPN.
The RPN takes four levels of features { P 2 , P 3 , P 4 , P 5 } of FPN as input and adds a head of the same design (one 3 × 3 convolutional layer and two sibling 1 × 1 convolutional layers) for each feature level. The anchor is denoted by a 4-dimensional vector ( x , y ,   w , h ) and the oriented bounding box is denoted by a 6-dimensional vector ( x , y , w , h , Δ α , Δ β ) , where ( x , y ) are the center coordinates, and w and h are the width and height of the outer rectangle. Δ α and Δ β are the offsets from the top and right midpoints of the outer rectangle, as shown in Figure 3. Fixed-size features are extracted from each oriented proposal using rotated RoI Alignment, which projects the oriented rectangular onto the feature map. In the classification branch, we use Equlization Loss v2 [72] to alleviate the long-tail problem of SAR datasets. The loss increases the weight of positive gradients and decreases the weight of negative gradients based on their accumulated positive-to-negative gradient ratio.

3.3. Scattering-Point-Guided RPN

3.3.1. Scattering Point Extraction

The SAR image is the transformation between the ground points at the resolution unit scale and the image points at the pixel scale by the SAR system. The main content of the transformation is to convert the echo of the ground point into the image intensity, so the image intensity reflects the structural scattering characteristics of the target. Therefore, we use scattering feature points to guide the RPN so that the network can better adapt to changes in SAR imaging conditions. Since data augmentation is used during the training phase (see Section 4.2 for details), the scatter features are extracted on the data augmented images. After converting the ground truth from the oriented box to the horizontal box and cropping the ground truth from images, we extract feature points that reflect their scattering distributions via the Harris corner detector [73] in the ground truth box of each ship target. In order to more accurately locate the true corners without missing them, points with a response value greater than 0.01 times the maximum response value are considered feature points. Then, when the number of feature points in a ground truth is more than 20, we cluster the feature points into 9 categories through K-means, and the center points of the cluster are defined as the key scattering points, the locations of which contain the structural features of different ships and are insensitive to changes in SAR imaging conditions, as shown in Figure 4. If there are less than 20 feature points in a ground truth, the nine points with the highest response value are chosen as key scattering points. The offsets of the nine key scattering points in each ground truth box with reference to the ground truth center point coordinate p g t are represented as { Δ q g t k k = 1 , , 9 } 1 × 18 and the key scattering point locations map Q g t ( H / s ) × ( W / s ) × 18 (   s is the output stride) is composed by the offsets { Δ q g t k k = 1 , , 9 } in the corresponding ground truth box assigned to each anchor box.

3.3.2. Feature Alignment

Nonetheless, the offsets utilized during network training diverge from those employed in the ground truth, since they are determined with respect to the anchor center point, as opposed to the ground truth center point. To account for this disparity, it becomes necessary to revise the offsets Δ q g t k in Q g t for each ground truth, so that they are associated with the position of the anchor center point p on the feature map { P i ,   i = 2 ,   3 ,   4 ,   5 } ( H / s ) × ( W / s ) × c   ( c is the output channel) by the following equation:
Δ q p k = Δ q g t k + p g t p ,
an illustration is shown in Figure 5. The key scattering point locations map S g t ( H / s ) × ( W / s ) × 18 composed by the updated offsets Δ q p k is obtained.
Then, a branch comprised of a 1 × 1 convolution and a 3 × 3 convolution is added to the RPN to predict the locations of key scattering points in each anchor box. At each location p in the map P i ( H / s ) × ( W / s ) × c , the offsets { Δ q k k = 1 , , 9 } 1 × 18 of 9 possible key scattering point locations from the current location are predicted and the offset map Q ( H / s ) × ( W / s ) × 18 is obtained. Since these locations are computed at different scales, the locations coordinates need to be restored to the original size:
x 2 = W w x 1 ,   y 2 = H h y 1
where ( W , H ) and ( w , h ) represent original size and scaled size, respectively. ( x 1 , y 1 ) and ( x 2 , y 2 ) represent the scaled coordinates of key scattering points in the offset map Q and the original coordinates, respectively. The final predicted key scattering point locations map S ( H / s ) × ( W / s ) × 18 is obtained by (2).

3.3.3. Loss Calculation and Feature Guidance

In order to better measure the similarity of the two point sets, we propose to use the Earth Mover’s distance (EMD) [74] as the loss to calculate the similarity between the predicted points N d × 9 × 2 , d = ( H / s ) × ( W / s ) by reshaping map S and referenced ground truth points N g t d × 9 × 2 , d = ( H / s ) × ( W / s ) by reshaping map S g t :
L s c a t t e r = d E M D ( N   , N g t ) = min ϕ : N N g t x i N x i ϕ ( x i ) 2 .
In fact, the chamfer distance (CD) [75] is another candidate method to evaluate the similarity between two sets of points. However, EMD captures geometry better than CD and can make full use of the information of each point in the point sets. Therefore, we choose to use EMD for key scattering point locations loss.
In a two-stage detector, RPN densely generates a large number of anchor boxes in the first stage and classifies the foreground and background. Due to the variety of imaging conditions and the presence of a substantial amount of interfering noise and artificial facilities in SAR images, particularly in the nearshore background, RPN is unable to generate effective anchor boxes and correctly differentiate foreground and background. As a result, we use the predicted key scattering point locations as the offset of the deformable convolution to make the RPN focus on extracting features near the key scattering points. We can acquire offset map Q from the output of the key scattering point prediction branch, and then apply deformable convolution Φ 3 × 3 to the four levels of feature P i with the offsets Δ q k in map Q . For each of the locations p on the feature map:
P i ( p ) = Φ 3 × 3 ( P i , { Δ q k } ) = k = 1 9 ω ( Δ q k ) P i ( p + Δ q k )
where ω is a set of learnable weights and P i is the scattering-point-guided feature map. After that, the classification and regression of RPN can have better performance. The improved RPN loss function is shown as follows:
L r p n = λ 1 L scatter + L r _ c l s + L r _ r e g
where λ 1 is a balancing parameter for L scatter and is set to 0.5 by default. L r _ c l s is the cross entropy loss and L r _ r e g is the Smooth L 1 loss.

3.4. RoI Contrastive Loss

Due to the similarity of different ship classes in SAR images, the detector frequently fails to classify. It is challenging to construct a robust classifier because of the small margins between the RoI features of different categories. To increase classification accuracy, we introduce a supervised contrastive learning strategy and propose the RoI contrastive loss for the network to learn more discriminative object embeddings. On the basis of the original classification head and location regression head, we add a supervised contrastive learning head in parallel and incorporate contrastive encoding loss into the iterative optimization loss function. Contrastive learning is applied to feature extraction between classes and within classes of the target, and the loss through cosine similarity is iteratively calculated to reduce intra-class differences and increase inter-class differences, improving the accuracy of classification. In a two-stage detector, the RPN inputs the extracted features from the backbone network, outputs region proposal candidates, and regresses the bounding box if the prediction contains an object. In a two-stage detector, the RPN inputs the features extracted by the backbone network and outputs region proposal candidates, while RoI head classifies each region proposal candidate and regresses the bounding box if the prediction contains an object. In the training pipeline, the RoI head feature extractor encodes the region proposals as vector embeddings f i 1024 . Then, the contrastive branch with a 2-layers multi-layer-perceptron (MLP) head encodes the RoI feature to contrastive feature v i D C , by default D C = 128, and is calculated as
v i = W 1 σ ( W 2 f i )
where W1 and W2 are trainable weights, and σ is an RELU function.
We then measure the similarity between object proposal representations of Rol features encoded in the contrast head, and optimize the contrast objective to maximize the consistency between object proposals from the same class and facilitate divergence of proposals from different classes. For a mini-batch containing N Rol box features { v i , u i , y i } i = 1 N , v i is the Rol feature encoded by the contrastive head of the i -th region proposal, u i is the lo score with the matched ground truth boxes, and y i is the label of ground truth. We compute the following loss function:
C = 1 N i = 1 N f ( u i ) L v i
v i   = 1 N y i 1 j = 1 2 N 𝟙 i j 𝟙 y i = y j log exp ( z i z j τ ) k = 1 N 𝟙 i k exp ( z i z k τ )
where N y i is the number of embeddings with the same label y i , and τ is the hyper-parameter temperature [76]. f ( u i ) controls whether the proposal is added to the loss calculation:
  f ( u i ) = I { u i ϕ }
by default ϕ = 0.5.
When calculating the differences in image features, cosine similarity is used for measurement. Cosine similarity employs the cosine value of the angle between the two vectors in the vector space as the measure of the difference between the two individuals. It is widely used in machine learning in high-dimensional space, such as face recognition based on cosine similarity and change detection of remote sensing images. The proposed feature map is encoded into 128 dimensions. In essence, these features belong to high-dimensional space. The cosine similarity algorithm converts these features into high-dimensional vectors. The value of the angle cosine between two vectors can indicate whether or not they point in the same direction. During the training phase, the contrastive loss is added to the loss of the entire network, resulting in the following final loss function:
  L = L r p n + L c l s + L r e g + λ 2 L R I C
where L c l s is the Equlization Loss v2 and L r e g is the Smooth L 1 loss. λ 2 is a balancing parameter for L RIC and is set as 0.2 in this article.

4. Results

4.1. Implementation Details

The experiments were implemented based on the MMRotate [77] codebase. Given the properties of the SAR image and the orientation of the vessel under examination, the data augmentation approach exclusively employs 90 and 180 degree rotations to augment the sample set. We set the hyper-parameter temperature as 0.1 and threshold φ as 0.5 in RoI contrastive loss. For RPN, an anchor with an IoU overlap with any ground-truth box is higher than 0.7, or an anchor with an IoU overlap with ground-truth box is the highest and with an IoU is higher than 0.3 are considered positive samples, and an anchor is marked as a negative sample when its IoU is lower than 0.3. The IoU threshold for NMS (non-maximum suppression) is set as 0.8. Due to the dense docking of ships in the port, Soft-NMS is used in the second stage of the detector and the IoU threshold is set as 0.1 in the testing phase. The model is trained on a single 48 GB NVIDIA RTX 8000 GPU with a batch size of four. We optimize the overall network with the SGD algorithm with a momentum of 0.9 and a weight decay of 0.005.

4.2. Evaluation Metric

In the experiments, widely used metrics including precision, recall, F1-score, and average precision (AP) are adopted to evaluate the performance of the detectors. The precision and recall are computed as follows:
precision = N TP N TP + N FP
recall = N TP N TP + N FN
where N TP , N FP , and N FN denote the number of true positives (TP), false positives (FP), and false negatives (FN), respectively. A detection box is typically labeled as TP if the IoU between the predicted box and the ground truth is above a threshold (generally set as 0.5). Otherwise, it is considered as FP that represents false alarms. A ground truth that has no matched detection box is regarded as FN that represents a missing ship. The F1-score is the harmonic mean of the precision and recall:
F 1 = 2 ×   Precision   ×   Recall     Precision   +   Recall  
All prediction results are sorted in descending order according to their detection confidence scores. The precision and recall are calculated at each threshold to obtain a precision-recall curve (PRC). The AP metric is defined as the integral under the corresponding PRC as:
AP = Precision | recall   = r
In this article, AP 0.5 is calculated at the IoU threshold of 0.5 and AP 0.75 is calculated at the IoU threshold of 0.75. The mean average precision (mAP) represents the mean AP of all categories and measures the detection ability of the trained model on all categories:
mAP = 1 N c i N c AP i
where N c is the number of categories and AP i is the AP of category i.

4.3. Comparison with Other Methods

To validate the effectiveness of SPG-OSD, we compared our method with eight oriented object detection methods for our dataset; Table 2 reports the detailed comparison results. These methods include: (1) Anchor-based one-stage object detectors: CSL [47], R3Det [48], S2ANet [49], and KFIoU [52]. (2) Anchor-free object detectors: Oriented RepPoints [50]. (3) Anchor-based two-stage object detectors: RoI Transformer [45], Gliding Vertex [46], and Oriented-RCNN [51]. The backbones were uniformly set to ResNet-50. Our method reaches 69.34% mAP and surpasses all comparison methods, which is very competitive compared to the current state-of-the-art methods. In addition, our baseline reaches 65.90% mAP, which also demonstrates the effectiveness of our improvement for the framework. SPG-OSD significantly increases AP 0.5 , AP 0.75 precision, recall, and F1 by more than 4.8%, 5.5%, 10.0%, 4.5%, and 9.5% over other methods, respectively. It is also worth mentioning that SPG-OSD still has a significant improvement under the strict metrics of AP 0.75 , indicating that the accuracy of detection location is greatly improved. Figure 6 shows the comparison between the detection results of Oriented RCNN and SPG-OSD proposed in this paper on our dataset. By comparison, our method shows immense superiority and significantly reduces false alarms and missing ships. SPG-OSD can effectively distinguish background noise and nearshore facilities, and also has a good performance in small object detection. To better demonstrate the experimental results, Figure 7 illustrates the confusion matrixes of Oriented-RCNN and SPG-OSD. The last column of the confusion matrix is the rate of missing ships, and the last row is the rate of targets with IoU less than the threshold, including inaccurate predictions and false alarms. Taking the first row in Figure 7b as an example, in all the boxes labeled as ore-oil, 71% were correctly identified as ore-oil, and 5%, 8%, 2%, and 2% were mistakenly identified as Container, Dredger, Type1, Type5, and 8% were not detected. The comparison shows that SPG-OSD has a remarkable improvement in LawEnforce, Type1, and Type5. Most of the other categories have also been improved to varying degrees. A small number of categories have a slight decrease, which is class equilibration due to long-tail loss. By comparing the last column, it can be found that that SPG-OSD substantially reduces the probability of Type1, Type4, and Type5 being recognized as background. The superiority and robustness of the proposed method in ship detection and classification in SAR images were verified through the comparison of a series of experimental results.

4.4. Ablation Studies

In this section, we conduct a series of ablation experiments on our dataset to analyze the effectiveness of each proposed component in SPG-OSD. The preliminary network (illustrated in Section 3.2) without SPG RPN and RIC loss is denoted as the baseline. We first evaluate the performance of the baseline, and then the SPG RPN and RIC loss based on the baseline are separately studied in detail. For fair comparison, all experiments are performed with the same settings and training strategy. The specific comparisons of experimental results are briefly reported in Table 3 and the comparisons of the confusion matrixes are presented in Figure 8.

4.4.1. Effect of Scattering-Point-Guided RPN

We first investigate the impact of the SPG RPN by adding it to the baseline. The results of the ablation experiments in the second row of Table 3 show that the SPG RPN module achieves comparable performance. The baseline with SPG RPN increases the precision, F1, AP 0.5 , and AP 0.75 by 5.9%, 5.2%, 2.1%, and 2.7% over the baseline, respectively. The greatest improvement among these metrics is found to be in precision, resulting in fewer false detections. Figure 8a,b shows that almost all categories have been improved with the help of SPG RPN. SPG RPN can predict the key scattering points near each anchor and enhance the feature extraction near the scattering points. The predicted key scattering point positions after feature alignment are used as the offsets of the deformable convolution module, which extracts feature maps before inputting the classification branch and the regression branch of RPN. Therefore, when the densely generated anchors are regressed in the first stage of the detector, most of the places that are likely to have ships will be predicted, and the classification accuracy of foreground and background will be improved. In the end, the number of ships that are not detected in the second stage of the network will be greatly reduced. To better illustrate the effect of the SPG RPN, we calculated the sum of the elements in each row of the channel dimension to generate a visual activation heatmap, shown in Figure 9. We utilized the confidence scores of the deformable convolution module of the SPG RPN and the convolution module of the baseline to draw a visualization of feature maps. We used the HSV color space to represent confidence scores, with orange and yellow representing high confidence scores and purple and magenta representing low confidence scores. We can observe that the baseline ignores an unobvious ship target in Figure 9b. Comparing Figure 9b,c, the proposed SPG RPN can make the targets prominent and enhance the saliency of the targets, and focus more on the targets and less on the background, which improves the ability of the network to discriminate between objects and background in SAR images.

4.4.2. Effect of RoI Contrastive Loss

In the third row of Table 3, the results of the ablation experiments indicate that the RIC loss has increased by 0.0117 for AP 0.5 , 0.0265 for AP 0.75 , 0.048 for F1, and 0.0557 for precision compared to the baseline. Figure 8a,c shows significant improvement in ore-oil, which is different from SPG RPN. From the confusion matrix, the misclassification of the ore-oil, Dredger, Cell-Container, and Type2 into other categories is reduced. RIC loss increases the inter-class distance and reduces the intra-class distance through contrastive supervised learning, which makes the proposal features extracted by the network more discriminative. In the ship detection of SAR images, a portion of a certain ship is frequently predicted as ships of other categories, resulting in the detection result for a ship containing bounding boxes of multiple categories. For instance, the baseline predicts a part of Cell-Container as ore-oil in Figure 10a, and predicts ore-oil as Cell-Container after adding ore-oil to a larger outer contour in Figure 10c. This is caused by the lack of discrimination in the learned ship features and the inability to remove redundant bounding boxes during NMS processing. In comparison, RIC loss effectively reduces false alarms, especially when multiple bounding boxes overlap in Figure 10. t-SNE visualization of object proposal embeddings confirms the effectiveness of the RIC loss in reducing intra-class variance and forming sharper decision boundaries, as shown in Figure 11. The majority of categories shift from a dispersed distribution to a clustered distribution. The experimental outcomes corresponded well with our anticipations.

5. Discussion

The experimental results of our dataset and comparisons with other state-of-the-art object detection algorithms demonstrate the superiority of the proposed method. The performance of orientated ship detection in SAR images can be significantly improved with the implementation of either our proposed SPG RPN or RIC loss. The results show that SPG-OSD significantly reduces false alarms and missing ships, while improving the accuracy of detection location. The proposed method is effective in distinguishing background noise and nearshore facilities, and also performs well in small object detection. However, there are also some drawbacks to the proposed method. First, the use of key scattering points for feature extraction may not be effective in certain scenarios where there are no clear scattering points. Second, in scenarios where there is a need for real-time detection, anchor-free methods may be more suitable than the proposed anchor-based method. Third, these two modules (SPG RPN RIC loss) have distinct effects on the network, as evidenced by their distinct loss weights. In our tests, we employed default values to make the loss proportional to other baseline losses. The impact of the loss of weight of the two modules on the network needs to be investigated in greater detail. Additionally, the two modules are deployed at different stages in the detector and prioritize distinct optimizations. When back-propagating, the loss gradients of two stages in a two-stage detector may be influenced by one another. If the RPN and R-CNN components could be decoupled, the results might be improved. On the other hand, the methods used in this research could potentially be improved. SPG RPN introduces a key scattering point mechanism to improve the performance of the RPN in target detection in SAR images. In effect, there is geometric structure information for the distribution of key scattering points of a target. Key scattering points of ships of the same category have comparable topology structure, which can also be confirmed by the similar distribution of key scattering points of the two Containers in Figure 4c,d. Therefore, we can further apply the scattering point topology structure to improve the accuracy of ship classification in SAR images in the future.

6. Conclusions

In this paper, we proposed a novel method named Scattering-Point-Guided RPN for Oriented Ship Detection (SPG-OSD) in SAR images. The proposed method addresses the challenges of ship detection in SAR images, such as the various representations of ship targets and obscuration by background and noise. The proposed method consists of a two-stage detector with a scattering-point-guided RPN and RoI contrastive loss. The first stage generates high-quality oriented proposals, while the second stage refines the detections. The scattering-point-guided RPN is designed to predict the key scattering points and guide the RPN network to extract features near these points. The key scattering point is applied on the RPN to enhance adaptability to SAR imaging conditions and the discrimination of foreground and background, which establishes the connection between key scattering points and the geometric features. Furthermore, the RoI contrastive loss aims to improve discrimination between different categories by reducing the margin of RoI features within the same class and increasing the margin of RoI features between different classes. Extensive experiments on the Gaofen-3 satellite SAR ship detection dataset demonstrate that SPG-OSD achieves state-of-the-art performance in ship detection. The results show the excellent performance and superiority of our method in comparison to other methods. The effectiveness of our innovation, including scattering-point-guided RPN and RoI contrastive loss, is demonstrated in ablation experiments, and it is more robust to various imaging conditions and cluttered backgrounds. The proposed SPG-OSD method shows promising results for oriented ship detection in SAR images, and it can be potentially applied to other fields, such as land use classification and object detection in SAR images.

Author Contributions

Conceptualization, Y.Z. and D.L.; Methodology, Y.Z.; Software, Y.Z. and D.L.; Validation, D.L.; Formal analysis, Y.Z. and D.L.; Investigation, Y.Z.; Resources, X.Q. and F.L.; Writing—original draft preparation, Y.Z.; Writing—review and editing, Y.Z., X.Q. and F.L.; Visualization, Y.Z.; Supervision, F.L.; Project administration, X.Q.; Funding acquisition, X.Q. All authors have read and agreed to the published version of the manuscript.

Funding

This work was supported by the National Natural Science Foundation of China (No. 61991421 and No. 62022082).

Data Availability Statement

The majority of the dataset is available at https://github.com/HeuristicLU/SRSDD-V1.0.

Conflicts of Interest

The authors declare no conflict of interest.

References

  1. Snapir, B.; Waine, T.W.; Biermann, L. Maritime Vessel Classification to Monitor Fisheries with SAR: Demonstration in the North Sea. Remote Sens. 2019, 11, 353. [Google Scholar] [CrossRef] [Green Version]
  2. Leng, X.; Ji, K.; Zhou, S.; Xing, X.; Zou, H. An Adaptive Ship Detection Scheme for Spaceborne SAR Imagery. Sensors 2016, 16, 1345. [Google Scholar] [CrossRef] [PubMed] [Green Version]
  3. Zhang, T.; Zhang, X.; Li, J.; Xu, X.; Wang, B.; Zhan, X.; Xu, Y.; Ke, X.; Zeng, T.; Su, H.; et al. SAR Ship Detection Dataset (SSDD): Official Release and Comprehensive Data Analysis. Remote Sens. 2021, 13, 3690. [Google Scholar] [CrossRef]
  4. Kurekin, A.A.; Loveday, B.R.; Clements, O.; Quartly, G.D.; Miller, P.I.; Wiafe, G.; Adu Agyekum, K. Operational Monitoring of Illegal Fishing in Ghana through Exploitation of Satellite Earth Observation and AIS Data. Remote Sens. 2019, 11, 293. [Google Scholar] [CrossRef] [Green Version]
  5. Ai, J.; Yang, X.; Song, J.; Dong, Z.; Jia, L.; Zhou, F. An adaptively truncated clutter-statistics-based two-parameter CFAR detector in SAR imagery. IEEE J. Ocean. Eng. 2017, 43, 267–279. [Google Scholar] [CrossRef]
  6. Wu, F.; Wang, C.; Jiang, S.; Zhang, H.; Zhang, B. Classification of Vessels in Single-Pol COSMO-SkyMed Images Based on Statistical and Structural Features. Remote Sens. 2015, 7, 5511–5533. [Google Scholar] [CrossRef] [Green Version]
  7. Wang, J.; Yang, J.; Yu, K.; Lv, F.; Huang, T.; Gong, Y. Locality-constrained linear coding for image classification. In Proceedings of the 2010 IEEE Computer Society Conference on Computer Vision and Pattern Recognition (CVPR), San Francisco, CA, USA, 13–18 June 2010; pp. 3360–3367. [Google Scholar]
  8. Bahmanyar, R.; Cui, S.; Datcu, M. A comparative study of bag-of-words and bag-of-topics models of EO image patches. IEEE Geosci. Remote. Sens. Lett. 2015, 12, 1357–1361. [Google Scholar] [CrossRef] [Green Version]
  9. Gu, M.; Wang, Y.; Liu, H.; Wang, P. PolSAR Ship Detection Based on a SIFT-like PolSAR Keypoint Detector. Remote Sens. 2022, 14, 2900. [Google Scholar] [CrossRef]
  10. Hwang, J.-I.; Jung, H.-S. Automatic Ship Detection Using the Artificial Neural Network and Support Vector Machine from X-Band Sar Satellite Images. Remote Sens. 2018, 10, 1799. [Google Scholar] [CrossRef] [Green Version]
  11. Ji, Y.; Zeng, P.; Zhang, W.; Zhao, L. Forest Biomass Inversion based on KNN-FIFS with Different Alos Data. In Proceedings of the 2021 IEEE International Geoscience and Remote Sensing Symposium (IGARSS), Brussels, Belgium, 12–16 July 2021; pp. 4540–4543. [Google Scholar]
  12. Chen, S.; Wang, H. SAR target recognition based on deep learning. In Proceedings of the 2014 International Conference on Data Science and Advanced Analytics (DSAA), Shanghai, China, 30 October–1 November 2014; pp. 541–547. [Google Scholar]
  13. Chen, S.; Zhang, J.; Zhan, R. R2FA-Det: Delving into High-Quality Rotatable Boxes for Ship Detection in SAR Images. Remote Sens. 2020, 12, 2031. [Google Scholar] [CrossRef]
  14. Zhao, X.; Zhang, B.; Tian, Z.; Xu, C.; Wu, F.; Sun, C. An Anchor-Free Method for Arbitrary-Oriented Ship Detection in SAR Images. In Proceedings of the 2021 SAR in Big Data Era (BIGSARDATA), Nanjing, China, 22–24 September 2021; pp. 1–4. [Google Scholar]
  15. Han, J.; Ding, J.; Xue, N.; Xia, G.-S. Redet: A rotation-equivariant detector for aerial object detection. In Proceedings of the IEEE/CVF Conference on Computer Vision and Pattern Recognition (CVPR), Virtual, 19–25 June 2021; pp. 2786–2795. [Google Scholar]
  16. He, B.; Zhang, Q.; Tong, M.; He, C. Oriented Ship Detector for Remote Sensing Imagery Based on Pairwise Branch Detection Head and SAR Feature Enhancement. Remote Sens. 2022, 14, 2177. [Google Scholar] [CrossRef]
  17. Xu, Z.; Gao, R.; Huang, K.; Xu, Q. Triangle Distance IoU Loss, Attention-Weighted Feature Pyramid Network, and Rotated-SARShip Dataset for Arbitrary-Oriented SAR Ship Detection. Remote Sens. 2022, 14, 4676. [Google Scholar] [CrossRef]
  18. Zhang, C.; Wang, C.; Zhang, H.; Zhang, B.; Tian, S. An efficient object-oriented method of Azimuth ambiguities removal for ship detection in SAR images. In Proceedings of the 2017 IEEE International Geoscience and Remote Sensing Symposium (IGARSS), Fort Worth, TX, USA, 23–28 July 2017; pp. 2275–2278. [Google Scholar]
  19. Sun, X.; Lv, Y.; Wang, Z.; Fu, K. SCAN: Scattering Characteristics Analysis Network for Few-Shot Aircraft Classification in High-Resolution SAR Images. IEEE Trans. Geosci. Remote. Sens. 2022, 60, 1–17. [Google Scholar] [CrossRef]
  20. Vu, T.; Jang, H.; Pham, T.X.; Yoo, C. Cascade RPN: Delving into High-Quality Region Proposal Network with Adaptive Convolution. In Proceedings of the Advances in Neural Information Processing Systems (NeurIPS), Vancouver, BC, Canada, 8–14 December 2019; Volume 32, pp. 15210–15219. [Google Scholar]
  21. Krizhevsky, A.; Sutskever, I.; Hinton, G.E. Imagenet classification with deep convolutional neural networks. Commun. ACM 2017, 60, 84–90. [Google Scholar] [CrossRef] [Green Version]
  22. LeCun, Y.; Boser, B.; Denker, J.S.; Henderson, D.; Howard, R.E.; Hubbard, W.; Jackel, L.D. Backpropagation applied to handwritten zip code recognition. Neural Comput. 1989, 1, 541–551. [Google Scholar] [CrossRef]
  23. Girshick, R.; Donahue, J.; Darrell, T.; Malik, J. Rich feature hierarchies for accurate object detection and semantic segmentation. In Proceedings of the IEEE Conference on Computer Vision and Pattern Recognition (CVPR), Columbus, OH, USA, 23–28 June 2014; pp. 580–587. [Google Scholar]
  24. Girshick, R. Fast R-CNN. In Proceedings of the IEEE International Conference on Computer Vision (ICCV), Santiago, Chile, 7–13 December 2015; pp. 1440–1448. [Google Scholar] [CrossRef]
  25. Ren, S.; He, K.; Girshick, R.; Sun, J. Faster R-CNN: Towards real-time object detection with region proposal networks. In Proceedings of the Advances in Neural Information Processing Systems 28 (NIPS 2015), Montreal, QC, Canada, 7–12 December 2015. [Google Scholar]
  26. Cai, Z.; Vasconcelos, N. Cascade r-cnn: Delving into high quality object detection. In Proceedings of the IEEE Conference on Computer Vision and Pattern Recognition (CVPR), Salt Lake City, UT, USA, 18–22 June 2018; pp. 6154–6162. [Google Scholar]
  27. Liu, W.; Anguelov, D.; Erhan, D.; Szegedy, C.; Reed, S.; Fu, C.-Y.; Berg, A.C. SSD: Single Shot MultiBox Detector. In Proceedings of the 14th European Conference on Computer Vision (ECCV), Amsterdam, The Netherlands, 11–14 October 2016; pp. 21–37. [Google Scholar]
  28. Redmon, J.; Divvala, S.; Girshick, R.; Farhadi, A. You only look once: Unified, real-time object detection. In Proceedings of the IEEE Conference on Computer Vision and Pattern Recognition (CVPR), Las Vegas, NV, USA, 26 June–1 July 2016; pp. 779–788. [Google Scholar]
  29. Redmon, J.; Farhadi, A. YOLO9000: Better, faster, stronger. In Proceedings of the IEEE Conference on Computer Vision and Pattern Recognition (CVPR), Honolulu, HI, USA, 21–26 July 2017; pp. 7263–7271. [Google Scholar]
  30. Redmon, J.; Farhadi, A. Yolov3: An incremental improvement. arXiv 2018, arXiv:1804.02767. [Google Scholar]
  31. Lin, T.-Y.; Goyal, P.; Girshick, R.; He, K.; Dollár, P. Focal loss for dense object detection. In Proceedings of the IEEE International Conference on Computer Vision (ICCV), Venice, Italy, 22–29 October 2017; pp. 2980–2988. [Google Scholar]
  32. Law, H.; Deng, J. Cornernet: Detecting objects as paired keypoints. In Proceedings of the European Conference on Computer Vision (ECCV), Munich, Germany, 8–14 September 2018; pp. 734–750. [Google Scholar]
  33. Li, J.; Qu, C.; Shao, J. Ship detection in SAR images based on an improved faster R-CNN. In Proceedings of the 2017 SAR in Big Data Era: Models, Methods and Applications (BIGSARDATA), Beijing, China, 13–14 November 2017. [Google Scholar]
  34. Kang, M.; Leng, X.; Lin, Z.; Ji, K. A modified faster R-CNN based on CFAR algorithm for SAR ship detection. In Proceedings of the 2017 International Workshop on Remote Sensing with Intelligent Processing (RSIP), Shanghai, China, 18–21 May 2017; pp. 1–4. [Google Scholar]
  35. Qian, Y.; Liu, Q.; Zhu, H.; Fan, H.; Du, B.; Liu, S. Mask R-CNN for object detection in multitemporal SAR images. In Proceedings of the 2019 10th International Workshop on the Analysis of Multitemporal Remote Sensing Images (MultiTemp), Shanghai, China, 5–7 August 2019; pp. 1–4. [Google Scholar]
  36. Tang, G.; Zhuge, Y.; Claramunt, C.; Men, S. N-YOLO: A SAR Ship Detection Using Noise-Classifying and Complete-Target Extraction. Remote Sens. 2021, 13, 871. [Google Scholar] [CrossRef]
  37. Sun, Z.; Leng, X.; Lei, Y.; Xiong, B.; Ji, K.; Kuang, G. BiFA-YOLO: A Novel YOLO-Based Method for Arbitrary-Oriented Ship Detection in High-Resolution SAR Images. Remote Sens. 2021, 13, 4209. [Google Scholar] [CrossRef]
  38. Zhou, L.-Q.; Piao, J.-C. A Lightweight YOLOv4 Based SAR Image Ship Detection. In Proceedings of the 2021 IEEE 4th International Conference on Computer and Communication Engineering Technology (CCET), Beijing, China, 13–15 August 2021; pp. 28–31. [Google Scholar]
  39. Zheng, T.; Wang, J.; Lei, P. Deep learning based target detection method with multi-features in SAR imagery. In Proceedings of the 2019 6th Asia-Pacific Conference on Synthetic Aperture Radar (APSAR), Xiamen, China, 26–29 November 2019; pp. 1–4. [Google Scholar]
  40. Song, T.; Kim, S.; Sohn, K. Shape-Robust SAR Ship Detection via Context-Preserving Augmentation and Deep Contrastive RoI Learning. IEEE Geosci. Remote. Sens. Lett. 2022, 19, 1–5. [Google Scholar] [CrossRef]
  41. Dai, J.; Qi, H.; Xiong, Y.; Li, Y.; Zhang, G.; Hu, H.; Wei, Y. Deformable convolutional networks. In Proceedings of the IEEE International Conference on Computer Vision, Venice, Italy, 22–29 October 2017; pp. 764–773. [Google Scholar]
  42. Fu, K.; Fu, J.; Wang, Z.; Sun, X. Scattering-keypoint-guided network for oriented ship detection in high-resolution and large-scale SAR images. IEEE J. Sel. Top. Appl. Earth Obs. Remote. Sens. 2021, 14, 11162–11178. [Google Scholar] [CrossRef]
  43. Kang, Y.; Wang, Z.; Fu, J.; Sun, X.; Fu, K. SFR-Net: Scattering feature relation network for aircraft detection in complex SAR images. IEEE Trans. Geosci. Remote. Sens. 2021, 60, 1–17. [Google Scholar] [CrossRef]
  44. Sun, Y.; Wang, Z.; Sun, X.; Fu, K. SPAN: Strong Scattering Point Aware Network for Ship Detection and Classification in Large-Scale SAR Imagery. IEEE J. Sel. Top. Appl. Earth Obs. Remote. Sens. 2022, 15, 1188–1204. [Google Scholar] [CrossRef]
  45. Ding, J.; Xue, N.; Long, Y.; Xia, G.-S.; Lu, Q. Learning RoI transformer for oriented object detection in aerial images. In Proceedings of the IEEE/CVF Conference on Computer Vision and Pattern Recognition (CVPR), Long Beach, CA, USA, 16–20 June 2019; pp. 2849–2858. [Google Scholar]
  46. Xu, Y.; Fu, M.; Wang, Q.; Wang, Y.; Chen, K.; Xia, G.-S.; Bai, X. Gliding vertex on the horizontal bounding box for multi-oriented object detection. IEEE Trans. Pattern Anal. Mach. Intell. 2020, 43, 1452–1459. [Google Scholar] [CrossRef] [PubMed] [Green Version]
  47. Yang, X.; Yan, J. Arbitrary-oriented object detection with circular smooth label. In Proceedings of the European Conference on Computer Vision (ECCV), Glasgow, UK, 23–28 August 2020; pp. 677–694. [Google Scholar]
  48. Yang, X.; Yan, J.; Feng, Z.; He, T. R3det: Refined single-stage detector with feature refinement for rotating object. In Proceedings of the AAAI Conference on Artificial Intelligence, Virtual, 2–9 February 2021; pp. 3163–3171. [Google Scholar]
  49. Han, J.; Ding, J.; Li, J.; Xia, G.-S. Align Deep Features for Oriented Object Detection. IEEE Trans. Geosci. Remote. Sens. 2021, 60, 1–11. [Google Scholar] [CrossRef]
  50. Li, W.; Chen, Y.; Hu, K.; Zhu, J. Oriented reppoints for aerial object detection. In Proceedings of the IEEE/CVF Conference on Computer Vision and Pattern Recognition (CVPR), New Orleans, LA, USA, 19–24 June 2022; pp. 1829–1838. [Google Scholar]
  51. Xie, X.; Cheng, G.; Wang, J.; Yao, X.; Han, J. Oriented R-CNN for object detection. In Proceedings of the IEEE/CVF International Conference on Computer Vision (ICCV), Montreal, QC, Canada, 11–17 October 2021; pp. 3520–3529. [Google Scholar]
  52. Yang, X.; Zhou, Y.; Zhang, G.; Yang, J.; Wang, W.; Yan, J.; Zhang, X.; Tian, Q. The KFIoU Loss for Rotated Object Detection. arXiv 2022, arXiv:2201.12558. [Google Scholar]
  53. He, Y.; Gao, F.; Wang, J.; Li, X. Learning Polar Encodings for Arbitrary-Oriented Ship Detection in SAR Images. IEEE J. Sel. Top. Appl. Earth Obs. Remote Sens. 2021, 14, 3846–3859. [Google Scholar] [CrossRef]
  54. Lu, H.; Wu, W.; Zhang, Q.; Huang, X.; Li, H.; Zhang, L. Deep Learning for the Detection of Bridges in Synthetic Aperture Radar Images. Remote Sens. 2019, 11, 830. [Google Scholar]
  55. Zhang, J.; Yang, Z.; Liu, H.; Li, Y.; Li, D.; Li, X. SAR Vehicle Detection with Double-Path Multi-Scale Object Detection Network. In Proceedings of the 2019 IEEE International Conference on Image Processing (ICIP), Taipei, Taiwan, 22–25 September 2019; pp. 2399–2403. [Google Scholar]
  56. Zhang, Y.; Cao, X.; Wang, M.; Dong, J.; Zhang, X. Building Extraction from High-Resolution SAR Images Based on Deep Convolutional Neural Networks. IEEE Trans. Geosci. Remote Sens. 2017, 55, 5668–5685. [Google Scholar]
  57. Xu, C.; Su, H.; Li, J.; Li, L.; Wang, P. RSDD-SAR: Rotated Ship Detection Dataset in SAR Images. J. Radars 2021, in press.
  58. Lu, H.; Zhang, Q.; Wu, W.; Li, H.; Zhang, L. Dual-Branch Dual-Resolution Network for Oriented Ship Detection in SAR Images. Remote Sens. 2020, 12, 837. [Google Scholar]
  59. Yang, L.; Song, Y.; Zhang, H.; Liu, S.; Gao, S.; Ma, Y. Ship Detection in SAR Images via Multi-Scale Convolutional Neural Networks. In Proceedings of the 2018 IEEE International Geoscience and Remote Sensing Symposium (IGARSS), Valencia, Spain, 22–27 July 2018; pp. 5943–5946. [Google Scholar]
  60. Gidaris, S.; Komodakis, N. Attend refine repeat: Active box proposal generation via in-out localization. arXiv 2016, arXiv:1606.04446. [Google Scholar]
  61. Zhong, Q.; Li, C.; Zhang, Y.; Xie, D.; Yang, S.; Pu, S.J.N. Cascade region proposal and global context for deep object detection. Neurocomputing 2020, 395, 170–177. [Google Scholar] [CrossRef] [Green Version]
  62. Fan, H.; Ling, H. Siamese cascaded region proposal networks for real-time visual tracking. In Proceedings of the IEEE/CVF Conference on Computer Vision and Pattern Recognition (CVPR), Long Beach, CA, USA, 16–20 June 2019; pp. 7952–7961. [Google Scholar]
  63. Wang, J.; Chen, K.; Yang, S.; Loy, C.C.; Lin, D. Region proposal by guided anchoring. In Proceedings of the IEEE/CVF Conference on Computer Vision and Pattern Recognition (CVPR), Long Beach, CA, USA, 16–20 June 2019; pp. 2965–2974. [Google Scholar] [CrossRef]
  64. Jaiswal, A.; Babu, A.R.; Zadeh, M.Z.; Banerjee, D.; Makedon, F.J.T. A survey on contrastive self-supervised learning. Technologies 2020, 9, 2. [Google Scholar] [CrossRef]
  65. Wang, X.; Zhang, R.; Shen, C.; Kong, T.; Li, L. Dense contrastive learning for self-supervised visual pre-training. In Proceedings of the IEEE/CVF Conference on Computer Vision and Pattern Recognition (CVPR), Virtual, 19–25 June 2021; pp. 3024–3033. [Google Scholar]
  66. Chen, T.; Kornblith, S.; Norouzi, M.; Hinton, G. A simple framework for contrastive learning of visual representations. In Proceedings of the International Conference on Machine Learning (ICML), Virtual, 13–18 July 2020; pp. 1597–1607. [Google Scholar]
  67. Khosla, P.; Teterwak, P.; Wang, C.; Sarna, A.; Tian, Y.; Isola, P.; Maschinot, A.; Liu, C.; Krishnan, D. Supervised contrastive learning. Adv. Neural Inf. Process. Syst. 2020, 33, 18661–18673. [Google Scholar]
  68. Lei, S.; Lu, D.; Qiu, X.; Ding, C. SRSDD-v1.0: A High-Resolution SAR Rotation Ship Detection Dataset. Remote Sens. 2021, 13, 5104. [Google Scholar] [CrossRef]
  69. Xia, G.-S.; Bai, X.; Ding, J.; Zhu, Z.; Belongie, S.; Luo, J.; Datcu, M.; Pelillo, M.; Zhang, L. DOTA: A large-scale dataset for object detection in aerial images. In Proceedings of the IEEE Conference on Computer Vision and Pattern Recognition (CVPR), Salt Lake City, UT, USA, 18–22 June 2018; pp. 3974–3983. [Google Scholar]
  70. Wang, R.; Shivanna, R.; Cheng, D.; Jain, S.; Lin, D.; Hong, L.; Chi, E. Dcn v2: Improved deep & cross network and practical lessons for web-scale learning to rank systems. In Proceedings of the Web Conference (WWW), Ljubljana, Slovenia, 19–23 April 2021; pp. 1785–1797. [Google Scholar]
  71. Liu, S.; Qi, L.; Qin, H.; Shi, J.; Jia, J. Path aggregation network for instance segmentation. In Proceedings of the IEEE Conference on Computer Vision and Pattern Recognition (CVPR), Salt Lake City, UT, USA, 18–22 June 2018; pp. 8759–8768. [Google Scholar]
  72. Tan, J.; Lu, X.; Zhang, G.; Yin, C.; Li, Q. Equalization loss v2: A new gradient balance approach for long-tailed object detection. In Proceedings of the IEEE/CVF Conference on Computer Vision and Pattern Recognition (CVPR), Virtual, 19–25 June 2021; pp. 1685–1694. [Google Scholar]
  73. Harris, C.G.; Stephens, M.J. A combined corner and edge detector. In Proceedings of the Alvey Vision Conference, Manchester, UK, 31 August–2 September 1988. [Google Scholar]
  74. Fan, H.; Su, H.; Guibas, L.J. A point set generation network for 3d object reconstruction from a single image. In Proceedings of the IEEE Conference on Computer Vision and Pattern Recognition (CVPR), Honolulu, HI, USA, 21–26 July 2017; pp. 605–613. [Google Scholar]
  75. Butt, M.A.; Maragos, P. Optimum Design of Chamfer Distance Transforms. IEEE Trans. Image Process. 1998, 7, 1477–1484. [Google Scholar] [CrossRef]
  76. Oord, A.v.d.; Li, Y.; Vinyals, O. Representation learning with contrastive predictive coding. arXiv 2018, arXiv:1807.03748. [Google Scholar]
  77. Zhou, Y.; Yang, X.; Zhang, G.; Wang, J.; Liu, Y.; Hou, L.; Jiang, X.; Liu, X.; Yan, J.; Lyu, C. Mmrotate: A rotated object detection benchmark using pytorch. In Proceedings of the 30th ACM International Conference on Multimedia (MM), Lisboa, Portugal, 10–14 October 2022. [Google Scholar]
Figure 1. Detection results of the common method. The green boxes, orange boxes, yellow ellipses, and blue ellipses represent the ground truth, detection objects, missing ships, and false alarms, respectively.
Remotesensing 15 01411 g001
Figure 2. Overall framework of the proposed detector. It consists of the backbone, the FPN, the scattering-point-guided RPN, the Rotated RoIAlign, and the contrastive head.
Remotesensing 15 01411 g002
Figure 3. The illustration of box-regression parameterization.
Remotesensing 15 01411 g003
Figure 4. Extracted key scattering points in a SAR image. (a,b) Origin SAR images of containers. (c,d) key scattering points.
Remotesensing 15 01411 g004
Figure 5. Illustration of the feature alignment. Δ q k is the predicted offset, Δ q g t k is the offset in the ground truth, and Δ q p k is the offset after feature alignment. p and p g t are anchor center point and ground truth center point, respectively.
Remotesensing 15 01411 g005
Figure 6. Comparison detection results of the Oriented-RCNN and our method. The yellow ellipses and blue ellipses represent the missing ships and false alarms, respectively. (a) Detection results of Oriented-RCNN. (b) Detection results of SPG-OSD.
Remotesensing 15 01411 g006aRemotesensing 15 01411 g006b
Figure 7. Visualization of the results by confusion matrixes of Oriented-RCNN and our method. The horizontal axis corresponds to the predicted label and the vertical axis corresponds to the ground-truth label, respectively. Rows or columns 1 to 17 correspond to ore-oil, Container, Fishing, LawEnforce, Dredger, Cell-Container, Type1-10, and background, respectively. (a) The confusion matrix of Oriented-RCNN. (b) The confusion matrix of SPG-OSD.
Remotesensing 15 01411 g007
Figure 8. Visualization of the results by confusion matrixes. The horizontal axis corresponds to the predicted label and the vertical axis corresponds to the ground-truth label, respectively. Rows or columns 1 to 16 correspond to ore-oil, Container, Fishing, LawEnforce, Dredger, Cell-Container, Type1-10, and background, respectively. (a) The confusion matrix of the baseline. (b) The confusion matrix of the baseline with the SPG RPN. (c) The confusion matrix of the baseline with the RIC Loss.
Remotesensing 15 01411 g008aRemotesensing 15 01411 g008b
Figure 9. Visualization of the confidence heatmaps. The yellow ellipse represents missing ship. (a) Ground truth in SAR image. (b) Visualization of confidence heatmap extracted by convolution in baseline without SPG RPN. (c) Visualization of confidence heatmap extracted by deformable convolution in SPG RPN (blue feature map in Figure 2).
Remotesensing 15 01411 g009
Figure 10. Detection results of the baseline without and with RIC Loss. The blue ellipse represents false alarm. (a,c) Detection results of the baseline. (b,d) Detection results of the baseline with RIC loss.
Remotesensing 15 01411 g010
Figure 11. t-SNE visualization of the object proposal embeddings of the baseline without and with RIC loss. (a) Proposal embeddings of the baseline. (b) Proposal embeddings of the baseline with RIC loss.
Remotesensing 15 01411 g011
Table 1. Statistics of the number of vessels of each type.
TargetTrain Dataset SizeTest Dataset Size
ore-oil14228
Container1744393
Fishing22946
LawEnforce203
Dredger18653
Cell-Container10328
Type1277
Type2268
Type3371149
Type44010
Type53110
Type614052
Type76818
Type8284119
Type94814
Type1017463
Total3633999
Table 2. Comparison with state-of-the-art methods.
MethodPrecisionRecallF1 A P 0.5 A P 0.75
Gliding Vertex0.29820.61970.40260.53190.1501
RoI Transformer0.43930.67300.53160.56080.1305
R3Det0.06330.67690.11580.40960.1479
CSL0.04650.63880.08670.27580.0756
S2ANet0.10930.72030.18980.57510.1459
KFIoU0.08310.83040.15110.53030.1852
Oriented RepPoints0.03430.89510.06610.48280.0951
Oriented-RCNN0.36650.74060.49030.64470.1885
Baseline (ours)0.38910.77170.51730.65900.2048
SPG-OSD (ours)0.46690.78590.58580.69340.2437
Table 3. Influence of each component in the proposed method.
SPG RPNRIC LossPrecisionRecallF1 A P 0.5 A P 0.75
××0.38910.77170.51730.65900.2048
×0.44860.77980.56960.68050.2319
×0.44480.77540.56530.67070.2313
0.46690.78590.58580.69340.2437
Disclaimer/Publisher’s Note: The statements, opinions and data contained in all publications are solely those of the individual author(s) and contributor(s) and not of MDPI and/or the editor(s). MDPI and/or the editor(s) disclaim responsibility for any injury to people or property resulting from any ideas, methods, instructions or products referred to in the content.

