Article

MCSGNet: A Encoder–Decoder Architecture Network for Land Cover Classification

1
Jiangsu Collaborative Innovation Center on Atmospheric Environment and Equipment Technology, Nanjing University of Information Science and Technology, Nanjing 210044, China
2
China Air Separation Engineering Co., Ltd., Hangzhou 310051, China
3
College of Information Science and Technology, Nanjing Forestry University, Nanjing 210037, China
*
Author to whom correspondence should be addressed.
Remote Sens. 2023, 15(11), 2810; https://doi.org/10.3390/rs15112810
Submission received: 12 April 2023 / Revised: 18 May 2023 / Accepted: 27 May 2023 / Published: 29 May 2023

Abstract

:
The analysis of land cover types is helpful for detecting changes in land use categories and evaluating land resources. It is of great significance in environmental monitoring, land management, land planning, and mapping. At present, remote sensing imagery obtained by remote sensing is widely employed in the classification of land types. However, most of the existing methods have problems such as low classification accuracy, vulnerability to noise interference, and poor generalization ability. Here, a multi-scale contextual semantic guidance network is proposed for the classification of land cover types by deep learning. The whole model combines an attention mechanism with convolution to make up for the limitation that the convolution structure can only focus on local features. In the process of feature extraction, an interactive structure combining attention and convolution is introduced in the deep layer of the network to fully extract the abstract information. In this paper, the semantic information guidance module is introduced in the cross-layer connection part, ensuring that the semantic information between different levels can be used for mutual guidance, which is conducive to the classification process. A multi-scale fusion module is proposed at the decoder to fuse the features between different layers and avoid loss of information during the recovery process. Experiments on two public datasets demonstrate that the suggested approach has higher accuracy than existing models as well as strong generalization ability.

1. Introduction

Nowadays, as remote sensing imaging technology continues to progress, remote sensing images have been frequently utilized in the description of urban and rural areas [1,2], change detection [3,4], and other fields [5,6,7,8]. Because the vast majority of remote sensing imagery is high-resolution and includes extensive and diversified information, correct interpretation of remote sensing images is particularly important. In the analysis and utilization of remote sensing imagery, the correct per-pixel classification is a very important part of identifying land cover types. The correct division of land cover types such as buildings, water, roads, and other types provides an important base for research in many domains, such as land planning, surveying, and mapping analysis [9,10,11].
The traditional methods used for land cover classification can be divided into thresholding, clustering, support vector machines, etc. [12,13]. These traditional methods are mostly feature-based, relying mainly on features designed by human experience, and use machine learning or probability models for calculation to achieve the classification of land types. For instance, Yuan et al. [14] calculated the spectral and texture properties of pictures using local spectral histograms and classified the pixels in the feature maps through weight estimation to achieve image segmentation. To extract surface information, Xu et al. [15] constructed a multi-level case-based reasoning model for classifying land cover types using feature selection and weight learning. Zhang [16] used support vector machine to extract coastlines by minimising errors and enhancing the properties of the geometric margins. Unfortunately, the above traditional methods are overly reliant on prior knowledge; although they perform well in small-sample image tasks, they have certain limitations due to the phenomenon of manual intervention in parameter adjustment.
With the growing maturity of remote sensing image technology, current developments are moving towards higher resolution and larger spans of time and space. As the resolution becomes higher, land cover types on the surface are becoming more and more complex [17,18,19], and various objects often interfere with each other for occupation of the land. For example, shadows cast by tall buildings on low-rise buildings are easily confused with the background. Forest land is covered by trees, and individual trees and orchards can be misclassified as forest land. Obstacles such as bridges and ships can cause errors in the final segmentation results, meaning that relying solely on manual feature extraction methods is far from meeting current requirements.
With the continuous development of deep learning, deep learning-based model are being used in various fields [20,21] such as hydrology, climate, remote sensing, and reallocation of land. All such deep learning-based algorithms can be successfully used in the field of remote sensing [22,23,24,25,26]. For example, Wang Tao [27] constructed a residual network based on global feature fusion for the segmentation of clouds and cloud shadows in remote sensing images. The segmentation accuracy of clouds and cloud shadows in images from the Sentinel-2 and Landsat-8 satellites reached 93.28%. Shengguang Chu [3] used the deep learning method to construct an aggregate network structure for the change detection task in remote sensing images, achieving a final detection accuracy of 83.47%. By improving the UNet3 + network to detect clouds and snow in remote sensing images, Meijie Yin [28] was able to effectively distinguish clouds and snow while avoiding interference from various information sources in remote sensing images, achieving a final segmentation accuracy of 81.74%. The efficiency of land cover tasks on larger samples has increased with the development of deep convolutional neural networks (DCNN). DCNNs can extract crucial feature data from the picture with stronger robustness. In 2014, a fully convolutional neural network (FCN) was originally developed by Long for pixel-level classification tasks [29] and achieved end-to-end pixel-level classification. The next year, Ronneberger et al. [30] constructed an encoder–decoder network structure (UNet) that inherited the idea of FCN. This network was able to achieve end-to-end pixel-level segmentation while performing well with limited data. Subsequently, Deep Convolutional Neural Networks (DCNN) have shown a rapidly developing trend in pixel-level classification tasks. Nowadays, the networks used for pixel-level classification can be loosely classified into two groups based on structure, one based on spatial pyramid pooling approaches such as PSPNet [31], and the DeepLab series [32,33,34,35], and the other using encoder–decoder structures such as UNet [30] and SegNet [36].
The thriving development of deep learning has led to its increasingly widespread application in land cover tasks [37,38]. Chen [39] developed a multi-level feature aggregation network to solve the problem of detail feature loss in deep convolutional networks, which was then used to realize the division of land types in high resolution satellite imagery. Pang [40] examined how real-time semantic segmentation techniques can be applied to land cover classification tasks, and proposed a lightweight real-time land coverage segmentation algorithm. Gao [41] studied the effect of multi-channel fusion technology in land cover classification tasks and used a three-way parallel structure to extract features of different categories, which can improve segmentation accuracy to a certain extent in exchange for slightly increased computational complexity.
However, although the above-mentioned methods using deep learning offer improvements compared to conventional approaches, they have limitations in certain aspects due to unreasonable network structure design. For example, while Chen [39] solved the problem of information loss, the recognition of multi-scale targets was not accurate. Similarly, while the lightweight network proposed by Pang [40] has advantages in real-time performance, it cannot always maintain high-precision classification results for situations with many categories. Gao [41] utilized a three-way parallel structure; yet, when dealing with a large number of categories and more complicated data scenarios, the network segmentation impact is not optimal, and though accurate positioning of different categories can be guaranteed, the segmentation of their contours is not accurate.
In response to the problems with the current methods, the present article proposes improvements in feature extraction and information fusion, allowing for full extraction of details in the picture and fusion of the extracted effective information with appropriate fusion strategies. This is meaningful for accurately distinguishing different land cover types. In this paper, a new backbone is constructed, mainly consisting of residual channel attention modules (RCA) and convolutional attention information interaction modules (CAII). Incorporating attention mechanisms into the feature extraction process helps the model to focus on meaningful information when extracting image features while avoiding interference from useless information. At the same time, a semantic information guidance module (SIG) is added to the middle cross-layer connection part of the network, which enables it to distinguish tiers of feature information for mutual guidance; this makes up for the limitation of feature extraction in a single layer, providing more accurate global and semantic information for subsequent upsampling processes. On the decoding end, a multi-scale fusion module (MSF) is proposed. Because different scales of objects usually appear in this task, multiple-scale convolutions are added to enhance the characteristic data at various sizes. Then, the characteristic information from different layers is fused and the detailed image with high resolution is gradually restored. The SIG and MSF confer strong capacity on proposed network to recover the minute characteristics of the primitive image. Due to the mutual guidance between feature information at various levels, the network presented in this study can be adapted for various land classification tasks. Finally, the output part of the whole network (the classifier) gradually reduces the number of channels in the network through two convolutional layers, buffering the output using the original image size to overcome the issue of detail loss with respect to the direct picture output.
In brief, the primary contributions of the present research are described below.
A network with an encoder–decoder structure (MCSGNet) which solves the issues of low precision and poor generalization ability in current methods is presented for land cover classification.
A new feature extraction network is constructed by combining convolution with attention, enhancing the attention assigned by the network to important information by integrating the attention mechanisms, thereby avoiding the problem of convolution focusing excessively on local features.
A semantic information guidance module (SIG) and a multi-scale fusion module (MSF) are suggested for fusing feature information at different levels, allowing the characteristic information between different levels to guide the others, which avoids limiting the network due to the inability of information interaction between different depths.

2. Methodology

2.1. Network Architecture

This article develops a new methods for land cover classification. The overall structure of the network is displayed in Figure 1, where 7 × 7 Conv represents a convolution layer with a kernel size of 7 × 7, RCA is a residual channel attention module, CAII represents a convolutional attention information interaction module, SIG represents a semantic information guidance module, MSF represents a multi-scale fusion module, and Classifier represents the final channel cascade refinement operation. The entire network utilizes an encoder–decoder architecture. First, the original image is continuously downsampled and characteristic extraction is performed through a feature extraction network. Currently, most methods use a pure convolution structure for feature extraction. However, as convolution cannot capture global long-distance dependency relationships, this paper incorporates an attention mechanism, which focuses on important information while establishing connections between the global features, thereby solving the problem of convolution only focusing on local features. Current methods do not have an effective way to handle information from the intermediate part between the encoding and decoding ends, resulting in information not being exchanged between different levels. This means that not all of the information passed to the decoding end is useful. In this paper, we introduce a semantic information guidance module (SIG) with the aim of allowing the feature information of different layers to guide the other layers, thereby improving the efficiency of information transmission. A multi-scale fusion module (MSF) is proposed at the decoding end to continuously fuse deep features with shallow features until the original image size is restored. Finally, the channel cascade refinement module (Classifier) uses two layers of convolutional layers to progressively compress and filter the feature map, avoiding detail loss caused by direct output and making the final segmentation map better at restoring detailed information of different categories.

2.2. Backbone

The feature extraction ability of a model can greatly influence the ability of the whole model to process image information. For this reason, in this research a novel feature extraction network is constructed. The purpose is to accurately extract the characteristics of different levels in the picture and accurately extract the features of different land types from images containing complex information. At present, existing networks usually use convolutional structures for feature extraction, with ResNet [42] being one of the most widely used. ResNet contains a residual connection structure that can make the network structure deeper while avoiding network degradation. However, ResNet adopts a pure convolution structure and has limitations, which is unfavorable for global information modeling in images. Here, we propose a new backbone network mainly made up of a residual channel attention module (RCA) and a convolutional attention information interaction module (CAII). Figure 2 shows the structure of these two modules, where n × m DOConv represents the over-parameterized convolution with a kernel size of n × m, Bn+ReLU represents the batch normalization layer and ReLU activation function, SEModule represents a channel attention mechanism, n × m AvgPool represents the average pooling with a kernel size of n × m, 1 × 1 Conv is a normal convolution layer with a kernel size of 1 × 1, EdgViT_block represents the lightweight attention module, and Bottleneck represents the bottleneck module in the residual structure. The backbone network’s composition is displayed in Table 1. During the feature extraction procedure, a 7 × 7 convolution layer is used for downsampling, then the RCA is used to extract different levels of feature data. As shown in Figure 2a, the RCA is a residual structure module. Unlike ResNet, an attention mechanism is added here. SEModule is a classic channel attention module [43]. Because different channel levels have different spatial information, the addition of SEModule is beneficial in accurately locating the access level of important information, making the network more efficient at extracting feature information. In the RCA module, we use 1 × 3 and 3 × 1 Depthwise Over-parameterized Convolution [44] instead of the original 3 × 3 ordinary convolution structure, which is conducive to reducing the number of parameters and accelerating the training process. The calculation process of RCA module is as follows:
M i = σ ( B n ( f 3 × 1 ( f 1 × 3 ( X i ) ) ) ) ,
X i + 1 = X i + S E ( B n ( f 3 × 1 ( f 1 × 3 ( M i ) ) ) ) ,
where X i is the result of the preceding layer, X i + 1 is the result of the current layer, f 3 × 1 (.) represents the over-parameterized convolution operation with a convolution kernel size of n × m, Bn(.) is the batch normalization layer, σ (.) is the activation function, and SE(.) is the SEModule module layer.
As the number of network layers increases, the feature information becomes more and more abstract and the amount of information increases. As a result, more efficient extraction methods are needed. In this paper, we propose an interactive structure that combines attention and convolution, as shown in Figure 2b, which is the internal structure of CAII. Among the components, EdgViT_block comes from EdgeViTs [45], a transformer-based lightweight attention module that internally decomposes self-attention into continuous modules to handle spatial tokens at different ranges. It significantly lowers the cost of self-attention through a sparse attention module to achieve a better accuracy–delay balance. Bottleneck is the basic module in ResNet. Considering that EdgViT_block can obtain features across the entire global scope, whereas convolutions only capture local features, the global information obtained through EdgViT_block followed by local refinement through Bottleneck facilitates the extraction of local information guided by global information. Finally, the concatenation operation merges global features with local features. After adjustment through two layers of average pooling, the output parameter count is reduced, and the translation invariance of features is improved. The procedure for this module’s calculations is as follows:
T R = E d g ( f 1 × 1 ( X ) ) ,
C O = B o t t l e ( T R ) ,
Y = A v g 1 × 3 ( A v g 3 × 1 ( C a t ( T R , C O ) ) ) ,
where X represents input, Y represents output, f 1 × 1 (.) represents a convolutional operation with a kernel size of 1 × 1, Edg(.) represents the process passing through the EdgViT_block, Bottle(.) represents the process passing through Bottleneck, A v g n × m (.) represents average pooling with a kernel size of n × m, and Cat(.) is a channel-wise concatenation operation.

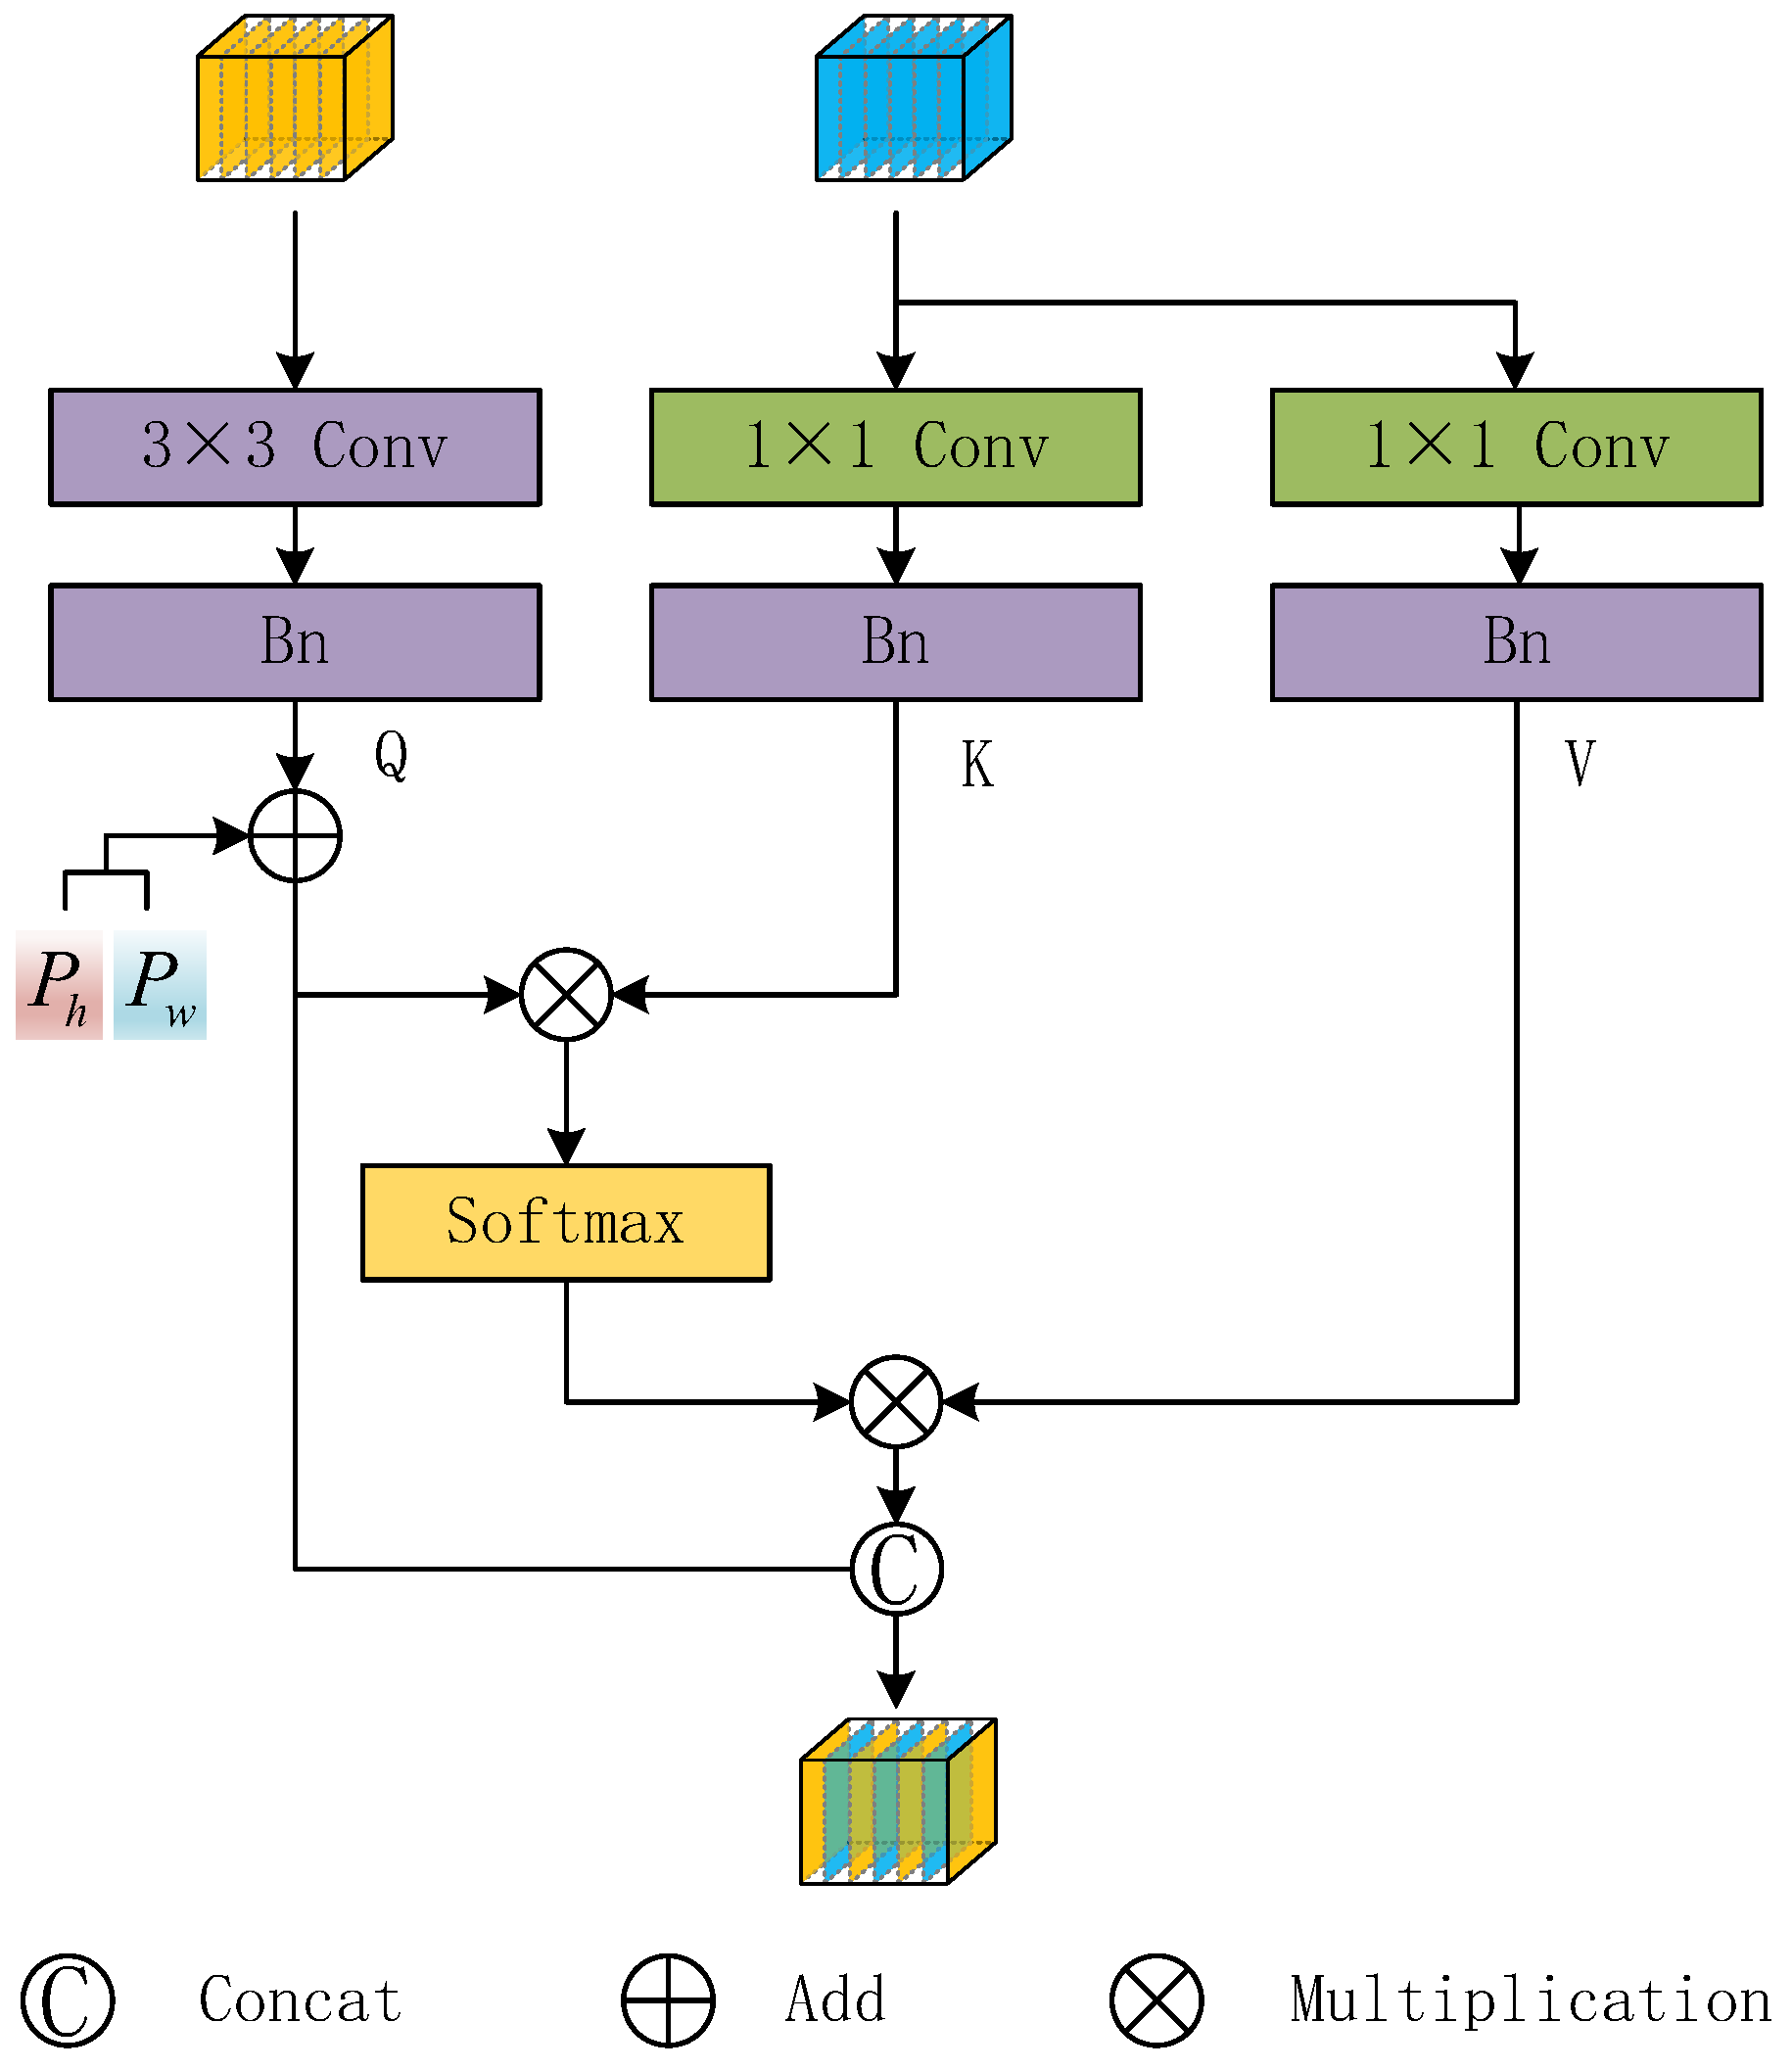
2.3. Semantic Information Guidance Module

After feature extraction by the backbone network, only preliminary feature information is obtained. However, current methods mostly directly transmit this information to the decoding end for upsampling recovery operation. Due to the fact that the feature maps in various levels include various information, direct transmission to the decoder leads to inadequate utilization of the relationship between different levels of information, especially in land cover classification tasks, which is unfavorable for distinguishing differential features between different categories. Here, we propose a Semantic Information Guided (SIG) module to promote the interaction of characteristic information between various layers, which can play a role in strengthening the resulting characteristics. As shown in Figure 3, the structure diagram of the SIG module takes extraction features from different layers as inputs. Through interactive guidance with adjacent layer feature information, it is conducive to better distinguishing the ground object information of different categories. First, a 3 × 3 convolution is employed to obtain the information in the adjacent feature layer as query, then a 1 × 1 convolution is used to filter the information as key and val in this layer. Here, P w and P h are two prior parameters based on different directions and represent the priors of spatial locations in H and W dimensions, respectively, which are two vectors that can be learned. The query extracted from the adjacent layer and the key extracted from the current layer are multiplied together, then the guide weight is obtained after being passed via the Softmax activation mechanism. Then, after multiplying with the obtained val from the current layer, the information extracted from the adjacent layer is fused and the output features after interaction between the different layers can be obtained. The following shows the procedure for this module’s calculations:
Q ( X 1 ) = B n ( f 3 × 3 ( X 1 ) ) ,
K ( X 2 ) = B n ( f 1 × 1 ( X 2 ) ) ,
V ( X 2 ) = B n ( f 1 × 1 ( X 2 ) ) ,
Y = C a t ( σ ( ( Q + P h + P w ) · K ) · V , ( Q + P h + P w ) ) ,
where X 2 represents the characteristic information of the current layer, X 1 represents the characteristic information of the adjacent layer, Cat(.) represents the process of concatenation depending on the channel dimension, f n × m (.) is a convolution layer with a kernel size of n × m, Bn(.) is the batch normalization layer, and σ (.) is the activation function.

2.4. Multi-Scale Fusion Module

Due to the complex and varied information often contained in remote sensing images, information is usually lost during the decoding process, which directly affects the ability of deep networks to recover deep information and ultimately impacts the classification results. Currently, most encoder–decoder structured networks adopt a method of directly stitching and upsampling the features to restore detailed information. However, there are issues with information redundancy or loss as a result of the inability of this method to properly integrate the feature information from multiple levels.
To solve the above problems, in this article we suggest a multi-scale fusion module (MSF) to combine feature maps from various depths. In accordance with Figure 4, the left branch is the mechanism for processing deep features, while the right branch is the mechanism for processing shallow features. On the right branch, 3 × 3 depthwise separable convolutions are used to process the information in the shallow features, with 1 × 1 convolutions used for channel adjustment. Multi-scale convolutions are introduced in the right branch, as there are targets with different scales in the classification process of land cover types. Adopting multi-scale convolutions is beneficial for extracting features on different scales, and dilated convolutions have larger receptive fields, which can effectively retain multi-scale information in the image during the process of restoring the original size and are more advantageous for extracting the details of different target categories. Different processing methods are used for the deep and shallow features, with the classification of the shallow features guided by the class data retrieved from the deep feature map; then, they are added together and fused. Finally, a 3 × 3 depthwise separable convolution is used to filter the fused feature map; this is because the 3 × 3 convolution kernel is smaller than the convolution kernel of other sizes, takes up less computation and memory, and can perform convolution operations faster. At the same time, the 3 × 3 convolution kernel can effectively capture the spatial information in the feature map, as it can detect smaller spatial changes. This operation can effectively reduce the absence of semantic information and maintain a relatively rich characteristic representation during the restoration process. The following shows the procedure for this module’s calculations:
H 1 = σ ( B n ( f 1 × 1 ( σ ( B n ( f 3 × 3 ( U p ( X 1 ) ) ) ) ) ) ) ,
H 2 = C a t ( f D 3 × 3 ( U p ( X 1 ) ) , f D 5 × 5 ( U p ( X 1 ) ) , f D 7 × 7 ( U p ( X 1 ) ) ) ,
L 1 = σ ( B n ( f 3 × 3 ( X 2 ) ) ) ,
L 2 = σ ( B n ( f 1 × 1 ( σ ( B n ( f 3 × 3 ( U p ( X 2 ) ) ) ) ) ) ) ,
Y = σ ( B n ( f 3 × 3 ( ( L 1 · H 1 ) + ( L 2 · H 2 ) ) ) ) ,
Here, X 1 represents the deep characteristic, X 2 represents the shallow characteristic, Up(.) denotes the upsampling operation, Bn(.) is the batch normalization layer, σ (.) denotes the activation function, f k × k (.) denotes the depthwise separable convolution with a kernel size of k × k, f D k × k (.) denotes the dilated convolution with a kernel size of k × k, and Cat(.) denotes the concatenation operation based on the channel dimension.

2.5. Experimental Details and Evaluation Metrics

All aspects of this experiment were based entirely on the Pytorch deep learning framework, version 1.10.0, using Python version 3.8.12. Every experiment was performed on our computer, its CPU is i7, RAM is 32 GB, graphics card is NVIDIA GeForce RTX 3090 (Santa Clara, CA, USA) with a total of 24 GB of memory. During the experiment, an equal-interval learning rate adjustment strategy (StepLR) was used, which gradually decayed the learning rate as the number of training sessions increased. The starting learning rate was set to 0.0005, the decay coefficient was set to 0.98, every three rounds were used to update the learning rate, and a total of 300 rounds were trained. The learning rate calculation formula was as follows:
l r N = l r 0 · β N / s ,
where l r N is the size of the learning rate for the Nth training, l r 0 is the starting learning rate, β is the decay coefficient, and s is the update cycle. During the training process, the Adam optimizer was used as an adaptive learning rate optimization algorithm combining the advantages of momentum gradient descent and the RMSProp algorithm. It has the characteristics of fast convergence speed, is suitable for large-scale datasets, and provides more accurate parameter update direction. Thus, we used the Adam algorithm [46] as the optimizer. For the loss function we used the cross-entropy loss, with the following equations used to calculate it:
L o s s ( x , c l a s s ) = log ( e x [ c l a s ] i e x [ i ] ) = x [ c l a s s ] + log ( i e x [ i ] ) ,
where x denotes the output of the network and class denotes the real label. In order to evaluate the performance of the model, we used the metrics of mean pixel accuracy (MPA), frequency weighted intersection over union (FWIOU), and mean intersection over union (MIOU). The corresponding calculation formulas are as follows:
M P A = 1 k + 1 i = 0 k p i i j = 0 k p i j ,
F W I o U = 1 i = 0 k j = 0 k p i j i = 0 k j = 0 k p i j p i i j = 0 k p i j + j = 0 k p j i p i i ,
M I o U = 1 k + 1 i = 0 k p i i j = 0 k p i j + j = 0 k p j i p i i ,
where k is the number of categories (excluding the background category), p i i is the quantity of pixels that belong to categorization i and are predicted as categorization i, p i j represents the quantity of pixels that belong to categorization i but are predicted as categorization j, and p j i represents the quantity of pixels that belong to categorization j but are predicted as categorization i.

3. Experiment

In this chapter, we conduct experimental verification of the proposed method, including ablation experiments, comparative experiments on the LandCover dataset [17], and generalization experiments on the WHDLD dataset [47]. The experimental findings demonstrate that the various modules suggested in this study have a positive effect on the overall network performance. In the comparative test, our method has the highest accuracy and performs better than existing methods. Furthermore, the proposed method has excellent generalization ability and can exhibit superior performance on more complex tasks with more categories, which leads to a more realistic classification of land categories.

3.1. Datasets

3.1.1. LandCover Dataset

This dataset [17] was collected in Poland, spanning a land area of 216.27 square kilometers with high resolution and wide spatiotemporal distribution. The remote sensing images in this dataset are all digital orthophotos, which are made in the Cartesian ‘1992’ (EPSG: 2180) co-ordinate spatial reference system, using the three RGB spectral bands. Among these bands, the red band is very important for the impact of land cover classification, and is very important in all bands [48,49]. Because the shooting times are from different years (2015–2018), these images have the characteristics of various optical conditions, including different saturation, sunshine angle, and shadow length, and these data come from different vegetation seasons, which make the dataset more robust and more applicable. In the dataset, the spatial resolutions of the collected images range between 25–50 cm, including 39.51 square kilometers of images with a spatial resolution of 50 cm and 176.76 square kilometers of images with a spatial resolution of 25 cm. These are divided into four categories, namely, building, forest, river, and background, due to their usefulness and importance for public administration cases. Among the categories, the background is the area not classified as any other class, and can include, e.g., fields, grass, pavement, and all other objects excluded from the categories above. Due to computational hardware limitations, the images in the dataset were uniformly cropped to a size of 512 × 512 for training convenience. Images containing only one category were removed, resulting in a total of 7937 images. To increase the model’s capacity for generalization and lessen its reliance on certain attributes, the dataset was expanded using data augmentation methods including translation, rotation, and Gaussian blur. Then, the dataset was split into a training set and a validation set using a ratio of 8:2 for training and validation. This was because the 8:2 ratio division ensures that the training set and verification set each have enough data to train and evaluate the model, and that the data distribution of the training set and verification set is consistent, which can better reflect the performance of the model in practical applications. Figure 5 displays an example of training data in the LandCover dataset, with the actual images in the first row and their matching labels in the second row.

3.1.2. Wuhan Dense Labeling Dataset (WHDLD)

WHDLD [47] is a generalized dataset we used to test the model’s generalization ability. The dataset is sourced from a high-capacity remote sensing image of Wuhan; it is cropped from a large RS image of Wuhan urban area and is divided into six categories, namely, Building, Road, Pavement, Vegetation, Bare Soil, and Water. This dataset has a total of 4940 color images, each with a size of 256 × 256 and a spatial resolution of 2 m. We split the dataset into training and validation sets using an 8:2 ratio. Figure 6 displays an example of the training data in the WHDLD dataset.

3.2. Ablation Study

To verify how various modules affect the model’s overall performance, ablation experiments were conducted. First, ResNet-18 [42] was used as the benchmark network. Then, the backbone network was replaced with the network proposed in this article, and different modules were gradually added to determine the performance impact of different modules on the model. Table 2 displays the MIOU scores of different module combinations on the LandCover dataset.
From the table, it can be seen that the model’s performance is subpar when ResNet-18 is used to extract the characteristics, with the lowest MIOU score on the dataset. The MIOU score improves after replacing the feature extraction network with the backbone proposed in this article, indicating that RCA and CAII are effective and that the proposed improvements to the model’s feature extraction capability increase its performance.
Next, when adding the SIG module at the cross-layer connections between the encoder and decoder, the MIOU score increased from 85.500% to 86.122%. With the addition of the SIG module, the information in different layers can interact, making fusion of the information more efficient and effectively improving the overall performance.
Finally after adding the MSF module to the decoding end, the network’s MIOU score on the entire dataset increased from 86.122% to 87.432%, an improvement of 1.310%. The MSF module combines information between perdeep features and shallow features while restoring the original image size of the network. The category information of perdeep features can effectively guide shallow features, making the use of the previously extracted features more efficient.

3.3. Comparison Test on the LandCover Dataset

In this section, to evaluate the effectiveness of the proposed model, it is contrasted with excellent segmentation models from the past five years.
For example, both CVT [50] and PVT [51] are system architectures based on Vision Transformer. CVT achieved the optimal combination of two designs by introducing convolution into ViT for the first time, thereby improving the performance and efficiency of traditional vision transformer. PVT is a transformer-based network with a non-convolutional structure, introducing a pyramid structure into the transformer that gradually reduces in size, significantly reducing the model’s computational complexity. DeepLabV3Plus [35] and OCRNet [52] are two networks based on purely convolutional structures. DeepLabV3Plus is based on spatial pyramid pooling technology, and integrates the advantages of multiple models to construct a core network architecture, resulting in a well-performing model based on deep neural network structures. OCRNet, on the other hand, enhances the influence of pixels from the same class of objects while creating contextual information. DABNet [53] and CGNet [54] are two real-time segmentation networks that balance inference speed and accuracy. ACFNet [55] and CCNet [56] combine convolution and attention to guide model classification by capturing rich contextual information.
Table 3 displays the scores of various models on the LandCover dataset. To evaluate each model’s scores, we employed MPA, MIOU, and FWIOU as assessment indicators. It can be seen from the table that for land cover classification tasks, the network presented here has the highest scores on all indicators, surpassing all other networks. The scores on the three indicators are as following: MPA, 94.563%; MIOU, 87.432%; and FWIOU, 91.103%. The MIOU score is 1.886% higher than that of the next-best model. Among other networks, CGNet can simultaneously learn local and global features, and the CG Block it uses can obtain contextual texture features well; its precision is only surpassed by the approach suggested in this article. For others, their performance on all indicators is not ideal and is far from the precision of our approach.
As shown in Figure 7, we selected a digital orthophoto containing four categories for prediction. The image contains scattered buildings, woodlands, and water. At the same time, in order to increase the difficulty, the bodies of water in the selected image show texture attributes similar to the surrounding environment, and the forest land category is easily confused with shrubs. Due to the scattered distribution of buildings and their different sizes, the difficulty of classifying building areas is greatly increased. It can be seen from the results that in addition to the method proposed in this paper, the other models have misjudged the upper left corner of the middle water area and the background, and there is a small water area in the upper right corner that cannot be identified by the other models. For the identification of forest land, the method proposed in this paper shows the best effect. Although the method proposed in this paper is not very accurate when dividing the edge of the target, it can accurately locate the target position, and the final effect is far better than the other models.
Figure 8 shows the classification results of representative networks for land types in actual images. Here, representative networks were selected, including PAN, which is based on a pure convolution structure, CVT, which is based on visual transformer, and CCNet, which combines convolution with an attention mechanism. Representative images are selected in the table: (1) shows the case of four types coexisting, (2)–(4) correspond to the forest areas of different sizes, and (5) and (6) have buildings of different scales. All of these cases can be used to evaluate the model’s capacity to classify targets with various sizes. The figure demonstrates that our model has the best classification effect, can accurately divide land types, and has better edge restoration ability for different targets than the other methods.

3.4. Comparison Test on the WHDLD Dataset

We used another publicly available dataset, WHDLD, for generalization experiments to evaluate the effectiveness of the model suggested in this article on more complex land cover type classification tasks. Again, MPA, MIOU, and FWIOU were used as evaluation indicators to calculate the scores of each model. Table 4 reveals the scores of different models using these indicators on this dataset. It is visible from the table that in the generalization experiment our method has better performance than the other models, with scores of 76.122%, 64.243%, and 83.121%, respectively, on the three indicators. These findings indicate that our method exhibits superior performance than other methods for more complex situations, and has better performance on actual land type classification tasks.
Figure 9 selects different types of networks to show the actual division effect of land cover types in different images. We selected remote sensing images with different features. For example, the situation in image (1) is the most complex, containing buildings, narrow roads, large bodies of water, vegetation, and bare soil, which poses a challenge to the model’s ability to distinguish different targets. In image (1), our network has the most accurate restoration of the water edge and better segmentation of the middle bare land compared to the other models. In image (4), there are a large number of buildings along with a cross-shaped road between the buildings which is easy to miss. From the final results, the proposed model is the most in line with the actual situation. In image (4), our model can accurately segment the horizontal road from the complex target, while the other methods do not segment the horizontal road.

4. Discussion

4.1. About the Model

The network suggested in this paper adopts an encoder–decoder architecture which extracts feature information from the image through the encoder part, then sends the extracted feature information to the decoder part for upsampling to restore the original image size. This is an effective structure for processing image features. Most current networks use a pure convolution structure to extract feature information, which cannot effectively focus on global information and key information in the picture, and tends to ignore critical facts. In this paper, we propose an RCA residual structure module with attention mechanism to extract shallow features in the early stages. As the network’s depth continues to increase, the feature map size becomes smaller, but contains more abstract information. At this point, the CAII module is used, which combines transformer and CNN structures, which is beneficial to balance performance and efficiency in the later stages of the network. The proposed structure, which is shallower in the early stage and deeper in the late stage, has been proven to improve model capacity and achieve better performance without reducing efficiency [58]. In Section 3.2, it can be seen from Table 2 that after adding the attention mechanism to the deep layer of the network, the final classification accuracy is significantly improved, and the MIOU score increases from 84.462% to 85.500%.
In the classification task of land cover types, there are many categories which can lead to mutual interference between different objectives. Current methods do not process information between different levels, remaining in isolation, which is not conducive to sharing information [39]. The SIG module proposed in this article processes the information extracted by the backbone network twice, enabling interaction between different levels of information, greatly improving the efficiency of utilizing information and helping to accurately distinguish different class characteristics.
We propose a new fusion strategy at the decoding end for the land cover classification task, which often involves targets of different scales. Therefore, multi-scale convolution is added to the fusion module to extract different scale features. The process of fusing deep features with shallow features while restoring the original image size can enhance the retention of certain details in the feature map, and the interaction between different levels of information is conducive to the restoration of details in the image.

4.2. About the Experiments

This article describes the ablation and comparison studies we performed to confirm our model’s real performance. In the ablation experiment, different combinations of modules were tested to determine their overall impact on the model’s performance. The experimental findings indicate that the model’s performance showed a trend of improvement with the addition of the new modules. After adding all modules, the final network showed the highest scores on all indicators.
Two public datasets were selected for comparison experiments, namely, the LandCover dataset and the WHDLD dataset. In the LandCover dataset, water is usually dark and can easily be confused with the background. There are gaps between different types of forests, which most models cannot detect. Bushes are often misclassified as forests, and recovering building edges is a major challenge. From the prediction effect shown in Figure 8, it can be seen that there is a narrow tree area on the left side of picture (1) which should be classified as woodland, but which other models cannot detect. In the upper right part of picture (6), the contrast model misclassifies the shrubs that do not belong to woodland as woodland. In picture (3), there is a narrow space between woodlands which is not part of the woodland, which other models cannot accurately classify. Observing the classification results of our model, whether the classification of forest land, the restoration of building edges, or the detection of water areas, the results are the closest to the actual situation in all cases.
In the generalization experiment, as shown in Figure 9, the model proposed in this paper performs well in more categories of classification tasks than the other models. In Figure 9(2), there is a road surface in the upper area which can be perfectly distinguished from the surrounding vegetation, for which other models such as OCRNet and CCNet return missed detection or false detection due to confusion between pavement and road. The MIOU scores of OCRNet and CCNet in the generalization dataset are 63.569% and 62.155%, respectively, which are far lower than the model proposed in this paper. PVT misjudges the vegetable area at the top left corner as water, which is due to interference from the light and shooting angle. The model proposed in this paper shows strong anti-interference ability for shooting angle and lighting problems, and can effectively distinguish vegetable and water areas. This is because the method proposed in this paper is more efficient than other methods in the information processing process, making its anti-interference ability with respect to different factors better than that of other networks. Finally, the scores of our proposed model on the MPA, MIOU, and FWIOU indicators are 76.122%, 64.243%, and 83.121%, respectively, all of which higher than other models.

4.3. Limitations and Future Research Directions

This paper mainly improves the model’s feature extraction and information fusion capabilities, resulting a better effect than other methods on the classification task of land cover types; however, in terms of accuracy there is room for further development. In the future, we will pay more attention to the balance between accuracy and real-time performance as a basis for improving the model’s structure, and will further optimize the training strategy to improve the training efficiency.

5. Conclusions

In this article, we propose MCSGNet, a model for classifying land cover types in remote sensing imagery. We suggest a new feature extraction architecture, mainly consisting of RCA and CAII modules, to make new extraction more efficient in remote sensing images. In addition, we propose the SIG module to allow information interaction between different layers. At the decoding end, the proposed MSF module can better fuse deep and shallow feature information, maximizing the preservation of details in the original image. Experimental results on different datasets prove that this method has the highest accuracy and excellent generalization ability compared to existing models. The MIOU score on the LandCover dataset is 87.432%, and it has better generalization performance on the WHDLD dataset than other methods.

Author Contributions

Conception, K.H., M.X. and L.W.; methodology, K.H. and M.X.; software, K.H., E.Z., X.D. and F.Z.; validation, E.Z., M.X., F.Z. and H.L.; formal analysis, E.Z., M.X. and L.W.; investigation, K.H. and M.X.; resources, M.X. and L.W.; data curation, X.D., F.Z. and L.W.; writing—original draft preparation, E.Z.; writing—review and editing, L.W. and H.L.; visualization, K.H.; supervision, M.X.; project administration, L.W. and M.X.; funding acquisition, M.X. All authors have read and agreed to the published version of the manuscript.

Funding

This research was funded by the National Natural Science Foundation of PR China, grant number 42075130.

Data Availability Statement

The data and the code of this study are available from the corresponding author upon request ([email protected]).

Acknowledgments

The authors would like to thank the Assistant Editor of this article and anonymous reviewers for their valuable suggestions and comments.

Conflicts of Interest

The authors declare no conflict of interest.

References

  1. Chen, J.; Xia, M.; Wang, D.; Lin, H. Double Branch Parallel Network for Segmentation of Buildings and Waters in Remote Sensing Images. Remote Sens. 2023, 15, 1536. [Google Scholar] [CrossRef]
  2. Ma, Z.; Xia, M.; Lin, H.; Qian, M.; Zhang, Y. FENet: Feature enhancement network for land cover classification. Int. J. Remote Sens. 2023, 44, 1702–1725. [Google Scholar] [CrossRef]
  3. Chu, S.; Li, P.; Xia, M. MFGAN: Multi feature guided aggregation network for remote sensing image. Neural Comput. Appl. 2022, 34, 10157–10173. [Google Scholar] [CrossRef]
  4. Song, L.; Xia, M.; Weng, L.; Lin, H.; Qian, M.; Chen, B. Axial Cross Attention Meets CNN: Bibranch Fusion Network for Change Detection. IEEE J. Sel. Top. Appl. Earth Obs. Remote Sens. 2023, 16, 32–43. [Google Scholar] [CrossRef]
  5. Hu, K.; Li, M.; Xia, M.; Lin, H. Multi-Scale Feature Aggregation Network for Water Area Segmentation. Remote Sens. 2022, 14, 206. [Google Scholar] [CrossRef]
  6. Lu, C.; Xia, M.; Lin, H. Multi-scale strip pooling feature aggregation network for cloud and cloud shadow segmentation. Neural Comput. Appl. 2022, 34, 6149–6162. [Google Scholar] [CrossRef]
  7. Qu, Y.; Xia, M.; Zhang, Y. Strip pooling channel spatial attention network for the segmentation of cloud and cloud shadow. Comput. Geosci. 2021, 157, 104940. [Google Scholar] [CrossRef]
  8. Wang, D.; Weng, L.; Xia, M.; Lin, H. MBCNet: Multi-Branch Collaborative Change-Detection Network Based on Siamese Structure. Remote Sens. 2023, 15, 2237. [Google Scholar] [CrossRef]
  9. Toll, D.L. Analysis of digital LANDSAT MSS and SEASAT SAR data for use in discriminating land cover at the urban fringe of Denver, Colorado. Int. J. Remote Sens. 1985, 6, 1209–1229. [Google Scholar] [CrossRef]
  10. Jewell, N. An evaluation of multi-date SPOT data for agriculture and land use mapping in the United Kingdom. Int. J. Remote Sens. 1989, 10, 939–951. [Google Scholar] [CrossRef]
  11. Zhang, F.; Yang, X. Improving land cover classification in an urbanized coastal area by random forests: The role of variable selection. Remote Sens. Environ. 2020, 251, 112105. [Google Scholar] [CrossRef]
  12. Paneque-Gálvez, J.; Mas, J.F.; Moré, G.; Cristóbal, J.; Orta-Martínez, M.; Luz, A.C.; Guèze, M.; Macía, M.J.; Reyes-García, V. Enhanced land use/cover classification of heterogeneous tropical landscapes using support vector machines and textural homogeneity. Int. J. Appl. Earth Obs. Geoinf. 2013, 23, 372–383. [Google Scholar] [CrossRef]
  13. McFeeters, S.K. The use of the Normalized Difference Water Index (NDWI) in the delineation of open water features. Int. J. Remote Sens. 1996, 17, 1425–1432. [Google Scholar] [CrossRef]
  14. Yuan, J.; Wang, D.; Li, R. Remote sensing image segmentation by combining spectral and texture features. IEEE Trans. Geosci. Remote Sens. 2013, 52, 16–24. [Google Scholar] [CrossRef]
  15. Xu, J.; Li, J.; Peng, H.; He, Y.; Wu, B. Information Extraction from High-Resolution Remote Sensing Images Based on Multi-Scale Segmentation and Case-Based Reasoning. Photogramm. Eng. Remote Sens. 2022, 88, 199–205. [Google Scholar] [CrossRef]
  16. Zhang, H.; Jiang, Q.; Xu, J. Coastline extraction using support vector machine from remote sensing image. J. Multimed. 2013, 8, 175–182. [Google Scholar]
  17. Boguszewski, A.; Batorski, D.; Ziemba-Jankowska, N.; Dziedzic, T.; Zambrzycka, A. LandCover. ai: Dataset for automatic mapping of buildings, woodlands, water and roads from aerial imagery. In Proceedings of the IEEE/CVF Conference on Computer Vision and Pattern Recognition, Nashville, TN, USA, 20–25 June 2021; pp. 1102–1110. [Google Scholar]
  18. Chen, B.; Xia, M.; Qian, M.; Huang, J. MANet: A multi-level aggregation network for semantic segmentation of high-resolution remote sensing images. Int. J. Remote Sens. 2022, 43, 5874–5894. [Google Scholar] [CrossRef]
  19. Dai, X.; Xia, M.; Weng, L.; Hu, K.; Lin, H.; Qian, M. Multi-Scale Location Attention Network for Building and Water Segmentation of Remote Sensing Image. IEEE Trans. Geosci. Remote Sens. 2023. [Google Scholar] [CrossRef]
  20. Wang, Z.; Xia, M.; Lu, M.; Pan, L.; Liu, J. Parameter Identification in Power Transmission Systems Based on Graph Convolution Network. IEEE Trans. Power Deliv. 2022, 37, 3155–3163. [Google Scholar] [CrossRef]
  21. Zhang, S.; Weng, L. STPGTN—A Multi-Branch Parameters Identification Method Considering Spatial Constraints and Transient Measurement Data. Comput. Model. Eng. Sci. 2023, 136, 2635–2654. [Google Scholar] [CrossRef]
  22. Zhu, X.X.; Tuia, D.; Mou, L.; Xia, G.S.; Zhang, L.; Xu, F.; Fraundorfer, F. Deep learning in remote sensing: A comprehensive review and list of resources. IEEE Geosci. Remote Sens. Mag. 2017, 5, 8–36. [Google Scholar] [CrossRef]
  23. Ma, L.; Liu, Y.; Zhang, X.; Ye, Y.; Yin, G.; Johnson, B.A. Deep learning in remote sensing applications: A meta-analysis and review. ISPRS J. Photogramm. Remote Sens. 2019, 152, 166–177. [Google Scholar] [CrossRef]
  24. Zhang, C.; Weng, L.; Ding, L.; Xia, M.; Lin, H. CRSNet: Cloud and Cloud Shadow Refinement Segmentation Networks for Remote Sensing Imagery. Remote Sens. 2023, 15, 1664. [Google Scholar] [CrossRef]
  25. Miao, S.; Xia, M.; Qian, M.; Zhang, Y.; Liu, J.; Lin, H. Cloud/shadow segmentation based on multi-level feature enhanced network for remote sensing imagery. Int. J. Remote Sens. 2022, 43, 5940–5960. [Google Scholar] [CrossRef]
  26. Hu, K.; Zhang, E.; Xia, M.; Weng, L.; Lin, H. MCANet: A Multi-Branch Network for Cloud/Snow Segmentation in High-Resolution Remote Sensing Images. Remote Sens. 2023, 15, 1055. [Google Scholar] [CrossRef]
  27. Xia, M.; Wang, T.; Zhang, Y.; Liu, J.; Xu, Y. Cloud/shadow segmentation based on global attention feature fusion residual network for remote sensing imagery. Int. J. Remote Sens. 2021, 42, 2022–2045. [Google Scholar] [CrossRef]
  28. Yin, M.; Wang, P.; Ni, C.; Hao, W. Cloud and snow detection of remote sensing images based on improved Unet3+. Sci. Rep. 2022, 12, 14415. [Google Scholar] [CrossRef]
  29. Long, J.; Shelhamer, E.; Darrell, T. Fully convolutional networks for semantic segmentation. In Proceedings of the IEEE Conference on Computer Vision and Pattern Recognition, Boston, MA, USA, 8–10 June 2015; pp. 3431–3440. [Google Scholar]
  30. Ronneberger, O.; Fischer, P.; Brox, T. U-net: Convolutional networks for biomedical image segmentation. In Medical Image Computing and Computer-Assisted Intervention–MICCAI 2015, Proceedings of the 18th International Conference, Munich, Germany, 5–9 October 2015; Proceedings, Part III 18; Springer: Cham, Switzerland, 2015; pp. 234–241. [Google Scholar]
  31. Zhao, H.; Shi, J.; Qi, X.; Wang, X.; Jia, J. Pyramid scene parsing network. In Proceedings of the IEEE Conference on Computer Vision and Pattern Recognition, Honolulu, HI, USA, 21–26 July 2017; pp. 2881–2890. [Google Scholar]
  32. Chen, L.C.; Papandreou, G.; Kokkinos, I.; Murphy, K.; Yuille, A.L. Deeplab: Semantic image segmentation with deep convolutional nets, atrous convolution, and fully connected crfs. IEEE Trans. Pattern Anal. Mach. Intell. 2017, 40, 834–848. [Google Scholar] [CrossRef]
  33. Chen, L.C.; Papandreou, G.; Kokkinos, I.; Murphy, K.; Yuille, A.L. Semantic image segmentation with deep convolutional nets and fully connected crfs. arXiv 2014, arXiv:1412.7062. [Google Scholar]
  34. Chen, L.C.; Papandreou, G.; Schroff, F.; Adam, H. Rethinking atrous convolution for semantic image segmentation. arXiv 2017, arXiv:1706.05587. [Google Scholar]
  35. Chen, L.C.; Zhu, Y.; Papandreou, G.; Schroff, F.; Adam, H. Encoder-decoder with atrous separable convolution for semantic image segmentation. In Proceedings of the European Conference on Computer Vision (ECCV), Munich, Germany, 8–14 September 2018; pp. 801–818. [Google Scholar]
  36. Badrinarayanan, V.; Kendall, A.; Cipolla, R. Segnet: A deep convolutional encoder-decoder architecture for image segmentation. IEEE Trans. Pattern Anal. Mach. Intell. 2017, 39, 2481–2495. [Google Scholar] [CrossRef] [PubMed]
  37. Ma, Z.; Xia, M.; Weng, L.; Lin, H. Local Feature Search Network for Building and Water Segmentation of Remote Sensing Image. Sustainability 2023, 15, 3034. [Google Scholar] [CrossRef]
  38. Lu, C.; Xia, M.; Qian, M.; Chen, B. Dual-Branch Network for Cloud and Cloud Shadow Segmentation. IEEE Trans. Geosci. Remote Sens. 2022, 60, 5410012. [Google Scholar] [CrossRef]
  39. Chen, B.; Xia, M.; Huang, J. MFANet: A Multi-Level Feature Aggregation Network for Semantic Segmentation of Land Cover. Remote Sens. 2021, 13, 731. [Google Scholar] [CrossRef]
  40. Pang, K.; Weng, L.; Zhang, Y.; Liu, J.; Lin, H.; Xia, M. SGBNet: An ultra light-weight network for real-time semantic segmentation of land cover. Int. J. Remote Sens. 2022, 43, 5917–5939. [Google Scholar] [CrossRef]
  41. Gao, J.; Weng, L.; Xia, M.; Lin, H. MLNet: Multichannel feature fusion lozenge network for land segmentation. J. Appl. Remote Sens. 2022, 16, 016513. [Google Scholar] [CrossRef]
  42. He, K.; Zhang, X.; Ren, S.; Sun, J. Deep residual learning for image recognition. In Proceedings of the IEEE Conference on Computer Vision and Pattern Recognition, Las Vegas, NV, USA, 27–30 June 2016; pp. 770–778. [Google Scholar]
  43. Hu, J.; Shen, L.; Sun, G. Squeeze-and-excitation networks. In Proceedings of the IEEE Conference on Computer Vision and Pattern Recognition, Salt Lake City, UT, USA, 18–23 June 2018; pp. 7132–7141. [Google Scholar]
  44. Cao, J.; Li, Y.; Sun, M.; Chen, Y.; Lischinski, D.; Cohen-Or, D.; Chen, B.; Tu, C. Do-conv: Depthwise over-parameterized convolutional layer. arXiv 2020, arXiv:2006.12030. [Google Scholar] [CrossRef]
  45. Pan, J.; Bulat, A.; Tan, F.; Zhu, X.; Dudziak, L.; Li, H.; Tzimiropoulos, G.; Martinez, B. Edgevits: Competing light-weight cnns on mobile devices with vision transformers. In Proceedings of the Computer Vision—ECCV 2022: 17th European Conference, Tel Aviv, Israel, 23–27 October 2022; Proceedings, Part XI. Springer: Cham, Switzerland, 2022; pp. 294–311. [Google Scholar]
  46. Kingma, D.P.; Ba, J. Adam: A method for stochastic optimization. arXiv 2014, arXiv:1412.6980. [Google Scholar]
  47. Shao, Z.; Zhou, W.; Deng, X.; Zhang, M.; Cheng, Q. Multilabel remote sensing image retrieval based on fully convolutional network. IEEE J. Sel. Top. Appl. Earth Obs. Remote Sens. 2020, 13, 318–328. [Google Scholar] [CrossRef]
  48. Cui, Z.; Kerekes, J.P. Potential of red edge spectral bands in future landsat satellites on agroecosystem canopy green leaf area index retrieval. Remote Sens. 2018, 10, 1458. [Google Scholar] [CrossRef]
  49. Cui, Z.; Kerekes, J. Potential of Red Edge Spectral Bands in Future Landsat Satellites on Agroecosystem Canopy Chlorophyll Content Retrieval. In Proceedings of the IGARSS 2019—2019 IEEE International Geoscience and Remote Sensing Symposium, Yokohama, Japan, 28 July–2 August 2019; IEEE: Piscataway, NJ, USA, 2019; pp. 7168–7171. [Google Scholar]
  50. Wu, H.; Xiao, B.; Codella, N.; Liu, M.; Dai, X.; Yuan, L.; Zhang, L. Cvt: Introducing convolutions to vision transformers. In Proceedings of the IEEE/CVF International Conference on Computer Vision, Montreal, QC, Canada, 10–17 October 2021; pp. 22–31. [Google Scholar]
  51. Wang, W.; Xie, E.; Li, X.; Fan, D.P.; Song, K.; Liang, D.; Lu, T.; Luo, P.; Shao, L. Pyramid vision transformer: A versatile backbone for dense prediction without convolutions. In Proceedings of the IEEE/CVF International Conference on Computer Vision, Montreal, QC, Canada, 10–17 October 2021; pp. 568–578. [Google Scholar]
  52. Yuan, Y.; Chen, X.; Wang, J. Object-contextual representations for semantic segmentation. In Proceedings of the Computer Vision—ECCV 2020: 16th European Conference, Glasgow, UK, 23–28 August 2020; Proceedings, Part VI 16. Springer: Cham, Switzerland, 2020; pp. 173–190. [Google Scholar]
  53. Li, G.; Yun, I.; Kim, J.; Kim, J. Dabnet: Depth-wise asymmetric bottleneck for real-time semantic segmentation. arXiv 2019, arXiv:1907.11357. [Google Scholar]
  54. Wu, T.; Tang, S.; Zhang, R.; Cao, J.; Zhang, Y. Cgnet: A light-weight context guided network for semantic segmentation. IEEE Trans. Image Process. 2020, 30, 1169–1179. [Google Scholar] [CrossRef] [PubMed]
  55. Zhang, F.; Chen, Y.; Li, Z.; Hong, Z.; Liu, J.; Ma, F.; Han, J.; Ding, E. Acfnet: Attentional class feature network for semantic segmentation. In Proceedings of the IEEE/CVF International Conference on Computer Vision, Seoul, Republic of Korea, 27 October–2 November 2019; pp. 6798–6807. [Google Scholar]
  56. Huang, Z.; Wang, X.; Huang, L.; Huang, C.; Wei, Y.; Liu, W. Ccnet: Criss-cross attention for semantic segmentation. In Proceedings of the IEEE/CVF International Conference on Computer Vision, Seoul, Republic of Korea, 27 October–2 November 2019; pp. 603–612. [Google Scholar]
  57. Li, H.; Xiong, P.; An, J.; Wang, L. Pyramid Attention Network for Semantic Segmentation. arXiv 2018, arXiv:1805.10180. [Google Scholar]
  58. Xia, X.; Li, J.; Wu, J.; Wang, X.; Wang, M.; Xiao, X.; Zheng, M.; Wang, R. TRT-ViT: TensorRT-oriented vision transformer. arXiv 2022, arXiv:2205.09579. [Google Scholar]
Figure 1. The architecture of the multi-scale contextual semantic guidance network; ⨁ represents addition.
Remotesensing 15 02810 g001
Figure 2. (a) Residual Channel Attention (RCA) module and (b) Convolutional Attention Information Interaction (CAII) module. Here, ⨁ represents addition and © represents concatenation. The input of the module is the output of the previous layer.
Remotesensing 15 02810 g002
Figure 3. Structural diagram of the Semantic Information Guidance module (SIG), where n × m Conv represents convolution with the kernel size of n × m, Softmax represents the activation function used here, and P w and P h represent two trainable parameters.
Remotesensing 15 02810 g003
Figure 4. The structure diagram of the multi-scale fusion module (MSF), where n × n DWConv represents the depthwise separable convolution operation of the kernel size n × n, Dilation Conv represents the hole convolution, and Bn+Relu represents the batch normalization layer and ReLu activation function.
Remotesensing 15 02810 g004
Figure 5. Data from the LandCover dataset, showing the actual images in the first row and their matching labels in the second row. The annotation rules for each category are shown on the right.
Remotesensing 15 02810 g005
Figure 6. Example pictures from the WHDLD dataset. The first row shows the actual images, and the second row shows their matching label images. The labeling rules for each category are shown on the right.
Remotesensing 15 02810 g006
Figure 7. The classification results of different models on different land cover types on the LandCover dataset. The first column is digital orthophoto images containing different categories.
Remotesensing 15 02810 g007
Figure 8. The results of land cover classification on the LandCover dataset for different models. The first column shows digital orthophoto images containing different categories.
Remotesensing 15 02810 g008
Figure 9. The results of land cover classification on the WHDLD dataset for different models. The first column shows digital orthophoto images containing different categories.
Remotesensing 15 02810 g009
Table 1. Structure of the backbone network.
LevelsModulesRepeated TimesOutput BandsOutput Size
L17 × 7 Conv2d1641/2
L2RCA21281/4
L3RCA22561/8
L4CAII35121/16
L5CAII35121/32
Table 2. Ablation experiments using different combinations of modules.
MethodsMIOU (%)
ResNet-1884.462
Backbone85.500
Backbone + SIG86.122
Backbone + SIG + MSF87.432
Table 3. Comparative experimental results on the LandCover dataset (best results are bolded).
MethodsMPA (%)MIOU (%)FWIOU (%)
CVT [50]88.27978.82486.761
DeepLabV3Plus [35]87.71379.26084.421
PAN [57]90.66581.21087.399
ACFNet [55]91.68983.08188.263
OCRNet [52]92.73983.24088.565
PVT [51]91.99883.52087.965
CCNet [56]93.16284.19489.235
DABNet [53]93.31684.44489.112
CGNet [54]93.69285.54689.838
Ours94.56387.43291.103
Table 4. Comparative experimental results on the WHDLD dataset (best results are bolded).
MethodsMPA (%)MIOU (%)FWIOU (%)
CVT69.21955.06276.267
CGNet74.16162.00380.748
PVT74.10562.05681.055
DABNet75.04962.15581.012
PAN75.79662.26781.354
CCNet75.32462.45581.182
ACFNet76.26862.86481.650
DeepLabV3Plus76.06063.44181.982
OCRNet75.80263.56982.291
Ours76.12264.24383.121
Disclaimer/Publisher’s Note: The statements, opinions and data contained in all publications are solely those of the individual author(s) and contributor(s) and not of MDPI and/or the editor(s). MDPI and/or the editor(s) disclaim responsibility for any injury to people or property resulting from any ideas, methods, instructions or products referred to in the content.

