Abstract
Thermal infrared imagery plays an important role in a variety of fields, such as surface temperature inversion and urban heat island effect analysis, but the spatial resolution has severely restricted the potential for further applications. Data fusion is defined as data combination using multiple sensors, and fused information often has better results than when the sensors are used alone. Since multi-resolution analysis is considered an effective method of image fusion, we propose an MTF-GLP-TAM model to combine thermal infrared (30 m) and multispectral (10 m) information of SDGSAT-1. Firstly, the most relevant multispectral bands to the thermal infrared bands are found. Secondly, to obtain better performance, the high-resolution multispectral bands are histogram-matched with each thermal infrared band. Finally, the spatial details of the multispectral bands are injected into the thermal infrared bands with an MTF Gaussian filter and an additive injection model. Despite the lack of spectral overlap between thermal infrared and multispectral bands, the fused image improves the spatial resolution while maintaining the thermal infrared spectral properties as shown by subjective and objective experimental analyses.
1. Introduction
Thermal infrared (TIR) imaging can determine the nature, state, and change patterns of ground objects by measuring the differences in infrared properties reflected or radiated by the ground. In addition to its importance to global energy transformations and sustainable development, it has been extensively researched in the fields of surface temperature inversion, urban heat island effect, forest fire monitoring, prospecting, and geothermal exploration [1,2]. Due to the limitations of remote sensors, the thermal infrared band generally has a coarser spatial resolution than the visible band, which reduces its accuracy. As a result, improving the spatial resolution of thermal infrared images is of great significance and value.
In order to produce synthetic TIR images, TIR images can be fused with reflection bands of higher spatial resolution using image fusion techniques. In most cases, current image fusion methods assume that there is a significant correlation between panchromatic (PAN) and multispectral (MS) images. Data fusion of PAN and MS images has been widely used to create fused images with higher spatial and spectral resolution [3]. Although there are several image fusion methods available for MS and PAN images, only a few in the literature claim to be applicable to TIR and reflection data, for example, pixel block intensity modulation [4], nonlinear transform and multivariate analysis [5], and optimal scaling factor [6]. There are two problems with the current methods: (i) Since the TIR spectral range is far off from the reflectance spectral range, the correlation between TIR and reflectance data is generally weak, resulting in blurred images or significant spectral distortions. (ii) TIR and reflection data fusion models are currently subject to strong subjective influences on parameter selection for different scenes.
Previous research on PAN and MS image fusion methods revealed that multi-resolution analysis (MRA) is widely used due to its high computational efficiency and excellent fusion performance. The MRA method primarily uses wavelet transforms, Laplacian pyramids, etc. The aim is to extract information about spatial structure that is affected by spatial resolution and inject it into the hyperspectral image to enhance its spatial detail. Inspired by this, we propose a Generalized Laplacian Pyramid with Modulation Transfer Function matched filter model to fuse the thermal infrared band (30 m) and multispectral band (10 m) information (MTF-GLP-TAM) of SDGSAT-1. There are three payloads in SDGSAT-1: a thermal infrared spectrometer, a microlight, and a multispectral imager. The synergistic observation performed by these three payloads round the clock provides short-time phase, high-resolution, and high-precision image data for the fine portrayal of human traces, offshore ecology, urban heat island effect, and polar environment. The multispectral imager (MSI) is one of its main optical payloads, containing a total of seven bands, mainly in 380~900 nm, with a spatial resolution of 10 m. The thermal infrared spectrometer (TIS) mainly collects three thermal infrared bands with a spatial resolution of 30 m [7,8,9,10]. The low resolution of images in the thermal infrared band compared with the MS band limits their further application. Thus, it is necessary to integrate SDGSAT-1 MS images with TIS images. It is important to preserve the spatial information of the multispectral bands while maintaining the spectral properties of the three thermal infrared bands in the fused images.
This paper is organized as follows: In Section 2, we review different methods for remote sensing image fusion and analyze the applicability of these methods on thermal infrared and multispectral data fusion. In Section 3, we describe the whole framework of the image fusion algorithm in detail. In Section 4, we compare the results of the proposed method with those of other methods in a comprehensive manner, and we select several scenes to demonstrate its performance after fusion. In Section 5, we discuss the fusion performance of the proposed algorithm on Landsat series satellite images and compare it with those of other advanced algorithms. Finally, Section 6 summarizes the main conclusions.
2. Related Works
Remote sensing image fusion algorithms have a wide range of applications and a variety of data sources [10]. The purpose of this section is to present recent studies relating to the application of TIR and MS fusion algorithms in remote sensing. Furthermore, we present some fusion algorithms between PAN and MS bands to analyze their potential application to thermal infrared data.
In the early days, Liu et al. developed a pixel block intensity modulation (PRIM) method to add spatial details to Landsat Thematic Mapper (TM) thermal band images at 120 m resolution using spatial information in the reflectance spectral band at 30 m resolution [4]. However, the PRIM method can only improve the topographic resolution of thermal images and not the spectral resolution. University of Lausanne researchers have proposed a generalized Bayesian data fusion (BDF) method for improving the spatial resolution of ASTER thermal images [11]. In this method, the variation in support is explicitly taken into account when combining information from the visible and near-infrared (VNIR) bands (15 m and 90 m). The fused image retains the local spectral values of the original image while adding spatial detail from the 15 m VNIR band, but it exhibits local blurring in some areas. In urban areas with spectral and spatial diversity, Landsat TM TIR bands have a spatial resolution of 120 m, which is too coarse to depict surface temperatures. University of York researchers addressed this problem by proposing an algorithm that uses nonlinear transformations and multivariate analysis to fuse 30 m resolution reflectance band data with Landsat TM thermal infrared data [5]. Meanwhile, Seoul National University researchers proposed an effective method to fuse Landsat 8 PAN and TIR images using an optimal scale factor to control the trade-off between spatial detail and thermal information [6,12]. In addition, the authors emphasized that the method can also be used to fuse (1) VNIR and TIR images from ASTER or MODIS data products and (2) PAN and MIR (mid-infrared) images from Kompsat-3A. The optimal scale factor method is, however, subject to subjective factors when setting parameters. The model is not generalizable. Infrared channel data from geostationary meteorological satellites can be used for meteorological research and applications, but their spatial resolution is poor. As a result, Ocean University of China researchers proposed a correction method based on thermophysical properties for fusing geostationary meteorological satellite infrared (4 km) and visible (1 km) images [13]. In spite of this, this method requires high-quality data, which is highly dependent on the solar elevation angle at the time of data acquisition. Chonnam National University researchers investigated an efficient method for fusing Landsat 7 PAN and TIR images using the sparse representation (SR) technique [14]. The missing details of TIR images are estimated using the SR algorithm to enhance their spatial features. However, the optimal parameters for fusion using the SR algorithm are not consistent for different regions. University of Tehran researchers quantitatively and qualitatively evaluated the performance of TIR and PAN band fusion using a wavelet transform and different filters for the Landsat 8 satellite [15]. Several deep learning-based image fusion algorithms also have excellent performance in remote sensing image fusion, since they generally have strong nonlinear mapping capabilities. They require a lot of computational resources and training data, which are not easily accessible in the image fusion field due to the lack of underlying facts. Since all deep learning methods use synthetic data for training, their performance in the fusion of real data from novel satellites is limited [16,17,18].
Based on the above advancements in integrating thermal infrared images with other bands, it is evident that the main difficulties with current methods relate to the preservation of spatial and spectral information, as well as the generality of model parameters. The most studied remote sensing image fusion method is fusing MS images with PAN images accordingly, and this process is called panchromatic sharpening. In pansharpening, MS images are merged with PAN images to achieve the same spectral and spatial resolution as PAN images [19]. The pansharpening method has been applied to many Earth observation satellites, such as IKONOS, QuickBird, GeoEye-1, WorldView-2, and ZiYuan-3, which are capable of acquiring both high-resolution PAN images and low-resolution MS images [20]. Object detection [21], land cover classification [22], and other applications can benefit from high-resolution MS images obtained with fusion. Even though pansharpening is well known, few studies have applied these algorithms to the fusion of thermal infrared and multispectral data. On the one hand, it is because of the long spectral range of both; on the other hand, previous thermal infrared remote sensing instruments have low spatial resolution, for example, 90 m for Terra/ASTER and 100 m for Landsat 8/TIRS; therefore, it is difficult to use classical pansharpening methods directly when spatial enhancement is needed.
Component Substitution (CS) algorithms and multi-resolution analysis (MRA) methods constitute two classical methods in the field of generalized sharpening. The CS approaches are also referred to as spectral methods. They are based on the projection of the original MS image in a transformed domain [23]. This class includes algorithms such as intensity–hue–saturation (IHS) [24], principal component analysis (PCA) [25], and Gram–Schmidt (GS) spectral sharpening [26]. The CS class fusion algorithm exploits the differences between linear combinations of PAN and MS image channels to extract details. However, applying that into TIR and MS bands requires the establishment of a nonlinear synthesis relationship between their two channels, which is hard to achieve. Another method, the multi-resolution analysis (MRA) method, uses spatially invariant linear filters to extract spatial details from high-resolution images and add them to multispectral images [27]. Based on the MRA method, we extracted the spatial details from the MS band and injected them into the three SDGSAT-1 bands. While maintaining the original thermal infrared spectral information, the fused image introduces spatial details to increase thermal spatial resolution.
3. Methodologies
We refined the method based on multi-resolution analysis and applied it to multispectral and thermal infrared remote sensing image fusion. The contribution of multispectral images to the spatial detail of the final fusion product is achieved by calculating the difference between the higher-resolution multispectral images and their low-pass components. The method obtains the spatial details with the multi-scale decomposition of the high-spatial-resolution multispectral images and injects them into the thermal infrared image bands obtained with scaled up-sampling based on the multispectral image size. The main advantages of the fusion technique based on multi-resolution analysis are as follows: (1) good temporal coherence; (2) strong spectral consistency; and (3) robustness to blending under appropriate conditions. The flow chart of our proposed algorithm is shown in Figure 1. Specifically, the fusion algorithm in this paper can be decomposed into the following sequential processes: (1) up-sample the thermal infrared image according to the dimensions of the multispectral image; (2) calculate the low-pass components of the multispectral image with filters for an R-fold sampling ratio; (3) calculate the injection gain; and (4) inject the extracted details.
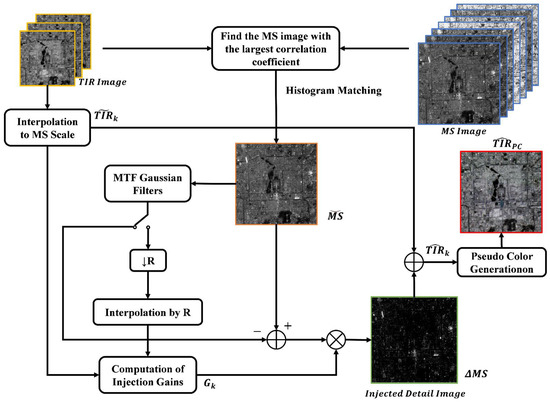
Figure 1.
The entire flow chart of the proposed algorithm, where MS image indicates multispectral image and TIR image indicates thermal infrared image. Circles with a straight or diagonal cross in the middle indicate additive binding or multiplicative injection, respectively.
The thermal infrared image has three bands, which we denote as , where . The multispectral image has seven bands we denote as , where . We find the multispectral band with the maximum correlation coefficient with the thermal infrared band by calculating the correlation number, which we denote as MS. The goal of our algorithm is to inject the high-resolution details from the MS image into the three thermal infrared bands. Accordingly, a formula describing this fusion process is given by Expression (1).
where subscript k (ranging from 1 to B) indicates the spectral band and B is the number of the TIR bands. and are the kth channels of the TIR image up-sampled to the MS size and of the fused product, respectively. indicates the MS details obtained as the difference in MS image and its low resolution version, . The specific formula is shown in (2), where is the result of the histogram matching of MS with each TIR band, as shown in Equation (3). In Equation (3), μ denotes the mean value of the image, and σ denotes the variance. Finally, [·] are the functions that modulate the injection of the MS details into the TIR bands and distinguish, together with the method used for producing .
In fact, Equation (1) is a generalization of the MRA approach, where each band is independently treated. Almost all classical approaches employ a linear function [·], which is obtained through the pointwise multiplication (indicated by ◦) of the MS details by a coefficient matrix . There are different ways for obtaining low-pass component and defining form.
There are usually two types of forms. Global gain coefficients: for all , is a matrix of appropriate size with all elements equal to a fixed constant. This definition is the so-called additive injection scheme. Pixel-level gain coefficients: for all , . In this case, the details are weighted by the ratio between the up-sampled thermal infrared image and the low-pass filtered multispectral image in order to reproduce the local intensity contrast of the multispectral image in the fused image. However, the local intensity contrast in the multispectral image does not reflect the true thermal contrast information, so we use global gain coefficients here.
In this paper, we use the classical MTF-GLP-based model, which is based on MTF Gaussian filters for detail extraction and an additive injection model, where = 1 for each . Therefore, the final fusion equation of the TIR image and the MS image is shown in (5). In order to better show the spectral changes of the three bands of thermal infrared after fusion in the results, its three bands are pseudo-colored according to the RGB channel, and finally, color image is Obtained.
4. Experiment and Results
4.1. Test Data and Fusion Methods for Comparison
The TIR and MS images taken in Shanghai on 8 April 2022 and in Beijing on 3 May 2022 were used as examples to evaluate the fusion algorithm proposed in this paper. Among them, the specific parameter information of TIR and MS images is shown in Table 1. The size of the real thermal infrared image was 336 pixels × 336 pixels, and the size of the corresponding multispectral image was 1008 pixels × 1008 pixels. In the simulation experiments, we triple-down-sampled the TIR and MS images, i.e., we obtained images of size 112 × 112 pixels (90 m resolution) and 336 × 336 pixels (30 m resolution), respectively. After fusion, we obtained 30 m resolution thermal infrared images, which were compared with the real 30 m resolution thermal infrared data before degradation to obtain quantified analysis results.

Table 1.
SDGSAT-1 TIS/MII main technical specifications.
To better illustrate the superiority of the MTF-GLP-TAM model, we applied five other different types of image fusion methods to the test data: Gram–Schmidt (GS) expansion [26]; P + XS [28]; MTF-GLP-HPM [29]; OSF [6]; and SRT [14]. Among them, GS is a typical component replacement method (CS); P + XS is an algorithm for variable classification; and MTF-GLP-HPM is one of the multi-resolution analyses using pixel-level gain coefficients. Because our algorithm is based on the MTF-GLP model and is applied to TIR band images and MS band images, we named our algorithm MTF-GLP-TAM. OSF and SRT are two newer algorithms that have been successfully applied to multi-sensor image fusion for satellites such as KOMPSAT-3A, Landsat7, and Landsat8.
4.2. Evaluation Criteria
The three thermal infrared bands were pseudo-colored after resolution enhancement in order to evaluate the images after fusion using different methods. Using pseudo-colored thermal infrared images, we can better assess the variation in spatial details and spectral distortion in the fused images. In addition, besides the subjective evaluation, we also used some objective quality evaluation indexes to assess the quality of the fused obtained images.
In real datasets without high-resolution TIR images as reference images, fusion performance is usually evaluated at reduced resolution. The evaluation of degraded resolution is based on Wald’s protocol [30]. The original real TIR image is used as the reference image. Then, the low-resolution TIR and MS images obtained by downscaling are used to obtain the fused images using a fusion algorithm. Finally, the fused image is compared with the original TIR image using the quality evaluation index to complete the objective quality evaluation of downscaled resolution. In this thesis, different fusion methods were analyzed objectively and quantitatively at reduced resolution using the commonly used metrics of CC, SAM, RMSE, UIQI, and ERGAS.
- (1)
- Cross Correlation (CC)
CC is a spatial evaluation metric describing the geometric distortion of the fused image and is defined as
where denotes the reference TIR image, denotes the fused sharpened image, denotes the covariance of images and , and and are the standard deviations of and , respectively. The closer the value of CC is to 1, the better the performance of the sharpening algorithm is.
- (2)
- Spectral Angle Mapper (SAM)
The SAM is a spectral quality index defined as
where and represent the spectral vector corresponding to the ith pixel point on images and , respectively, represents the dot product operation between and , and represents the two-parametric operation. It should be noted that the spectral angle distortion of the TIR image is obtained by averaging the spectral angle distortion values of all the pixels on the image. The closer the SAM value is to 0, the smaller the spectral distortion caused by the sharpening algorithm is.
- (3)
- Root Mean Squared Error (RMSE)
The RMSE is used to quantify the amount of distortion for each pixel in the fused image. The root mean square error between the fused image and the reference image is defined as
where λ is the number of pixel points and denotes the number of bands. The value of RMSE is equal to 0 when there is no deviation between the fused image and the reference image.
- (4)
- Relative Dimensionless Global Error In Synthesis (ERGAS)
The ERGAS represents the spatial and spectral differences between the two images of the fused image and the reference image, i.e., a parameter indicating the overall quality of the fused image, and is defined as
where denotes the mean value of the kth band of the reference image and denotes the ratio of the linear resolutions of the MS and TIR images. The closer ERGAS is to 0, the better the performance of the fusion algorithm is.
- (5)
- Universal Image Quality Index (UIQI)
The UIQI is the similarity index for identifying spectral and spatial distortions. The covariance, variance, and the mean values of both the fused and reference images affect the value of the UIQI. Therefore, it is a measure of correlation loss, luminance distortion, and contrast distortion. The closer the value of UIQI is to 1, the better the quality of the fused value image is.
where denotes the reference TIR image; denotes the fused sharpened image, denotes the covariance of images and ; and are the standard deviations of and , respectively; and and are the mean values of and , respectively.
4.3. Simulation Data Experiment
The results of the different fusion algorithms tested on the simulated data are shown in Figure 2, Figure 3, Figure 4 and Figure 5. Four different groups of scenes were selected for the experiment: ports, residential areas, airports, and mountains. The large image on the left is the TIR triple-band pseudo-color image used as the reference image. The small image on the right is a zoomed-in view of the local details within the red and green boxes. The images below the red- and green-boxed vignettes on the right are the results of the difference between the corresponding regions and the GT images. GT indicates the original 30 m resolution thermal infrared band image, which we used as the reference image. The spectral distortion caused by the GS algorithm was particularly noticeable compared with the reference image, as its fusion resulted in a larger color difference from the reference image. Compared with the GS algorithm, the PX+S algorithm showed some improvement in spectral fidelity, but the spatial quality was still not satisfactory. The a priori assumptions of the PX+S algorithm are not applicable to the problem of TIR image and MS image fusion, so the final fused image did not obtain better results. MTF-GLP-HPM was similar to the method in this paper in terms of fusion results, and both are essentially MRA methods. The main difference is that the former adopts a multiplicative injection scheme to reproduce the local intensity contrast of the MS image in the fused image. However, the multiplicative injection scheme produced some distorted details when applied to TIR image fusion, such as the black area in the lower right corner of the red box in Figure 3. The algorithms based on OSF and SRT fused images with clearer ground details, but their retention of thermal infrared spectral properties was low. Moreover, due to the inconsistency of this method for different scene parameters, the performance of its algorithm was very unstable, which we are able to see from the data of the airport in Figure 4.
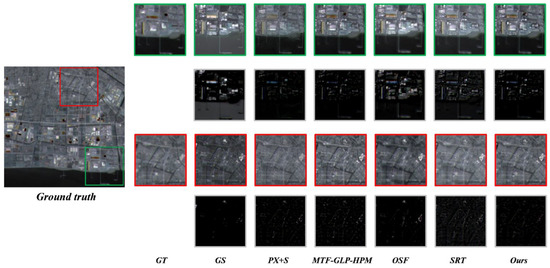
Figure 2.
Comparison of fusion results of different algorithms on simulation data (the original image was taken in Shanghai on 8 April 2022; scene: port).
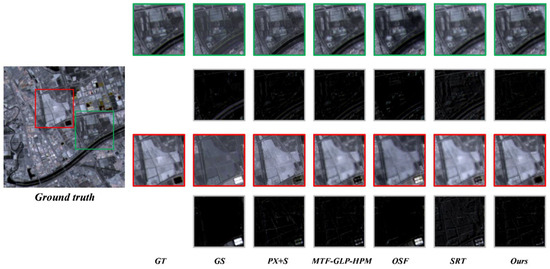
Figure 3.
Comparison of fusion results of different algorithms on simulation data (the original image was taken in Beijing on 3 May 2022; scene: residential area).
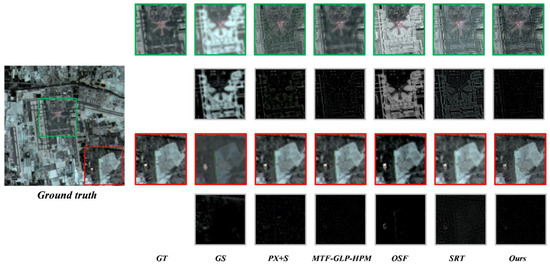
Figure 4.
Comparison of fusion results of different algorithms on simulation data (the original image was taken in Beijing on 3 May 2022; scene: airport).
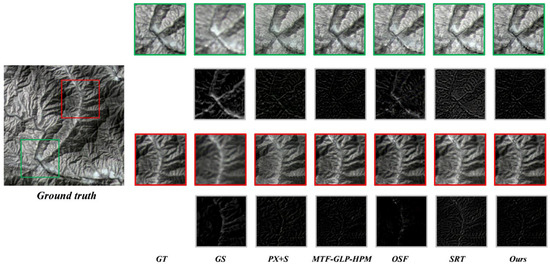
Figure 5.
Comparison of fusion results of different algorithms on simulation data (the original image was taken in Beijing on 3 May 2022; scene: mountains).
Table 2 gives the objective quality evaluation metrics of the algorithm used in this paper and the other five different classes of fusion algorithms at reduced quality resolution. Consistent with the subjective analysis, the results of the evaluation metrics show that the performance of the GS algorithm was much lower than those of the other four. The performance of the two MRA-based algorithms was similar and better than that of the algorithm with variable classification. The OSF and SRT algorithms had better performance in the mountain data. Their poor performance in the airport data confirmed the lack of scene generalization due to the uncertainty of the parameters. Overall, the methods used in this paper basically achieved optimal values for all quality evaluation metrics. This further demonstrates that the MTF-GLP-TAM algorithm used in this paper can obtain a trade-off between good spectral fidelity and spatial clarity when fusing TIR images and MS images. To better illustrate the universality of our algorithm, we selected 36 scenes covering different time periods. Since the RMSE provides the standard error between the fused image and the reference image, it is measurable that the fused image contains spatial and spectral distortion, which usually matches the visual evaluation results. We plotted RMSE for different algorithms, and the results are shown in Figure 6. We can see from the figure that the RMSE of the method proposed in this paper was minimal in most scenarios.
Table 2.
Objective evaluation indexes of the method in this paper and several advanced fusion algorithms.
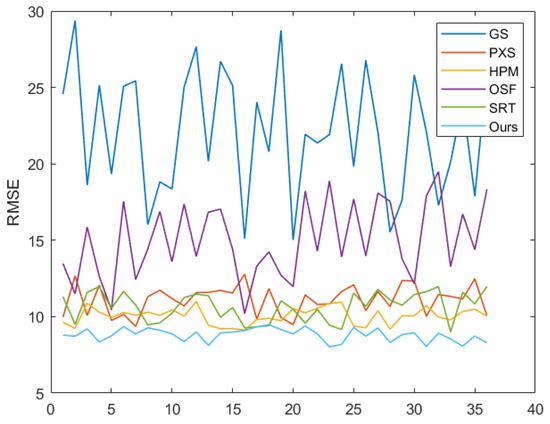
Figure 6.
Comparison of RMSE results of different algorithms on simulation data.
4.4. Real-Data Experiment
Figure 7, Figure 8, Figure 9 and Figure 10 show the fusion results of different fusion algorithms on real data. The large image on the left side shows the multispectral grayscale image used for fusion. The small images on the right side show the local details of the different algorithms after fusion. For better visual comparison before and after fusion, we used the result after the triple interpolation of the TIR image using bilinear interpolation as the reference image. The result of the up-sampling of the thermal infrared image using bilinear interpolation is the initial input of the thermal infrared image before fusion. This simpler interpolation does not introduce additional spatial information and is more reflective of the increased ground detail in the fused image by making comparisons. By observing the local details, we could find that the fused images are more informative, such as some details of the ground buildings in Figure 7 and the textures on the airport tracks in Figure 8. The GS and OSF algorithms could maintain high spatial performance, but their fused images all had spectral distortion. The PX+S algorithm could maintain good spectral performance, but the fused images had obvious blurring. The algorithm proposed in this paper provided the best visual results among all the fusion algorithms compared.
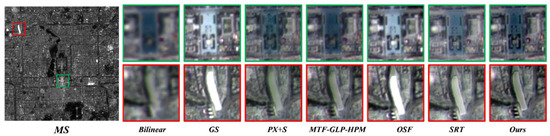
Figure 7.
The results of different fusion methods for the Forbidden City area in Beijing are shown.
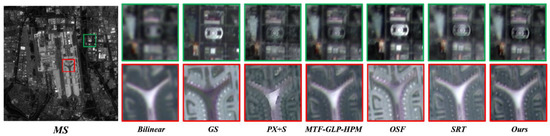
Figure 8.
The results of different fusion methods for Beijing Capital International Airport are shown.
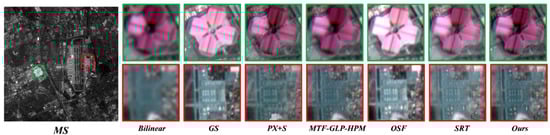
Figure 9.
The results of different fusion methods for Shanghai Hongqiao Airport are shown.
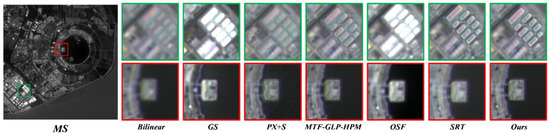
Figure 10.
The results of different fusion methods are shown for the Dripping Lake area in Shanghai.
5. Discussion
In this section, the application of our proposed algorithm on other satellites is discussed, and two advanced multi-sensor fusion algorithms are selected for visual comparison. The results of the experiments are shown in Figure 11, Figure 12 and Figure 13, where Figure 11a shows the thermal infrared data taken by the Landsat8 TIRS payload and Figure 11b shows the panchromatic band data taken by the OLI payload; Figure 12a and Figure 13a show the thermal infrared data taken by the Landsat9 TIRS payload, and Figure 12a and Figure 13b show the panchromatic band data taken by the OLI payload; and Figure 11c–e, Figure 12c–e and Figure 13c–e show the fusion results of OSF, SRT, and our proposed algorithm, respectively. The OSF algorithm has been successfully applied to Landsat8 and KOMPSAT-3A satellites, and it controls the trade-off between spatial details and thermal information through the optimal scaling factor. The SRT algorithm is mainly applied to Landsat7 satellites, and it mainly uses the sparse representation technique for the fusion of panchromatic and thermal infrared bands. From the experimental results, we could see that the OSF fusion algorithm had clearer ground details, but it had poorer retention of the spectral properties of the thermal infrared bands, such as the circular building in Figure 11 and the airport runway in Figure 13. This approach controls the trade-off between spatial detail and thermal information by introducing a scaling factor, with the disadvantage that its optimal scale factor needs to be re-estimated for each set of images. For different scenarios, the optimal value changes. However, it has better performance in specific application scenarios, for example, when more spatial details are needed for military applications of remote sensing, which can be achieved by increasing the scale factor. The SRT fusion algorithm results was visually close to that of our proposed algorithm, but using the SRT algorithm requires human judgment of the best fusion parameters for each scene. In addition, we calculated some statistics of the grayscale values of thermal infrared images before and after fusion, mainly including the maximum value, minimum value, mean value, and standard deviation, and the results are shown in Table 3.
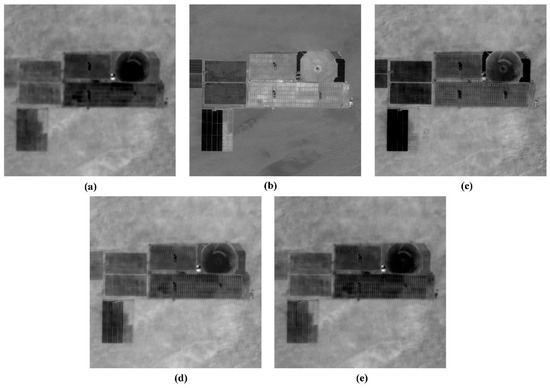
Figure 11.
Experimental results of different fusion algorithms on Landsat8 data: (a) Landsat8 thermal infrared band image resolution of 100 m; (b) Landsat8 panchromatic band image resolution of 15 m; (c) fusion results of OSF algorithm; (d) fusion results of SRT algorithm; (e) experimental results of our proposed algorithm.
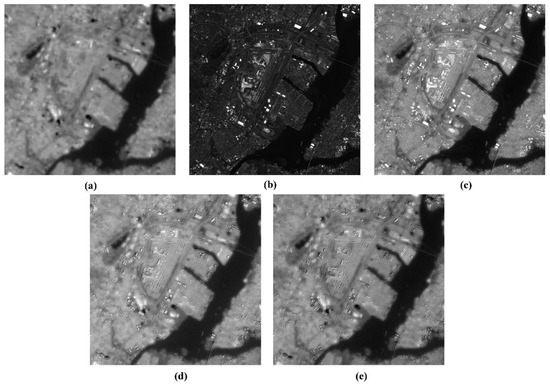
Figure 12.
Experimental results of different fusion algorithms on Landsat9 data: (a) Landsat9 thermal infrared band image resolution of 100 m; (b) Landsat9 panchromatic band image resolution of 15 m; (c) fusion results of OSF algorithm; (d) fusion results of SRT algorithm; (e) experimental results of our proposed algorithm.
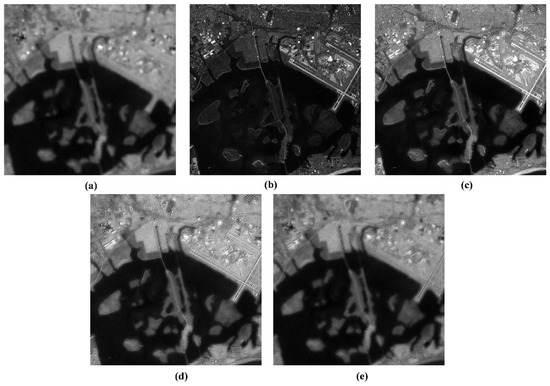
Figure 13.
Experimental results of different fusion algorithms on Landsat9 data: (a) Landsat9 thermal infrared band image resolution of 100 m; (b) Landsat9 panchromatic band image resolution of 15 m; (c) fusion results of OSF algorithm; (d) fusion results of SRT algorithm; (e) experimental results of our proposed algorithm.
Table 3.
Summary of some statistics of thermal infrared images before and after fusion.
Overall, the method proposed in this paper achieved the best results in terms of both subjective visual evaluation and some objective statistical measures of metrics. This excellent performance was achieved thanks to the contribution of multispectral images to the spatial detail of the final fusion results performed by calculating the difference between the high-resolution images and their low-pass components. The difference among the successive orders of the Gaussian pyramid that we employ defines the Laplacian pyramid. The Gaussian filter can be tuned to simulate the sensor modulation transfer function by adjusting the Nyquist frequency. This facilitates the extraction of details from high-resolution images that cannot be captured by thermal infrared sensors due to their low spatial resolution and can effectively improve the performance of the fusion algorithm. In this case, the only parameter characterizing the entire distribution is the standard deviation of the Gaussian distribution, which is determined using sensor-based information (usually the amplitude response value at the Nyquist frequency provided by the manufacturer or using in-orbit measurements).
Using this image fusion method, the thermal infrared band can be improved from 30 m resolution to 10 m resolution. Higher spatial resolution thermal infrared remote sensing can better solve many practical environmental problems. Thermal details can be obtained with 10 m resolution in surface temperature inversion. We can fuse images to finely portray the spatial distribution of high-energy sites and residence types in urban areas. The method can also be applied to detect the precise movement conditions of volcanic lava, the radioactive exposure of nuclear power plants, and land cover classification, among others.
6. Conclusions
Thermal infrared images record radiometric information radiated from features that is invisible to the naked eye and use this information to identify features and invert surface parameters (e.g., temperature, emissivity, etc.). However, the low spatial resolution severely limits its potential applications. Image fusion techniques can be used to fuse TIR images with higher spatial resolution reflectance bands to produce synthetic TIR images. The multi-sensor fusion of MS and TIR images is a good example of improved observability. In this paper, a fusion algorithm based on the MTF-GLP model is proposed for fusing TIR images of SDGSAT-1 with MS images. The fusion method was experimented on real images and simulated images with three-fold degradation in spatial resolution. Compared with the existing image fusion methods, the synthesized TIR images performed better in visualization and did not suffer from spectral distortion anymore. The proposed method in this paper achieved optimal performance in the quantitative evaluation metrics such as CC, SAM, RMSE, UIQI, and ERGAS. Finally, we successfully applied the algorithm to the fusion of thermal infrared data from Landsat series satellites with panchromatic band data, and we obtained better results in visual evaluation compared with several advanced fusion algorithms.
Author Contributions
Conceptualization, L.Q. and X.Z.; methodology, L.Q.; software, L.Q.; validation, L.Q. and X.N; investigation, X.N.; resources, Z.H. and F.C.; data curation, Z.H. and F.C.; writing—original draft preparation, L.Q.; writing—review and editing, L.Q.; visualization, X.Z.; supervision, L.Q.; project administration, Z.H. and F.C.; funding acquisition, Z.H. and F.C. All authors have read and agreed to the published version of the manuscript.
Funding
This research was funded by Strategic Priority Research Program of the Chinese Academy of Sciences (grant number XDA19010102) and National Natural Science Foundation of China (grant number 61975222).
Institutional Review Board Statement
Not applicable.
Informed Consent Statement
Not applicable.
Data Availability Statement
Not applicable.
Acknowledgments
The authors would like to thank SDG BIG DATA Center and National Space Science Center for providing us with the data.
Conflicts of Interest
The authors declare no conflict of interest.
References
- Chen, H.; Xie, X.; Liu, E.; Zhou, L.; Yan, L. Application of Infrared Remote Sensing and Magnetotelluric Technology in Geothermal Resource Exploration: A Case Study of the Wuerhe Area, Xinjiang. Remote Sens. 2021, 13, 4989. [Google Scholar] [CrossRef]
- Zhou, D.; Xiao, J.; Bonafoni, S.; Berger, C.; Deilami, K.; Zhou, Y.; Frolking, S.; Yao, R.; Qiao, Z.; Sobrino, J.A. Satellite re-mote sensing of surface urban heat islands: Progress, challenges, and perspectives. Remote Sens. 2018, 11, 48. [Google Scholar] [CrossRef]
- Scarpa, G.; Ciotola, M. Full-resolution quality assessment for pansharpening. Remote Sens. 2022, 14, 1808. [Google Scholar] [CrossRef]
- Guo, L.J.; Moore, J.M.M. Pixel block intensity modulation: Adding spatial detail to TM band 6 thermal imagery. Int. J. Remote Sens. 1998, 19, 2477–2491. [Google Scholar] [CrossRef]
- Jing, L.; Cheng, Q. A technique based on non-linear transform and multivariate analysis to merge thermal infrared data and higher-resolution multispectral data. Int. J. Remote Sens. 2010, 31, 6459–6471. [Google Scholar] [CrossRef]
- Oh, K.-Y.; Jung, H.-S.; Park, S.-H.; Lee, K.-J. Spatial Sharpening of KOMPSAT-3A MIR Images Using Optimal Scaling Factor. Remote Sens. 2020, 12, 3772. [Google Scholar] [CrossRef]
- Chen, F.; Hu, X.; Li, X.; Yang, L.; Hu, X.; Zhang, Y. Invited research paper on wide-format high-resolution thermal infrared remote sensing imaging technology. China Laser 2021, 48, 1210002. [Google Scholar]
- Hu, Z.; Zhu, M.; Wang, Q.; Su, X.; Chen, F. SDGSAT-1 TIS Prelaunch Radiometric Calibration and Performance. Remote Sens. 2022, 14, 4543. [Google Scholar] [CrossRef]
- Qi, L.; Li, L.; Ni, X.; Chen, F. On-Orbit Spatial Quality Evaluation of SDGSAT-1 Thermal Infrared Spectrometer. IEEE Geosci. Remote Sens. Lett. 2022, 19, 7507505. [Google Scholar] [CrossRef]
- Ghassemian, H. A review of remote sensing image fusion methods. Inf. Fusion 2016, 32, 75–89. [Google Scholar] [CrossRef]
- Fasbender, D.; Tuia, D.; Bogaert, P.; Kanevski, M. Support-based implementation of Bayesian data fusion for spatial en-hancement: Applications to ASTER thermal images. IEEE Geosci. Remote Sens. Lett. 2008, 5, 598–602. [Google Scholar] [CrossRef]
- Jung, H.-S.; Park, S.-W. Multi-sensor fusion of Landsat 8 thermal infrared (TIR) and panchromatic (PAN) images. Sensors 2014, 14, 24425–24440. [Google Scholar] [CrossRef] [PubMed]
- Han, L.; Shi, L.; Yang, Y.; Song, D. Thermal physical property-based fusion of geostationary meteorological satellite visi-ble and infrared channel images. Sensors 2014, 14, 10187–10202. [Google Scholar] [CrossRef] [PubMed]
- Jin, H.S.; Han, D. Multisensor fusion of Landsat images for high-resolution thermal infrared images using sparse repre-sentations. Math. Probl. Eng. 2017, 2017, 2048098. [Google Scholar] [CrossRef]
- Ahrari, A.; Kiavarz, M.; Hasanlou, M.; Marofi, M. Thermal and Visible Satellite Image Fusion Using Wavelet in Remote Sensing and Satellite Image Processing. Int. Arch. Photogramm. Remote Sens. Spat. Inf. Sci. 2017, 42, 11–15. [Google Scholar] [CrossRef]
- Chen, Y.; Shi, K.; Ge, Y.; Zhou, Y.N. Spatiotemporal remote sensing image fusion using multiscale two-stream convolutional neural networks. IEEE Trans. Geosci. Remote Sens. 2021, 60, 4402112. [Google Scholar] [CrossRef]
- Pan, Y.; Pi, D.; Chen, J.; Meng, H. FDPPGAN: Remote sensing image fusion based on deep perceptual patchGAN. Neural Comput. Appl. 2021, 33, 9589–9605. [Google Scholar] [CrossRef]
- Azarang, A.; Kehtarnavaz, N. Image fusion in remote sensing: Conventional and deep learning approaches. Synth. Lect. Image Video Multimed. Process. 2021, 10, 1–93. [Google Scholar]
- Vivone, G.; Alparone, L.; Chanussot, J.; Dalla Mura, M.; Garzelli, A.; Licciardi, G.A.; Restaino, R.; Wald, L. A critical comparison among pansharpening algorithms. IEEE Trans. Geosci. Remote Sens. 2014, 53, 2565–2586. [Google Scholar] [CrossRef]
- Xu, Q.; Zhang, Y.; Li, B. Recent advances in pansharpening and key problems in applications. Int. J. Image Data Fusion 2014, 5, 175–195. [Google Scholar] [CrossRef]
- Filippidis, A.; Jain, L.C.; Martin, N. Multisensor data fusion for surface land-mine detection. IEEE Trans. Syst. Man Cybern. Part C (Appl. Rev.) 2000, 30, 145–150. [Google Scholar] [CrossRef]
- Huang, P.S.; Tu, T.M. A target fusion-based approach for classifying high spatial resolution imagery. In Proceedings of the IEEE Workshop on Advances in Techniques for Analysis of Remotely Sensed Data, Greenbelt, MD, USA, 27–28 October 2003; pp. 175–181. [Google Scholar]
- Vivone, G.; Dalla Mura, M.; Garzelli, A.; Restaino, R.; Scarpa, G.; Ulfarsson, M.O.; Alparone, L.; Chanussot, J. A new benchmark based on recent advances in multispectral pansharpening: Revisiting pansharpening with classical and emerging pansharpening methods. IEEE Geosci. Remote Sens. Mag. 2020, 9, 53–81. [Google Scholar] [CrossRef]
- Chavez, P.; Sides, S.C.; Anderson, J.A. Comparison of three different methods to merge multiresolution and multispec-tral data- Landsat TM and SPOT panchromatic. Photogramm. Eng. Remote Sens. 1991, 57, 295–303. [Google Scholar]
- Shah, V.P.; Younan, N.H.; King, R.L. An efficient pan-sharpening method via a combined adaptive PCA approach and contourlets. IEEE Trans. Geosci. Remote Sens. 2008, 46, 1323–1335. [Google Scholar] [CrossRef]
- Laben, C.A.; Brower, B.V. Process for Enhancing the Spatial Resolution of Multispectral Imagery Using Pan-Sharpening. U.S. Patent 6,011,875, 4 January 2000. [Google Scholar]
- Aiazzi, B.; Alparone, L.; Baronti, S.; Selva, M. Twenty-five years of pansharpening. In Signal and Image Processing for Remote Sensing; CRC Press: Boca Raton, FL, USA, 2012; pp. 533–548. [Google Scholar]
- Ballester, C.; Caselles, V.; Igual, L.; Verdera, J.; Rougé, B. A variational model for P+ XS image fusion. Int. J. Comput. Vis. 2006, 69, 43–58. [Google Scholar] [CrossRef]
- Vivone, G.; Restaino, R.; Dalla Mura, M.; Licciardi, G.; Chanussot, J. Contrast and error-based fusion schemes for multi-spectral image pansharpening. IEEE Geosci. Remote Sens. Lett. 2013, 11, 930–934. [Google Scholar] [CrossRef]
- Wald, L.; Ranchin, T.; Mangolini, M. Fusion of satellite images of different spatial resolutions: Assessing the quality of resulting images. Photogramm. Eng. Remote Sens. 1997, 63, 691–699. [Google Scholar]
Publisher’s Note: MDPI stays neutral with regard to jurisdictional claims in published maps and institutional affiliations. |
© 2022 by the authors. Licensee MDPI, Basel, Switzerland. This article is an open access article distributed under the terms and conditions of the Creative Commons Attribution (CC BY) license (https://creativecommons.org/licenses/by/4.0/).